Occurrence of Phytophthora species in soils, and ...
43
Southern Swedish Forest Research Centre Occurrence of Phytophthora species in soils, and functional analysis of soil microbiomes on Biolog EcoPlates - A study on commercial soils, and forest and urban soils Catharina Schmidt Master thesis • 30 credits EUROFORESTER Master Thesis no. 327 Alnarp 2020
Transcript of Occurrence of Phytophthora species in soils, and ...

Southern Swedish Forest Research Centre
Occurrence of Phytophthora species in soils, and functional analysis of soil microbiomes on Biolog EcoPlates - A study on commercial soils, and forest and urban soils
Catharina Schmidt
Master thesis • 30 credits EUROFORESTER Master Thesis no. 327 Alnarp 2020


Occurrence of Phytophthora species in soils, and functional analysis of soil microbiomes on Biolog EcoPlates - A study on commercial soils, and forest and urban soils
Catharina Schmidt
Supervisor: Johanna Witzell, SLU, Southern Swedish Forest Research Centre Examiner: Henrik Böhlenius, SLU, Southern Swedish Forest Research Centre
Credits: 30 credits Level: Advanced level A2E Course title: Master thesis in Forest Science Course code: EX0928 Programme/education: Euroforester Master Program SM001 Course coordinating department: Southern Swedish Forest Research Centre
Place of publication: Alnarp Year of publication: 2020 Cover picture: Johanna Witzell Online publication: https://stud.epsilon.slu.se
Keywords: Phytophthora, Fagus sylvatica, Quercus robur, soils, Biolog EcoPlates, metabolic diversity
Swedish University of Agricultural Sciences Faculty of Forest Sciences Southern Swedish Research Centre

3
Abstract
Tree pathogenic Phytophthora species have been identified as a threat to health and stability of
forests und urban trees. In Sweden most Phytophthora species are non-native and potentially invasive,
and thus it is important to control their spread. To identify the presence of Phytophthora species in
soil from symptomatic forest stands, urban trees and commercial soils, laboratory analyses using a
polymerase chain reaction (PCR) with the internal transcript spacers (ITS) pair ITS1oo/ITS4 were
conducted. The results revealed that Phytophthora cambivora was present across all habitats and in
commercial soils. Furthermore, P. plurivora was detected in one soil sample from an urban area.
Indications of other Phytophthora species were found as well but could not be confirmed on species
level. The results suggest that Phytophthora are widely present in southern Sweden and provide new
evidence that commercial soil can be an important pathway spreading these pathogens. Biolog
EcoPlate (Biolog, Inc., Hayward, CA, USA) is a tool recently developed for characterization of functional
aspects (enzymatic capacity) in soil microbial communities and were used to study a subset of soil
samples. Four soil samples from forests and one from an urban area were used. Clear patterns to
categorize the soil microbial activity in different habitats were not detected, which is likely to be due
to the low number of biological replicates. The test illustrates the apparent heterogeneity of soil as a
substrate and underlines the importance of adequate number of replicates across habitats and the
need to take care of standardized sampling and implementation of the method.
Key words: Phytophthora, Fagus sylvatica, Quercus robur, soils, Biolog EcoPlates, Metabolic diversity

4
Table of contents
Abstract ................................................................................................................................................... 3
Table of contents .................................................................................................................................... 4
List of Figures .......................................................................................................................................... 5
List of Tables ........................................................................................................................................... 5
Abbreviations .......................................................................................................................................... 6
1. Introduction .................................................................................................................................... 7
1.1 Introduced forest pathogens – a threat to production and biodiversity ................................ 7
1.2.1 Phytophthora species – biology and impacts ........................................................................ 7
1.2.2 Pathways of spreading ......................................................................................................... 10
1.3 Methods to study soil microbiome ............................................................................................. 11
1.3.1 Molecular methods .............................................................................................................. 11
1.3.2 Functional analysis of soil microbiome ................................................................................ 11
1.4 Aim of the study .......................................................................................................................... 12
2. Material & Method ....................................................................................................................... 13
2.1 Soil samples ........................................................................................................................... 13
2.2 Laboratory analyses .............................................................................................................. 15
2.2.1 DNA analysis to detect Phytophthora .................................................................................. 15
2.3.2 Soil microbial community profiling using Biolog EcoPlates ................................................. 15
2.4 Data analysis ............................................................................................................................... 16
2.4.1 Identification of sequences .................................................................................................. 16
2.4.2 Functional analysis of soil microbiome .................................................................................... 16
3 Results ........................................................................................................................................... 18
3.1 DNA analysis .......................................................................................................................... 18
3.2 Soil microbial community profiling ....................................................................................... 19
4. Discussion ...................................................................................................................................... 26
4.1 Occurrence of Phytophthora in soil samples ........................................................................ 26
4.1.2 Limitations of the analysis ................................................................................................... 27
4.2 Soil microbial community profiling ....................................................................................... 28
5. Conclusions ................................................................................................................................... 30
6. Acknowledgements ....................................................................................................................... 31
References ............................................................................................................................................ 32
Appendix ............................................................................................................................................... 38

5
List of Figures
Figure 1: Symptoms of Phytophthora infection on European beech. Photo: Johanna Witzell
Figure 2: Sampling areas in Halland county and Gothenburg, urban soil (U), oak forest (FO) and beech forest (FB)
Figure 3: Operational taxonomic units (OTU) identified on Phytophthora species grouped by soil samples. All OTUs were classified as P. cambivora, except for OTU 4897 which was classified as P. plurivora. Samples are taken from commercial soils (C), Urban soil (U), oak forest (FO) and beech forest (FB).
Figure 4: Number of samples with OTUs attributed to Phytophthora cambivora and the Phytophthora plurivora
Figure 5: Mean values of average well colour development (AWCD) of five different samples (three technical replicates) on Biolog EcoPlates based on 96 h of incubation. Soil samples are obtained from oak forest, beech forest and one soil sample from an urban area.
Figure 6: Mean utilization and SD (three technical replicates) of different carbon groups by soil sample microbes based on 96-h incubation measured as OD590 nm. Soil samples are obtained from oak forest, beech forest and one urban area.
Figure 7: Average well colour development (AWCD) of nine carbon sources from three different carbon groups related to plant root exudes. Five samples (three technical replicates) were used. Soil samples are obtained from oak forest, beech forest and one soil sample from an urban area.
Figure 8: Number of utilized substrates by different samples showing the mean number of carbon sources (three technical replicates) for which the optical density was at least 0,1784. Soil samples were obtained from oak forest, beech forest and one urban area.
Figure 9: Shannon diversity patterns from different samples (three technical replicate) on Biolog EcoPlate. Soil samples were obtained from oak forest, beech forest and one soil sample from an urban area.
Figure 10: Pattern of evenness (E) of substrates utilization of different samples (three technical replicates). Samples were obtained from oak forest, beech forest and one an urban area.
List of Tables
Table 1: Information about soil samples.
Table 2: Carbon sources on EcoPlates reproduced after Chazarenc et al. (2010).

6
Abbreviations
AWCD Average Well Colour Development C Celsius E Evenness Fig Figure FW Fresh weight h hours H’ Shannon Diversity Index ITS Internal Transcript Spacer ml millilitre nm nanometre OD Optical Density OUT Operational taxonomic unit R Richness PCR Polymerase Chain Reaction RPM Revolutions per minute SD Standard deviation T Time Tab Table

7
1. Introduction
1.1 Introduced forest pathogens – a threat to production and biodiversity
Most pathogenic effects on trees are caused by viruses, phytoplasmas, bacteria, fungi, fungal-like
organisms, parasitic plants and nematodes (Gonthier & Nicolotti, 2013). Forest pathogens are
ecologically important for dead wood and nutrient cycling but can also be great threats to forest
ecosystems and are a major cause of timber and growth loss (Edmonds, 2013). The degree of virulence
of the pathogen, susceptibility of the plant and a favourable environment for the pathogen determine
the severity of the disease (Agrios, 2005). Host plants that have evolved with a pathogen have
developed defence mechanisms and in these cases the pathogen’s impacts are negligible. If, however,
a pathogen is introduced to another environment it may suddenly become destructive and invasive
(Brasier, 2008; Edmonds, 2013). The management of these alien pathogens is often challenging
because of limited knowledge of the interaction between the pathogen and the host plant (Pautasso,
2013). Some of the most devastating invasive forest pathogens belong to the genus Phytophthora.
Two common and aggressive species are Phytophthora cinnamomi (RANDS), destroying many wooden
species in warm environments, and Phytophthora ramorum (WERRES, DE COCK & MAN IN'T VELD), well
known through the sudden oak death. Both pathogens are generalists which makes them very
successful (Oliva et al., 2013; Hansen, 2015).
1.2.1 Phytophthora species – biology and impacts
Phytophthora is an oomycete genus belonging to the kingdom Straminopiles, making them related to
diatoms and seaweeds (Thines, 2014). The name Phytophthora derives from the Greek words φυτόν
(phytón), "plant" and φθορά (phthorá) "destruction", which means "the plant-destroyer”. Estimations
show that Phytophthora is responsible for more than 66 % of all fine root diseases and for 90 % of all
collar rots of woody plants (Jung et al., 2016). Most famous is Phytophthora for its role in the Irish
potato famine (Ribeiro, 2013). In Europe important broadleaf species, as European beech (Fagus
sylvatica L.) and Quercus spp. are threatened by several Phytophthora species (Jung et al., 2013b).
With more than a hundred known species and continuous discovery of new species, Phytophthora is
a massive threat to crops and ecosystems (Kroon et al., 2012).

8
Phytophthora species can grow filamentously and spread through spores like fungi (Hansen, 2015).
Nevertheless, Oomycetes differ from true fungi in several ways. For instance, they are diploid and
have cellulose as major glucan instead of chitin in their cell walls (Bartnicki-Garcia, 1968; Judelson &
Blanco, 2005). However, the main reason for the distinction is that Phytophthora species produce
zoospores, dispersal spores that are mobile in water because they are equipped with two flagella,
which is a key feature of the kingdom Straminopiles (Dick, 2001). Zoospores are asexual spores
released from specific, spore-forming enclosures called sporangia, and are very successful in
colonizing new plants because of their movability (Judelson & Blanco, 2005). By rapidly moving
through water and moist soils, they can reach new hosts (Hansen, 2015). Zoospores detect the host
tissue through chemotaxis to often non-specific root exudates (Tyler, 2001). Afterwards the zoospores
encyst, immediately germinate and hyphae start growing intercellular and later intracellular into the
plant (Judelson & Blanco, 2005; Oßwald et al., 2014). While the zoospores only live for a short time,
Phytophthora species also produce resting spores, sexual oospores and asexual chlamydospores,
which in contrast have thick cell walls with a chemical composition allowing them to endure microbial
attacks and unfavourable conditions for several years (Judelson & Blanco, 2005; Jung et al., 2013a).
Most Phytophthora species are soilborne and they commonly infect a host through fine roots (Oßwald
et al., 2014). Phytophthora is hemibiotrophic, meaning that they are parasites on living tissue in the
beginning and continue to utilize the dead tissue (Oßwald et al., 2014) Because of the complex biology
and good adaptation to life as a plant pathogen, the control and management of Phytophthora
diseases is a challenging task.
Since the 1990s, the number of introduced alien oomycetes in Europe has tripled and these pathogens
cause increasing harm on several important broadleaf species (Jung et al., 2013b; Satini et al.,2013).
Most important declines and diebacks caused by Phytophthora in Europe are beech decline, oak
decline, root and collar rot epidemic of alders and ink disease of chestnut (Castanea sativa MILL) (Jung
et al., 2013b). The first symptoms are usually crown dieback, yellowish foliage and deterioration of
crown structure through stunted growth which indicates problems with the fine root system. Further
signs are bleeding cankers at the outer and orange-brown necrosis of the inner bark (Jung, 2009) (Fig.
1). Infestation is often triggered by external conditions such as excessive rainfalls and flooding as well
as droughts (Jung, 2009).

9
Figure 1: Symptoms of Phytophthora infection on European beech. Photo: Johanna Witzell

10
During the past years, Phytophthora species which are causing declines and diebacks have also been
increasingly found in Southern Swedish broadleaf trees and forest stands of European beech and
pedunculate oak (Quercus robur L.) (Jönsson, et al. 2003; Jung et al., 2013b) as well as in nurseries
(Redondo et al., 2018). In Sweden Phytophthora quercina (TJUNG), Phytophthora cactorum (LEBERT &
COHN) J. SCHRÖT and Phytophthora cambivora (PETRI) BUISMAN could be found in declining Pedunculate
oak stands. A study in Southern Sweden shows that oak stands with P. quercina in the soil are more
likely to decline (Jönsson et al., 2005). Furthermore, P. cactorum, P. cambivora, Phytophthora
gonapodyides (PETERSEN) BUISMAN, Phytophthora plurivora (JUNG & BURGESS) and Phytophthora
syringae (KLEBAHN) were found in beech dominated urban forest setting in southern Skåne (Blomquist,
2016). Further experiments have shown that P. cactorum and P. cambivora and P. plurivora can cause
stem lesions on inoculated beech and oak seedlings (Cleary et al., 2016). However, little is still known
about the pathways of their spreading and factors affecting their establishment in forests.
1.2.2 Pathways of spreading
Through intensified international trade and transports, the risk of spreading invasive Phytophthora
species has increased because infected plants and pathogen contaminated soils are moved at an
unprecedented rate and on global scale. Furthermore, climate change may have an influence on the
interaction between hosts and pathogens (La Porta et al., 2008), possibly facilitating establishments
of thermophilic Phytophthora species also in the northern parts of Europe. Pathogens may also
naturally extend their range in the new climate, and host plants may become more susceptible due to
abiotic stress (Sturrock et al., 2011). From 14th of December 2019 most plants need a phytosanitary
certificate to enter the European Union (EU) and a plant passport for travel within the EU (Regulation
(EU) 2016/2031). However, pathogens easily escape the border controls, because infections are not
easily detected. In the spreading of Phytophthora, nurseries have been suggested to have a key
position (Jung et al. 2016). Numerous nurseries in central Europe have been found to be infested by
several Phytophthora species such as P. cactorum and P. cambivorum (Jung, 2009; Santini et al., 2013;
Jung et al. 2015). Frequent planting of ornamental trees from large international nurseries in gardens,
urban forests and parks increases the risk of spread in urban areas. From there Phytophthora can be
spread by humans, animals or water into natural forests (Redondo et al., 2018). Several Phytophthora
species that cause damage on forest trees are soilborne, which makes soil an important pathway for
the spread of Phytophthora (Oßwald et al., 2014). By collecting soil and leaf litter form walkers’ boots
it was shown that over 30 % of the samples were infected with Phytophthora (Webber & Rose, 2008).
Infestation of commercial soils could be an important pathway for the spread of Phytophthora, for
instance because ornamental plants are sold with the planting soil. It is common to throw garden

11
debris into the forest, and the usage of infested soil in nurseries, followed up by planting infested
seedlings in the forest may also be a potential pathway of spreading. However, we know little about
the presence of Phytophthora infestation in commercial soils.
Soil is, however, not only interesting as a medium for the spread of pathogens but also in terms of the
potential of soil microorganisms in promoting tree health and supressing the pathogens (Schlatter et
al., 2017). Previous studies showed that microorganisms potentially can reduce the impact of
Phytophthora on host plants (Aravind et al., 2008; Agusti et al., 2011; Syed-Ab-Rahman et al., 2018).
1.3 Methods to study soil microbiome
1.3.1 Molecular methods
For the analysis of microbial soil populations, soil microorganisms were traditionally cultivated on agar
and the isolated strains from cultures were used for further analyses. However, with this method it is
not possible to cover the whole complex soil microbiome from an environmental sample because it
lacks the diversity of non-culturable microbiota (van Elsas & Boersma, 2010). Direct DNA extraction
and high throughput sequencing has therefore improved the ability of performing community
structure examinations of soil organisms. However, the methods for sequencing oomycetes are still
limited compared to fungi and bacteria (Sapoka & Nicolaisen, 2015). Further difficulties are due to the
heterogeneity of environmental samples. Different methods and primer pairs have to be used for
targeting different taxa (Lear et al., 2017). Yet, even though high throughput sequencing gives
advantages in community species composition, it still does not inform about ecological functions of
the microbiomes or individual species within it.
1.3.2 Functional analysis of soil microbiome
Plate counting is the traditional method to study microbial diversity. However, it is limited by its ability
to produce large quantity of cultures. Using sole carbon source utilization on the other hand enables
a highly reproducible way, generating a large amount of data (Kirk et al. 2004). Biolog EcoPlate (Biolog,
Inc., Hayward, CA, USA) is one of the tools created for evaluation of changes in functional microbial
communities in microbial ecology studies based on sole carbon source utilization. The tool is especially
designed for analysis of catabolic enzymatic capacity, an important functional trait of microbes in
environmental samples (Preston-Mafham et al., 2002). The method is based on a 96-well microtiter
plate, loaded with 31 different carbon sources and one blank well, each with three replications
(Appendix 1). Nine of those carbon sources are known components of root exudates (Preston-Mafham

12
et al., 2002). By inoculating environmental samples on those carbon sources, an analysis of the
enzymatic capacity of the microbial community to utilize these substances can be performed. The
utilization of substances can be measured by the colour development of each well. Through the
determination of metabolic diversity, it is possible to create a metabolic finger print for the studied
communities (Gryta et al., 2014). This metabolic finger print helps to understand ecological and
ecosystem functions of the microbiomes (Miki et al., 2016). For instance, it could be possible to
understand, if some communities are active in utilizing plant root exudates such as 2-Hydroxy Benzoic
Acid, 4-Hydroxy Benzoic Acid, D-Malic Acid. D-Xylose, L-Arginine, L-Asparagine, L-Serine, L-Threonine
and alpha-D-Lactose (Campbell et al., 1997). Root exudes may have a regulating effect on soil microbial
communities by either supporting beneficial symbioses or as antimicrobial defence secretion (Walker
et al., 2003). In the long term, when information about occurrence of Phytophthora in different soils
increases, Biolog EcoPlate could also be a tool to characterize forest soils with different capacities to
suppress tree-pathogenic Phytophthora species, but to my knowledge, this has not yet been tested.
1.4 Aim of the study
Knowledge about present pathogenic Phytophthora species in substrates and landscapes are essential
to counteract the further spread of these pathogens in our nature. The goal of this study was to add
to the current knowledge about the pathways of spreading for Phytophthora pathogens in our nature,
by analysing different soils, including commercially available ones, for the presence of Phytophthora.
In addition, the study aimed to test the Biolog EcoPlate as a tool to characterize the microbial
communities in heterogeneous soil samples.

13
2. Material & Method
2.1 Soil samples
Three different types of soil samples were used in the analyses. Five soil samples derived from
commercially available planting soils, purchased from plant retailers (Tab. 1). One bag of commercial
soil was considered as one sample. Five different products of two common brands were used. In
addition, soil samples were collected from five urban and eight forest stands in Halland county and in
Gothenburg during the period from November 2018 to February 2019 (Fig. 1). These stands were
selected based on suspicion of Phytophthora infestation (crown dieback, bleeding lesions on trees).
Eight samples were taken from soil from forests dominated by Fagus sylvatica and five soil samples
from forests dominated by Quercus robur.
Figure 2: Sampling areas in Halland county and Gothenburg, urban soi l (U), oak forest (FO) and beech forest (FB)

14
In forests and urban areas, soil samples were obtained from four sides around a tree with suspected
Phytophthora infection. The position was recorded by GPS (Garmin eTrex Legend® Cx). To collect the soil a
garden spade and a hand shovel were used. The four soil samples were pooled to one composite sample. To
avoid cross-contamination tools were cleaned with a brush and by spraying with 70 % ethanol solution before
each sampling. The soil was then transported in sealed plastic bags to the laboratory where it was stored in the
freezer.
Table 1: Information about soil samples ID Date Soil type Tree
species C1 - Commercial - C2 - Commercial - C3 - Commercial - C4 - Commercial - C5 - Commercial - U1 18.11.2018 Urban Beech U2 18.11.2018 Urban Beech U3 06.01.2019 Urban Beech U4 06.01.2019 Urban Beech U5 06.01.2019 Urban Beech
FO1 06.02.2019 Forest Oak FO2 06.02.2019 Forest Oak FO3 06.02.2019 Forest Oak FO4 06.02.2019 Forest Oak FO5 06.02.2019 Forest Oak FB6 08.11.2018 Forest Beech FB7 08.11.2018 Forest Beech FB8 08.11.2018 Forest Beech FB9 08.11.2018 Forest Beech
FB10 08.11.2018 Forest Beech FB11 08.11.2018 Forest Beech FB12 08.11.2018 Forest Beech FB13 08.11.2018 Forest Beech

15
2.2 Laboratory analyses
2.2.1 DNA analysis to detect Phytophthora
Sub-samples of each soil sample were transferred into 50 ml centrifuge tubes and freeze dried. The
DNeasy PowerMax Soil Kit was used for isolating the microbial DNA from the soil. The isolation was
made according to the Quick-Start Protocol (2016) (Appendix 2). Afterwards the samples were sent to
MR DNA (www.mrdnalab.com, Shallowater, TX, USA)) for polymerase chain reaction (PCR) and
sequencing. The internal transcript spacers (ITS) ITS1oo and ITS4 were used as primers in a 33 cycle
Polymerase Chain Reaction (PCR) using a HotStarTaq Plus Master Mix Kit (Qiagen, USA). ITS1oo is an
oomycete specific primer which showed improved specificity for oomycetes in previous studies when
paired with the universal primer ITS4 (Riit et al., 2016). Amplification was proceeded under following
conditions: Denaturation at 94°C for 3 minutes, followed by 33 cycles of 94°C for 30 seconds, annealing
at 53°C for 40 seconds and extension step at 72°C for 1 minute, after which a final elongation step at
72°C for 5 minutes was performed. The sequencing was performed using PacBio 5kb Kit following the
manufacturer’s guideline. The samples C2 and FB11 were not analysed.
2.3.2 Soil microbial community profiling using Biolog EcoPlates
Four soil samples with forest origin (FO1, FO2, FB6, FB12) and one sample with urban origin (U1) were
used for the test of microbial community profiling. For each soil sample three technical replicates were
prepared. A soil suspension was created for the soil samples as follows: Five FW grams of soil was
suspended to 50 ml of autoclaved ultra pure water. The suspension was agitated in an orbital shaker
(160 RPM) for one hour. Afterwards the suspension was allowed to settle for 30 minutes at 4°C. One
ml soil suspension was diluted with 100 ml of autoclaved water. Of the diluted sample, 100 μl were
pipetted into each well of the Biolog EcoPlate. Subsequently the wells were immediately measured
with a microplate reader (BMG LABTECH SPECTROstar® Nano) to obtain values at t=0. Absorbance was
measured at 590nm where the peak absorbance of tetrazolium dye occurs (Zack et al. 1994).
Measurements were taken daily (24 h intervals) for four days. The incubation time was determined
by a previous trial, where the highest utilization could be observed after 96 hours of incubation.
Between measurements, a lid was placed on each plate which was sealed with parafilm to avoid
evaporation, and the plates were incubated at 25°C in darkness. Obtained results were converted into
excel spreadsheets.

16
2.4 Data analysis
2.4.1 Identification of sequences
Operational taxonomic units (OTUs) were generated and defined by clustering at 3 % divergence. The
final OTUs were taxonomically classified by BLASTn against a database derived from RDPII
http://rdp.cme.msu.edu) and NCBI (www.ncbi.nlm.nih.gov). The sequences were visualized by using
Bioedit (3.3.19.0). For verification of the results, the sequences of the OTUs were copied as Fasta
format and BLASTn was used at the reference database at the National Center for Biotechnology
Informatics (NCBI) (https://blast.ncbi.nlm.nih.gov/Blast.cgi?CMD=Web&PAGE_TYPE=BlastHome).
2.4.2 Functional analysis of soil microbiome
The average absorbance value of the control wells was subtracted from each well containing a carbon
source to create the net absorbance value. The net absorbance value gives a corrected optical density
(OD) value. In case of negative reading the net absorbance value was set to 0. (Blumenstein, 2015). To
calculate the average well colour development (AWCD) following formula was used:
AWCD=Σ ODi/31
To analyse the capability of the microbial communities to utilize different carbon sources, the sources
were sorted into carbon groups according to Chazarenc et al. (2010) (Tab. 2) and analysed at 96 h
where the highest utilization was reached. In addition, utilization patterns of some individual
compounds (carboxylic acids: 2-Hydroxy Benzoic Acid, 4-Hydroxy Benzoic Acids, D-Malic Acid; amino
acids: L-Arginine, L-Asparagine, L-Serine, L-Threonine; Carbohydrate: D-Xylose, alpha-D-Lactose) with
specific importance as root exudates were examined.
Table 2: Carbon sources on EcoPlates reproduced after Chazarenc et a l. (2010).
Amines Amino acids Carbohydrates Carboxylic Acids Complex Carbon Sources Phosphate-carbonPhenylethylamine L-Arginine β-Methyl-D-Glucoside D-Galactonic Acid γ Lactone Tween 40 Glucose-1-Phosphate
Putrescine L-asparagine D-Xylose Pyruvic Acid Methyl Ester Tween 80 D-L-α-Glycerol PhosphateL-Phenylatanine i-Erythritol D-Galacturonic Acid α-Cyclodextrin
L-Serine D-Mannitol 2-Hydroxy Benzoic Acid GlycogenL-Threonine N-Acetyl-D-Glucosamine 4-Hydroxy Benzoic Acid
Glycyl-L-Glutamic Acid D-Cellobiose γ-Hydroxybutyric Acidα-D-Lactose D-Glucosominic Acid
Itaconic Acidα-Ketobutyric Acid
D-Malic Acid

17
The substrate use richness was measured by summing the number of positive responses. A threshold
was set at OD= 0,1784 to indicate carbon utilization. The threshold was created by the average
absorbance values of oxidized substrates as defined by Vahjen et al. (1997).
Shannon diversity index was used to analyse substrate richness and substrates evenness:
H’=−Σpi(lnpi)
where p is the proportional microbial activity on substrate i divided by total microbial activity
(Stefanowicz, 2006; Zak et al., 1994).
Shannon evenness which measurers the uniformity of activities across the utilized substrates:
E=H/Ln S
where H is the Shannon diversity and S the richness of substrate utilization (Zak et al. (1994).
The data was analysed and displayed by using JMP Pro 14.

18
3 Results
3.1 DNA analysis
Several OTUs attributed to Phytophthora species were found. However, for most species the
maximum score and maximum identity values were too low to identify the species with certainty. Only
P. cambivora and P. citricola, which has been renamed P. plurivora (Jung & Burgess, 2009), could be
attributed with high likelihood because of an e-value of 0 to several OTUs (Appendix 3). Nine OTUs
related to P. cambivora were found in all soil samples from oak forests and in all commercial soil
samples. Furthermore, they were present in all soil samples but one from beech forests and urban
areas. The OTU attributed to the P. plurivora was only found in U1. FB8 was the sample with most
identified OTUs (Fig. 3).
Figure 3: Operational taxonomic units (OTU) identif ied on Phytophthora species grouped by soi l samples. All OTUs were classif ied as P. cambivora , except for OTU 4897 which was classif ied as P. plurivora . Samples are taken from commercial soils (C) , Urban soil (U), oak forest (FO) and beech forest (FB)

19
Looking at the clusters of organisms OTU 14 was by far the most common across the samples, followed
by OTU 4396. Four OTUs were only present in one sample (Fig. 4).
Figure 4: Number of samples with OTUs attributed to Phytophthora cambivora and P. plurivora
3.2 Soil microbial community profiling
The temporal dynamics in AWCD differed between samples, with FO2 (forest, oak) and U1 (urban,
beech) having the highest temporal changes (Fig. 5). All samples reached their highest AWCD after
96 h of incubation wherefore the AWCD (96h) value was used for analysis of utilization of different
carbon groups (Fig. 6). FB12 (forest, beech) had the lowest OD590. The AWCD followed different
patterns, FO2 and U1 follow both following a sigmoidal-curve. The other samples all had their own
pattern with incubation time. The samples from oak forest FO1 and FO2 had more differentiated
patterns than the samples from beech forest FB6 and FB12

20
Figure 5: Mean values of average wel l colour development (AWCD) of f ive different samples (three technical replicates) on Biolog EcoPlates based on 96 h of incubation. Soi l samples are obtained from oak forest, beech forest and one soil sample from an urban area.
The microbial communities were able to utilize all types of carbon sources. Amines, amino acids,
carbohydrates and carboxylic acids had similar patterns of utilization across the samples with the
highest utilization in FO2 and U1, and the lowest in FB12. Complex carbon sources were most actively
utilized by microbes in U1. Phosphate carbon sources were almost equally utilized across all samples
with a rather low utilization in total (Fig. 6).

21
Figure 6: Mean util izat ion and SD (three technical repl icates) of different carbon groups by soi l sample microbes based on 96-h incubation measured as OD590 nm. Soi l samples are obtained from oak forest, beech forest and one urban area.
The amino acids L-Arginine, L-Asparagine and L-Serine had similar patterns with highest utilisation by
FO2. The utilization of those thee amino acids seems to be higher in FO2 and U1 than the mean
utilization of amino acids after 96 hours of incubation. In U4, 4-Hydroxy Benzoic Acid seems to be
more utilized than other carboxylic acids (Fig. 7).

22
Figure 7: Average well colour development (AWCD) of nine carbon sources from three different carbon groups related to plant root exudes. Five samples (three technical repl icates) were used. Soi l samples are obtained from oak forest, beech forest and one soi l sample from an urban area.
In all samples, the number of utilized substrates increased during incubation time and the richest
carbon source utilization was observed after 96 h of incubation. The sample U1 had the richest
utilization overall at any given time point. All samples, except FO1 and FB12, had over 50 % of the
carbon sources utilized after 96 hours of incubation. (Fig. 8).

23
Figure 8: Number of uti l ized substrates by dif ferent samples showing the mean number of carbon sources (three technical repl icates) for which the optical density was at least 0,1784. Soi l samples were obtained from oak forest, beech forest and one urban area.
Sample U1 had the highest substrate utilization diversity. The patterns of H’ are similar to the AWCD
for each sample. However, diversity differs to AWCD by U1 seemingly having a higher diversity than
FO2 after 96 h of incubation. (Fig. 9).

24
Figure 9: Shannon diversity patterns from different samples (three technical replicate) on Bio log EcoPlate. Soil samples were obtained from oak forest, beech forest and one soil sample from an urban area.
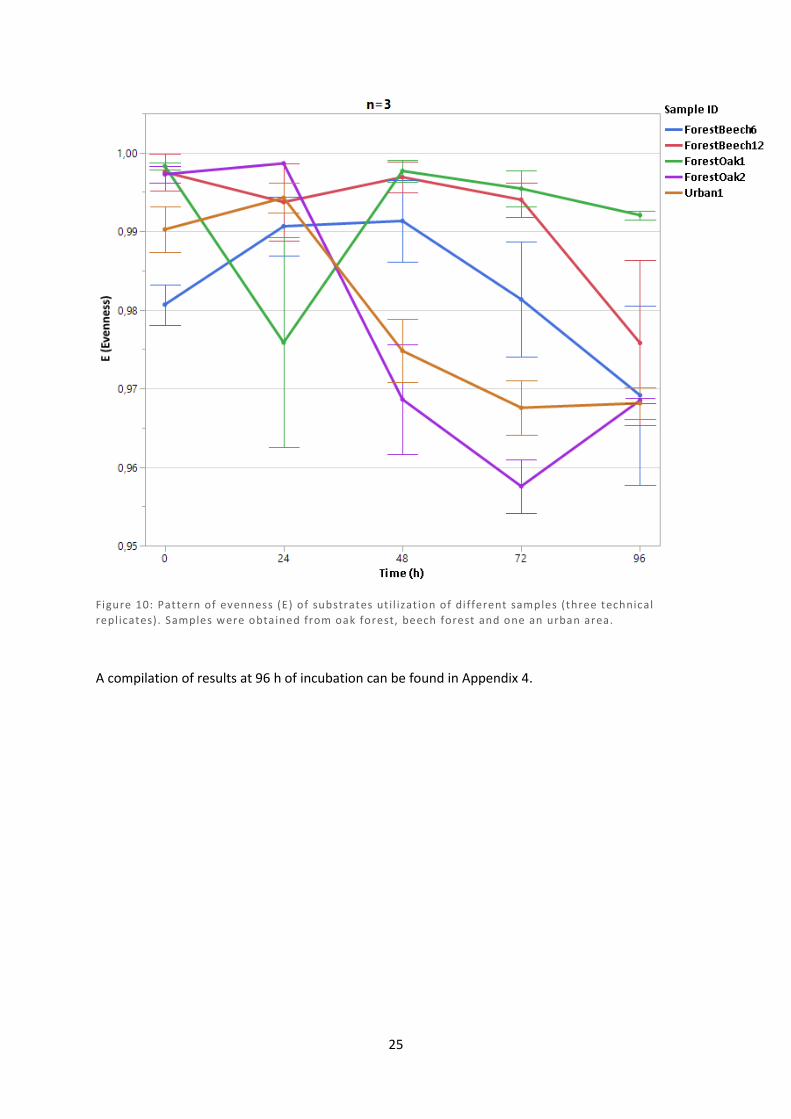
Evenness (E) was calculated when enough activity was present. In case Richness (R) are was 0 or 1 no
calculation of evenness was possible. The value of E was constantly over 0,9 for all sample, when
calculation was possible (Fig. 10).
25
Figure 10: Pattern of evenness (E) of substrates ut il izat ion of different samples (three technical repl icates). Samples were obtained from oak forest, beech forest and one an urban area.
A compilation of results at 96 h of incubation can be found in Appendix 4.

26
4. Discussion
4.1 Occurrence of Phytophthora in soil samples
The DNA analysis of soil samples confirmed the presence of two Phytophthora species, P. cambivora
and P. citricola which is today called Phytophthora plurivora (Jung & Burgess, 2009). Both species are
known to cause bleeding cankers in beech and oak, and they are considered as the most common
aggressive Phytophthora pathogens affecting European beech (Jung et al., 2013b). The finding that P.
cambivora was found in almost all samples, in forest and urban landscapes as well as in commercial
soils is alarming and suggests that P. cambivora can effectively spread across different habitats in
Sweden. Intriguingly, however, P. plurivora was only detected in one sample from the urban area in
Halmstad. Thus, the commonness of P. plurivora in different habitats was not confirmed, which
contrasts with earlier studies where this species has been found in nurseries, urban and natural forests
in Southern Sweden (Redondo et al, 2015; Redondo et al., 2018).
Phytophthora cinnamomi could be verified by using BLASTn on the reference databases of NCBI,
however the e value and total score were too low to confirm the species. P. cinnamomi has not been
found in in Swedish forests so far which could be explained by the species’ restriction to warmer
climates (Brasier, 1995; Brasier & Jung, 2006). However, it has been detected in samples of ornamental
plants in Sweden (M. Cleary, unpublished data), and in future climate it could also become a problem
in Northern Europe.
Clear patterns in Phytophthora occurrence or the abundance of different operational taxonomic units
between oak and beech samples, or forest and urban samples were not detected. This may be because
the sampling effort in my study was limited due to practical reasons, and the material thus does not
allow rigorous statistical comparisons. However, the lack of clear patterns may also be indicative for
the commonness of several Phytophthora species in the region. Recent studies have indicated that
several Phytophthora species, including P. cambivora and P. plurivora, have already spread across
different environments. In a study by Redondo et al. (2018) P. cambivora was frequently found in
forests but was not one of the most frequent Phytophthora species in nurseries which could indicate
that it is already established in the region. Blomquist (2017) identified five different Phytophthora
species in beech forests and Jönssson (2003) isolated three Phytophthora species from oak stands.
Both studies were conducted in Southern Sweden and P. cambivora was one of the identified species,
which substantiates the wide spread across habitats in the region. The high susceptibility of Swedish
tree species to Phytophthora was indicated in a study by Cleary et al. (2016) where P. cactorum, P.

27
cambivora and P. plurivora were causing lesions of different degree on all tested tree species. This
susceptibility of Swedish tree species can be seen as a factor that allows Phytophthora species to
spread across different environments.
It is assumed that Phytophthora species are introduced through plantings using imported nursery
materials and there is already proof of many infestations of Phytophthora species across European
nurseries. Jung et al. (2015) found Phytophthora infestation in 91,5 % of examined nurseries in Europe.
The finding of P. cambivora in commercial soils from convenient stores verifies another potential
pathway for spreading. By using commercial soils in garden or by littering garden debris in forest edges
or forests, citizens could assist the introduction of Phytophthora into ecosystems. This finding
emphasizes the importance and the need to educate people about the danger of spreading pathogens
in forests through gardening or careless deposition of plant residues.
The spread of Phytophthora species is dependent on asexual motile zoospore (Judelson & Blanco,
2005). The study by Redondo et al. (2018) has shown that the proportion of Phytophthora species with
asexual structures was significantly higher in forests than in nurseries, indicating the need of
zoospores for establishment. In the same study it was indicated that Phytophthora species with lower
cardinal temperature were more likely to be found in forests. With likely rising temperatures in the
future Phytophthora species may find more suitable conditions and expand. It is important to hinder
further expansion and to recognize potential risks early by monitoring non-native Phytophthora
species. Considering the important role of zoospores for spreading, it would be reasonable to develop
control methods to counter the zoospores before the species establishes, because zoospores are more
vulnerable than resting spores (Judelson & Blanco, 2005).
4.1.2 Limitations of the analysis
Despite having many OTUs related to Phytophthora, there were only two species which could be
determined to species level: the putative taxa could not always be validated by BLASTn on the NCBI
database. This may be due to the chosen ITS primers ITS1oo and ITS4 as they have a higher specificity
to oomycetes and better taxon coverage compared to other primer pairs. Furthermore, the PacBio
allows a longer read length compared to other platforms. Therefore, the sequence read in NCBI
database may cover other ITS regions and/or uses shorter reads wherefore it is not possible to get a
perfect match or any match at all. Hence, the analysis is limited by the content of the database, and
in most cases the data output (Appendix 3) should be considered merely as indicators of what genus
might be present in the samples.

28
4.2 Soil microbial community profiling
EcoPlate results indicated that the metabolic activity of soils differed even within same habitats. This
is not unexpected since soil is known to be a highly heterogenous substrate, where the microbial
community structure is likely to vary in time and place (Piotrowska-Długosz et al, 2019). The microbial
activity in the urban soil sample seemed to be generally higher than in the forest soil samples, which
could be indicate a more diverse community in urban areas where soil is moved around and mixed
due to building activities. However, the small sample number per habitat in my study does not allow
to make conclusions about the habitat specific differences in the functional traits of microbial
communities.
Overall, the obtained OD values were rather low compared to other studies (Ellis et al., 2001; Gryta et
al.,2014). The lower AWCD values could be a result of a lower pH value in my samples. In the study of
Gryta et al. (2014), not only the AWCD but also the pH value of the samples was higher (pH 5-11). In
the study of Ellis et al. (2001) the soil samples with a pH value around 5 had a lower AWCD than the
samples with a pH value around 7. All samples from my study were collected from broadleaf stands,
where the main species were either European beech or Pedunculate oak. These tree species are
known to lead to a lower pH value in soil than other broadleaf species in the region, having an
approximate pH value between 4,37 and 4,53 in beech and oak forests (Oostra et al., 2006). Catabolic
activity on EcoPlates is likely to be mainly conducted by fast growing bacteria though it is not known
which species utilize the carbon sources (Stefanowizc, 2006). The pH has been identified as the main
soil property affecting bacterial communities, generally leading to a higher bacterial diversity with a
higher pH value (Kaiser et al., 2016; Rousk et al., 2010). Fungi on the other hand are more acid tolerant
(Mulder et al. 2005) though they were unlikely to contribute to the colour development of the
EcoPlates because they have been reported to be incapable to utilize the tetrazolium dye in these
plates (Preston-Mafham et al. 2002). The high utilization in the urban sample may also result from a
higher pH through input of cement, filling materials and other building debris (Räsänen & Penttala,
2004; Shukla et al., 1990). The oak forest samples FO1 and FO2 were sampled in the same area, but
the AWCD differs a lot which shows that microbial communities have high heterogeneity even on
small sites (Preston-Mafham et al., 2002).
The possible importance of pH for AWCD level is also implied by the result that the sample FO2 had
much higher AWCD value than FO1: these samples were collected in the same area, but along a
hillslope, with FO1 being collected higher up in the hill and FO2 closer to footslope in a moister soil.
The slope position is known to affect the pH (Yeshaneh, 2015.) and it is possible that the movement

29
of water downhills may have contributed to increased pH in the footslope, thus supporting a microbe
community that produced higher AWCD values. In my study the pH of the soil samples was not
measured and thus the impact of it the results remain unconfirmed, but it could be recommended to
add to the protocol a measurement of the pH in soil samples before the EcoPlate analyses, in order to
understand the observed substrate utilisation patterns. My results also show that it is important to
carefully consider that microbial communities have high heterogeneity, even within small spatial
scales (Preston-Mafham et al., 2002).
Studied compound groups were utilized by the microbes in all samples, possibly reflecting the general
importance of the studied substrates for soil bacteria. Interestingly, complex carbon sources were
utilized at highest level in the urban sample. Since the utilized complex carbon sources, such as Tween
80, which is a surfactant used in food and different products (e.g., cosmetics), they are probably more
likely to be found in an urban area than in a forest area. It is possible that microorganisms from the
urban area are more adapted to using these substrates (Orwin et al., 2006).
Another noticeable result is the high utilization of amino acids by FO2, which also had the highest
overall utilization. This could indicate a need for nitrogen. Interestingly, L-arginine and L-asparagine
were amino acids with high utilization in FO2 and U1. Arginine and asparagine were found to be the
most important amino acids in all compounds of sessile oak (Bazot et al., 2013) Under stress
conditions, amino acids such as L-Asparagine can increase in the bark and wood of roots (Wargo,
1996). Furthermore, there was a high utilization in U1 of 4-Hydroxy Benzoic Acid. 4-Hydroxy Benzoic
Acid, also known as p-hydroxybenzoic acid, was earlier identified as a fine root extract in European
beech (Tomova et al.,2005).
A potential error in EcoPlate profiling could have been caused by the sampling during different
seasons. In an earlier study by Chazarenc et al., (2010) showed in a community level physiological
profiling analysis on wetlands that seasons are important parameters affecting bacterial diversity. In
my study, however, the two samples with highest utilization (FO2, U1) were sampled during different
seasons. Moreover, the two oak samples were collected at the same time and from the same site but
showed large differences. Thus, my results indicate that other sources of variation may be more
important regulators of the metabolic activity of bacterial communities.
Some technical recommendations can be compiled from my tests. For example, I found temporal
dynamics in the utilization patterns and that the reaction on plates resulted in highest differences in
AWCD at 96 hours incubation time, as indicated also by the fact that the highest R and H’ values were
found at this time point. Thus, if point in time comparisons are made, they should not be made too

30
early. Different growth rate of organisms can influence the total utilization of a carbon source
(Garland, 1997), wherefore the measurements should be done over an adequate amount of time.
Furthermore, all samples already had a colour development at t=0. This could be due to turbidity
which could be avoided by measuring a turbidity value at OD750nm and by subtracting it from the
OD590 value (Classen et al., 2003).
In the future, the EcoPlate analyses could be used to compare if certain specific functional traits
(catabolic activities) are linked to soils where we observe high or low risk of trees being affected by
Phytophthora. If certain patterns of enzymatic activities are always present in soils with low
occurrence of symptomatic trees, it could be studied whether the microbes causing these activities
could possess traits that lead to suppression of Phytophthora in the soil.
5. Conclusions
Phytophthora cambivora was found in Gothenburg and Southern Halland in urban areas and forests,
as well as in commercial soil samples. P. plurivora was found in Halmstad. In conclusion, these results
show that tree pathogenic Phytophthora species are widespread in Southern Swedish landscapes and
that commercial soil may be an important pathway for the spreading of these pathogens. Measures
have to be taken to spread awareness about aggressive forest pathogens in commercial soils and
measurements should be taken to restrict further spreading.
Biolog Ecoplate is a potential tool for studies examining the functional diversity of soil microbial
communities, but it needs to be taken care to standardize the sampling and ensure adequate
replication because of the spatial and time dependent variation in soil microbial communities. Further,
soil properties should be measured as potential drivers of microbial community patterns.
Furthermore, it is important to standardize the method to make studies comparable.

31
6. Acknowledgements
First, I would like to thank my supervisor Johanna Witzell for her support, advice and constructive
feedback during my thesis work as well as for introducing me to laboratory work in plant pathology. I
also thank Stefan Anderson, soil specialist in Forestry Agency (Halland district) for providing the beech
forest soil samples. Further, I would like to thank all the people from the laboratory group who were
always helpful when I had questions. The study is a part of activities in the project “Preventing the
spread of new pathogens in Nordic forests to secure sustainable forestry in growing bioeconomy”,
financed by Nordic Forest Research SNS (2019–2021).

32
References
Agrios, G. N. (2005). Plant pathology. Academic Press, San Diego, 952 pp.
Agusti, L., Bonaterra, A., Moragrega, C., Camps, J., & Montesinos, E. (2011). Biocontrol of root rot of strawberry caused by Phytophthora cactorum with a combination of two Pseudomonas fluorescens strains. Journal of Plant Pathology, 93 (2), 363-372.
Aravind, R., Kumar, A., Eapen, S. J., & Ramana, K. V. (2009). Endophytic bacterial flora in root and stem tissues of black pepper (Piper nigrum L.) genotype: isolation, identification and evaluation against Phytophthora capsici. Letters in Applied Microbiology, 48(1), 58-64.
Bartnicki-Garcia, S. (1968). Cell wall chemistry, morphogenesis, and taxonomy of fungi. Annual Reviews in Microbiology, 22(1), 87-108.
Bazot, S., Barthes, L., Blanot, D., & Fresneau, C. (2013). Distribution of non-structural nitrogen and carbohydrate compounds in mature oak trees in a temperate forest at four key phenological stages. Trees, 27(4), 1023-1034.
Blomquist, M. (2017). Invasive Phytophthora species affecting broadleaved tree species in urban and landscape settings in Southern Sweden. MSc. thesis, SLU, Alnarp, 44 pp.
Brasier, C. M. (1995). Phytophthora cinnamomi and oak decline in southern Europe. Environmental constraints including climate change. Annales des Sciences Forestieres 53 (2-3), 347-358.
Brasier, C. M. (2008). The biosecurity threat to the UK and global environment from international trade in plants. Plant Pathology, 57(5), 792-808.
Brasier, C. M., & Jung, T. (2006). Recent developments in Phytophthora diseases of trees and natural ecosystems in Europe. In ‘Proceedings of the Third International IUFRO Working Party (S07. 02.09) Meeting: Progress in Research on Phytophthora Diseases of Forest Trees’. (Eds. Brasier, C.M.; Jung, T.; Osswald, W.), pp. 5-16. (IUFRO Working Party 7.02.09 Meeting, Freising, Germany, September 11–17, 2004).
Bundy, J. G., Paton, G. I., & Campbell, C. D. (2004). Combined microbial community level and single species biosensor responses to monitor recovery of oil polluted soil. Soil Biology and Biochemistry, 36(7), 1149-1159.
Classen, A. T., Boyle, S. I., Haskins, K. E., Overby, S. T., & Hart, S. C. (2003). Community-level physiological profiles of bacteria and fungi: plate type and incubation temperature influences on contrasting soils. FEMS Microbiology Ecology, 44(3), 319-328.
Cleary, M., Ghasemkhani, M., Blomquist, M., & Witzell, J. (2016). First report of Phytophthora gonapodyides causing stem canker on European beech (Fagus sylvatica) in Southern Sweden. Plant Disease, 100(10), 2174.
Cleary, M. R., Blomquist, M., Vetukuri, R. R., Böhlenius, H., & Witzell, J. (2017). Susceptibility of common tree species in Sweden to Phytophthora cactorum, P. cambivora and P. plurivora. Forest Pathology, 47(3).
Chazarenc, F., Brisson, J., & Merlin, G. (2010). Seasonal and spatial changes of microorganism communities in constructed wetlands: a community level physiological profiling analysis.

33
International Journal of Chemical Engineering, Article ID 490240, p. 6. Available from: https://doi.org/10.1155/2010/490240 [Accessed 23 Febuary 2020]
Cushman, J. H., & Meentemeyer, R. K. (2008). Multi-scale patterns of human activity and the incidence of an exotic forest pathogen. Journal of Ecology, 96(4), 766-776.
Dick M.W. (2001) The Peronosporomycetes. In: McLaughlin D.J., McLaughlin E.G., Lemke P.A. (eds.). Systematics and Evolution. The Mycota (A Comprehensive Treatise on Fungi as Experimental Systems for Basic and Applied Research), vol 7A. Springer, Berlin, Heidelberg, pp. 39-72.
Edmonds, R. L. (2013). General strategies of forest disease management. In: Gonthier, P.; Nicolotti, G. (eds.). Infectious Forest Diseases. CABI, Wallingford, UK, pp. 29-49.
Ellis, R. J., Neish, B., Trett, M. W., Best, J. G., Weightman, A. J., Morgan, P., & Fry, J. C. (2001). Comparison of microbial and meiofaunal community analyses for determining impact of heavy metal contamination. Journal of Microbiological Methods, 45(3), 171-185.
Érsek, T., Man in ’t Veld, W.A., (2013). Phytophthora species hybrids: a novel threat to crops and natural ecosystems. In: Lamour, K. (ed.). Phytophthora: a global perspective. CABI, Wallingford, UK, pp. 37-47.
Fleischmann, F., Göttlein, A., Rodenkirchen, H., Lütz, C., & Oßwald, W. (2004). Biomass, nutrient and pigment content of beech (Fagus sylvatica) saplings infected with Phytophthora citricola, P. cambivora, P. pseudosyringae and P. undulata. Forest Pathology, 34(2), 79-92.
Floch, C., Chevremont, A. C., Joanico, K., Capowiez, Y., & Criquet, S. (2011). Indicators of pesticide contamination: soil enzyme compared to functional diversity of bacterial communities via Biolog® Ecoplates. European Journal of Soil Biology, 47(4), 256-263.
Garland, J. L. (1997). Analysis and interpretation of community-level physiological profiles in microbial ecology. FEMS Microbiology Ecology, 24(4), 289-300.
Gonthier, P., & Nicolotti, G. (Eds.). (2013). Infectious forest diseases. CABI, Wallingford, UK, 641 pp.
Grenville-Briggs, L. J., Kushwaha, S. K., Cleary, M. R., Witzell, J., Savenkov, E. I., Whisson, S. C., ... Vetukuri, R. R. (2017). Draft genome of the oomycete pathogen Phytophthora cactorum strain LV007 isolated from European beech (Fagus sylvatica). Genom Data, 12, 155-156.
Gryta, A., Frąc, M., & Oszust, K. (2014). The application of the Biolog EcoPlate approach in ecotoxicological evaluation of dairy sewage sludge. Applied Biochemistry and Biotechnology, 174(4), 1434-1443.
Hansen, E. M. (2015). Phytophthora species emerging as pathogens of forest trees. Current Forestry Reports, 1(1), 16-24.
Kirk, J. L., Beaudette, L. A., Hart, M., Moutoglis, P., Klironomos, J. N., Lee, H., & Trevors, J. T. (2004). Methods of studying soil microbial diversity. Journal of Microbiological Methods, 58(2), 169-188.
Judelson, H. S., & Blanco, F. A. (2005). The spores of Phytophthora: weapons of the plant destroyer. Nature Reviews Microbiology, 3(1), 47.
Jung, T. (2009). Beech decline in Central Europe driven by the interaction between Phytophthora infections and climatic extremes. Forest Pathology, 39(2), 73-94.

34
Jung, T., & Burgess, T. I. (2009). Re-evaluation of Phytophthora citricola isolates from multiple woody hosts in Europe and North America reveals a new species, Phytophthora plurivora sp. nov. Persoonia, 22, 95.
Jung, T., Blaschke, H., & Neumann, P. (1996). Isolation, identification and pathogenicity of Phytophthora species from declining oak stands. European Journal of Forest Pathology, 26(5), 253-272.
Jung, T., Blaschke, H., & Oßwald, W. (2000). Involvement of soilborne Phytophthora species in Central European oak decline and the effect of site factors on the disease. Plant Pathology, 49(6), 706-718.
Jung, T., Colquhoun, I. J., & Hardy, G. S. J. (2013a). New insights into the survival strategy of the invasive soilborne pathogen Phytophthora cinnamomi in different natural ecosystems in Western Australia. Forest Pathology, 43(4), 266-288.
Jung, T., Vettraino, A. M., Cech, T. L., & Vannini, A. (2013b). The impact of invasive Phytophthora species on European forests. In: Lamour, K. (ed.). Phytophthora: a global perspective. CABI, Wallingford, UK, pp.Phytophthora: A global perspective, pp. 146-158.
Jung, T., Orlikowski, L., Henricot, B., Abad-Campos, P., Aday, A.G., Aguin Casal, O.; … Perez-Sierra, A. (2015). Widespread Phytophthora infestations in European nurseries put forest, semi-natural and horticultural ecosystems at high risk of Phytophthora diseases. Forest Pathology 46 (2), 134-163.
Jönsson, U., Jung, T., Sonesson, K., & Rosengren, U. (2005). Relationships between health of Quercus robur, occurrence of Phytophthora species and site conditions in southern Sweden. Plant Pathology, 54(4), 502-511.
Jönsson, U., Lundberg, L., Sonesson, K., & Jung, T. (2003). First records of soilborne Phytophthora species in Swedish oak forests. Forest Pathology, 33(3), 175-179.
Kaiser, K., Wemheuer, B., Korolkow, V., Wemheuer, F., Nacke, H., Schöning, I., ... Daniel, R. (2016). Driving forces of soil bacterial community structure, diversity, and function in temperate grasslands and forests. Scientific Reports, 6, 33696.
Kroon, L. P., Brouwer, H., de Cock, A. W., & Govers, F. (2012). The genus Phytophthora anno 2012. Phytopathology, 102(4), 348-36
La Porta, N., Capretti, P., Thomsen, I. M., Kasanen, R., Hietala, A. M., & Von Weissenberg, K. (2008). Forest pathogens with higher damage potential due to climate change in Europe. Canadian Journal of Plant Pathology, 30(2), 177-195.
Lear, G., Dickie, I., Banks, J., Boyer, S., Buckley, H. L., Buckley, T. R.,... Holdaway, R. (2018). Methods for the extraction, storage, amplification and sequencing of DNA from environmental samples. New Zealand Journal of Ecology, 42(1), 10-50A.
Miki, T., Yokokawa, T., Ke, P. J., Hsieh, I. F., Hsieh, C. H., Kume, T., … Matsui, K. (2018). Statistical recipe for quantifying microbial functional diversity from EcoPlate metabolic profiling. Ecological Research, 33(1), 249-260.

35
Mulder, C., Van Wijnen, H. J., & Van Wezel, A. P. (2005). Numerical abundance and biodiversity of below-ground taxocenes along a pH gradient across The Netherlands. Journal of Biogeography, 32(10), 1775-1790.
Oliva, J., Boberg, J. B., Hopkins, A. J., Stenlid, J., Gonthier, P., & Nicolotti, G. (2013). Concepts of epidemiology of forest diseases. In: Gonthier, P.; Nicolotti, G. (eds.). Infectious Forest Diseases. CABI, Wallingford, UK, pp. 1-28.
Oostra, S., Majdi, H., & Olsson, M. (2006). Impact of tree species on soil carbon stocks and soil acidity in southern Sweden. Scandinavian Journal of Forest Research, 21(5), 364-371.
Orwin, K. H., Wardle, D. A., & Greenfield, L. G. (2006). Ecological consequences of carbon substrate identity and diversity in a laboratory study. Ecology, 87(3), 580-593.
Oßwald, W., Fleischmann, F., Rigling, D., Coelho, A. C., Cravador, A., Diez, J., ... Werres, S. (2014). Strategies of attack and defence in woody plant–Phytophthora interactions. Forest Pathology, 44(3), 169-190.
Pautasso, M. (2013). Responding to diseases caused by exotic tree pathogens. In: Gonthier, P.; Nicolotti, G. (eds.). Infectious Forest Diseases. CABI, Wallingford, UK, pp. 592-612.
Piotrowska-Długosz, A., Breza-Boruta, B. & Długosz, J. (2019) Spatio-temporal heterogeneity of soil microbial properties in a conventionally managed arable field. Journal of Soils and Sediments 19, 345–355.
Preston-Mafham, J., Boddy, L., & Randerson, P.F. (2002) Analysis of microbial community functional diversity using sole-carbonsource utilization profiles—a critique. FEMS Microbiology Ecology 42, 1–14.
Redondo, M. A., Boberg, J., Olsson, C. H., & Oliva, J. (2015). Winter conditions correlate with Phytophthora alni subspecies distribution in Southern Sweden. Phytopathology, 105(9), 1191-1197.
Redondo, M. A., Boberg, J., Stenlid, J., & Oliva, J. (2018). Functional traits associated with the establishment of introduced Phytophthora spp. in Swedish forests. Journal of Applied Ecology, 55(3), 1538-1552.
Regulation (EU) 2016/2031 of the European Parliament of the Council of 26 October 2016 on protective measures against pests of plants, amending Regulations (EU) No 228/2013, (EU) No 652/2014 and (EU) No 1143/2014 of the European Parliament and of the Council and repealing Council Directives 69/464/EEC, 74/647/EEC, 93/85/EEC, 98/57/EC, 2000/29/EC, 2006/91/EC and 2007/33/EC
Ribeiro, O. K. (2013). A historical perspective of Phytophthora. In: Lamour, K. (ed.). Phytophthora: a global perspective. CABI, Wallingford, UK, pp. 1-10. 1.
Riit, T., Tedersoo, L., Drenkhan, R., Runno-Paurson, E., Kokko, H., & Anslan, S. (2016). Oomycete-specific ITS primers for identification and metabarcoding. MycoKeys, 14, 17.
Rousk, J., Bååth, E., Brookes, P. C., Lauber, C. L., Lozupone, C., Caporaso, J. G., ... Fierer, N. (2010). Soil bacterial and fungal communities across a pH gradient in an arable soil. The ISME Journal, 4(10), 1340.
Räsänen, V., & Penttala, V. (2004). The pH measurement of concrete and smoothing mortar using a concrete powder suspension. Cement and Concrete Research, 34(5), 813-820.

36
Santini, A., Ghelardini, L., De Pace, C., Desprez-Loustau, M. L., Capretti, P., Chandelier, A., Cech, T., ... & Hantula, J. (2013). Biogeographical patterns and determinants of invasion by forest pathogens in Europe. New Phytologist, 197(1), 238-250.
Sapkota, R., & Nicolaisen, M. (2015). An improved high throughput sequencing method for studying oomycete communities. Journal of Microbiological Methods, 110, 33-39.
Schlatter, D., Kinkel, L., Thomashow, L., Weller, D., & Paulitz, T. (2017). Disease suppressive soils: new insights from the soil microbiome. Phytopathology, 107(11), 1284-1297.
Shukla, J., Pandey, V., Singh, S. N., Yunus, M., Singh, N., & Ahmad, K. J. (1990). Effect of cement dust on the growth and yield of Brassica campestris L. Environmental Pollution, 66(1), 81-88.
Sofo, A., & Ricciuti, P. (2019). A Standardized method for estimating the functional diversity of soil bacterial community by Biolog® EcoPlatesTM assay—The case study of a sustainable olive orchard. Applied Sciences, 9(19), 4035.
Stefanowicz, A. (2006). The Biolog plates technique as a tool in ecological studies of microbial communities. Polish Journal of Environmental Studies, 15(5).
Sturrock, R. N., Frankel, S. J., Brown, A. V., Hennon, P. E., Kliejunas, J. T., Lewis, K. J., ... Woods, A. J. (2011). Climate change and forest diseases. Plant Pathology, 60(1), 133-149.
Syed-Ab-Rahman, S. F., Carvalhais, L. C., & Schenk, P. (2018). Identification of soil bacterial isolates suppressing different Phytophthora spp. and promoting plant growth. Frontiers in Plant Science, 9, 1502.
Thines, M. (2014). Taxonomy and phylogeny of Phytophthora and related oomycetes. In: Lamour, K. (ed.). Phytophthora: a global perspective. CABI, Wallingford, UK, pp. 11-8.
Thomas, F. M., Blank, R., & Hartmann, G. (2002). Abiotic and biotic factors and their interactions as causes of oak decline in Central Europe. Forest Pathology, 32(4-5), 277-307.
Tomova, L., Braun, S., & Flückiger, W. (2005). The effect of nitrogen fertilization on fungistatic phenolic compounds in roots of beech (Fagus sylvatica) and Norway spruce (Picea abies). Forest Pathology, 35(4), 262-276.
Tyler, B. M. (2002). Molecular basis of recognition between Phytophthora pathogens and their hosts. Annual Review of Phytopathology, 40(1), 137-167.
Vahjen, W., Munch, J. C., & Tebbe, C. C. (1995). Carbon source utilization of soil extracted microorganisms as a tool to detect the effects of soil supplemented with genetically engineered and non-engineered Corynebacterium glutamicum and a recombinant peptide at the community level. FEMS Microbiology Ecology, 18(4), 317-328.
Van Elsas, J. D., & Boersma, F. G. H. (2011). A review of molecular methods to study the microbiota of soil and the mycosphere. European Journal of Soil Biology, 47(2), 77-87.
Walker, T. S., Bais, H. P., Grotewold, E., & Vivanco, J. M. (2003). Root exudation and rhizosphere biology. Plant Physiology, 132(1), 44-51.
Wargo, P. M. (1996). Consequences of environmental stress on oak: predisposition to pathogens. In Annales des Sciences Forestières 53 (2-3), 359-368.

37
Webber, J. F., & Rose, J. (2008). Dissemination of aerial and root infecting Phytophthoras by human vectors. In: `Proceedings of the sudden oak death third science ymposium´. (Eds. Frankel, S.J., Kliejunas, J.T., & Palmieri, K.M.), pp. 195-198 USDA-Forest Service Pacific Southwest Research Station, Albany, CA.
Yang, M., Duan, S., Mei, X., Huang, H., Chen, W., Liu, Y., ... He, X. (2018). The Phytophthora cactorum genome provides insights into the adaptation to host defence compounds and fungicides. Scientific Reports, 8(1), 6534.
Yeshaneh, G. T. (2015). Effect of slope position on soil physico-chemical properties with different management practices in small holder cultivated farms of Abuhoy Gara Catchment, Gidan District, North Wollo. American Journal of Environmental Protection, 3, 174-179.
Zak, J. C., Willig, M. R., Moorhead, D. L., & Wildman, H. G. (1994). Functional diversity of microbial communities: a quantitative approach. Soil Biology and Biochemistry, 26(9), 1101-1108.

38
Appendix
Appendix 1: Carbon sources in EcoPlate (source: Biolog brochure)

39
Appendix 2: DNeasy® PowerSoil® Kit Protocol

40
Appendix 3: Table with results from DNA analysis sorted by OTU
OTU Putative taxon Total Score Coverage Identity E value Sample ID
14 P. cambivora 1624 97% 99,89% 0
C1, C3, C4, C5, U2, U4,
U5, FO1, FO2, FO3, FO4, FO5, FB6, FB7, FB8, FB9,
FB12, FB13
69 P. infestans 46,4 3% 100,00% 0,0103372
C3, C5, U1, U5, FO1,
FO2, FO3, FO4, FO5, FB6, FB7,
FB9, FB12, FB13
524 P. cinnamomi 44,6 3% 100,00% 0,0361808 U1, U5, FO1, FO4
761 P. capsici 45,5 3% 96,30% 0,0344722 U3, FO4, FB13
1167 P. cinnamomi 89,1 4% 100,00% 0,0284723 U4, FO3 1392 P. cambivora 1574 61% 98,98% 0 U3, FO2 2078 P. cambivora 1149 76% 99,06% 0 FO4, FB8 2634 P. cinnamomi 91,8 11% 100,00% 0,00085153 FB10 3145 P. cambivora 706 57% 98,50% 0 FB8 3545 P. cambivora 1240 81% 97,65% 0 FB8 3702 P. cambivora 1769 42% 97,66% 0 U3, U5
4396 P. cambivora 1626 55% 99,89% 0 C3, C4, C5, U5, FO2,
FB9 4664 P. cambivora 1157 78% 98,62% 0 FB8 4897 P. citricola 1606 57% 99,76% 0 U1 5446 P. cambivora 1589 70% 98,45% 0 C4, C5

41
Appendix 4: Mean values and SD (n=3) of soil microbial community profiling after 96 h of incubation
Sample ID Time (h) AWCD R (Richness) H'Diversity) E (Evenness)
FB6 96 0,21 (+-0,04) 20 (+-7,64) 2,95 (+-0,47) 0,98 (+-0,02)
FB12 96 0,13 (+-0,01) 5 (+-2,52) 1,59 (+-0,43) 0,99 (+-0,02)
FO1 96 0,19 (+-0,04) 20 (+-4,16) 2,97 (+-0,28) 0,99 (+- 0,00)
FO2 96 0,48 (+-0,03) 24 (+-2,31) 3,09 (+-0,10) 0,97 (+-0,00)
U1 96 0,38 (+-0,05) 27 (+-3,51) 3,22 (+-0,14) 0,98 (+-0,00)