Occurrence of gas phase ammonia in the area of Beijing (China)
17
Atmos. Chem. Phys., 10, 9487–9503, 2010 www.atmos-chem-phys.net/10/9487/2010/ doi:10.5194/acp-10-9487-2010 © Author(s) 2010. CC Attribution 3.0 License. Atmospheric Chemistry and Physics Occurrence of gas phase ammonia in the area of Beijing (China) A. Ianniello 1 , F. Spataro 1 , G. Esposito 1 , I. Allegrini 1 , E. Rantica 1 , M. P. Ancora 1 , M. Hu 2 , and T. Zhu 2 1 CNR – Institute of Atmospheric Pollution Research, Via Salaria Km 29.3, CP10, 00015 Monterotondo S., Rome, Italy 2 State Key Joint Laboratory for Environmental Simulation and Pollution Control, College of Environmental Sciences and Engineering, Peking University, Beijing, China Received: 6 May 2010 – Published in Atmos. Chem. Phys. Discuss.: 9 June 2010 Revised: 10 September 2010 – Accepted: 26 September 2010 – Published: 7 October 2010 Abstract. The atmospheric concentrations of gaseous am- monia have been measured during two field campaigns in the winter and in the summer of 2007 at Beijing (China). These measurements were carried out by means of diffusion annu- lar denuders coated with phosphorous acid. The results were discussed from the standpoint of temporal and diurnal vari- ations and meteorological effects. The daily average NH 3 concentrations were in the range of 0.20–44.38 μg/m 3 and showed regular temporal variations with higher concentra- tions during summer and with lower during winter. The tem- poral trends seemed to be largely affected by air temperature because of agricultural sources. No diurnal variability was observed for gaseous NH 3 levels in both winter and sum- mer seasons. The highest ammonia value of 105.67 μg/m 3 was measured in the early morning during the summer pe- riod when stable atmospheric conditions occurred. The di- urnal winter and summer trends of ammonia showed a weak dependence on the air temperature and they were affected nearly by wind direction suggesting regional and local source influences. Ammonia was also correlated with the atmo- spheric mixing in the boundary layer, and, with NO x , CO and PM 2.5 air concentrations supporting the hypothesis that the traffic may be also an important source of ammonia in Beijing. 1 Introduction Gaseous ammonia (NH 3 ) is the third most abundant nitrogen containing compound and is the primary alkaline trace gas in the atmosphere. The importance of ammonia in urban areas is related to its role as a precursor for secondary aerosols Correspondence to: A. Ianniello ([email protected]) (Erisman and Schaap, 2004). It neutralizes atmospheric acids such as nitric acid (HNO 3 ), hydrochloric acid (HCl) and sulphuric acid (H 2 SO 4 ), formed by oxidation of nitro- gen oxides (NO x ) and sulphur dioxide (SO 2 ), respectively (Krupa, 2003), thereby affecting the acidity of cloud water and aerosols (Heeb et al., 2006; Roelle and Aneja, 2002). The reaction rates for NH 3 depend on the acid concentra- tion, humidity and temperature. The main chemical sink for ammonia in the atmosphere is the reaction with H 2 SO 4 , yielding ammonium sulphate [(NH 4 ) 2 SO 4 ] and ammonium bisulphate [NH 4 HSO 4 ] salts. Reactions with HNO 3 and HCl yield ammonium nitrate (NH 4 NO 3 ) and ammonium chloride (NH 4 Cl) salts in particulate phase. These NH + 4 aerosols con- tribute significantly to fine particle mass (size <2.5 μm) and have implications for human health (Brunekreef and Holgate, 2002). They limit atmospheric visibility and alter global ra- diation budgets (Horvat, 1992; Sutton et al., 1994). The most recent consideration for NH 3 emissions on the global scale is linked to climate change based on its abil- ity to form PM 2.5 , specifically ammonium sulphates. These aerosols can possibly increase the earth’s albedo. Particles can either backscatter UV and visible radiation directly, re- ducing the amount that reaches the earth’s surface, or indi- rectly by increasing cloud cover due to increased numbers of cloud condensation nuclei, particles that give rise to cloud formation (Sutton et al., 2004). NH 3 has a relatively short residence time of about 1 to 5 d. When airborne, it is ei- ther readily converted to ammonium aerosols, due to their ex- tended lifetime (about 1–15 d), these particles may be trans- ported far from the pollutant sources (Aneja et al., 2001; Krupa, 2003) causing effects to sensitive ecosystems with consequent changes in soil, plant and animal communities (Sutton et al., 1993; Fangmeier et al., 1994). In fact, after deposition, NH + 4 aerosols can contribute to acidification and eutrophication of these habitats. Thus, since NH 3 is either readily converted to NH + 4 or subjected to dry deposition, high Published by Copernicus Publications on behalf of the European Geosciences Union.
Transcript of Occurrence of gas phase ammonia in the area of Beijing (China)

Atmos. Chem. Phys., 10, 9487–9503, 2010www.atmos-chem-phys.net/10/9487/2010/doi:10.5194/acp-10-9487-2010© Author(s) 2010. CC Attribution 3.0 License.
AtmosphericChemistry
and Physics
Occurrence of gas phase ammonia in the area of Beijing (China)
A. Ianniello1, F. Spataro1, G. Esposito1, I. Allegrini 1, E. Rantica1, M. P. Ancora1, M. Hu2, and T. Zhu2
1CNR – Institute of Atmospheric Pollution Research, Via Salaria Km 29.3, CP10, 00015 Monterotondo S., Rome, Italy2State Key Joint Laboratory for Environmental Simulation and Pollution Control, College of Environmental Sciencesand Engineering, Peking University, Beijing, China
Received: 6 May 2010 – Published in Atmos. Chem. Phys. Discuss.: 9 June 2010Revised: 10 September 2010 – Accepted: 26 September 2010 – Published: 7 October 2010
Abstract. The atmospheric concentrations of gaseous am-monia have been measured during two field campaigns in thewinter and in the summer of 2007 at Beijing (China). Thesemeasurements were carried out by means of diffusion annu-lar denuders coated with phosphorous acid. The results werediscussed from the standpoint of temporal and diurnal vari-ations and meteorological effects. The daily average NH3concentrations were in the range of 0.20–44.38 µg/m3 andshowed regular temporal variations with higher concentra-tions during summer and with lower during winter. The tem-poral trends seemed to be largely affected by air temperaturebecause of agricultural sources. No diurnal variability wasobserved for gaseous NH3 levels in both winter and sum-mer seasons. The highest ammonia value of 105.67 µg/m3
was measured in the early morning during the summer pe-riod when stable atmospheric conditions occurred. The di-urnal winter and summer trends of ammonia showed a weakdependence on the air temperature and they were affectednearly by wind direction suggesting regional and local sourceinfluences. Ammonia was also correlated with the atmo-spheric mixing in the boundary layer, and, with NOx, COand PM2.5 air concentrations supporting the hypothesis thatthe traffic may be also an important source of ammonia inBeijing.
1 Introduction
Gaseous ammonia (NH3) is the third most abundant nitrogencontaining compound and is the primary alkaline trace gas inthe atmosphere. The importance of ammonia in urban areasis related to its role as a precursor for secondary aerosols
Correspondence to:A. Ianniello([email protected])
(Erisman and Schaap, 2004). It neutralizes atmosphericacids such as nitric acid (HNO3), hydrochloric acid (HCl)and sulphuric acid (H2SO4), formed by oxidation of nitro-gen oxides (NOx) and sulphur dioxide (SO2), respectively(Krupa, 2003), thereby affecting the acidity of cloud waterand aerosols (Heeb et al., 2006; Roelle and Aneja, 2002).The reaction rates for NH3 depend on the acid concentra-tion, humidity and temperature. The main chemical sinkfor ammonia in the atmosphere is the reaction with H2SO4,yielding ammonium sulphate [(NH4)2SO4] and ammoniumbisulphate [NH4HSO4] salts. Reactions with HNO3 and HClyield ammonium nitrate (NH4NO3) and ammonium chloride(NH4Cl) salts in particulate phase. These NH+
4 aerosols con-tribute significantly to fine particle mass (size<2.5 µm) andhave implications for human health (Brunekreef and Holgate,2002). They limit atmospheric visibility and alter global ra-diation budgets (Horvat, 1992; Sutton et al., 1994).
The most recent consideration for NH3 emissions on theglobal scale is linked to climate change based on its abil-ity to form PM2.5, specifically ammonium sulphates. Theseaerosols can possibly increase the earth’s albedo. Particlescan either backscatter UV and visible radiation directly, re-ducing the amount that reaches the earth’s surface, or indi-rectly by increasing cloud cover due to increased numbersof cloud condensation nuclei, particles that give rise to cloudformation (Sutton et al., 2004). NH3 has a relatively shortresidence time of about 1 to 5 d. When airborne, it is ei-ther readily converted to ammonium aerosols, due to their ex-tended lifetime (about 1–15 d), these particles may be trans-ported far from the pollutant sources (Aneja et al., 2001;Krupa, 2003) causing effects to sensitive ecosystems withconsequent changes in soil, plant and animal communities(Sutton et al., 1993; Fangmeier et al., 1994). In fact, afterdeposition, NH+4 aerosols can contribute to acidification andeutrophication of these habitats. Thus, since NH3 is eitherreadily converted to NH+4 or subjected to dry deposition, high
Published by Copernicus Publications on behalf of the European Geosciences Union.

9488 A. Ianniello et al.: Occurrence of gas phase ammonia in the area of Beijing (China)
concentrations are expected only close to the surface and nearto emission sources (Ferm, 1998). Although the main sourceof atmospheric ammonia is agriculture, other sources includeindustries, landfills, household products, biomass burning,motor vehicles, and wild animals.
Only few studies on ammonia emissions in China areavailable. The total NH3 emission from China are estimatedto be about two to three times higher than European and USemissions over the period of 1990 to 2005 (Klimont, 2001;Zhao and Wang, 1994; EMEP, 2009; USEPA, 2009; Reis etal., 2009). About 80% of NH3 emission in China is fromagriculture. In China, the biggest contributors are livestock(which contributes about 30%–60%) and the application ofnitrogenous fertilizer (which contributes about 17%–47%),followed by 20% for energy, 1% for poultry and 2.5% forhuman beings (Zhao and Wang, 1994; Oliver et al., 1998;Streets et al., 2003; He et al., 2007). However, estimations ofNH3 emissions have only been started relatively recently andstill contain many uncertainties (Bouwman et al., 1997; Bat-tye et al., 2003; Goebes et al., 2003). The characteristics ofagricultural sources determine the temporal and spatial NH3distribution in many locations. The ammonia concentrationin northern cities of China is relatively high during the springand summer period due to farming, while in southern citiesno obvious seasonal variation occurs because farmland is ex-tended during all four seasons.
In addition to NH3 emissions, the relative humidity, thetemperature, and the insulation are also important factors in-fluencing the formation, temporal and spatial distribution ofsecondary particles. According to studies of the ammonialevel in China, in Beijing, some research has shown that theconcentration of secondary particles are higher in the win-ter probably due to the high SO2 emissions and low windspeed, which aid the formation of SO2−
4 . Another study hasshown that summer has the highest secondary particle con-centration, because of the large NH3 emissions and sufficienttemperature and humidity to ensure the oxidation of SO2 toSO2−
4 (He et al., 2001, 2002).The contribution of vehicles to non-agricultural NH3 emis-
sions has been considered to be negligible up to 1995 (Sut-ton et al., 1995). Recent studies, however, show that ammo-nia concentration in urban environments has also increaseddue to over-reduction of nitrogen oxide compounds in cat-alytic converters in automobiles exhaust and industrial andpower station emission abatement technology (Sutton et al.,2000). From measurements in a roadway tunnel, Fraser andCass (1998) concluded that the contribution of motor vehicleemissions had risen from 2% to 15% of the total ammoniaemission in the Los Angeles area since the introduction ofcatalysts. Road side measurements in the UK, in the USAand Europe have shown strong links between ammonia emis-sions and traffic (Kean et al., 2000; Kirchner et al., 2002;Perrino et al., 2002; Cape et al., 2004). Perrino et al. (2002)found a close link between ammonia and CO emissions in aseries of experiments conducted in Rome. These results in-
dicated that petrol-engine vehicles constitute a major sourceof urban ammonia.
There have been a number of studies of urban ammo-nia concentrations in recent years. Long-term measurementshave shown strong daily and seasonal variations in ammoniaconcentrations which depend mainly on temperature, rela-tive humidity (RH), rainfall, and wind speed (Yamamoto etal., 1988, 1995; D. S. Lee et al., 1999; Bari et al., 2003; Vogtet al., 2005). Bimodal diurnal variations in NH3 concentra-tions with peaks occurring during periods of peak traffic havebeen observed in some studies (Kirchner et al., 2002; Perrinoet al., 2002; Li et al., 2006), confirming vehicles as a signif-icant source of NH3. Data about ammonia concentrations inthe urban areas of China, especially of Beijing, are very rare.Median ammonia concentrations ranged from 20 to 1 ppb ona monthly basis according to measurements carried out inAsia (Carmichael et al., 2003). Yao et al. (2003) measuredNH3 concentrations in Beijing in summer 2001 and spring2002. The concentrations were found from 4.6 to 42.4 µg/m3
with the highest concentration detected in July. Recent real-time measurements of ammonia were conducted in the PearlRiver Delta, China, from 4 October to 4 November 2004 (Huet al., 2008). During this study the average concentration ofNH3 was 7.3 µg/m3.
With increasing concern over the potential environmentaldamage caused by atmospheric transport and subsequent de-position of NH3, it is very important to have reliable methodsto accurately monitor its pollution level and emission pattern.Such information may then be used effectively to develop po-tential abatement strategies for NH3.
Sampling of NH3 is difficult because it is easily adsorbedon surfaces and is difficult to separate and discriminate fromvolatile ammonium salts. Annular denuder techniques areconsidered to be able to overcome these critical sources oferror. In general, such systems are designed with a verti-cally positioned denuder tube to eliminate the sedimentationof particles (Possanzini et al., 1983; Allegrini et al., 1987,1999; Febo et al., 1989; Perrino et al., 1990). This samplingtechnique is able to accurately determine gaseous ammoniaand particulate ammonium without disturbing the partitionexisting in the atmosphere at the time of the sampling andwithout mutual interferent (Perrino et al., 1999, 2002).
We report in this paper the results of some measurementsof ammonia concentrations carried out during 2007 in Bei-jing, China, by using annular denuder based methods. Thedata are analyzed and presented here to investigate the dailyand seasonal variations in ammonia concentrations and alsoto examine the contribution of traffic to ammonia levels inBeijing. The study is a part of a Sino-Italian collaborationproject (Blue Sky of Beijing: Research on Regional Air Pol-lution Project) and also part of the international collabora-tive research CAREBEIJING (Campaigns of Air Quality Re-search in Beijing and Surrounding Region).
Atmos. Chem. Phys., 10, 9487–9503, 2010 www.atmos-chem-phys.net/10/9487/2010/

A. Ianniello et al.: Occurrence of gas phase ammonia in the area of Beijing (China) 9489
2 Experimental
Measurements were carried out in the campus of Peking Uni-versity (PKU), located at North of Beijing (39◦59′23′′ N,116◦18′19′′ E), not very far from Olympic sites in winter,from 23 January to 14 February 2007, and in summer, from2 to 31 August 2007. The atmospheric ammonia concentra-tions were determined by means annular diffusion denuderscoated with a solution of 1% phosphorous acid in 1:9 wa-ter and ethanol (Perrino and Gherardi, 1999) on a 24-h basisstarting at midnight. The air samples on a 2-h basis (inten-sive measurements) were also carried out on 9–10 Februaryduring the winter period and on 13–15 and 17–21 Augustduring the summer period. Problems occurred on 9 Febru-ary between 10:00 and 12:00 in the morning and on 19 Au-gust between 22:00 and 00:00, thus data from these eventswere not considered. The annular denuder sampling methodand the analytical procedures were described in several pastworks (Possanzini et al., 1983; Allegrini et al., 1987, 1999;Febo et al., 1989; Perrino et al., 1990, 2001a; Beine et al.,2001; Ianniello et al., 2002).
After collection, the denuders and filters were extractedand samples were analyzed within 24-h by using Ion Chro-matography (IC) (Dionex DX 120 connected with autosam-pler DX AS50 for anions and DX ICS90 connected with au-tosampler DX AS40 for cations).
The individual annular denuders placed at PKU site aremade of Pyrex glass, 21 cm in length, 3.0 and 3.3 cm in an-nulus diameter. The sampling flow rate was 15 l/min. Thesampling volume was about 23.10 m3 for a 24-h samplingperiod. In these operative conditions the collection efficiencyfor ammonia was higher than 99% and the detection limit,based on three times the standard deviations of field blanks,was 0.06 µg/m3 for a sampling time of 24 h. Precision ofthese measurements was 1.22%.
Although the focus of this paper is on atmospheric ammo-nia, the denuder system also sampled other gaseous as wellas particulate species. In fact, the denuder line consisted oftwo sodium fluoride coated denuders for the simultaneouscollection of HCl and HNO3, followed by two sodium car-bonate coated denuders for the collection of HONO and SO2.A fifth denuder in the line is coated with phosphorous acidfor the collection of NH3. Downstream of the denuder train acyclone collects coarse particles (>2.5 µm of cut size at flowrate of 15 l/min), while fine particles (<2.5 µm at flow rate of15 l/min) are collected on a filter pack set in series. The filterpack consisted of one Teflon filter, one Nylon filter, and onepaper filter impregnated with phosphorous acid. The last twoback-up filters were used to measure the volatile ammoniumsalts indicated with term of evolved salts. The particulatechloride, nitrate, sulphate, sodium, ammonium, potassium,magnesium and calcium coarse and fine fractions were mea-sured and analyzed.
Information about the mixing properties of the lowerboundary layer was obtained by means of a Stability Monitor
(OPSIS SM200) during the summer period. This instrumentcollects atmospheric particles and determines their short liferadioactivity due to Radon decay products, providing 1-h in-terval radioactivity data. From the study of the temporaltrend of natural radioactivity and of its time derivative onecan gather important information about the mixing proper-ties of the lower atmosphere and about its ability to diluteatmospheric pollutants (Perrino et al., 2001b).
3 Results and discussion
3.1 Temporal variation
The temporal patterns of gaseous ammonia determined bymeans of the diffusion lines in the winter and summer periodsare reported in Fig. 1. Table 1 shows summary statistics forNH3 concentrations (µg/m3) and air temperature (T ) values(◦C) measured during the two sampling periods in Beijing.
The temporal variations are evaluated applying the pairedt-test to determine the significance at the 0.05 level (p ≤
0.05) of differences among the mean of components by ex-amining the amount of variation between the samples. NH3exhibited a distinct and significant (p < 0.001) temporal vari-ation with higher concentrations in summer than in winter(Fig. 1). This difference in NH3 concentrations has also beenobserved by other papers and is in agreement with the tem-perature dependence of NH3 emissions from animal waste,natural and fertilized soils, and vegetations (Langford andFehsenfeld, 1992; Langford et al., 1992; Yamamoto et al.,1995; Asman et al., 1998; Lefer et al., 1999; Aneja et al.,2000; Robarge et al., 2002; Pryor et al., 2001), which are atlow values during winter. The characteristics of these sourcesdetermine the temporal and spatial NH3 distribution. Sourcestrength and removal efficiency can explain the seasonal vari-ations of NH3 concentrations. In summer, high temperatureswill favor ammonia volatilization from urea and/or ammo-nium bicarbonate applied to crops. High temperatures insummer will also favour NH3 emission from other sources,such as animal housing, landfill, laystalls and farmers’ toi-lets, animal manure, natural and fertilized soils, and vegeta-tion. Therefore, atmospheric ammonia concentrations werehighest in summer at Beijing site. Thus, in agreement withpast studies, higher ammonia emissions occurred when airtemperature increased, suggesting intense local sources forNH3 during the summer season at Beijing.
3.2 Diurnal variation
3.2.1 Winter
During the intensive measurements at PKU in Beijing, thewind speed reached a maximum value of 8.8 m/s on 9 Febru-ary at 14:00 and the wind blew mainly from northwest,southwest and southeast (Fig. 2). The air temperature in-creased at 08:00 reaching maxima values between 12:00 and
www.atmos-chem-phys.net/10/9487/2010/ Atmos. Chem. Phys., 10, 9487–9503, 2010

9490 A. Ianniello et al.: Occurrence of gas phase ammonia in the area of Beijing (China)
0
5
10
15
20
25
30
35
40
45
50
2301
2501
2701
2901
3101
0202
0402
0602
0802
1002
1202
1402
0308
0508
0708
0908
1108
1308
1508
1708
1908
2108
2308
2508
2708
2908
3108
DAY
NH
3 ( µµ µµ
g/m
3 )
-5
0
5
10
15
20
25
30
35
T (
°C)
NH3 T
Winter Summer
Fig. 1. Temporal trend of ammonia during the winter and summercampaigns at Beijing.
14:00 of about 13.98◦C. In addition, the solar radiation alsoreached higher values of about 13 W/m2 on 9–10 February at13:00 while the relative humidity decreased during all the in-tensive measurements starting on 9 February at 06:00 in themorning.
The mean level of ammonia within± one standard devia-tion for the entire data (N = 23) was 5.22± 3.75 µg/m3. Am-monia hardly showed any diurnal variation in winter period(Fig. 3), in agreement with past studies (Lefer et al., 1999;Danalatos and Glavas, 1999; Walker et al., 2004). Data weregrouped into sunrise (between 06:00 and 18:00) and sunset(between 18:00 and 06:00) times. On applyingt test to dayand night samples, diurnal variation was not found to be sta-tistically significant (p = 0.18). Having a short lifetime ofabout one day, ammonia would be expected to peak in themiddle of the day as higher emissions are expected in thatpart of the day. This occurred on 9 and 10 February between08:00 and 10:00 but higher ammonia emissions occurred alsoin other periods of the day, as measured after sunset andnight, during the intensive measurements. Night time highammonia levels can be attributed to stable atmosphere duringthe night time (Cadle et al., 1982; Perrino et al., 2002) whilethe higher mixing height in the middle of the day balancedthe higher ammonia emissions resulting in little diurnal vari-ation (Singh et al., 2001).
Since NH3 is either readily converted to NH+4 or subjectedto dry deposition, high concentrations are found only closeto the surface and near to emission sources (Ferm, 1998;Krupa, 2003). Thus, NH3 concentrations might be gener-ally lower at higher wind speeds because of turbulent diffu-sion. Previous studies have reported an inverse relationshipbetween ground-level concentrations of trace gases, such asammonia, and wind speed (Katsoulis, 1996; D. S. Lee et al.,1999; Robarge et al., 2002). This inverse relationship be-tween natural-log transformed NH3 concentrations and windspeeds (Robarge et al., 2002) did not occur at significant level(R2 = 0.18,p <0.001) considering concentrations measured
Table 1. Statistics for NH3 andT during the winter and summercampaigns at PKU site.
Winter SummerNH3 (µg/m3) T (◦C) NH3 (µg/m3) T (◦C)
N of cases 23 23 30 30Minimum 0.20 −0.71 14.87 22.19Maximum 14.08 8.06 44.38 32.37Median 5.12 3.05 24.33 28.80Mean 5.47 3.51 25.39 28.27Standard Dev 3.75 2.88 6.91 2.46
only on 9 February 2007. In addition, highest NH3 concen-trations were also associated with low wind speeds duringthis day.
Besides, the diurnal pattern of ammonia did not showa clear and well-defined temperature and humidity depen-dence during the winter field campaign, as observed else-where (Langford and Fehsenfeld, 1992; Yamamoto et al.,1995; Burkhardt et al., 1998; Horvath and Sutton, 1998;Pryor et al., 2001; Olszyna et al., 2005; Vogt et al., 2005).This may reflect the influence of other factors, such as localsources and wind direction, in determining ambient concen-trations of NH3 (Burkhardt et al., 1998; Huber and Kreutzer,2002; Vogt et al., 2005). However, a weak but significantlinear correlation (R2 = 0.32,p = 0.01) can be obtained be-tween NH3 and air temperature considering ammonia con-centrations measured from 12:00 on 9 February, when theair temperature reached maxima values (12:00–16:00 on twodays), to the end of intensive measurements on 10 February.This weak temperature dependence of NH3 reflects the smallinfluence of the emission sources from agricultural activitywhich increase as the temperature rises. Ammonia emis-sions from animal manure, natural and fertilized soils, andvegetation will increase with temperature owing to the tem-perature dependency of aqueous-phase partitioning betweenNH3 and NH+
4 in these systems, as well as the atmosphericequilibrium between NH3 with volatile ammonium nitrate.In fact, during this period the winds came principally fromnorthwest direction (73%) (Fig. 2b) coinciding with the di-rection of agricultural areas such as Xibeiwang and Chang-ping District which are located at the northwest suburb ofsampling site (Shen et al., 2009; Zhang et al., 2010). Thetemperature dependence of NH3 disappeared from 00:00 to12:00 on 9 February with prevailing winds from southeastand southwest (60%) (Fig. 2a) and lower temperatures. Thisdifferent behaviour may be explained from prevalence of lo-cal sources, such as traffic emissions, in determining the at-mospheric NH3 concentrations during this period.
While agriculture is the main source of atmospheric am-monia in Beijing, the contribution of vehicles, equippedwith catalytic converters, especially since the introductionof three-way-catalysts, to non-agricultural NH3 emissions
Atmos. Chem. Phys., 10, 9487–9503, 2010 www.atmos-chem-phys.net/10/9487/2010/

A. Ianniello et al.: Occurrence of gas phase ammonia in the area of Beijing (China) 9491
(a)
0
10
20
30
40
10 20 30 40
N
NE
E
SE
S
SW
W
NW
Wind speed (m*s-1
)0 - 2.5 2.5 - 5 5 - 7.5 7.5+
(b)
0
10
20
30
40
50
60
10 20 30 40 50 60
N
NE
E
SE
S
SW
W
NW
Wind speed (m*s-1
)0 - 2.5 2.5 - 5 5 - 7.5 7.5+
Fig. 2. Wind plots showing the frequency distributions of wind di-rections and speeds (grey scale) of the intensive winter measure-ments for two days: on 9 February(a) and 10 February(b). Theradius axis represents the occurrence from 0% to 40% and from 0%to 60%, respectively.
has recently been considered and might be the most im-portant factor influencing ammonia concentrations at urbanlocations and near roads (Sutton et al., 2000; Kean et al.,2000; Heeb et al., 2008). Also Beijing city is configuredsuch that it is served by several ring roads with heavy traf-fic (Fig. 4). Figure 4 shows Beijing city, measurement siteand surrounding regions, where are the major NH3 emissionsources. Therefore, in order to examine the contribution oftraffic to NH3 concentrations it may be useful to compare theammonia concentrations with those of primary non-reactivepollutants mainly emitted by motor-vehicle exhausts (Per-
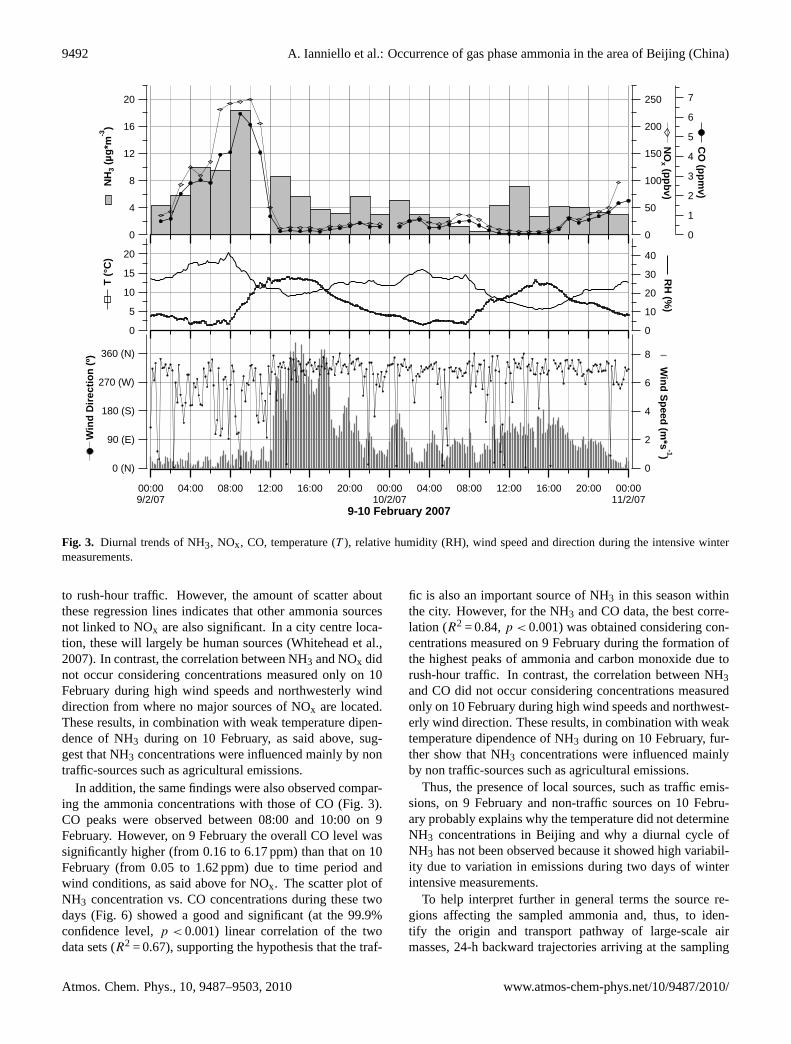
rino et al., 2002), such as nitrogen oxides (NOx) and carbonmonoxide (CO), throughout this winter period. The time se-ries of NH3, NOx, CO, wind direction, wind speed, tempera-ture and relative humidity are shown in Fig. 3. Both CO andNOx are commonly used as traffic emission indicators (He etal., 2002; Meng et al., 2008; Chak and Yao, 2008). Hao etal. (2005) estimated that the emissions in Beijing from vehi-cles, power plants, and industries in 1999 accounted for 35%,27% and 26% in the total local NOx emissions, respectively.They found that 74% of the ground NOx was due to vehicu-lar emissions while power plants and industrial sources onlycontributed 2% and 13%, respectively. In addition, in Beijingand Guangzhou, automobile pollution contribution in termsof CO was estimated to be more than 80% with two peakvehicle pollution levels occurring during each day, one fromabout 08:00–10:00 and the other from 15:00–17:00 duringthe rush hours (Hao et al., 2000).
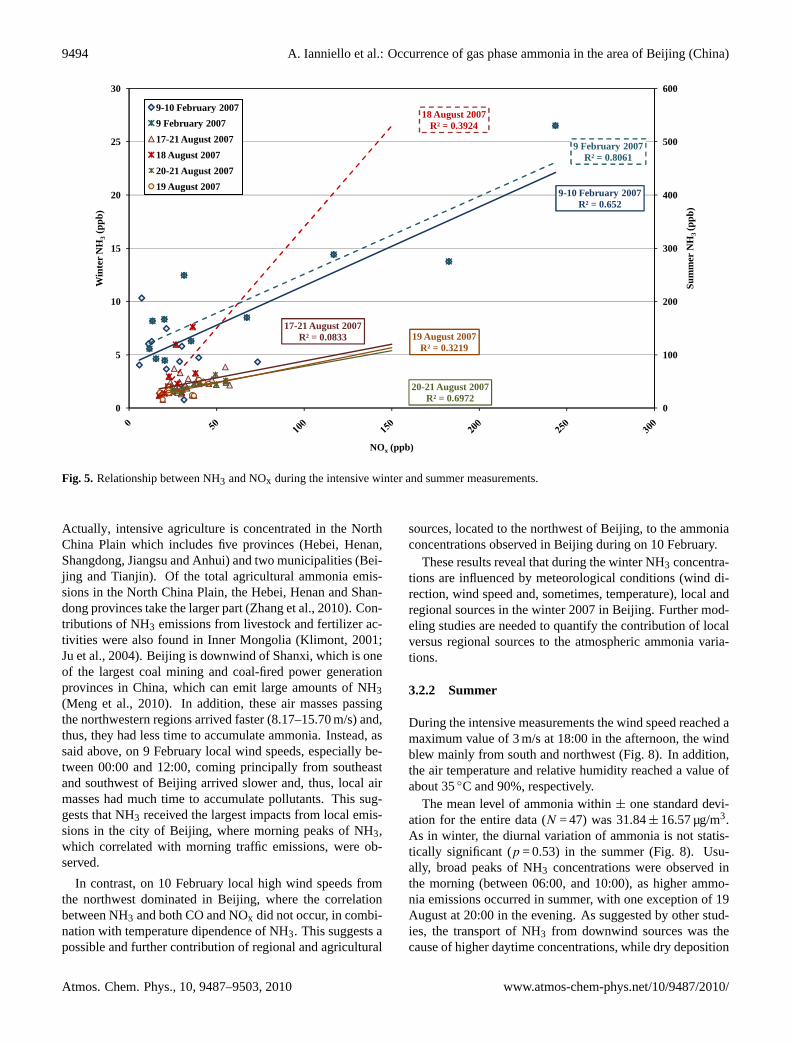
NOx peaks were observed between 08:00 and 12:00 on 9February (Fig. 3). Wind from the southeast and southwestwas dominant at the sampling site on 9 February, while windfrom the northwest dominated on 10 February. Wind speedson 9 and 10 February ranged from 0.02 to 8.85 m/s andfrom 0.06 to 4.10 m/s, respectively. However, on 9 Febru-ary the overall NOx level was significantly higher (from11.60 to 243.55 ppb) than that on 10 February (from 5.85 to73.40 ppb). The locations of the major NOx sources, includ-ing local roads (motor vehicles), expressways, and powerplants, which are six and principally coal-fired in Beijing,are located from the east to the southwest of the samplingsite (Lee et al., 2009). Thus, the weak wind speeds be-tween 00:00 and 12:00 (0.02–1.53 m/s) and southeasterly andsouthwesterly wind directions on 9 February, in combinationwith the locations of the sources of NOx emissions, resultedin higher NOx concentrations between 08:00 and 12:00 dueto emissions from Friday traffic during this daytime. In-stead, the high wind speeds (0.30–3.83 m/s) and northwest-erly wind direction on 10 February resulted in lower NOxconcentrations at the sampling site. In fact, NOx concen-tration was about 31.55 ppb at 08:00 on 10 February, whichis about eight times lower than that recorded at the sametime of day on 9 February (243.55 ppb). These differencesin NOx concentrations between two days might reflect thecharacteristic of Friday traffic (on 9 February) and the windconditions, which were marked by low winds and prevailingwind direction from the center of Beijing toward the sam-pling site (60% from southeast and southwest). The scatterplot of NH3 concentrations vs. NOx concentrations duringthese two days (Fig. 5) showed a good and significant (atthe 99.9% confidence level,p < 0.001) linear correlation ofthe two data sets (R2 = 0.65), supporting the hypothesis thatthe traffic is also an important source of NH3 in this seasonwithin the city. However, for the NH3 and NOx data, the bestcorrelation (R2 = 0.80,p < 0.001) was obtained consideringconcentrations measured on 9 February during the formationof the highest peaks of ammonia and nitrogen oxides due
www.atmos-chem-phys.net/10/9487/2010/ Atmos. Chem. Phys., 10, 9487–9503, 2010
9492 A. Ianniello et al.: Occurrence of gas phase ammonia in the area of Beijing (China)
20
16
12
8
4
0
NH
3 (µ
g*m
-3)
00:009/2/07
04:00 08:00 12:00 16:00 20:00 00:0010/2/07
04:00 08:00 12:00 16:00 20:00 00:0011/2/07
9-10 February 2007
8
6
4
2
0
Win
d S
peed
(m*s
-1)
0 (N)
90 (E)
180 (S)
270 (W)
360 (N)
Win
d D
irec
tio
n (
º)250
200
150
100
50
0
NO
x (pp
bv)
7
6
5
4
3
2
1
0
CO
(pp
mv)
20
15
10
5
0
T (
°C)
40
30
20
10
0
RH
(%)
Fig. 3. Diurnal trends of NH3, NOx, CO, temperature (T ), relative humidity (RH), wind speed and direction during the intensive wintermeasurements.
to rush-hour traffic. However, the amount of scatter aboutthese regression lines indicates that other ammonia sourcesnot linked to NOx are also significant. In a city centre loca-tion, these will largely be human sources (Whitehead et al.,2007). In contrast, the correlation between NH3 and NOx didnot occur considering concentrations measured only on 10February during high wind speeds and northwesterly winddirection from where no major sources of NOx are located.These results, in combination with weak temperature dipen-dence of NH3 during on 10 February, as said above, sug-gest that NH3 concentrations were influenced mainly by nontraffic-sources such as agricultural emissions.
In addition, the same findings were also observed compar-ing the ammonia concentrations with those of CO (Fig. 3).CO peaks were observed between 08:00 and 10:00 on 9February. However, on 9 February the overall CO level wassignificantly higher (from 0.16 to 6.17 ppm) than that on 10February (from 0.05 to 1.62 ppm) due to time period andwind conditions, as said above for NOx. The scatter plot ofNH3 concentration vs. CO concentrations during these twodays (Fig. 6) showed a good and significant (at the 99.9%confidence level,p < 0.001) linear correlation of the twodata sets (R2 = 0.67), supporting the hypothesis that the traf-
fic is also an important source of NH3 in this season withinthe city. However, for the NH3 and CO data, the best corre-lation (R2 = 0.84,p < 0.001) was obtained considering con-centrations measured on 9 February during the formation ofthe highest peaks of ammonia and carbon monoxide due torush-hour traffic. In contrast, the correlation between NH3and CO did not occur considering concentrations measuredonly on 10 February during high wind speeds and northwest-erly wind direction. These results, in combination with weaktemperature dipendence of NH3 during on 10 February, fur-ther show that NH3 concentrations were influenced mainlyby non traffic-sources such as agricultural emissions.
Thus, the presence of local sources, such as traffic emis-sions, on 9 February and non-traffic sources on 10 Febru-ary probably explains why the temperature did not determineNH3 concentrations in Beijing and why a diurnal cycle ofNH3 has not been observed because it showed high variabil-ity due to variation in emissions during two days of winterintensive measurements.
To help interpret further in general terms the source re-gions affecting the sampled ammonia and, thus, to iden-tify the origin and transport pathway of large-scale airmasses, 24-h backward trajectories arriving at the sampling
Atmos. Chem. Phys., 10, 9487–9503, 2010 www.atmos-chem-phys.net/10/9487/2010/
A. Ianniello et al.: Occurrence of gas phase ammonia in the area of Beijing (China) 9493
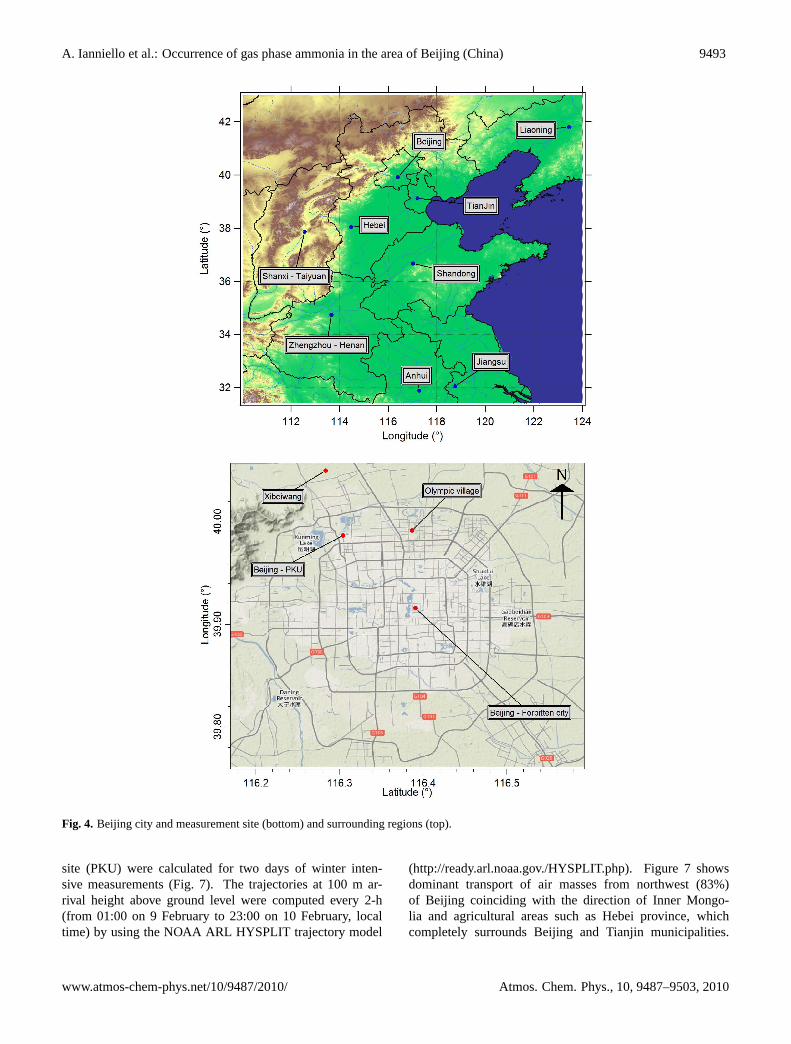
Fig. 4. Beijing city and measurement site (bottom) and surrounding regions (top).
site (PKU) were calculated for two days of winter inten-sive measurements (Fig. 7). The trajectories at 100 m ar-rival height above ground level were computed every 2-h(from 01:00 on 9 February to 23:00 on 10 February, localtime) by using the NOAA ARL HYSPLIT trajectory model
(http://ready.arl.noaa.gov./HYSPLIT.php). Figure 7 showsdominant transport of air masses from northwest (83%)of Beijing coinciding with the direction of Inner Mongo-lia and agricultural areas such as Hebei province, whichcompletely surrounds Beijing and Tianjin municipalities.
www.atmos-chem-phys.net/10/9487/2010/ Atmos. Chem. Phys., 10, 9487–9503, 2010
9494 A. Ianniello et al.: Occurrence of gas phase ammonia in the area of Beijing (China)
9-10 February 2007R² = 0.652
9 February 2007R² = 0.8061
17-21 August 2007R² = 0.0833
18 August 2007R² = 0.3924
20-21 August 2007R² = 0.6972
19 August 2007R² = 0.3219
0
100
200
300
400
500
600
0
5
10
15
20
25
30
Sum
mer
NH
3 (p
pb)
Win
ter N
H3
(ppb
)
NOx (ppb)
9-10 February 2007
9 February 2007
17-21 August 2007
18 August 2007
20-21 August 2007
19 August 2007
Fig. 5. Relationship between NH3 and NOx during the intensive winter and summer measurements.
Actually, intensive agriculture is concentrated in the NorthChina Plain which includes five provinces (Hebei, Henan,Shangdong, Jiangsu and Anhui) and two municipalities (Bei-jing and Tianjin). Of the total agricultural ammonia emis-sions in the North China Plain, the Hebei, Henan and Shan-dong provinces take the larger part (Zhang et al., 2010). Con-tributions of NH3 emissions from livestock and fertilizer ac-tivities were also found in Inner Mongolia (Klimont, 2001;Ju et al., 2004). Beijing is downwind of Shanxi, which is oneof the largest coal mining and coal-fired power generationprovinces in China, which can emit large amounts of NH3(Meng et al., 2010). In addition, these air masses passingthe northwestern regions arrived faster (8.17–15.70 m/s) and,thus, they had less time to accumulate ammonia. Instead, assaid above, on 9 February local wind speeds, especially be-tween 00:00 and 12:00, coming principally from southeastand southwest of Beijing arrived slower and, thus, local airmasses had much time to accumulate pollutants. This sug-gests that NH3 received the largest impacts from local emis-sions in the city of Beijing, where morning peaks of NH3,which correlated with morning traffic emissions, were ob-served.
In contrast, on 10 February local high wind speeds fromthe northwest dominated in Beijing, where the correlationbetween NH3 and both CO and NOx did not occur, in combi-nation with temperature dipendence of NH3. This suggests apossible and further contribution of regional and agricultural
sources, located to the northwest of Beijing, to the ammoniaconcentrations observed in Beijing during on 10 February.
These results reveal that during the winter NH3 concentra-tions are influenced by meteorological conditions (wind di-rection, wind speed and, sometimes, temperature), local andregional sources in the winter 2007 in Beijing. Further mod-eling studies are needed to quantify the contribution of localversus regional sources to the atmospheric ammonia varia-tions.
3.2.2 Summer
During the intensive measurements the wind speed reached amaximum value of 3 m/s at 18:00 in the afternoon, the windblew mainly from south and northwest (Fig. 8). In addition,the air temperature and relative humidity reached a value ofabout 35◦C and 90%, respectively.
The mean level of ammonia within± one standard devi-ation for the entire data (N = 47) was 31.84± 16.57 µg/m3.As in winter, the diurnal variation of ammonia is not statis-tically significant (p = 0.53) in the summer (Fig. 8). Usu-ally, broad peaks of NH3 concentrations were observed inthe morning (between 06:00, and 10:00), as higher ammo-nia emissions occurred in summer, with one exception of 19August at 20:00 in the evening. As suggested by other stud-ies, the transport of NH3 from downwind sources was thecause of higher daytime concentrations, while dry deposition
Atmos. Chem. Phys., 10, 9487–9503, 2010 www.atmos-chem-phys.net/10/9487/2010/

A. Ianniello et al.: Occurrence of gas phase ammonia in the area of Beijing (China) 9495
9-10 February 2007R² = 0.6723
9 february 2007R² = 0.8368
17-21 August 2007R² = 0.1846
18 August 2007R² = 0.7273
20-21 August 2007R² = 0.3263
19 August 2007R² = 0.6912
0
50
100
150
200
250
300
350
400
0
5
10
15
20
25
30
Sum
mer
NH
3 (p
pb)
Win
ter N
H3
(ppb
)
CO (ppb)
9-10 February 2007
9 February 2007
17-21 August 2007
18 August 2007
20-21 August 2007
19 August 2007
Fig. 6. Relationship between NH3 and CO during the intensive winter and summer measurements.
Fig. 7. Geographical map showing the 24-h backward trajecto-ries arriving at Beijing during the intensive winter measurements,reconstructed using the NOAA ARL HYSPLIT trajectory model(http://ready.arl.noaa.gov./HYSPLIT.php).
and conversion to aerosol may exceed the contribution fromtransport at night, resulting in higher concentrations duringthe day.
However, the highest ammonia concentrations were prin-cipally observed when the wind was from the northwestduring low wind conditions (Fig. 8), reflecting the largecontribution due to agricultural activity and fertilizer use.A moderate but significant linear correlation (R2 = 0.29,p < 0.001) was detected between natural-log transformedammonia concentrations and wind speeds (Robarge et al.,2002).
In addition, the diurnal pattern of ammonia did not showa clear and well-defined temperature dependence during thesummer field campaign, as it was in the winter. The tem-perature dependence of NH3 can be examined further byfiltering all the data by hours of day and, for only particu-lar hours during all days of intensive summer measurements(from 06:00 to 12:00 on 17 August, from 00:00 to 10:00 on18 August, from 02:00 to 10:00 on 19 August, from 02:00to 12:00 on 20 August, from 02:00 to 06:00 on 21 August),there is a weak but significant correlation between tempera-ture and NH3 concentration (at the 99.9% confidence level,R2 = 0.22,p = 0.03) with prevailing winds from northwest.As said for winter period, this weak temperature dependenceof NH3 reflects the influence of the emission sources fromagricultural activity coming from northwest suburb of Bei-jing (Shen et al., 2009; Zhang et al., 2010). The temperature
www.atmos-chem-phys.net/10/9487/2010/ Atmos. Chem. Phys., 10, 9487–9503, 2010

9496 A. Ianniello et al.: Occurrence of gas phase ammonia in the area of Beijing (China)
100
80
60
40
20
0
NH
3 (µ
g*m
-3)
NO
x (p
pb
v)
06:0017/8/07
12:00 18:00 00:0018/8/07
06:00 12:00 18:00 00:0019/8/07
06:00 12:00 18:00 00:0020/8/07
06:00 12:00 18:00 00:0021/8/07
06:00
17-21 August 2007
6500
4500
2500
Sta
bili
ty
(C
ou
nt*
min
-1)
4
3
2
1
0
Win
d S
peed
(m*s
-1)
0 (N)
90 (E)
180 (S)
270 (W)
360 (N)
Win
d D
irec
tio
n (
º)2.5
2.0
1.5
1.0
0.5
0.0
CO
(pp
mv)
240
160
80
0
PM
2.5 (µg
*m-3)
40
35
30
25
20
T (
°C)
80
60
40
20
0
RH
(%)
dat
Fig. 8. Diurnal trends of NH3, NOx, CO, PM2.5, temperature (T ), relative humidity (RH), wind speed and direction during the intensivesummer measurements.
dependence of NH3 disappeared for the other hours of everyday with prevailing winds from south and southwest. Thisdifferent behaviour may be explained from prevalence of lo-cal sources, such as traffic emissions, in determining the at-mospheric NH3 concentrations during this summer period.
The data in Fig. 8 show that NH3, CO and NOx had similartemporal patterns, but the correlations between these specieswere not good. A weak but significant linear correlation oc-curred between NH3 and CO (R2 = 0.18,p < 0.001) (Fig. 6)for all sampling period (17–21 August 2007). For the NH3and NOx data, this correlation did not occur (Fig. 5). How-ever, for the CO data, the best relationships with correlationcoefficients of 0.73 (p < 0.001), 0.69 (p = 0.03) and 0.33(p = 0.03) were obtained considering concentrations mea-sured only on 18, 19 and 20–21 August 2007, respectively,during the formation of the higher peaks of NH3 and CO sup-porting the hypothesis that the traffic is also a important mo-bile source of NH3. In addition, for the NOx data, the best re-
lationships with correlation coefficients of 0.39 (p < 0.001),0.32 (p = 0.03) and 0.70 (p = 0.001) were also obtained con-sidering concentrations measured for the same days, respec-tively, in correspondence with the highest concentrations ofNH3 and NOx. NOx and CO peaks were observed between06:00 and 10:00 during all days, in combination with north-westerly wind direction and low wind speeds (0.3–1.2 m/s).Winds from the south were dominant at the sampling site forthe other hours of day, in combination with the locations ofthe sources of NOx and CO emissions. However, the amountof scatter about these regression lines indicates that other am-monia sources not linked to NOx and CO are also significant.In addition, the correlations between NH3 and both NOx andCO were weaker than that in the winter, suggesting that other,non-traffic sources, became significant. The higher temper-atures in the summer will increase ammonia emission fromagricultural sources, resulting in the breakdown in the rela-tionship between these gases.
Atmos. Chem. Phys., 10, 9487–9503, 2010 www.atmos-chem-phys.net/10/9487/2010/
A. Ianniello et al.: Occurrence of gas phase ammonia in the area of Beijing (China) 9497
17-21 August 2007R² = 0.1742
18 August 2007R² = 0.7999
20-21 August 2007R² = 0.298
19 August 2007R² = 0.591
0
20
40
60
80
100
120S
umm
er N
H3
(µg/
m3 )
PM2.5 (µg/m3)
17-21 August 2007
18 August 2007
20-21 August 2007
19 August 2007
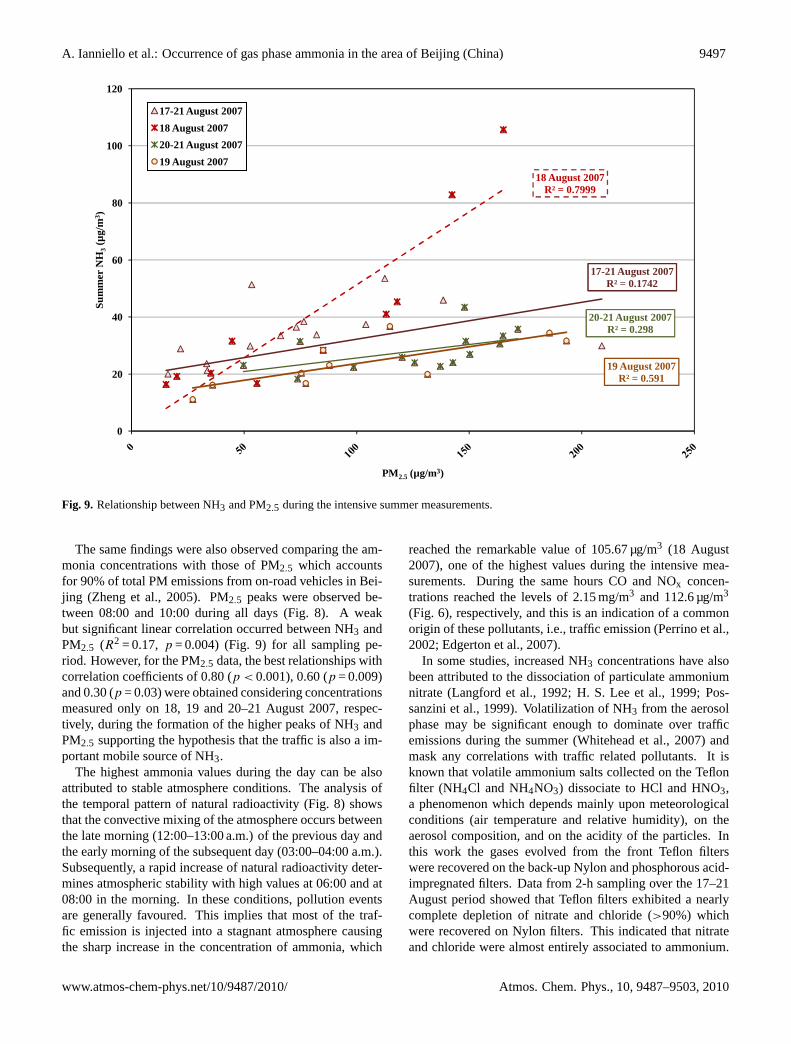
Fig. 9. Relationship between NH3 and PM2.5 during the intensive summer measurements.
The same findings were also observed comparing the am-monia concentrations with those of PM2.5 which accountsfor 90% of total PM emissions from on-road vehicles in Bei-jing (Zheng et al., 2005). PM2.5 peaks were observed be-tween 08:00 and 10:00 during all days (Fig. 8). A weakbut significant linear correlation occurred between NH3 andPM2.5 (R2 = 0.17, p = 0.004) (Fig. 9) for all sampling pe-riod. However, for the PM2.5 data, the best relationships withcorrelation coefficients of 0.80 (p < 0.001), 0.60 (p = 0.009)and 0.30 (p = 0.03) were obtained considering concentrationsmeasured only on 18, 19 and 20–21 August 2007, respec-tively, during the formation of the higher peaks of NH3 andPM2.5 supporting the hypothesis that the traffic is also a im-portant mobile source of NH3.
The highest ammonia values during the day can be alsoattributed to stable atmosphere conditions. The analysis ofthe temporal pattern of natural radioactivity (Fig. 8) showsthat the convective mixing of the atmosphere occurs betweenthe late morning (12:00–13:00 a.m.) of the previous day andthe early morning of the subsequent day (03:00–04:00 a.m.).Subsequently, a rapid increase of natural radioactivity deter-mines atmospheric stability with high values at 06:00 and at08:00 in the morning. In these conditions, pollution eventsare generally favoured. This implies that most of the traf-fic emission is injected into a stagnant atmosphere causingthe sharp increase in the concentration of ammonia, which
reached the remarkable value of 105.67 µg/m3 (18 August2007), one of the highest values during the intensive mea-surements. During the same hours CO and NOx concen-trations reached the levels of 2.15 mg/m3 and 112.6 µg/m3
(Fig. 6), respectively, and this is an indication of a commonorigin of these pollutants, i.e., traffic emission (Perrino et al.,2002; Edgerton et al., 2007).
In some studies, increased NH3 concentrations have alsobeen attributed to the dissociation of particulate ammoniumnitrate (Langford et al., 1992; H. S. Lee et al., 1999; Pos-sanzini et al., 1999). Volatilization of NH3 from the aerosolphase may be significant enough to dominate over trafficemissions during the summer (Whitehead et al., 2007) andmask any correlations with traffic related pollutants. It isknown that volatile ammonium salts collected on the Teflonfilter (NH4Cl and NH4NO3) dissociate to HCl and HNO3,a phenomenon which depends mainly upon meteorologicalconditions (air temperature and relative humidity), on theaerosol composition, and on the acidity of the particles. Inthis work the gases evolved from the front Teflon filterswere recovered on the back-up Nylon and phosphorous acid-impregnated filters. Data from 2-h sampling over the 17–21August period showed that Teflon filters exhibited a nearlycomplete depletion of nitrate and chloride (>90%) whichwere recovered on Nylon filters. This indicated that nitrateand chloride were almost entirely associated to ammonium.
www.atmos-chem-phys.net/10/9487/2010/ Atmos. Chem. Phys., 10, 9487–9503, 2010
9498 A. Ianniello et al.: Occurrence of gas phase ammonia in the area of Beijing (China)
Indeed, a comparison of µmol amount of NH+
4 with µmolamounts of anions (NO−3 + Cl−) determined on the back-upfilters showed a good and significant correlation (R2 = 0.80,p < 0.001). However, the diurnal variation in NH3 concen-trations had a similar trend as for NH+
4 , with one exceptionof 17 August. During this day, the formation of aerosolNH+
4 leads to the decrease of NH3 concentrations and viceversa. This behaviour could be explained with the displace-ment of the thermodynamic equilibrium between ammoniumsalts and their gaseous precursors. While for the other days(18–21 August), the fact that the NH3 and NH+
4 exhibitedsimilar patterns is due to dissolution of a significant fractionof NH3 in humid aerosols under high relative humidity con-ditions (Hesterberg et al., 1996; Krupa, 2003; Trebs et al.,2004, 2005; Hu et al., 2008). In fact, the concentrations ofammonia and ammonium reach the maximum values at thesame time (between 06:00 and 10:00). Possible evaporationof NH3 from wet surfaces due to temperature increase just af-ter sunrise, when relative humidity was still high might havecaused a significant fraction of gaseous NH3 to dissolve instill deliquescent aerosols, therefore enhancing aerosol NH+
4 .
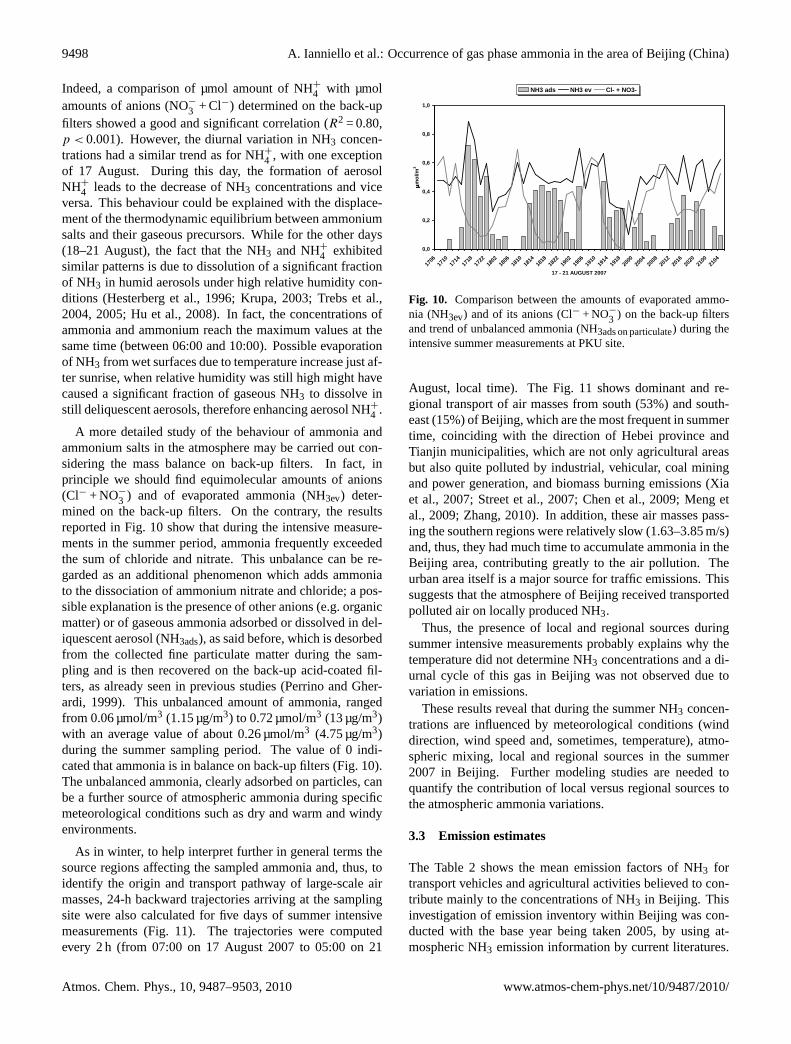
A more detailed study of the behaviour of ammonia andammonium salts in the atmosphere may be carried out con-sidering the mass balance on back-up filters. In fact, inprinciple we should find equimolecular amounts of anions(Cl− + NO−
3 ) and of evaporated ammonia (NH3ev) deter-mined on the back-up filters. On the contrary, the resultsreported in Fig. 10 show that during the intensive measure-ments in the summer period, ammonia frequently exceededthe sum of chloride and nitrate. This unbalance can be re-garded as an additional phenomenon which adds ammoniato the dissociation of ammonium nitrate and chloride; a pos-sible explanation is the presence of other anions (e.g. organicmatter) or of gaseous ammonia adsorbed or dissolved in del-iquescent aerosol (NH3ads), as said before, which is desorbedfrom the collected fine particulate matter during the sam-pling and is then recovered on the back-up acid-coated fil-ters, as already seen in previous studies (Perrino and Gher-ardi, 1999). This unbalanced amount of ammonia, rangedfrom 0.06 µmol/m3 (1.15 µg/m3) to 0.72 µmol/m3 (13 µg/m3)with an average value of about 0.26 µmol/m3 (4.75 µg/m3)during the summer sampling period. The value of 0 indi-cated that ammonia is in balance on back-up filters (Fig. 10).The unbalanced ammonia, clearly adsorbed on particles, canbe a further source of atmospheric ammonia during specificmeteorological conditions such as dry and warm and windyenvironments.
As in winter, to help interpret further in general terms thesource regions affecting the sampled ammonia and, thus, toidentify the origin and transport pathway of large-scale airmasses, 24-h backward trajectories arriving at the samplingsite were also calculated for five days of summer intensivemeasurements (Fig. 11). The trajectories were computedevery 2 h (from 07:00 on 17 August 2007 to 05:00 on 21
0,0
0,2
0,4
0,6
0,8
1,0
1706
1710
1714
1718
1722
1802
1806
1810
1814
1818
1822
1902
1906
1910
1914
1918
2000
2004
2008
2012
2016
2020
2100
2104
17 - 21 AUGUST 2007
µµ µµmo
l/m3
NH3 ads NH3 ev Cl- + NO3-
Fig. 10. Comparison between the amounts of evaporated ammo-nia (NH3ev) and of its anions (Cl− + NO−
3 ) on the back-up filtersand trend of unbalanced ammonia (NH3ads on particulate) during theintensive summer measurements at PKU site.
August, local time). The Fig. 11 shows dominant and re-gional transport of air masses from south (53%) and south-east (15%) of Beijing, which are the most frequent in summertime, coinciding with the direction of Hebei province andTianjin municipalities, which are not only agricultural areasbut also quite polluted by industrial, vehicular, coal miningand power generation, and biomass burning emissions (Xiaet al., 2007; Street et al., 2007; Chen et al., 2009; Meng etal., 2009; Zhang, 2010). In addition, these air masses pass-ing the southern regions were relatively slow (1.63–3.85 m/s)and, thus, they had much time to accumulate ammonia in theBeijing area, contributing greatly to the air pollution. Theurban area itself is a major source for traffic emissions. Thissuggests that the atmosphere of Beijing received transportedpolluted air on locally produced NH3.
Thus, the presence of local and regional sources duringsummer intensive measurements probably explains why thetemperature did not determine NH3 concentrations and a di-urnal cycle of this gas in Beijing was not observed due tovariation in emissions.
These results reveal that during the summer NH3 concen-trations are influenced by meteorological conditions (winddirection, wind speed and, sometimes, temperature), atmo-spheric mixing, local and regional sources in the summer2007 in Beijing. Further modeling studies are needed toquantify the contribution of local versus regional sources tothe atmospheric ammonia variations.
3.3 Emission estimates
The Table 2 shows the mean emission factors of NH3 fortransport vehicles and agricultural activities believed to con-tribute mainly to the concentrations of NH3 in Beijing. Thisinvestigation of emission inventory within Beijing was con-ducted with the base year being taken 2005, by using at-mospheric NH3 emission information by current literatures.
Atmos. Chem. Phys., 10, 9487–9503, 2010 www.atmos-chem-phys.net/10/9487/2010/

A. Ianniello et al.: Occurrence of gas phase ammonia in the area of Beijing (China) 9499
Fig. 11. Geographical map showing the 24-h backward trajecto-ries arriving at Beijing during the intensive summer measurements,reconstructed using the NOAA ARL HYSPLIT trajectory model(http://ready.arl.noaa.gov./HYSPLIT.php).
There are not many published data available for the NH3emissions in China and, thus, only limited data have beenfound and used.
Vehicle emission inventory for regional or national scaleare usually developed using a macro-scale approach inChina. H. Wang et al. (2009, 2010) provided a bottom-upapproach by combining vehicle emission factors and vehicleactivity data from a travel demand model estimated at thegrid level to generate vehicle emissions data for the Beijingurban area in 2005. Average vehicle activity data, such as Ve-hicle Kilometers Traveled (VKT), are estimated by investiga-tion and/or a statistical method for each fleet. The emissionsinventory is estimated as the product of emission factors andvehicle activity:
QP=
∑m
i=1
∑n
j=1EFP
i,j VKT i,j
where,QP is the total emissions for pollutantP , g; EFPi,j is
the emission factor of pollutantP for vehicle typei in gridcell j , g/km; VKTi,j is the vehicle kilometers traveled forvehicle typei in grid cell j , km.
For these applications, emission factors are assumed torepresent long-term vehicle population averages for a givenvehicle class, and are often based on default or average in-puts. In this study, the vehicles driving in the urban area ofBeijing were summarized into 6 classes: passenger car (PC),shuttle bus (SB), taxi, heavy duty truck (HDT), light dutytruck (LDT) and bus. Because the light duty vehicles (PCs
Table 2. NH3 emission estimates (Kt NH3-N yr−1) in Beijing andsurrounding areas in 2005.
Provinces Transport Agriculture
Beijing 1.8 3.6Hebei 2.6 706.8Taijing 1.4 87.6Inner Mongolia 246
and taxies) are the main sources of traffic emissions in thecity comprising over 90% of the total VKT in the urban areaof Beijing, we considered only these vehicles for the NH3emission inventory.
Heeb et al. (2006, 2008) reported mean NO and NH3 emis-sion factors (mg km−1) and average vehicle speed (km h−1).In an urban area they calculated NH3 emission factor of48.8 mg km−1 at 19 km h−1. Taking into account that since2008 the total number of vehicles registered in Beijing cityhad increased to about 3.3 million and is still increasing bymore than 10% per year (B. Wang et al., 2010), we calculatedthe total NH3 emission from traffic sources in Beijing and insurrounding areas (Street et al., 2003; Wang et al., 2005).
Furthermore, Zhang et al. (2010) developed an agriculturalNH3 emission inventory in the North China Plain (NCP),calculating contributions of NH3 emissions from differentsources including Beijing and Tianjing municipalities. How-ever, the largest sector contributor to NH3 emissions in theNCP is agriculture (99%). Mineral fertilizer use contributed54% to the total NH3 emission in the NCP, while live-stock sources contributed the remaining 46%. Thus, we alsoconsidered these contributions to agricultural NH3 emissionfrom Beijing and surrounding areas such as Taijing munici-palities, Hebei province and Inner Mongolia.
These results show that NH3 emissions from agricultureare high as 3.6 Kt NH3-N yr−1 in Beijing in 2005 corre-sponding to two times that from traffic sources (1.8 Kt NH3-N yr−1). Thus, even if NH3 emissions from road trafficmainly affect the air quality in urban environments as Bei-jing, however, the agricultural emissions can be also of ma-jor importance affecting substantially the observed NH3 con-centrations in Beijing, in combination with meteorologicalconditions and regional sources. In fact, the contributionof surrounding areas to NH3 emissions could be higher than1000 Kt NH3-N yr−1.
However, it is indeed very difficult to isolate the effectsof local emission, regional sources and changes in meteorol-ogy. Our measurement data clearly illustrate the impact andimportance of meteorology and regional sources on the ob-served NH3 concentrations in Beijing.
www.atmos-chem-phys.net/10/9487/2010/ Atmos. Chem. Phys., 10, 9487–9503, 2010
9500 A. Ianniello et al.: Occurrence of gas phase ammonia in the area of Beijing (China)
4 Conclusions
The atmospheric concentrations of NH3 have been measuredat an urban site (Peking University) in Beijing in the win-ter and summer of 2007. All data were analyzed to investi-gate temporal variations, meteorological effects and specialfeatures of the gas-particulate equilibrium. According to theresults, the following conclusions were reached:
– The NH3 concentrations showed regular temporal vari-ations, having significantly higher summertime concen-trations. The temporal trends seemed to be largely dom-inated by air temperature.
– The NH3 concentrations did not show any diurnal vari-ation in both winter and summer seasons.
– The effects of wind direction and of the atmosphericmixing on the NH3 concentrations were the two mostsignificant meteorological parameters. The NH3 con-centrations were slightly affected by wind speed andtemperature.
– Moderate correlations were obtained between NH3 andpollutants mainly emitted by motor-vehicle exhausts,such as NOx, CO and PM2.5, indicating an influence bytraffic emissions at Beijing.
– Emissions from regional sources contributed also to theatmospheric ammonia variations in winter and summerseasons at Beijing.
Acknowledgements.We would like to thank the “Blue Sky ofBeijing: Research on Regional Air Pollution Project”, the BeijingMunicipal Environmental Protection Bureau and the Italian Min-istry for the Environment; Land and Sea (IMELS) of Italy for thefinancial support through the Sino-Italian Cooperation Program,and the Beijing Council of Science and Technology (HB200504-6,HB200504-2) for supporting Peking University to organize thefield study CAREBEIJING.
Edited by: M. Gauss
References
Allegrini, I., De Santis, F., Di Palo, V., Febo, A., Perrino, C., Pos-sanzini, M., and Liberti, A.: Annular denuder method for sam-pling reactive gases and aerosols in the atmosphere, Sci. TotalEnviron., 67, 1–16, 1987.
Allegrini, I., Ianniello, A., Montagnoli, M., Sparapani, R., andMazzioti Gomez de Teran, C.: Carbon coated annular denud-ers and ion chromatographic measurements for the determinationof nitrogen-containing species (NO2 and NOy) in remote atmo-spheres, J. Chromatogr. A, 846, 265–268, 1999.
Aneja, V. P., Chauhan, J. P., and Walker, J. T.: Characterization ofatmospheric ammonia emissions from swine waste storage andtreatment lagoons, J. Geophys. Res., 105, 11535–11545, 2000.
Aneja, V. P., Roelle, P. A., Murray, G. C., Southerland, J., Eris-man, J. W., Fowler, D., Asman, W. A. H., and Patni, N.: Atmo-spheric nitrogen compounds: II. Emissions, transport, transfor-mation, deposition and assessment, Atmos. Environ., 35, 1903–1911, 2001.
Asman, W. A., Sutton, M. A., and Schjorring, J. K.: Ammonia:emission, atmospheric transport, and deposition, New Phytol.,139, 27–48, 1998.
Bari, A., Ferraro, V., Wilson, L. R, Luttinger, D., and Husain, L.:Measurements of gaseous HONO, HNO3, SO2, HCl, NH3, par-ticulate sulfate and PM2.5 in New York, NY, Atmos. Environ.,37, 2825–2835, 2003.
Battye, W., Aneja, V. P., and Roelle, P.: Evaluation and improve-ment of ammonia emissions inventories, Atmos. Environ., 37,3873–3883, 2003.
Beine, H. J., Allegrini, I., Sparapani, R., Ianniello, A., and Valen-tini, F.: Three years of springtime trace gas and particle mea-surements at Ny-Alesund, Svalbard, Atmos. Environ., 35, 3645–3658, 2001.
Bouwman, A. F., Lee, D. S., Asman, W. A. H., Dentener, F. J., Vander Hoek, K. W., and Olivier, J. G. J.: A global high-resolutionemission inventory for ammonia, Global Biogeochem. Cy., 11,561–587, 1997.
Brunekreef, B. and Holgate, S. T.: Air pollution and health, Lancet,360, 1233–1242, 2002.
Burkhardt, J., Sutton, M. A., Milford, C., Storeton-West, R. L., andFowler, D.: Ammonia concentrations at a site in southern Scot-land from 2 yr of continuous measurements, Atmos. Environ.,32, 325–331, 1998.
Cadle, S. H., Countessand, R. J., and Kelley, N. A.: Nitric acidand ammonia in urban and rural locations, Atmos. Environ., 16,2501–2506, 1982.
Cape, J. N., Tang, Y. S., Van Dijk, N., Love, L., Sutton, M. A.,and Palmer, S. C. F.: Concentrations of ammonia and nitrogendioxide at roadside verges, and their contribution to nitrogen de-position, Environ. Pollut., 132, 469–478, 2004.
Carmichael, G. R., Ferm, M., Thongboonchoo, N., Woo, J.-H.,Chan, L.Y., Murano, K., Viet, P. H., Mossberg, C., Bala, R.,Boonjawat, J., Upatum, P., Mohan, M., Adhikary, S. P., Shrestha,A. B., Pienaar, J. J., Brunke, E. B., Chen, T., Jie, T., Guoan, D.,Peng, L. C., Dhiharto, S., Harjanto, H., Jose, A. M., Kimani, W.,Kirouane, A., Lacaux, J.-P., Richard, S., Barturen, O., Cerda, J.C., Athayde, A., Tavares, T., Cotrina, J. S., and Bilici, E.: Mea-surements of sulfur dioxide, ozone and ammonia concentrationsin Asia, Africa, and South America using passive samplers, At-mos. Environ., 37, 1293–1308, 2003.
Chak, C. K. and Yao, X.: Air pollution in mega cities in China – Areview, Atmos. Environ., 42, 1–42, 2008.
Chan, C. Y., Xu, X. D., Li, Y. S., Wong, K. H., Ding, G. A., Chan,L. Y., and Cheng, X. H.: Characteristics of vertical profiles andsources of PM2.5, PM10 and carbonaceous species in Beijing,Atmos. Environ., 39, 5113–5124, 2005.
Chen, D., Wang, Y., McElroy, M. B., He, K., Yantosca, R. M., andLe Sager, P.: Regional CO pollution and export in China simu-lated by the high-resolution nested-grid GEOS-Chem model, At-mos. Chem. Phys., 9, 3825–3839, doi:10.5194/acp-9-3825-2009,2009.
Danalatos, D. and Glavas, S.: Gas phase nitric acid, ammonia andrelated particulate matter at a Mediterranean coastal site, Patras,
Atmos. Chem. Phys., 10, 9487–9503, 2010 www.atmos-chem-phys.net/10/9487/2010/

A. Ianniello et al.: Occurrence of gas phase ammonia in the area of Beijing (China) 9501
Greece, Atmos. Environ., 33, 3417–3425, 1999.Edgerton E. S., Saylor R. D., Hartsell B. E., Jansen J. J., Hansen
D. A.: Ammonia and ammonium measurements from the south-eastern United States, Atmos. Environ., 41, 3339-3351, 2007.
EMEP Webdab emission data hosted by the Centre on EmissionInventories and Projections (CEIP):http://www.ceip.at/, access:20 August 2009.
Erisman, J. W. and Schaap, M.: The need for ammonia abatementwith respect to secondary PM reductions in Europe, Environ.Pollut., 129, 159–163, 2004.
Fangmeier, A., Hadwiger-Fangmeier, A., van der Eerden, L., andJaeger, H. J.: Effects of atmospheric ammonia on vegetation – Areview, Environ. Pollut., 86, 43–82, 1994.
Febo, A., De Santis, F., Perrino, C., and Giusto, M.: Evaluation oflaboratory and field performance of denuder tubes: a theoreticalapproach, Atmos. Environ., 23, 1517–1530, 1989.
Ferm, M.: Atmospheric ammonia and ammonium transport in Eu-rope and critical loads: a review, Nutr. Cycl. Agroecosys., 51,5–17, 1998.
Fraser, M. P. and Cass, G. R.: Detection of excess ammonia emis-sions from in use vehicles and the implications for fine particlecontrol, Environ. Sci. Technol., 32, 1053–1057, 1998.
Goebes, M. D., Strader, R., and Davidson, C.: An ammonia emis-sion inventory for fertilizer application in the United States, At-mos. Environ., 37, 2539–2550, 2003.
He, K., Yang, F., Ma, Y., Zhang, Q., Yao, X., Chan, C. K., Cadle,S., Chan, T., and Mulawa, P.: The characteristics of PM2.5 inBeijing, China, Atmos. Environ., 35, 4959–4970, 2001.
He, K., Huo, H., and Zhang, Q.: Urban air pollution in china:Current Status, Characteristics, and Progress, Annu. Rev. Energ.Env., 27, 397–431, 2002.
He, C.-E., Liu, X., Fangmeier, A., and Zhang, F.: Quantifying thetotal airborne nitrogen input into agroecosystems in the NorthChina Plain, Agr. Ecosyst. Environ., 121, 395–400, 2007.
Hao, J., He, D., Li, L., Wu, Y., Fu, L., and He, K.: A study of theemission and concentration distribution of vehicular pollutants inthe urban area of Beijing, Atmos. Environ., 34, 453–465, 2000.
Hao, J., Wang, L., Li, L., Hu, J. N., and Yu, X. C.: Air pollutantscontribution and control strategies of energy-use related sourcesin Beijing, Sci. China Ser. D, 48, (Suppl. II), 138–146, 2005.
Heeb, N. V., Forss, A-M., Bruhlmann, S., Luscher, R., Saxer, C.J., and Hug, P.: Three-way catalyst-induced formation of ammo-nia velocity- and acceleration-dependent emission factors, At-mos. Environ., 40, 5986–5997, 2006.
Heeb, N. V., Saxer, C. J., Forss, A.-M., and Bruhlmann, S.: Trendsof NO-, NO2-, and NH3-emissions from gasoline-fueled Euro-3- to Euro-4-passenger cars, Atmos. Environ., 42, 2543–2554,2008.
Hesterberg, R., Blatter, A., Fahrni, M., Rosset, M., Neftel, A., Eu-gster, W., and Wanner, H.: Deposition of nitrogen-containingcompounds to an extensively managed grassland in centralSwitzerland, Environ. Pollut., 91, 21–34, 1996.
Horvath, H.: Effects on visibility, weather and climate, in: Atmo-spheric acidity: sources, consequences and abatement, edited by:Radojevic, M. and Harrison, R. M., chapter 13, London: ElsevierApplied Science, 1992.
Horvath, L. and Sutton, M. A.: Long term record of ammonia andammonium concentrations at K-puszta, Hungary, Atmos. Envi-ron., 32, 339–344, 1998.
Hu, M., Wu, Z., Slanina, J., Lin, P., Liu, S., and Zeng, L.: Acidicgases, ammonia and water-soluble ions in PM2.5 at a coastal sitein the Pearl River Delta, China, Atmos. Environ., 22, 6310–6320,2008.
Huai, T., Durbin, T. D., Miller, J. W., Pisano, J. T., Sauer, C. G.,Rhee, S. H., and Norbeck, J. M.: Investigation of NH3 Emis-sions from New Technology Vehicles as a Function of VehicleOperating Conditions, Environ. Sci. Technol., 37, 4841–4847,2003.
Huai, T., Durbin, T. D., Younglove, T., Scora, G., Barth, M., andNorbeck, J. M.: Vehicle Specific Power Approach to Estimat-ing On-Road NH3 Emissions from Light-Duty Vehicles, Envi-ron. Sci. Technol., 39, 9595–9600, 2005.
Huber, C. and Kreutzer, K.: Three years of continuous measure-ments of atmospheric ammonia concentrations over a foreststand at the Hoglwald site in southern Bavaria, Plant Soil, 240,13–22, 2002.
Ianniello, A., Beine, H. J., Sparapani, R., Di Bari, F., Allegrini, I.,and Fuentes, J. D.: Denuder measurements of gas and aerosolspecies above Arctic snow surfaces at Alert 2000, Atmos. Envi-ron., 36, 5299–5309, 2002.
Ju, X., Liu, X., Zhang, F., and Roelche, M.: Nitrogen fertilization,soil nitrate accumulation, and policy recommendations in severalagricultural regions of China, Ambio, 33, 300–305, 2004.
Katsoulis, B. D.: The relationship between synoptic, mesoscaleand microscale meteorological parameters during poor air qual-ity events in Athens, Greece, Sci. Total Environ., 181, 13–24,1996.
Kean, A. J., Harley, R. A., Littlejohn, D., and Kendall, G. R.: On-road measurement of ammonia and other motor vehicle exhaustemissions, Environ. Sci. Technol., 34, 3535–3539, 2000.
Kirchner, M., Braeutigam, S., Feicht, E., and Loflund, M.: Am-monia emissions from vehicles and the effects on ambient airconcentrations, Fresen. Environ. Bull., 11, 454–458, 2002.
Klimont, Z.: Current and Future emissions of Ammonia in China,10th International Emission Inventory Conference: One At-mosphere, One Inventory, Many Challenges, US EPA, 1–3May, Denver, USA, available at:http://www.epa.gov/ttn/chief/conference/ei10/ammonia/klimont.pdf, 2001.
Krupa, S. V.: Effects of atmospheric ammonia (NH3) on terrestrialvegetation: A review, Environ. Pollut., 124, 179–221. 2003.
Langford, A. O. and Fehsenfeld, F. C.: The role of natural vegeta-tion as a source or sink for atmospheric ammonia: a case study,Science, 255, 581–583, 1992.
Langford, A. O., Fehsenfeld, F. C., Zachariassen, J., and Schimel,D. S.: Gaseous ammonia fluxes and background concentra-tions in terrestrial ecosystems of the United States, Global Bio-geochem. Cy., 6, 459–483, 1992.
Lee, D. S., Dollard, G. J., Derwent, R. G., and Pepler, S.: Obser-vations on gaseous and aerosols components of atmosphere andtheir relationships, Water Air Soil Poll., 113, 175–202, 1999.
Lee, H. S., Kang, C. M., Kang, B. W., and Kim, H. K.: Seasonalvariations of acidic air pollutants in Seoul, South Korea, Atmos.Environ., 33, 3143–3152, 1999.
Lee, H., Kim, Y. J., Jung, J., Lee, C., Heue, K.-P., Platt, U., Hu,M., and Zhu, T.: Spatial and temporal variations in NO2 distri-butions over Beijing, China, measured by imaging differentialoptical absorption spectroscopy, J. Environ. Manage., 90, 1814–1823, 2009.
www.atmos-chem-phys.net/10/9487/2010/ Atmos. Chem. Phys., 10, 9487–9503, 2010

9502 A. Ianniello et al.: Occurrence of gas phase ammonia in the area of Beijing (China)
Lefer, B. L., Talbot, R. W., and Munger, J. W.: Nitric acid andammonia at a rural northeastern US site, J. Geophys Res., 104,1645–1661, 1999.
Li, Y., Schwab, J. J., and Demerjian, K. L.: Measurements of am-bient ammonia using a tunable diode laser absorption spectrom-eter: Characteristics of ambient ammonia emissions in an urbanarea of New York City, J. Geophys. Res., 111(D10), D10S02,doi:10.1029/2005JD006275, 2006.
Meng, Z. Y., Ding, G. A., Xu, X. B., Xu, X. D., Yu, H. Q., andWang, S. F.: Vertical distributions of SO2 and NO2 in the loweratmosphere in Beijing urban areas, China, Sci. Total Environ.,390, 456–465, 2008.
Meng, Z. Y., Xu, X. B., Yan, P., Ding, G. A., Tang, J., Lin, W.L., Xu, X. D., and Wang, S. F.: Characteristics of trace gaseouspollutants at a regional background station in Northern China,Atmos. Chem. Phys., 9, 927–936, doi:10.5194/acp-9-927-2009,2009.
Meng, Z. Y., Xu, X. B., Wang, T., Zhang, X.-Y., Yu, X.-L., Wang,S.-F., Lin, W.-L., Chen, Y.-Z., Jiang, Y.-A., and An, X.-Q.:Ambient sulphur dioxide, nitrogen dioxide, and ammonia at tenbackground and rural sites in China during 2007–2008, Atmos.Environ., 44, 2625–2631, 2010.
Olivier, J. G. J., Bouwman, A. F., Van der Hoek, K. W., andBerdowski, J. J. M.: Global air emission inventories for anthro-pogenic sources of NOx, NH3, and N2O in 1990, Environ. Pol-lut., 102, 135–148, 1998.
Olszyna, K. J., Bairai, S. T., and Tanner, R. L.: Effect of ambientNH3 levels on PM2.5 composition in the Great Smoky Moun-tains National Park, Atmos. Environ., 39, 4593–4606, 2005.
Perrino, C., De Santis, F., and Febo, A.: Criteria for the choiceof a denuder sampling technique devoted to the measurement ofatmospheric nitrous and nitric acids, Atmos. Environ., 24A, 617–626, 1990.
Perrino, C. and Gherardi, M.: Optimization of the coating layerfor the measurement of ammonia by diffusion denuders, Atmos.Environ., 33, 4579–4587, 1999.
Perrino, C., Ramirez, D., and Allegrini, I.: Monitoring acidic airpollutants near Rome by means of diffusion lines: developmentof a specific quality control procedure, Atmos. Environ., 35,331–341, 2001a.
Perrino, C., Pietrodangelo, A., and Febo, A.: An atmospheric sta-bility index based on radon progeny measurements for the eval-uation of primary urban pollution, Atmos. Environ., 35, 5235–5244, 2001b.
Perrino, C., Catrambone, M., Di Menno Di Bucchianico, A., andAllegrini, I.: Gaseous ammonia in the urban area of Rome, Italy,and its relationship with traffic emissions, Atmos. Environ., 36,5385–5394, 2002.
Possanzini, M., Febo, A., and Liberti, A.: New design of a highperformance denuder for the sampling of atmospheric pollutants,Atmos. Environ., 17, 2605–2610, 1983.
Possanzini, M., De Santis, F., and Di Palo, V.: Measurements of ni-tric acid and ammonium salts in lower Bavaria, Atmos. Environ.,33, 3597–3602, 1999.
Pryor, S. C., Barthelmie, R. J., Sørensen, L. L., and Jensen, B.: Am-monia concentrations and fluxes over a forest in the midwesternUSA, Atmos. Environ., 35, 5645–5656, 2001.
Reis, S., Pinder, R. W., Zhang, M., Lijie, G., and Sutton, M.A.: Reactive nitrogen in atmospheric emission inventories, At-
mos. Chem. Phys., 9, 7657–7677, doi:10.5194/acp-9-7657-2009,2009.
Robarge, W. P., Walker, J. T., McCulloch, R. B., and Murray, G.:Atmospheric concentrations of ammonia and ammonium at anagricultural site in the southeast United States, Atmos. Environ.,36, 1661–1674, 2002.
Roelle, P. A. and Aneja, V. P.: Characterization of ammonia emis-sions from soils in the upper coastal plain, North Carolina, At-mos. Environ., 36, 1087–1097, 2002.
Shen, J. L., Tang, A. H., Liu, X. J., Fangmeier, A., Goulding, K.T. W., and Zhang, F. S.: High concentrations and dry depositionof reactive nitrogen species at two sites in the North China Plain,Environ. Pollut., 157, 3106–3113, 2009.
Singh, S. P., Satsangi, G. S., Khare, P., Lakhani, A., Maharaj Ku-mari, K., and Srivastava, S. S.: Multiphase measurement of at-mospheric ammonia, Chemosphere – Global Change Science, 3,107–116, 2001.
Streets, D. G., Bond, T. C., Carmichael, G. R., Fernandes, S. D.,Fu, Q., He, D., Klimont, Z., Nelson, S. M., Tsai, N. Y., Wang,M. Q., Woo, J. H., and Yarber, K. F.: An inventory of gaseous andprimary aerosol emissions in Asia in the year 2000, J. GeophysRes., 108(D21), 8809, doi:10.1029/2002JD003093, 2003.
Streets, D. G., Fu, J. S., Jang, C. J., Hao, J., He, K., Tang, X.,Zhang, Y., Wang, Z., Li, Z., Zhang, Q., Wang, L., Wang, B.,and Yu, C.: Air quality during the 2008 Beijing Olympic Games,Atmos. Environ., 41, 480–492, 2007.
Sutton, M. A., Pitcairn, C. E. R., and Fowler, D.: The exchange ofammonia between the atmosphere and plant communities, Adv.Ecol. Res., 24, 301–393, 1993.
Sutton, M. A., Asman, W. A. H., and Schjørring, J. K.: Dry deposi-tion of reduced nitrogen, Tellus, 46B, 255–273, 1994.
Sutton, M. A., Place, C. J., Eager, M., Fowler, D., and Smith, R.L.: Assessment of the magnitude of ammonia emissions in theUnited Kingdom, Atmos. Environ., 29, 1393–1411, 1995.
Sutton, M. A., Dragosits, U., Tang, Y. S., and Fowler, D.: Ammo-nia emissions from non-agricultural sources in the UK, Atmos.Environ., 34, 855–869, 2000.
Trebs, I., Meixner, F. X., Slanina, J., Otjes, R., Jongejan, P., andAndreae, M. O.: Real-time measurements of ammonia, acidictrace gases and water-soluble inorganic aerosol species at a ru-ral site in the Amazon Basin, Atmos. Chem. Phys., 4, 967–987,doi:10.5194/acp-4-967-2004, 2004.
Trebs, I., Metzger, S., Meixner, F. X., Helas, G. N., Hoffer, A.,Rudich, Y., Falkovich, A. H., Moura, M. A. L., da Silva, R. S.,Artaxo, P., Slanina, J., and Andreae, M. O.: The NH+
4 -NO−
3 -
Cl−-SO2−
4 -H2O aerosol system and its gas phase precursors ata pasture site in the Amazon Basin: How relevant are mineralcations and soluble organic acids?, J. Geophys. Res.-Atmos.,110(D7), D07303, doi:10.1029/2004JD005478, 2005.
USEPA: National Emission Inventory Tier Summaries:http://www.epa.gov/ttn/chief/eiinformation.html, access: 14 August 2009.
Vogt, E., Held, A., and Klemm, O.: Sources and concentrations ofgaseous and particulate reduced nitrogen in the city of Munster(Germany), Atmos. Environ., 39, 7393–7402, 2005.
Walker, J. T., Whitall, D. R., Robarge, W., and Paerl, H. W.: Ambi-ent ammonia and ammonium aerosol across a region of variableammonia emission density, Atmos. Environ., 38, 1235–1246,2004.
Wang, X., Mauzerall, D. L., Hu, Y., Russell, A. G., Larson, E. D.,
Atmos. Chem. Phys., 10, 9487–9503, 2010 www.atmos-chem-phys.net/10/9487/2010/
A. Ianniello et al.: Occurrence of gas phase ammonia in the area of Beijing (China) 9503
Woo, J.-H., Streets, D. G., and Guenther, A.: A high-resolutionemission inventory for eastern China in 2000 and three scenariosfor 2020, Atmos. Environ., 39, 5917–5933, 2005.
Wang, H., Fu, L., Lin, X., Zhou, Y., and Chen, J.: A bottom-upmethodology to estimate vehicle emissions for the Beijing urbanarea, Sci. Total Environ., 407, 1947–1953, 2009.
Wang, B., Shao, M., Lu, S. H., Yuan, B., Zhao, Y., Wang, M.,Zhang, S. Q., and Wu, D.: Variation of ambient non-methane hy-drocarbons in Beijing city in summer 2008, Atmos. Chem. Phys.,10, 5911–5923, doi:10.5194/acp-10-5911-2010, 2010.
Wang, H., Fu, L., Lin, X., Zhou, Y., Du, X., and Ge, W.: Trendsin vehicular emissions in China’s mega cities from 1995 to 2005,Environ. Pollut., 158, 394–400, 2010.
Whitehead, J. D., Longley, I. D., and Gallagher, M. W.: Seasonaland diurnal variation in atmospheric ammonia in an urban en-vironment measured using a quantum cascade laser absorptionspectrometer, Water Air Soil Poll., 183, 317–329, 2007.
Xia, X., Chen, H., and Zhang, W.: Analysis of the dependence ofcolumn-integrated aerosol properties on long-range transport ofair masses in Beijing, Atmos. Environ., 41, 7739–7750, 2007.
Yamamoto, N., Kabeya, N., Onodera, M., Takahahi, S., Komori,Y., and Nakazuka, E.: Seasonal variation of atmospheric ammo-nia and particulate ammonium concentrations in the urban atmo-sphere of Yokohama over a 5-year period, Atmos. Environ., 22,2621–2623, 1988.
Yamamoto, N., Nishiura, H., Honjo, T., Ishikawa, Y., and Suzuki,K.: A long-term study of atmospheric ammonia and particulateammonium concentrations in Yokohama, Japan, Atmos. Envi-ron., 29, 97–103, 1995.
Yao, X., Lau, A. P. S., Fang, M., Chan, C. K., and Hu, M.: Sizedistributions and formation of ionic species in atmospheric par-ticulate pollutants in Beijing, China: 1-inorganic ions, Atmos.Environ., 37, 2991–3000, 2003.
Zhang, Y., Dore, A. J., Ma, L., Liu, X. J., Ma, W. Q., Cape, J. N.,and Zhang, F. S.: Agricultural ammonia emissions inventory andspatial distribution in the North China Plain, Environ. Pollut.,158, 490–501, 2010.
Zhao, D. and Wang, A.: Estimation of anthropogenic ammoniaemissions in Asia, Atmos. Environ., 28, 687–694, 1994.
Zheng, M., Salmon, L. G., Schauer, J. J., Zeng, L., Kiang, C. S.,Zhang, Y., and Cass, G. R.: Seasonal trends in PM2.5 source con-tributions in Beijing, China, Atmos. Environ., 39, 3967–3976,2005.
www.atmos-chem-phys.net/10/9487/2010/ Atmos. Chem. Phys., 10, 9487–9503, 2010