Occurrence of 25 pharmaceuticals in Taihu Lake and their ... · The objective of this paper is to...
14
RESEARCH ARTICLE Occurrence of 25 pharmaceuticals in Taihu Lake and their removal from two urban drinking water treatment plants and a constructed wetland Xia-Lin Hu 1 & Yi-Fan Bao 1 & Jun-Jian Hu 1 & You-Yu Liu 1 & Da-Qiang Yin 1 Received: 16 December 2016 /Accepted: 13 March 2017 /Published online: 6 May 2017 # The Author(s) 2017, corrected publication July/2019 Abstract Pharmaceuticals in drinking water sources have raised significant concerns due to their persistent input and potential human health risks. The seasonal occurrence of 25 pharmaceuticals including 23 antibiotics, paracetamol (PAR), and carbamazepine (CMZ) in Taihu Lake was investigated; meanwhile, the distribution and removal of these pharmaceu- ticals in two drinking water treatment plants (DWTPs) and a constructed wetland were evaluated. A high detection fre- quency (>70%) in the Taihu Lake was observed for nearly all the 25 pharmaceutics. Chlortetracycline (234.7 ng L -1 ), chloramphenicol (27.1 ng L -1 ), erythromycin (72.6 ng L -1 ), PAR (71.7 ng L -1 ), and CMZP (23.6 ng L -1 ) are compounds with both a high detection frequency (100%) and the highest concentrations, suggesting their wide use in the Taihu Basin. Higher concentrations of chloramphenicols, macrolides, PAR, and CMZP were observed in dry season than in wet season, probably due to the low flow conditions of the lake in winter and the properties of pharmaceuticals. The overall contamina- tion levels of antibiotic pharmaceutics (0.2–74.9 ng L -1 ) in the Taihu Lake were lower than or comparable to those reported worldwide. However, for nonantibiotic pharmaceutics, PAR (45.0 ng L -1 ) and CMZP (14.5 ng L -1 ), significantly higher concentrations were observed in the Taihu Lake than at a global scale. High detection frequencies of 25 pharmaceuti- cals were observed in both the two DWTPs (100%) and the wetland (>60%) except for florfenicol and sulfapyridine. The removal efficacies of the studied pharmaceuticals in DWTP B with advanced treatment processes including ozonation and granular activated carbon filtration (16.7–100%) were superi- or to DWTP A with conventional treatment processes (2.9– 100%), except for sulfonamides. Wetland C with the con- structed root channel technology was efficient (24.2–100%) for removing most pharmaceuticals. This work suggests that the application of cost-effective technologies such as con- structed wetlands should be considered as an efficient alterna- tive for removing pharmaceuticals from water supply sources. Keywords Pharmaceuticals . Drinking water . Water supply sources . Drinking water treatment plants . Constructed wetlands . Removal of contaminants Introduction Pharmaceuticals are any synthesized chemical compounds or drugs designed to cure and prevent the spread of diseases as well as adding value to humans and animals life (Tijani et al. 2013). Pharmaceuticals include antibiotics, antiepileptic, anti- microbials, and antianxiety medications. The rampant usage of pharmaceuticals has made their occurrence ubiquitous in the environment. Pharmaceuticals in the environment have received increased attention over the past decade. The contam- ination of pharmaceuticals has been reported in both natural and artificial systems, including soil, sediment, sludge, groundwater, wastewater, tap water, surface water, and aquatic organisms (Gothwal and Shashidhar 2015). Pharmaceutical concentrations in the natural aquatic environment are in the ranges of sub-ng to low μgL -1 , well below acute toxic levels. Responsible editor: Ester Heath Electronic supplementary material The online version of this article (doi:10.1007/s11356-017-8830-y) contains supplementary material, which is available to authorized users. * Xia-Lin Hu [email protected] 1 Key Laboratory of Yangtze River Water Environment, Ministry of Education, College of Environmental Science and Engineering, Tongji University, 1239 Siping Road, Shanghai 200092, China Environ Sci Pollut Res (2017) 24:14889–14902 DOI 10.1007/s11356-017-8830-y
Transcript of Occurrence of 25 pharmaceuticals in Taihu Lake and their ... · The objective of this paper is to...

RESEARCH ARTICLE
Occurrence of 25 pharmaceuticals in Taihu Lakeand their removal from two urban drinking watertreatment plants and a constructed wetland
Xia-Lin Hu1& Yi-Fan Bao1 & Jun-Jian Hu1
& You-Yu Liu1& Da-Qiang Yin1
Received: 16 December 2016 /Accepted: 13 March 2017 /Published online: 6 May 2017# The Author(s) 2017, corrected publication July/2019
Abstract Pharmaceuticals in drinking water sources haveraised significant concerns due to their persistent input andpotential human health risks. The seasonal occurrence of 25pharmaceuticals including 23 antibiotics, paracetamol (PAR),and carbamazepine (CMZ) in Taihu Lake was investigated;meanwhile, the distribution and removal of these pharmaceu-ticals in two drinking water treatment plants (DWTPs) and aconstructed wetland were evaluated. A high detection fre-quency (>70%) in the Taihu Lake was observed for nearlyall the 25 pharmaceutics. Chlortetracycline (234.7 ng L−1),chloramphenicol (27.1 ng L−1), erythromycin (72.6 ng L−1),PAR (71.7 ng L−1), and CMZP (23.6 ng L−1) are compoundswith both a high detection frequency (100%) and the highestconcentrations, suggesting their wide use in the Taihu Basin.Higher concentrations of chloramphenicols, macrolides, PAR,and CMZP were observed in dry season than in wet season,probably due to the low flow conditions of the lake in winterand the properties of pharmaceuticals. The overall contamina-tion levels of antibiotic pharmaceutics (0.2–74.9 ng L−1) in theTaihu Lake were lower than or comparable to those reportedworldwide. However, for nonantibiotic pharmaceutics, PAR(45.0 ng L−1) and CMZP (14.5 ng L−1), significantly higherconcentrations were observed in the Taihu Lake than at a
global scale. High detection frequencies of 25 pharmaceuti-cals were observed in both the two DWTPs (100%) and thewetland (>60%) except for florfenicol and sulfapyridine. Theremoval efficacies of the studied pharmaceuticals in DWTP Bwith advanced treatment processes including ozonation andgranular activated carbon filtration (16.7–100%) were superi-or to DWTP A with conventional treatment processes (2.9–100%), except for sulfonamides. Wetland C with the con-structed root channel technology was efficient (24.2–100%)for removing most pharmaceuticals. This work suggests thatthe application of cost-effective technologies such as con-structed wetlands should be considered as an efficient alterna-tive for removing pharmaceuticals from water supply sources.
Keywords Pharmaceuticals . Drinkingwater .Water supplysources . Drinkingwater treatment plants . Constructedwetlands . Removal of contaminants
Introduction
Pharmaceuticals are any synthesized chemical compounds ordrugs designed to cure and prevent the spread of diseases aswell as adding value to humans and animals life (Tijani et al.2013). Pharmaceuticals include antibiotics, antiepileptic, anti-microbials, and antianxiety medications. The rampant usageof pharmaceuticals has made their occurrence ubiquitous inthe environment. Pharmaceuticals in the environment havereceived increased attention over the past decade. The contam-ination of pharmaceuticals has been reported in both naturaland artificial systems, including soil, sediment, sludge,groundwater, wastewater, tap water, surface water, and aquaticorganisms (Gothwal and Shashidhar 2015). Pharmaceuticalconcentrations in the natural aquatic environment are in theranges of sub-ng to low μg L−1, well below acute toxic levels.
Responsible editor: Ester Heath
Electronic supplementary material The online version of this article(doi:10.1007/s11356-017-8830-y) contains supplementary material,which is available to authorized users.
* Xia-Lin [email protected]
1 Key Laboratory of Yangtze River Water Environment, Ministry ofEducation, College of Environmental Science and Engineering,Tongji University, 1239 Siping Road, Shanghai 200092, China
Environ Sci Pollut Res (2017) 24:14889–14902DOI 10.1007/s11356-017-8830-y

However, there are uncertainties regarding the effects ofchronic exposures (Rand-Weaver et al. 2013). The adverseeffects on aquatic communities include the feminization ofmale fish (Corcoran et al. 2010), development of pathogenresistance (Zuccato et al. 2006), and decrease in plankton di-versity (Farré et al. 2008).
Wastewater treatment plants (WWTPs) are regarded as oneof the most important sources of pharmaceuticals in the envi-ronment. Occurrence and removal of pharmaceuticals inwastewaters and municipal WWTPs has been widely studied.No specific pattern is observed in the occurrence of pharma-ceuticals in wastewaters (Evgenidou et al. 2015). Great dis-crepancies are observed between countries indicating the re-gional differences in drug use patterns (Luo et al. 2014;Mailler et al. 2016). Variations are also observed within thesame country, between different WWTPs (Guerra et al. 2014),probably due to the different pharmaceutical prescription pat-terns in a country and the varied removal efficiencies of indi-vidual WWTPs. The conventional sewage treatment facilitieswere never specially designed to deal with pharmaceuticals; itis found that most pharmaceuticals cannot be fully removed(Michael et al. 2013). Due to their highly variable physico-chemical properties (chemical structure, octanol/water parti-tion coefficient) as well as the operational conditions of thebiological process, the efficiencies by which pharmaceuticalsare removed vary substantially (Michael et al. 2013;Evgenidou et al. 2015). The efficiency of WWTPs for theelimination of pharmaceuticals is under the control of opera-tional conditions (the hydraulic retention time, sludge reten-tion time, and biodegradation kinetics) and environmentalconditions (the temperature, redox conditions, and pH)(Evgenidou et al. 2015). Regarding the physicochemical char-acteristics of the pharmaceuticals that affect their removal byWWTP’s processes, the ability to interact with solid particlesis a major factor because it facilitates their removal by phys-ical–chemical (settling, flotation) or biological processes (bio-degradation). Compounds with low adsorption coefficientstend to remain in the aqueous phase, which favors their mo-bility through the WWTP and into the receiving waters.Advanced treatment processes, such as activated carbon ad-sorption and advanced oxidation processes can achieve higherand more consistent removal efficiencies for micropollutants(Luo et al. 2014).
Drinking water is one of the most important sources foruptake of pharmaceuticals by human beings. Several studieswere carried out to investigate the occurrence and behavior ofpharmaceuticals in drinking water sources and drinking watertreatment plants (DWTPs) (Qiao et al. 2011; de Jesus Gaffneyet al. 2015; Simazaki et al. 2015). Conventional drinking wa-ter treatment methods such as coagulation, sedimentation, andfiltration have poor removal efficiencies for most pharmaceu-ticals. The removal efficiencies of the advanced water treat-ment processes including ozonation and granular activated
carbon filtration were typically much higher than those ofthe conventional treatment processes. Constructed wetlandscould serve as a cost-effective and promising alternative toconventional wastewater treatment methods for removingpharmaceuticals in treated water (Hijosa-Valsero et al. 2010;Dordio and Carvalho 2013; Li et al. 2014; Verlicchi andZambello 2014; Zhang et al. 2014). Constructed wetlandscan facilitate the removal of pharmaceuticals via natural pro-cesses involving plants, microorganisms, solid matrix compo-nents, and sunlight (Dordio and Carvalho 2013). The mecha-nisms involved in pollutant removal in constructed wetlandscan be classified into biotic processes (e.g., microbiologicaldegradation, biofilm, root, and plant uptake) and physico-chemical processes (evaporation, photodegradation, oxida-tion, hydrolysis, retention, or root sorption into the gravelbed) (Verlicchi and Zambello 2014; Zhang et al. 2014;Hijosa-Valsero et al. 2016). The removal efficiency of phar-maceuticals in constructed wetlands has been demonstrated tobe comparable to conventional wastewater treatment process-es (Matamoros et al. 2008; Verlicchi and Zambello 2014).Therefore, constructed wetlands might be also promising forthe treatment of source water prior to DWTPs. However, as toour knowledge, no available studies investigate the occurrenceand removal of pharmaceuticals in constructed wetlands forpretreating source water. The comparison of the removal effi-ciency between constructed wetlands and drinking water treat-ment processes (both conventional and advanced treatmentprocesses) is also needed.
Taihu Basin, one of the highly developed and densely pop-ulated regions in China, is situated in the southeastern YangtzeRiver Delta of the East China. Taihu Lake is the third largestfreshwater lake in China, with an average water depth of 1.9 mand a surface water area of 2338 km2. The lake serves as animportant entertainment and tourist attraction. The lake wateris used for agricultural and industrial purposes, and it is alsothe source of drinking water for Shanghai, Suzhou, andWuxi.Along with the rapid development of the economy and theintensive use of water resources, the lake is getting more andmore seriously polluted by various pollutants, including heavymetals and persistent organic pollutant (Wang et al. 2011; Yuet al. 2014). However, the occurrence of emerging pollut-ants such as pharmaceuticals in Taihu Lake has beenscarcely studied (Bu et al. 2013; Xu et al. 2014; Xieet al. 2015), especially the seasonal occurrence. Previouswork (Xu et al. 2014; Xie et al. 2015) only investigated alimited number of pharmaceuticals (<15) in Taihu Lake,and chloramphenicols were never included. Also, the dis-tribution of antibiotic pharmaceutics and nonantibioticpharmaceutics were not compared. Most of all, therewas no information about seasonal variation of thesepharmaceuticals in Taihu Lake. Therefore, it is significantto investigate the seasonal occurrence of multiclass phar-maceuticals in the Taihu Lake.
14890 Environ Sci Pollut Res (2017) 24:14889–14902

The objective of this paper is to investigate the occurrenceand seasonal variations of 25 pharmaceuticals including23 antibiotics (four tetracyclines, three chlorampheni-co l s , s ix su l fonamides and t r ime thopr im, s ixfluoroquinolones, three macrolides), an antipyretic anal-gesic (paracetamol) , and an ant iepi lept ic drug(carbamazepine) in Taihu Lake. The occurrence and re-moval efficiencies of pharmaceuticals in two drinkingwater treatment plants and a constructed wetland forpretreating source water is also investigated and com-pared. The results will provide important backgrounddata for risk assessment and pollutant control. The com-parison among different drinking water treatment tech-niques will also plot an overview of currently usedtechniques for pharmaceuticals’ removal in this area.
Materials and methods
Study areas and sampling site selection of Taihu Lake
The sampling sites were set in several key districts in thenortheastern part of Taihu Lake including mainly WuxiTaihu and Suzhou Taihu. A total of seven sampling sites werechosen, including three sites in the highly polluted MeiliangBay of Wuxi (S1: north latitude 31° 28′ 14.45″ N, east longi-tude 120° 07′ 56.43″ E; S2: north latitude 31° 33′ 1.12″N, eastlongitude 120° 11′ 13.75″ E; S3: north latitude 31° 31′ 34.96″N, east longitude 120° 16′ 1.15″ E), a site in Wuxi Gong Bay(S4: north latitude 31° 22′ 38.13″ N, east longitude 120° 23′18.92″ E), and three sites in Suzhou Taihu (S5: north latitude31° 18′ 37″N, east longitude 120° 20′ 37″E; S6: north latitude31° 13′ 15.76″ N, east longitude 120° 27′ 45.95″ E; S7: northlatitude 31° 05′ 48.54″ N, east longitude 120° 24′ 44.21″ E).Their locations are shown in Fig. 1. Two sampling events wereconducted in June and December, 2015. In June 2015, therainfall was 332.7 mm and the average water level reached3.56 m. In December 2015, the rainfall was 60.1 mm and thewater level was 3.46 m (http://www.tba.gov.cn//tba/, inChinese).
Two drinking water treatment plants and the constructedwetland
Two typical DWTPs, one employing the conventional treat-ment process (A) and the other employing the conventionaltreatment process followed by an advanced treatment process(B), were chosen. These two DWTPs share the same sourcewater from the Taihu Basin. DWTP A employs the conven-tional treatment process, which treats raw water with chlori-nation-coagulation/flocculation–clarification–filtration–chlo-rination sequentially. DWTP B uses an advanced treatmentprocess following the conventional treatment process, which
treats raw water with chlorination-coagulation/flocculation–clarification–filtration–postozonation–granular activated car-bon (GAC) adsorption sequentially. Figure 2a, b shows themain processes of each DWTP and sampling.
The constructed wetland (C) is currently the largest drink-ing source water treatment wetland system in China. It pro-vides purified rawwater for the drinking water plant in JiaxingCity, Taihu Basin. Wetland C mainly uses the constructed rootchannel technology (CRCT) and multilevel ponds/plant bed-ditch system synergic purification technology as the core tech-nologies to purify the micropolluted water source (Zheng et al.2012). Figure 2c shows the main zones of the wetland, includ-ing bio-pretreatment zone, root channel wetland ecologicalpurification zone, ecological purification zone, and advancedpurification zone. Different plants are grown in differentzones, depending on the functions of each zone.
Sample collection
The water samples from the Taihu Lake were collected twicein June and December 2015. The water samples from the twoDWTPs and the constructed wetland were collected inJune 2015. The water samples (4 L per site) were collectedwith a clean stainless steel sampler, and the sampler andprecleaned brown bottles were washed three times with thetarget water sample. The samples were stored at 4 °C to pre-vent degradation. Water samples were extracted within 2 daysfrom the time of collection.
Chemicals, sample preparation, and analysis
All standards of pharmaceuticals and chemicals used in sam-ple preparation and analysis were of HPLC grade or analytical
Fig. 1 Sampling sites in northeastern Taihu Lake
Environ Sci Pollut Res (2017) 24:14889–14902 14891

grade.Water samples were enriched by the solid-phase extrac-tion (SPE) using the Oasis HLB cartridges (500 mg, 6 mL,Waters, Millford, MA, USA). Before extraction, water sam-ples were filtered through 0.45-μm glass fiber filters (GF/F,Whatman, Mainstone, England), and then acidified to pH 3.0with formic acid, followed by adding 0.5 g L−1 Na2EDTA asthe chelating agent. Finally, isotopically labeled internal stan-dards, including sulfamethazine-13C6, sulfamethoxazole-13C6,ciprofloxacin (13C3
15N), erythrocin-13C2, and trimethoprim-D3, were added in the samples with final concentrations at25 ng L−1. Details about SPE cleanup are described inSupplementary material. The pharmaceutical analysis wasperformed by ultra performance liquid chromatography-tandem mass spectrometry (UPLC-MS/MS) (Waters XevoTQ MS, Milford, MA, USA). All 25 pharmaceuticals wereseparated by a 150 mm BEH C18 column. Mass spectrometerdetections of pharmaceuticals were operated in selected reac-tion monitoring mode. The details of separation and massspectrometer parameters for each compound are described inTable S1 (Supplementary material).
Quantitative standard curve was obtained by plotting theratio of the compound peak area with the internal standardpeak area versus their concentrations. A series of mixed stan-dard solutions were prepared (0, 0.1, 0.2, 0.5, 1, 2, 5, 10, 20,50, 100, and 200 ng L−1) to evaluate the linearity. The analyt-ical performance of the SPE-HPLC-MS/MS method was sat-isfying for target compounds, with wide liner ranges (0.1–200 ng L−1) and good correlation coefficients (R2 > 0.99).The limits of detection (LODs) and limits of quantification(LOQs) of 25 pharmaceuticals in surface water ranged from
0.12 to 2.24 ng L−1 and from 0.41 to 7.48 ng L−1, respectively.The recoveries of 25 pharmaceuticals (25 and 50 ng L−1)spiked to filtered surface water samples were mostly in therange of 70 to 110% (n = 3). The intra-day relative standarddeviation (RSD) (n = 3) and inter-day RSD (n = 6) in thesurface water was less than 15 and 25%, respectively.Analysis of reagent blanks demonstrated that the analyticalsystem and glassware were free of contamination. The de-tailed information is shown in Table S2 (Supplementarymaterial).
Results and discussion
Occurrence and seasonal variation of pharmaceuticalsin Taihu Lake
Overview of the occurrence: detection frequencies and levelsof concentrations
Most of the 25 pharmaceuticals were detected at all samplingsites in both sampling events. The results including the aver-age, median, maximum, and minimal concentrations in all thesampling sites, as well as detection frequencies are summa-rized in Table 1. A highest detection frequency of 100% isobserved for 11 pharmaceuticals including four tetracyclines,CAP, SMR, TMP, FLE, ERY, PAR, and CMZP in both Juneand December at all the seven sampling sites. This suggeststhe wide applications of these 11 pharmaceuticals in Taihuarea. A lowest detection frequency (<20%) is observed for
(a) DWTP A
(b) DWTP B
(c) Wetland C
Raw water Primary Treat Zone
(A)
Root channel wetland
Zone 2 (D)
Pump ascending and
Aeration aerobic Zone (C)
Effluent
Root channel
wetland Zone 1 (B)
Advanced purification
Zone (E)
(D) (C)
(B) (A)
Raw water Clarification tank Sand filtration
Chlorination Effluent (E)
Pre-chlorination
Clean well
(C) (B)
(A) Raw water Sand filtration
Post-ozonation GAC adsorption
Clarification tank Pre-chlorination
Clean well Effluent (E)(D)
Fig. 2 The processes andsampling sites in the two drinkingwater treatment plants (DWTPs)and the constructed wetland. aDWTPA. b DWTP B. c WetlandC
14892 Environ Sci Pollut Res (2017) 24:14889–14902

Tab
le1
Detectio
nfrequenciesandconcentrations
of25
pharmaceuticalsin
sevensamplingsitesof
TaihuLake
Com
pound
LogKow
apK
aa
Strongestacidic/basic
ChargeatpH
7.0
June,2015
Decem
ber2015
Frequencyb
(%)Concentratio
n(ngL−1)
Frequency
(%)Concentratio
n(ngL−1)
Aver.c
Med.d
Max.e
Min.f
Ave.c
Med.d
Max.e
Min.f
Tetracyclin
esDoxycycline(D
OX)
−0.02
−2.2,7.5
Negativelycharged
100
5.8
5.0
8.3
3.2
100
19.4
15.6
44.0
9.3
Tetracyclin
e(TC)
−1.30
−2.2,8.24
Negativelycharged
100
20.1
16.9
39.7
12.7
100
17.1
11.9
40.9
10.3
Oxytetracyclin
e(O
TC)
−0.99
0.24,7.75
Negativelycharged
100
16.2
14.1
30.6
8.3
100
20.9
18.5
31.9
14.8
Chlortetracyclin
e(CTC)
––
–100
74.9
17.6
234.7
5.8
100
54.6
54.5
72.8
35.4
Chloram
phenicols
Chloram
phenicol
(CAP)
1.14
7.49,−
2.8
Neutral
100
17.6
16.4
27.1
9.7
100
47.5
45.9
65.5
27.6
Thiam
phenicol
(TAP)
––
864.8
3.3
10.3
<LOD
100
2.9
2.7
5.6
1.2
Florfenicol(FF
)−2
.23
–29
8.8
<LOD
10.1
<LOD
172.6
<LOD
2.6
<LOD
Sulfonam
ides
Sulfapyridine(SPD
)0.35
6.24,2.63
NegativelyCharged
290.2
<LOD
0.4
<LOD
670.3
0.3
0.4
<LOD
Sulfadiazine
(SD)
−0.09
6.99,2.01
NegativelyCharged
862.0
1.0
6.0
<LOD
100
5.1
4.8
7.2
3.3
Sulfam
ethoxazole(SMX)
0.89
6.16,1.97
NegativelyCharged
868.2
8.4
12.4
<LOD
100
2.6
2.2
5.0
1.8
Sulfam
erazine(SMR)
0.14
6.99,2.01
NegativelyCharged
100
2.2
1.8
2.7
1.4
100
1.1
0.9
1.6
0.8
Sulfam
ethazine
(SMZ)
0.89
6.99,2.04
NegativelyCharged
861.8
0.8
6.5
<LOD
100
0.9
0.8
1.6
0.4
Sulfachloropyridazine(SCP)
––
100
2.1
2.2
4.2
0.8
100
1.8
1.4
4.0
0.9
Trimethoprim
(TMP)
0.91
17.33,7.16
Positivelycharged
100
12.1
8.8
29.7
4.7
100
4.8
1.9
14.9
1.5
Fluoroquinolones
Norfloxacin
(NOR)
−1.03
5.77,8.68
Neutral
865.9
6.5
10.5
<LOD
100
11.0
11.1
13.2
9.2
Ciprofloxacin
(CIP)
0.28
5.76,8.68
Neutral
865.2
2.4
16.6
1.9
100
4.3
4.5
6.3
2.0
Enrofloxacin(ENR)
1.88
7116.0
9.7
39.2
<LOD
100
7.1
4.6
23.2
2.1
Ofloxacin
(OFL
)−0
.39
−2.4,5.45
Negativelycharged
712.9
2.4
5.7
<LOD
100
2.6
2.3
4.3
1.9
Fleroxacin
(FLE)
0.24
––
100
4.6
3.5
10.2
2.0
100
2.0
0.8
6.8
0.6
Sarafloxacin
(SAR)
2.5
––
713.5
2.7
8.3
<LOD
100
2.7
2.5
3.9
1.6
Macrolid
esErythromycin
(ERY)
3.06
12.44,8.38
Positivelycharged
100
38.6
35.5
72.6
12.1
100
44.7
42.6
67.5
24.9
Roxithromycin
(ROX)
1.7
12.45,9.08
Positivelycharged
141.0
<LOD
1.0
<LOD
1714.4
15.5
18.4
<LOD
Tylosin(TYL)
3.41
7.1
Neutral
141.2
<LOD
1.2
<LOD
100
1.4
1.0
3.2
0.7
Paracetamol
(PAR)
0.46
9.46,−
4.4
Neutral
100
45.0
44.2
71.7
21.0
100
58.5
55.5
85.2
40.0
Carbamazepine(CMZP)
2.45
−5.96,-3.8
Neutral
100
14.5
12.7
23.6
6.3
100
17.4
17.7
28.5
7.1
LODlim
itof
detection
aLogKow
andpK
aadoptedfrom
Drugbank
bFrequencyof
detectionof
each
antib
iotic
inallw
ater
samples
(n=7)
cAverage
dMedian
eMaxim
umfMinim
al
Environ Sci Pollut Res (2017) 24:14889–14902 14893

ROX in both June and December in Taihu Lake. The detectionfrequency of 21 pharmaceuticals is higher than 70% in the wetseason (June), except for FF (29%), SPD (29%), ROX (14%),and TYL (14%). The detection frequency of 22 pharmaceuti-cals is 100% in the dry season (December), except for FF(17%), SPD (67%), and ROX (17%). From Table 1, we canalso see that the number of compounds with a 100% detectionfrequency is 22 (accounting for 88% of the 25 compounds)and 12 (accounting for 48% of the 25 compounds) in dryseason (December) and wet season (June), respectively. Forall the individual pharmaceuticals except for FF, the detectionfrequency is higher in dry season (December) than that in wetseason (June). Figure S1 shows that 18 to 25 compounds weredetected in June, whereas 23 to 25 compounds were detectedin December in each sampling site. For the same samplingsite, a larger number of detected compounds were also ob-served in December than that in June. In general, the detectionfrequency of pharmaceuticals in Taihu Lake is higher in dryseason than that in the wet season.
Concentrations of all detected pharmaceuticals were typi-cally in the ng L−1 level (Table 1). In June, the average con-centrations were in the range of 0.2 to 74.9 ng L−1, the medianconcentrations were in the range of 0.8 to 35.5 ng L−1, and themaximum concentration was 234.7 ng L−1 (CTC, S1). InDecember, the average concentrations were in the range of0.3 to 58.5 ng L−1, the median concentrations were in therange of 0.3 to 55.5 ng L−1, and the maximum concentrationwas 85.2 ng L−1 (PAR, S5). In June, CTC showed the highestaverage concentration (74.9 ng L−1) and maximum concentra-tion (234.7 ng L−1); PAR showed the second highest detectionconcentrations (average concentration 45.0 ng L−1, maximumconcentration 71.7 ng L−1). In December, PAR showed thehighest detection concentrations (average concentration55.5 ng L−1, maximum concentration 85.2 ng L−1), followedby CTC, with the average concentration of 54.6 ng L−1 andmaximum concentration of 72.8 ng L−1. SPD showed thelowest concentrations in both June and December (maximumconcentration 0.4 ng L−1). The highest concentrations of CTCand PAR suggest that these two compounds should be paidmore attention to.
Seasonal variation and spatial distribution
Tetracyclines are broad spectrum antibiotics and the secondwidely used human and/or veterinary antibiotics in the world(Bu et al. 2013). All four tetracyclines were detected at a fre-quency of 100%. In June, CTC (average 74.9 ng L−1, maxi-mum 234.7 ng L−1) was found to be the compound with thehighest concentration among all 25 analytes, followed by TC(average 20.1 ng L−1, maximum 39.7 ng L−1), OTC (average16.2 ng L−1, maximum 30.6 ng L−1), and DOX (average5.8 ng L−1, maximum 8.3 ng L−1). In December, highest aver-age concentrations were also observed for CTC (54.6 ng L−1),
followed by OTC (20.9 ng L−1), DOX (19.4 ng L−1), and TC(17.1 ng L−1). Nearly all studies selected TC and OTC as targetcontaminants in the survey of water contamination in China bytetracyclines, due to the fact that the two chemicals were onceadministrated in China for human and veterinary uses (Bu et al.2013). The other two tetracyclines (CTC and DOX) were sel-dom reported in the natural water probably due to their strongabsorption to sediments and particles as well as degradation(Sarmah et al. 2006; Bu et al. 2013). The concentration levelsof tetracyclines in Taihu Lake were comparable to these insurface waters of China and the world (ND −1036 ng L−1)(Watkinson et al. 2009; Bu et al. 2013).
Chloramphenicols were detected at different frequencies andaverage concentrations in June and December. Only CAP wasdetected at 100% in both June and December. The highestaverage concentration was observed for CAP (17.6 ng L−1 inJune, 47.5 ng L−1 in December), followed by FF (8.8 ng L−1 inJune). Comparable average concentrations were found for FF(2.6 ng L−1 in December) and TAP (4.8 ng L−1 in June,2.9 ng L−1 in December). The maximum concentrations ofchloramphenicols were 65.5 ng L−1 (December), 10.3 ng L−1
(June), and 10.1 ng L−1 (June) for CAP, TAP, and FF, respec-tively. Chloramphenicols are seldom investigated in Chinesesurface waters or throughout the world (Jiang et al. 2011; Buet al. 2013; Yan et al. 2015a). The chloramphenicol values inTaihu Lake were comparable to or relatively lower than those inChina and the world (ND −266 ng L−1) (Jiang et al. 2011; Buet al. 2013; Yan et al. 2015a).
Sulfonamides and trimethoprim are most frequently report-ed antibiotics in surface water (Jiang et al. 2011; Bu et al.2013). SMZ, SMX, and SD are the extensively studied sul-fonamides in China due to their use in veterinary medicines(Bu et al. 2013). TMP was detected at a 100% frequency inboth June and December, with the maximum concentration of29.7 ng L−1 (June) and 14.9 ng L−1 (December). Two sulfon-amides (SMR, SCP) in June and five sulfonamides (six out ofSPD) in December were detected at a 100% frequency.Sulfonamides and trimethoprim have high potential to resistdegradation and are hydrophilic enough (logKow < 1, Table 1)to transport in the aquatic environment for a long distance.These properties might contribute to their high detection fre-quencies in the aquatic environment. The average concentra-tions of sulfonamides ranged from 0.2 ng L−1 (SPD) to8.2 ng L−1 (SMX) in June and from 0.3 ng L−1 (SPD) to5.1 ng L−1 (SD) in December. Maximum concentrations ofall the six sulfonamides were below 10 ng L, except forSMX (12.4 in June). The concentrations of sulfonamides inTaihu Lake is comparable to or lower than that reported inother areas of China (ND −940 ng L−1) (Jiang et al. 2011;Bu et al. 2013; Wang et al. 2015) or throughout the world(Choi et al. 2008; Vulliet and Cren-Olivé 2011).Concentrations of most individual sulfonamide were relatedto the highly populated megacities such as Beijing, Shanghai,
14894 Environ Sci Pollut Res (2017) 24:14889–14902
and Guangzhou in China. The intensive aquacultural andpoultry–fishery activities could be other sources of sulfon-amides (Bu et al. 2013).
Fluoroquinolones are the most important synthetic antibi-otics produced and consumed as both human and veterinarymedicines in China. Fluoroquinolones were detected at highfrequencies ranging from 71 to 100%, of which FLE in Juneand all the six compounds in December were detected at a100% frequency. The average concentrations ranged from2.9 ng L−1 (OFL) to 16.0 ng L−1 (ENR) in June and2.0 ng L−1 (FLE) to 11.0 ng L−1 L (NOR) in December. Themaximum concentrations were observed for ENR both in June(39.2 ng L−1) and December (23.2 ng L−1). Significantly higherdetection frequencies and remarkably higher concentrations offluoroquinolones were found in our study than those reported inprevious work (ND) (Jiang et al. 2011). However, these con-centrations were comparable to or slightly lower than thosereported in most studies conducted in other places throughoutthe world (ND −634 ng L−1) (Bu et al. 2013).
Macrolides were detected at average concentrations rangingfrom 1.0 (ROX) to 38.6 ng L−1 (ERY) in June, and 1.4 (TYL)to 44.7 ng L−1 (ERY) in December. A high detection frequencyat 100% was observed for ERY in both June and December,whereas a detection frequency lower than 17% was observedfor ROX in both June and December and TYL in June (14%).The higher concentrations of ERY might be due to thebiodegradation-resistant of ERY (McArdell et al. 2003). PARand CMZP were detected at average concentrations of45.0 ng L−1 in June and 58.5 ng L−1 in December, as well as14.5 ng L−1 in June and 17.4 ng L−1 in December. The detec-tion frequency of PAR and CMZP was 100% in all the sam-pling events. Concentrations of macrolides in the Taihu Lakewere much higher than those in the Huangpu River (Jiang et al.2011) and lower than those in the Yangtze River, China (Wuet al. 2014). Comparable concentrations of PAR (41 ng L−1) inthe Yangtze River were also observed by Wu et al. (2014).Comparable concentrations or lower levels of macrolides wereobserved in the Taihu Lake in a global scale (ND −3700 ng L−1)(Bu et al. 2013). However, significantly higher concentrationsof PAR and CMZPwere observed in the Taihu Lake in a globalview (global PAR ND −230 ng L−1 and CMZP ND−8.05 ng L−1) (aus der Beek et al. 2016).
Generally, the overall contamination levels of antibioticpharmaceutics in the Taihu Lake were lower than or compa-rable to those reported worldwide (Ferrer et al. 2010; Bu et al.2013; Wu et al. 2014; Wang et al. 2015). However, for non-antibiotic pharmaceutics, PAR and CMZP, significantlyhigher concentrations were observed in the Taihu Lake in aglobal scale (aus der Beek et al. 2016). High detection fre-quencies (>70%) were observed for nearly all the 25pharmaceutics except for FF, SPD, ROX, and TYL.Tetracyclines, CAP, ERY, PAR, and CMZP are compoundswith both a high detection frequency (100%) and the highest
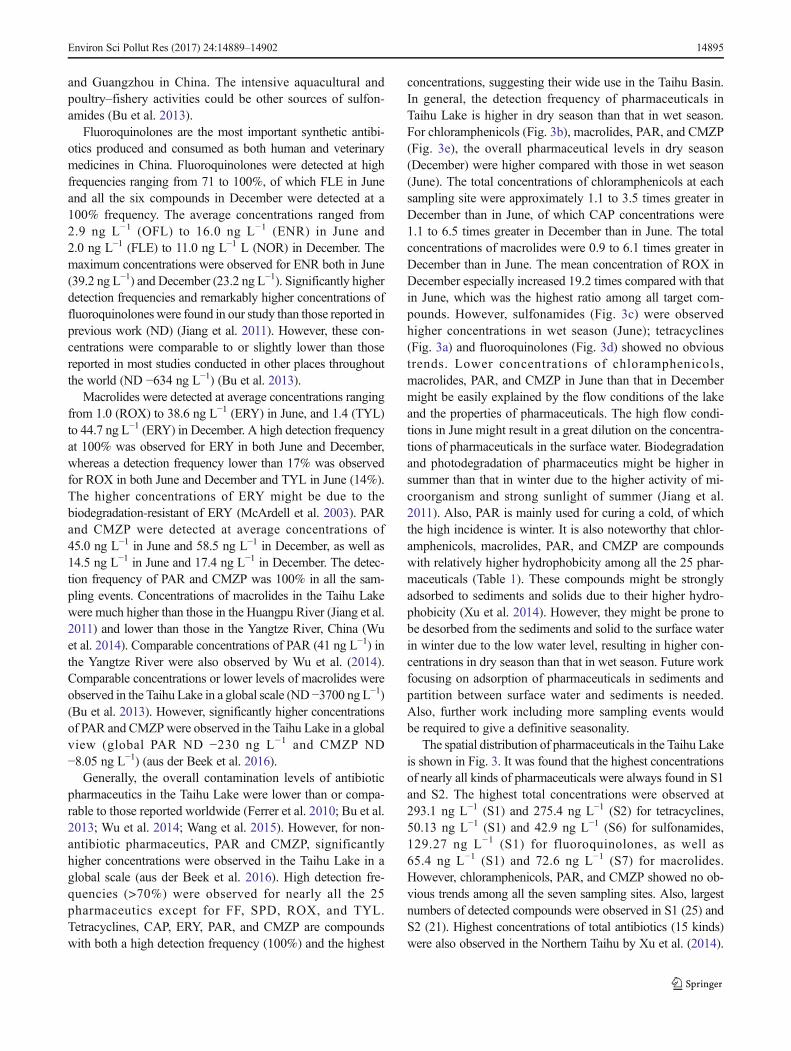
concentrations, suggesting their wide use in the Taihu Basin.In general, the detection frequency of pharmaceuticals inTaihu Lake is higher in dry season than that in wet season.For chloramphenicols (Fig. 3b), macrolides, PAR, and CMZP(Fig. 3e), the overall pharmaceutical levels in dry season(December) were higher compared with those in wet season(June). The total concentrations of chloramphenicols at eachsampling site were approximately 1.1 to 3.5 times greater inDecember than in June, of which CAP concentrations were1.1 to 6.5 times greater in December than in June. The totalconcentrations of macrolides were 0.9 to 6.1 times greater inDecember than in June. The mean concentration of ROX inDecember especially increased 19.2 times compared with thatin June, which was the highest ratio among all target com-pounds. However, sulfonamides (Fig. 3c) were observedhigher concentrations in wet season (June); tetracyclines(Fig. 3a) and fluoroquinolones (Fig. 3d) showed no obvioustrends. Lower concentrations of chloramphenicols,macrolides, PAR, and CMZP in June than that in Decembermight be easily explained by the flow conditions of the lakeand the properties of pharmaceuticals. The high flow condi-tions in June might result in a great dilution on the concentra-tions of pharmaceuticals in the surface water. Biodegradationand photodegradation of pharmaceutics might be higher insummer than that in winter due to the higher activity of mi-croorganism and strong sunlight of summer (Jiang et al.2011). Also, PAR is mainly used for curing a cold, of whichthe high incidence is winter. It is also noteworthy that chlor-amphenicols, macrolides, PAR, and CMZP are compoundswith relatively higher hydrophobicity among all the 25 phar-maceuticals (Table 1). These compounds might be stronglyadsorbed to sediments and solids due to their higher hydro-phobicity (Xu et al. 2014). However, they might be prone tobe desorbed from the sediments and solid to the surface waterin winter due to the low water level, resulting in higher con-centrations in dry season than that in wet season. Future workfocusing on adsorption of pharmaceuticals in sediments andpartition between surface water and sediments is needed.Also, further work including more sampling events wouldbe required to give a definitive seasonality.
The spatial distribution of pharmaceuticals in the Taihu Lakeis shown in Fig. 3. It was found that the highest concentrationsof nearly all kinds of pharmaceuticals were always found in S1and S2. The highest total concentrations were observed at293.1 ng L−1 (S1) and 275.4 ng L−1 (S2) for tetracyclines,50.13 ng L−1 (S1) and 42.9 ng L−1 (S6) for sulfonamides,129.27 ng L−1 (S1) for fluoroquinolones, as well as65.4 ng L−1 (S1) and 72.6 ng L−1 (S7) for macrolides.However, chloramphenicols, PAR, and CMZP showed no ob-vious trends among all the seven sampling sites. Also, largestnumbers of detected compounds were observed in S1 (25) andS2 (21). Highest concentrations of total antibiotics (15 kinds)were also observed in the Northern Taihu by Xu et al. (2014).
Environ Sci Pollut Res (2017) 24:14889–14902 14895

The reason might be the high pollution of Meiliang Bay (S1and S2) in the northern Taihu Lake, due to the dense populationand advanced economy around Suzhou and Wuxi City.
Occurrence and removal of pharmaceuticals in twoDWTPs and a constructed wetland
Overview of the occurrence: detection frequencies and levelsof concentrations
As shown in Table S3, pharmaceuticals were detected in boththe two water factories, with a detection frequency at 100%except for FF and SPD. Similarly, exclude SPD and FF, 23
chemicals were detected at a frequency higher than 60 (19chemicals at 100%) in the wetland. This high detection frequen-cy demonstrates ubiquitous of pharmaceuticals in the DWTPwith both the conventional treatment process or the advancedtreatment process and the wetland. The concentrations of phar-maceuticals were in the ranges of <LOD (FF, SPD) to473.5 ng L−1 (ERY), <LOD (FF) to 404.7 ng L−1 (ERY), and<LOD to 59.5 ng L−1 (TYL) in DWTPA, DWTP B, and wet-land C, respectively. ERY was observed the highest concentra-tions in both the waters factories and the wetland C, followed byPAR (27.3, 53.1, and 29.0 ng L−1 in DWTPA, DWTP B, andwetland C, respectively). Other 23 pharmaceuticals were allobserved at low concentrations in the two factories and the
(a)
site1 site2 site3 site4 site5 site6 site70
50
100
150
200
250
300
Tetra
cycl
ines
con
cent
rtatio
n(ng
/L) CTC
OTC TC DOX
(b)
site1 site2 site3 site4 site5 site6 site70
10
20
30
40
50
60
70
80
Chl
oram
phen
icol
s co
ncen
trtat
ion(
ng/L
) FF TAP CAP
(c)
site1 site2 site3 site4 site5 site6 site70
5
10
15
20
25
30
35
40
45
50
Sulfo
nam
ides
con
cent
rtatio
n (n
g/L) TMP
SCP SMZ SMR SMX SD SPD
site1 site2 site3 site4 site5 site70
50
100
150
200
250
300
Tetra
cycl
ines
con
cent
rtatio
n(ng
/L) CTC
OTC TC DOX
June December
site1 site2 site3 site4 site5 site70
10
20
30
40
50
60
70
80
Chl
oram
phen
icol
s co
ncen
trtat
ion(
ng/L
) FF TAP CAP
site1 site2 site3 site4 site5 site70
5
10
15
20
25
30
35
40
45
50
Sulfo
nam
ides
con
cent
rtatio
n (n
g/L)
TMP SCP SMZ SMR SMX SD SPD
Fig. 3 Seasonal and spatial distributions of 25 pharmaceuticals in Taihu Lake. aTetracyclines. bChloramphenicols. c Sulfonamides and trimethoprim. dFluoroquinolones. e Macrolides, paracetamol, and carbamazepine
14896 Environ Sci Pollut Res (2017) 24:14889–14902

wetland C (<20 ng L−1), except for FLE (25.8 ng L−1) and ENR(23.2 ng L−1) in DWTP B, as well as NOR and ENR(23.1 ng L−1) in wetland C. Highest concentrations of ERYand PAR were observed in water supply sources (DWTPs andthe wetland) among all the 25 pharmaceuticals, which is inconsistent to that in the surface water of Taihu Lake.
Removal efficiencies
The concentration variations of 25 pharmaceuticals in variedcomponents of the two water factories and the wetland areshown in Fig. 4. In general, the concentrations decreased aftervarious water treatment processes. Only two out of the 25compounds (FF and SPD) were not detected in the effluent(finished water) of the two water factories, whereas four out of25 compounds (DOX, SPD, CIP, and ROX) were not detectedin the effluent (finished water) of wetland C. As shown inTable 2, the removal efficiencies were 2.9 to 100% inDWTP A with conventional water treatment process, 16.7 to100% in DWTP B with advanced water treatment process,and 24.2 to 100% in wetland C with biological treatmentprocesses. Except for sulfonamides, one chloramphenicol(CAP) and one macrolide (ROX), overall higher removal ef-ficiencies were observed in B factor (advanced water treat-ment process) than those in DWTP A (conventional watertreatment process). Low removal efficiencies (<50%) were
observed for 10 out of 25 compounds in DWTPA, including4 tetracyclines except for CTC (52.1%), 1 chloramphenicol(TAP 0), 1 sulfonamides (SMZ, 33.3%), TMP (44%), 2fluoroquinolones (CIP 30.2%, SAR 46.7%), and 2 macrolides(ROX 49.1%, TYL 5.3%). Similarly, low removal efficiencies(<50%) were observed for 8 out of 25 compounds in DWTPB, including 2 tetracyclines (DOX 48.4%, CTC 45.6%), 1chloramphenicols (TAP 25%), 2 sulfonamides (SD 45.1%,SMX 16.7%), 1 fluoroquinolone (SAR 43.5%), and 2macrolides (ROX 31.8%, TYL 38.8%). However, only 6 outof 25 compounds were observed at low removal efficiencies(<50%) in wetland C, including 2 tetracyclines (TC 24.2%,CTC 28.4%), 1 chloramphenicol (CAP 43.3%), 2 sulfon-amides (SMZ 42.4%, SCP 29.6), and 1 fluoroquinolone(NOR, 35%). The general good removal efficiencies for mostpharmaceuticals by wetland C were consistent with previousresearch (Li et al. 2014) about removal of pharmaceuticals byconstructed wetlands. Our results indicated that both the twowater factories and the wetland can only efficiently remove alimited number of the 25 pharmaceuticals. In general, DWTPB with advanced treatment processes was superior to DWTPA with conventional treatment processes, except for sulfon-amides. Wetland C could be used prior to the water factors inorder to complement the water treatment processes in the wa-ter factories because high removal efficiencies were observedfor different pharmaceuticals.
(d)
site1 site2 site3 site4 site5 site6 site70
10
20
30
40
50
60
70
Fluo
roqu
inol
ones
con
cent
rtatio
n(ng
/L)
SAR FLE OFL ENR CIP NOR
(e)
site1 site2 site3 site4 site5 site6 site70
20
40
60
80
100
120
140
160
180
200
Mac
rolid
es P
AR C
MZP
con
cent
rtatio
n (n
g/L)
CMZP PAR TYL ROX ERY
site1 site2 site3 site4 site5 site70
10
20
30
40
50
60
70
Fluo
roqu
inol
ones
con
cent
rtatio
n(ng
/L)
SAR FLE OFL ENR CIP NOR
site1 site2 site3 site4 site5 site70
20
40
60
80
100
120
140
160
180
200
Mac
rolid
es P
AR C
MZP
con
cent
rtatio
n (n
g/L)
CMZP PAR TYL ROX ERY
Fig. 3 continued.
Environ Sci Pollut Res (2017) 24:14889–14902 14897

In the conventional water treatment processes (DWTPA),coagulation/flocculation process (deposition) was very effi-cient for most of the compounds, especially good for sulfon-amides and trimethoprim (total removal efficiency 43.48%),fluoroquinolones (total removal efficiency 56.72%), andmacrolides (total removal efficiency 47.09%) (Fig. 4).However, the total removal efficiencies for tetracyclines(14.83%), chloramphenicols except FF, PAR, and CMZPwere negligible (<15%). Coagulation/flocculation primarilyaids in removing suspended solids (turbidity), high molecularweight natural organic matter, and micropollutants withlogKow >5. In this step, flocculant (aluminum sulfate) wasadded into the water sample and the suspended particles wereflocculated and removed from the water phase. Some of thestudied pharmaceuticals which are ionic at the current waterpH may adsorb to particles and to the flocs formed in thecoagulation by electrostatic interactions. Thus, the
pharmaceuticals were removed simultaneously with the sedi-mentation. Good removal efficiency in our study was incon-sistent to previous work, in which coagulation showed negli-gible effects on removal of pharmaceuticals (Vieno et al.2007; Huerta-Fontela et al. 2011; Yan et al. 2015b). Low re-moval efficiency of coagulation/flocculation may be due tothe lack of the suspended particulates in the raw water, andthe removal could be improved by the particulate matter ini-tially present in the water (Westerhoff et al. 2005). Thus, thesuspended particulates in the raw water may improve the re-moval of pharmaceuticals. It was noteworthy to find that theconcentrations of nearly all the compounds increased aftersand filtration in DWTPA, especially significant increase fortetracyclines and ERY. The probable reason was that tetracy-clines and ERY were absorbed by the sand and then desorbed.The final treatment step was based on an oxidation processwith chlorineanie. It was found that chlorination was very
(a)
(b)
inffluent sand O3 GAC enffluent
0
10
20
30
40
50
60
Tetr
acycline
s c
oncentr
ation(ng/L
)
CTC
OTC
TC
DOX
A B C D E
0
10
20
30
40
50
60
Tetr
acyclin
es c
on
cen
tra
tion
(n
g/L
)
CTC
OTC
TC
DOX
inffluent deposit sand after Cl enffluent
0
10
20
30
40
50
60
Tetr
acyclines c
oncentr
ation(ng/L
)
CTC
OTC
TC
DOX
inffluent deposit sand after Cl effluent
0
2
4
6
8
10
12
14
16
Chlo
ram
phenic
ols
concentr
ation(ng/L
)
FF
TAP
CAP
inffluent sand O3 GAC enffluent
0
2
4
6
8
10
12
14
16
Ch
lora
mp
hen
ico
ls c
on
ce
ntr
atio
n(n
g/L
)
FF
TAP
CAP
A B C D E
0
2
4
6
8
10
12
14
16
Chlo
ra
mp
he
nic
ols
con
ce
ntr
atio
n(n
g/L
)
FF
TAP
CAP
DWTP B Wetland CDWTP A
(c)
inffluent deposit sand after Cl effluent
0
10
20
30
40
50
60
Su
lfo
na
mid
es c
on
ce
ntr
atio
n(ng
/L) TMP
SCP
SMZ
SMR
SMX
SD
SPD
inffluent sand O3 GAC enffluent
0
10
20
30
40
50
60
Su
lfo
na
mid
es c
on
ce
ntr
atio
n(ng
/L)
TMP
SCP
SMZ
SMR
SMX
SD
SPD
A B C D E
0
5
10
50
60
Su
lfo
na
mid
es c
on
ce
ntr
ation
(ng
/L)
TMP
SCP
SMZ
SMR
SMX
SD
SPD
Fig. 4 Concentrations of 25 pharmaceuticals in various compartments of the DWTPA, DWTP B, and wetland C. a Tetracyclines. b Chloramphenicols.c Sulfonamides and trimethoprim. d Fluoroquinolones. e Macrolides, paracetamol, and carbamazepine
14898 Environ Sci Pollut Res (2017) 24:14889–14902

efficient for nearly all the compounds except for sulfon-amides. Previous work also demonstrated that various phar-maceuticals including macrolides, sulfonamides, hormones,and acid drugs like diclofenac (DIF) and naproxen were alsoefficiently removed by chlorination (Stackelberg et al. 2007).However, negligible removal of pharmaceuticals was ob-served in a recent work (Yan et al. 2015b), probably becausethe removal efficiency was influenced by the weather condi-tions, operational states of DWTPs, the sampling protocol,and the concentration levels of pharmaceuticals (Huerta-Fontela et al. 2011; Yan et al. 2015b).
In the advanced water treatment processes (DWTP B),ozonation with O3 and GAC adsorption were only efficientfor fluoroquinolones, macrolides, PAR, and CMZP (Fig. 4d,e), which can well explain why general higher removal effi-ciencies for these compounds in DWTP B than these inDWTPA. This removal matches well to published results thatozonation and GAC were effective in removing pharmaceuti-cals (Cai et al. 2015). However, other compounds like tetra-cyclines, chloramphenicols, sulfonamides, and trimethoprimwere removed mainly depending on traditional processes suchas prechlorination and coagulation/flocculation in DWTP B.Conversely, concentrations of tetracyclines, chlorampheni-cols, sulfonamides, trimethoprim, and PAR increased afterO3 (Fig. 4a–c). Similar concentration increases after O3 werealso observed for several pharmaceuticals, such as bezafibrate,sulfamethoxazole, carbamazepine, and ibuprofen, in a recentwork (Cai et al. 2015). In ozone treatment, ozone (O3) attacksthe organic contaminants either by direct reaction (as
molecular O3) or through the formation of free radicals, suchas the hydroxyl radical (·OH), and usually results in the re-moval of organic compounds. The probably reason for con-centration increase was that those compounds showed lowreactivity with O3 (Cai et al. 2015). In addition, although theparent compounds of some pharmaceuticals can be effectivelyremoved by ozonation, their possible more toxic transforma-tion products should not be ignored. The GAC filtration pro-cesses are just transferring contaminants from a liquid phase toa solid phase, in which processes the hydrophobicity(logKow) and molecule states (protonation or ionization) ofthe compounds in aquatic environment pH (Vieno et al. 2007)play a key role for the adsorption. Therefore, GAC filtrationwas found to result in an intermediate removal for severalpharmaceuticals (carbamazepine andibuprofen) in literature(Cai et al. 2015), and it was not surprising to find that com-pounds like tetracyclines, chloramphenicols, sulfonamides,and trimethoprim in our study were not removed by GAC.
In the constructed wet land, the substrate, plants, and mi-crobes are utmost important for understanding the removalmechanisms. Substrate, such as soil, gravel, and biosorbents(such as corn straws and Kochia straws in our study) is animportant component in constructed wetlands, which not onlyprovides support for the growth of plants and microorganismsbut also interacts directly with contaminants through sorptionprocesses. Sorption of pollutants onto the surface of substrateinvolves different mechanisms such as hydrophobicpartitioning, van der Waals interaction, and electrostatic inter-action. Nonpolar organic pollutants can be preferentially
(d)
inffluent deposit sand after Cl effluent
0
10
20
30
40
50
90
100
Flu
oro
quin
olo
ne
s c
on
ce
ntr
ation
(n
g/L
)
SAR
FLE
OFL
ENR
CIP
NOR
inffluent sand O3 GAC enffluent
0
20
40
60
80
100
Flu
oroquin
olo
nes c
oncentr
ation(ng/L
)
SAR
FLE
OFL
ENR
CIP
NOR
A B C D E
0
10
20
30
40
90
100
Flu
oro
qu
ino
lon
es c
on
cen
tra
tio
n(n
g/L
)
SAR
FLE
OFL
ENR
CIP
NOR
(e)
inffluent deposit sand after Cl effluent
0
50
300
400
500
Ma
crolid
es P
AR
CM
ZP
con
ce
ntr
ation
(ng
/L)
CMZP
PAR
TYL
ROX
ERY
inffluent sand O3 GAC enffluent
0
50
250
300
350
400
450
500M
acrolid
es P
AR
CM
ZP
con
ce
ntr
ation
(ng
/L)
CMZP
PAR
TYL
ROX
ERY
A B C D E
0
20
40
60
80
490
500
Ma
cro
lide
s P
AR
CM
ZP
co
nce
ntr
atio
n(n
g/L
)
CMZP
PAR
TYL
ROX
ERY
Fig. 4 continued.
Environ Sci Pollut Res (2017) 24:14889–14902 14899

adsorbed to the substrate materials via hydrophobic interac-tion, whereas polar pollutants such as target pharmaceuticalsin our study are dominantly adsorbed to the substrate materialsby electrostatic interactions (Dordio and Carvalho 2013).Plants in constructed wetlands play a significant role in directuptake of many organic pollutants from water. For pharma-ceuticals, the uptake by plants is mainly driven by diffusion, inwhich process the physicochemical characteristics of pharma-ceuticals such as hydrophobicity (logKow) is of vital impor-tance (Dordio and Carvalho 2013). Besides direct uptake, theinternal pharmaceuticals might be degraded via thephytodegradation, including a series of biochemical reactionssuch as transformation of parent organic pollutants, conjuga-tion of metabolites with macromolecules, and incorporation ofconjugated products into plant cell walls and vacuoles. Plantsin constructed wetlands also play another important role instimulating the development and activities of microbial popu-lations which are supported by the rhizodeposition products(exudates, mucigels, dead cell material), causing various
biological processes to occur in the rhizosphere (Li et al.2014). Microbes in constructed wetlands usually play themain role in the processes of transformation and mineraliza-tion of organic pollutants. It was reviewed (Li et al. 2014) thataerobic biodegradation was thought to be the main contribu-tion to the microbial degradation process of ibuprofen,salicylic acid, and sulfamethoxazole, whereas anaerobic bio-degradation was thought to be responsible for naproxen andcaffeine. However, the degradation mechanisms of pharma-ceuticals bymicroorganisms in constructed wetlands may alsobe influenced by the substrate, vegetation, oxygen and redoxpotential, temperature, pH, nutrient available, and presence oftoxic substances, etc. Thus, it is still difficult to describe theactual removal mechanisms of pharmaceuticals in constructedwetlands to date.
Wetland C was very efficient for the removal of nearly allkinds of pharmaceuticals. Chloramphenicols (up to 84.8%)and sulfonamides (up to 70.0%) were mainly removed bythe root channel wetland zone 1 (Fig. 4, process B), whereaso the r pha rmaceu t i ca l s i nc lud ing te t r acyc l ines ,fluoroquinolones, ERY, PAR, and CMZP were mainly re-moved by the pump ascending and aeration aerobic zone (pro-cess C). In the root channel wetland zone 1 (process B), ad-sorption and biodegradation by plants, biosorbents, and soilcontributed to the removal, suggesting that these process wereeffective for chloramphenicols and sulfonamides. However, inthe pump ascending and aeration aerobic zone (process C), theorganic compounds might be degraded by the complex pro-cesses including alternate redox interception, biodegradation,sorption by the solid, and synergy effects between physical,chemical, and biological approach of microorganisms. Theprevalence of aerobic conditions in the wetland promotes bio-chemical pathways, such as aerobic respiration, that are moreefficient in removing most emerging pollutants than anaerobicpathways (Matamoros et al. 2008). The fact that the mass of apollutant in the effluent is lower than in the influent does notimply that the compound has been eliminated in the construct-ed wetland. Although it is true that some pollutants may havebeen degraded, transformed, or even mineralized in the con-structed wetland, and their remains are expelled with the ef-fluent, many others may have been retained as original com-pounds or as transformation products (TPs) in the wetlandcompartments (physical retention on the substrate or organicmatter, adsorption onto biofilm or roots, incorporation to mi-crobial biomass or to vegetal tissues, permanence in porewater).
Conclusions
The overall contamination levels (0.2–74.9 ng L−1) of antibi-otic pharmaceutics in the Taihu Lake were lower than or com-parable to those reported worldwide. However, for
Table 2 The efficiencies of removal of pharmaceuticals in DWTPs andthe wetland
Compounds Removal efficiency (%)
DWTPA DWTP B Wetland C
Tetracyclines DOX 2.9 48.4 100
TC 27.3 72.4 24.2
OTC 25.3 71.3 76.1
CTC 52.1 45.6 28.4
Chloramphenicols CAP 92.6 70.4 43.3
TAP 0 25.0 71.4
FF 100 100 84.8
Sulfonamides SPD – 100 –
SD 76.4 45.1 61.7
SMX 52.9 16.7 70.0
SMR 59.3 51.1 56.4
SMZ 33.3 67.2 42.4
SCP 56.8 52.4 29.6
Trimethoprim TMP 44.0 72.4 63.2
Fluoroquinolones NOR 30.2 74.8 35.0
CIP 52.1 70.8 100
ENR 54.0 58.2 70.2
OFL 85.9 72.7 94.6
FLE 72.7 61.4 66.7
SAR 46.7 43.5 74.1
Macrolides ERY 98.8 96.8 61.7
ROX 49.1 31.8 –
TYL 5.3 38.8 –
Paracetamol PAR 79.8 83.6 69.1
Carbamazepine CMZP 64.3 86.0 59.0
– not available
14900 Environ Sci Pollut Res (2017) 24:14889–14902

nonantibiotic pharmaceutics, PAR (45.0 ng L−1) and CMZP(14.5 ng L−1), significantly higher concentrations were ob-served in the Taihu Lake in a global scale. High detectionfrequencies (>70%) were observed for nearly all the 25pharmaceutics except for FF, SPD, ROX, and TYL.Tetracyclines (CTC max. 234.7 ng L−1), CAP (max.27.1 ng L−1), ERY (max. 72.6 ng L−1), PAR (max.71.7 ng L−1), and CMZP (max. 23.6 ng L−1) are compoundswith both high a detection frequency (100%) and the highestconcentrations, suggesting their wide use in the Taihu Basin.The detection frequency of pharmaceuticals in Taihu Lake ishigher in dry season than that in wet season. However, anobvious seasonal variation trend (higher level in dry season)was only observed for chloramphenicols, macrolides, PAR,and CMZP, probably due to the low flow conditions of thelake in winter and the properties of pharmaceuticals. Besides,PAR is mainly used for curing a cold, of which the highestincidence is winter.
High detection frequencies of pharmaceuticals were detect-ed in both the two water factories (100%) and the wetland(>60%, 19 chemicals at 100%) except for FF and SPD, dem-onstrating ubiquitous of pharmaceuticals in the DWTP withboth the conventional treatment process or the advanced treat-ment process and the wetland. The highest concentrations ofERY (473.5 ng L−1) and PAR (53.1 ng L−1) were observed inwater supply sources (DWTPs and the wetland) among all the25 pharmaceuticals, which is in consistent to that in the sur-face water of Taihu Lake. Our results indicated that both thetwo water factories and the wetland can only efficiently re-move a limited number of the 25 pharmaceuticals. In general,DWTP B with advanced treatment processes including ozon-ation and granular activated carbon filtration was superior toDWTP A with conventional treatment processes, except forsulfonamides. Wetland C could be used prior to the waterfactors in order to complement the water treatment processesin the water factories because higher removal efficiencieswere observed for a variety of pharmaceuticals. Therefore,the application of cost-effective technologies such as con-structed wetlands should be considered as an efficient alterna-tive for reducing the amount of emerging contaminants suchas pharmaceuticals from water supply sources. Further studiesshould be conducted to assess their efficiency as a polishingstep of conventional sauce water treatments and in the remov-al of a wide range of pollutants such as pharmaceuticals.
Acknowledgements This work was supported by the National NaturalScience Foundation of China (grant numbers 21277100 and 21577103)and the Major Science and Technology Program for Water PollutionControl and Treatment (2014ZX07402001). It was also in part fundedthrough support from the Swedish Research Council to the project(D0691301).
References
Aus der Beek T, Weber FA, Bergmann A, Hickmann S, Ebert I, Hein A,Küster A (2016) Pharmaceuticals in the environment—global oc-currences and perspectives. Environ Toxicol Chem 35:823–835.doi:10.1002/etc.3339
Bu Q, Wang B, Huang J, Deng S, Yu G (2013) Pharmaceuticals andpersonal care products in the aquatic environment in China: a re-view. J Hazard Mater 262:189–211. doi:10.1016/j.jhazmat.2013.08.040
Cai MQ, Wang R, Feng L, Zhang LQ (2015) Determination of selectedpharmaceuticals in tap water and drinking water treatment plant byhigh-performance liquid chromatography-triple quadrupole massspectrometer in Beijing, China. Environ Sci Pollut Res 22:1854–1867. doi:10.1007/s11356-014-3473-8
Choi K, Kim Y, Park J, Park CK, Kim M, Kim HS, Kim P (2008)Seasonal variations of several pharmaceutical residues in surfacewater and sewage treatment plants of Han River, Korea. Sci TotalEnviron 405:120–128. doi:10.1016/j.scitotenv.2008.06.038
Corcoran J, Winter MJ, Tyler CR (2010) Pharmaceuticals in the aquaticenvironment: a critical review of the evidence for health effects inf i s h . C r i t Rev Tox i c o l 40 : 287–304 . do i : 10 . 3109 /10408440903373590
de Jesus GV, Almeida CM, Rodrigues A, Ferreira E, Benoliel MJ,Cardoso VV (2015) Occurrence of pharmaceuticals in a water sup-ply system and related human health risk assessment. Water Res 72:199–208. doi:10.1016/j.watres.2014.10.027
Dordio AV, Carvalho AJ (2013) Organic xenobiotics removal in con-structed wetlands, with emphasis on the importance of the supportmatrix. J Hazard Mater 252–253:272–292. doi:10.1016/j.jhazmat.2013.03.008
Evgenidou EN, Konstantinou IK, Lambropoulou DA (2015) Occurrenceand removal of transformation products of PPCPs and illicit drugs inwastewaters: a review. Sci Total Environ 505:905–926. doi:10.1016/j.scitotenv.2014.10.021
Farré MI, Pérez S, Kantiani L, Barceló D (2008) Fate and toxicity ofemerging pollutants, their metabolites and transformation productsin the aquatic environment. TrAC Trends Anal Chem 27:991–1007.doi:10.1016/j.trac.2008.09.010
Ferrer I, Zweigenbaum JA, Thurman EM (2010) Analysis of 70Environmental Protection Agency priority pharmaceuticals in waterby EPA Method 1694. J Chromatogr A 1217:5674–5686. doi:10.1016/j.chroma.2010.07.002
Guerra P, Kim M, Shah A, Alaee M, Smyth SA (2014) Occurrence andfate of antibiotic, analgesic/anti-inflammatory, and antifungal com-pounds in five wastewater treatment processes. Sci Total Environ473–474:235–243. doi:10.1016/j.scitotenv.2013.12.008
Gothwal R, Shashidhar T (2015) Antibiotic pollution in the environment:a review. Clean Soil Air Water 43:479–489. doi:10.1002/clen.201300989
Hijosa-Valsero M, Matamoros V, Sidrach-Cardona R, Martín-VillacortaJ, Bécares E, Bayona JM (2010) Comprehensive assessment of thedesign configuration of constructed wetlands for the removal ofpharmaceuticals and personal care products from urban wastewa-ters. Water Res 44:3669–3678. doi:10.1016/j.watres.2010.04.022
Environ Sci Pollut Res (2017) 24:14889–14902 14901
Open Access This article is distributed under the terms of theCreative Commons Attribution 4.0 International License (http://creativecommons.org/licenses/by/4.0/), which permits unrestricteduse, distribution, and reproduction in any medium, providedyougive appropriate credit to the original author(s) and the source,provide a link to the Creative Commons license and indicate ifchangeswere made.

Jiang L, Hu XL, Yin DQ, Zhang HC, Yu ZY (2011) Occurrence, distri-bution and seasonal variation of antibiotics in the Huangpu River,Shanghai, China. Chemosphere 82:822–828. doi:10.1016/j.chemosphere.2010.11.028
Li YF, Zhu GB, Ng WJ, Tan SK (2014) A review on removing pharma-ceutical contaminants from wastewater by constructed wetlands:design, performance and mechanism. Sci Total Environ 468–469:908–932. doi:10.1016/j.scitotenv.2013.09.018
Luo Y, Guo W, Ngo HH, Nghiem LD, Hai FI, Zhang J, Liang S, WangXC (2014) A review on the occurrence of micropollutants in theaquatic environment and their fate and removal during wastewatertreatment. Sci Total Environ 473–474:619–641. doi:10.1016/j.scitotenv.2013.12.065
Mailler R, Gasperi J, Coquet Y, Buleté A, Vulliet E, Deshayes S, Zedek S,Mirande-Bret C, Eudes V, Bressy A, Caupos E, Moilleron R,Chebbo G, Rocher V (2016) Removal of a wide range of emergingpollutants from wastewater treatment plant discharges by micro-grain activated carbon in fluidized bed as tertiary treatment at largepilot scale. Sci Total Environ 542:983–996. doi:10.1016/j.scitotenv.2015.10.153
McArdell CS,Molnar E, Suter MJF, Giger W (2003) Occurrence and fateof macrolide antibiotics in wastewater treatment plants and in theGlatt ValleyWatershed, Switzerland. Environ Sci Technol 37:5479–5486. doi:10.1021/es034368i
Matamoros V, García J, Bayona JM (2008) Organic micropollutant re-moval in a full-scale surface flow constructed wetland fed withsecondary effluent. Water Res 42:653–660. doi:10.1016/j.watres.2007.08.016
Michael I, Rizzo L, McArdell CS, Manaia CM, Merlin C, Schwartz T,Dagot C, Fatta-Kassinos D (2013) Urban wastewater treatmentplants as hotspots for the release of antibiotics in the environment:a review. Water Res 47:957–995. doi:10.1016/j.watres.2012.11.027
Qiao T, Yu Z, Zhang X, Au DW (2011) Occurrence and fate of pharma-ceuticals and personal care products in drinking water in southernChina. J Environ Monit 13:3097–3103. doi:10.1039/c1em10318k
Rand-Weaver M, Margiotta-Casaluci L, Patel A, Panter GH, Owen SF,Sumpter JP (2013) The read-across hypothesis and environmentalrisk assessment of pharmaceuticals. Environ Sci Technol 47:11384–11395. doi:10.1021/es402065a
Simazaki D, Kubota R, Suzuki T, Akiba M, Nishimura T, Kunikane S(2015) Occurrence of selected pharmaceuticals at drinking waterpurification plants in Japan and implications for human health.Water Res 76:187–200. doi:10.1016/j.watres.2015.02.059
Stackelberg PE, Gibs J, Furlong ET, Meyer MT, Zaugg SD, LippincottRL (2007) Efficiency of conventional drinking-water-treatment pro-cesses in removal of pharmaceuticals and other organic compounds.Sci Total Environ 377:255–272. doi:10.1016/j.scitotenv.2007.01.095
Sarmah AK, Meyer MT, Boxall AB (2006) A global perspective on theuse, sales, exposure pathways, occurrence, fate and effects of veter-inary antibiotics (VAs) in the environment. Chemosphere 65:725–759. doi:10.1016/j.chemosphere.2006.03.026
waters? A review. Sci Total Environ 470–471:1281–1306. doi:10.1016/j.scitotenv.2013.10.085
Vieno NM, Harkki H, Tuhkanen T, Kronberg L (2007) Occurrence ofpharmaceuticals in river water and their elimination in a pilotscale
drinking water treatment plant. Environ Sci Technol 41:5077–5084.doi:10.1021/es062720x
Vulliet E, Cren-Olivé C (2011) Screening of pharmaceuticals and hor-mones at the regional scale, in surface and groundwaters intended tohuman consumption. Environ Pollut 159:2929–2934. doi:10.1016/j.envpol.2011.04.033
Wang C, Lu GH,Wang PF, Wu H, Qi PD, Liang Y (2011) Assessment ofenvironmental pollution of Taihu Lake by combining active bio-monitoring and integrated biomarker response. Environ SciTechnol 45:3746–3752. doi:10.1021/es1037047
Wang Z, Zhang XH, Huang Y, Wang H (2015) Comprehensive evalua-tion of pharmaceuticals and personal care products (PPCPs) in typ-ical highly urbanized regions across China. Environ Pollut 204:223–232. doi:10.1016/j.envpol.2015.04.021
Watkinson AJ, Murby EJ, Kolpin DW, Costanzo SD (2009) The occur-rence of antibiotics in an urban watershed: fromwastewater to drink-ing water. Sci Total Environ 407:2711–2723. doi:10.1016/j.scitotenv.2008.11.059
Westerhoff P, Yoon Y, Snyder S, Wert E (2005) Fate of endocrinedisruptor, pharmaceutical, and personal care product chemicals dur-ing simulated drinking water treatment processes. Environ SciTechnol 39:6649–6663. doi:10.1021/es0484799
Wu C, Huang X, Witter JD, Spongberg AL, Wang K, Wang D, Liu J(2014) Occurrence of pharmaceuticals and personal care productsand associated environmental risks in the central and lower Yangtzeriver, China. Ecotoxicol Environ Saf 106:19–26. doi:10.1016/j.ecoenv.2014.04.029
Xie Z, Lu G, Liu J, Yan Z, Ma B, Zhang Z, Chen W (2015) Occurrence,bioaccumulation, and trophic magnification of pharmaceutically ac-tive compounds in Taihu Lake, China. Chemosphere 138:140–147.doi:10.1016/j.chemosphere.2015.05.086
Xu J, Zhang Y, Zhou C, Guo C, Wang D, Du P, Luo Y, Wan J, Meng W(2014) Distribution, sources and composition of antibiotics in sedi-ment, overlying water and pore water from Taihu Lake, China. SciTotal Environ 497-498:267–273. doi:10.1016/j.scitotenv.2014.07.114
Yan C, Yang Y, Zhou J, Nie M, Liu M, Hochella MF Jr (2015a) Selectedemerging organic contaminants in the Yangtze Estuary, China: acomprehensive treatment of their association with aquatic colloids.J Hazard Mater 283:14–23. doi:10.1016/j.jhazmat.2014.09.011
Yan Q, Zhang YX, Kang J, Gan XM, Xu YP, Guo JS, Gao X (2015b) Apreliminary study on the occurrence of pharmaceutically activecompounds in the river basins and their removal in two conventionaldrinking water treatment plants in Chongqing, China. Clean Soil AirWater 43:794–803. doi:10.1002/clen.201400039
Yu YX, Wang XX, Yang D, Lei BL, Zhang XL, Zhang XU (2014)Evaluation of human health risks posed by carcinogenic and non-carcinogenic multiple contaminants associated with consumption offish from Taihu Lake, China. Food Chem Toxicol 69:86–93. doi:10.1016/j.fct.2014.04.001
14902 Environ Sci Pollut Res (2017) 24:14889–14902
Hijosa-Valsero M, Reyes-Contreras C, Domínguez C, Bécares E, BayonaJM (2016) Behaviour of pharmaceuticals and personal care productsin constructed wetland compartments: influent, effluent, pore water,substrate and plant roots. Chemosphere 145:508–517. doi:10.1016/j.chemosphere.2015.11.090
Huerta-Fontela M, Galceran MT, Ventura F (2011) Occurrence and re-moval of pharmaceuticals and hormones through drinking watertreatment. Water Res 45:1432–1442. doi:10.1016/j.watres.2010.10.036
Tijani JO, Fatoba OO, Petrik LF (2013) A review of pharmaceuticals andendocrine-disrupting compounds: sources, effects, removal, and de-tections. Water Air Soil Pollut 224:1770–1798. doi:10.1007/s11270-013-1770-3
Verlicchi P, Zambello E (2014) How efficient are constructed wetlands inremoving pharmaceuticals from untreated and treated urban waste-
Zhang D, Gersberg RM, NgWJ, Tan SK (2014) Removal of pharmaceu-ticals and personal care products in aquatic plant-based systems: areview. Environ Pollut 184:620–639. doi:10.1016/j.envpol.2013.09.009
Zheng J,WangWD,Yin CQ (2012) Distribution and retention of PAHs ina constructed wetland in the Yangtze river delta, China. Fresenius
Environ Bull 21:2594–2602 wos: 000310112000010Zuccato E, Castiglioni S, Fanelli R, Reitano G, Bagnati R, Chiabrando C,
Pomati F, Rossetti C, Calamari D (2006) Pharmaceuticals in theenvironment in Italy: causes, occurrence, effects and control.Environ Sci Pollut Res 13:15–21. doi:10.1065/espr2006.01.004