
Occupational structure and structural change in...
24
Occupational structure and structural change in Indonesia, 1880-2000 By Daan Marks [email protected] International Institute of Social History (IISH) Amsterdam, the Netherlands [DRAFT; PLEASE DO NOT QUOTE OF CITE] Paper prepared for Hi-Stat Workshop on Historical Occupational Structures: Asian and European Perspectives 28 September 2007, Hitotsubashi University, Tokyo, Japan
Transcript of Occupational structure and structural change in...
Occupational structure and structural change in
Indonesia, 1880-2000
By Daan Marks
International Institute of Social History (IISH)
Amsterdam, the Netherlands
[DRAFT; PLEASE DO NOT QUOTE OF CITE]
Paper prepared for Hi-Stat Workshop on Historical Occupational Structures: Asian and
European Perspectives
28 September 2007, Hitotsubashi University, Tokyo, Japan
1
1. Introduction
Profound changes in the structure of labour markets are considered an important aspect of
economic development (Manning, 1998, p. 12). Kuznets (1957, 1966) even argued that an
indicator of economic development is the agricultural share in employment and output. He
found that as countries develop the share of the labour force working in the agricultural sector
decreases. At first this is due to an increasing share employed in the industrial sector. In a
later stage of development this standard economic theory predicts that the share of
employment in the service sector starts to rise. According to Kuznets these structural changes
characterize the transition to what he calls „modern economic growth‟ in which labour shifts
away from low productivity (agricultural) sectors to high productivity (industrial/service)
sectors.
The aim of this paper is to assess these changes for Indonesia by looking at
developments in the occupational structure for the period 1880-2000. Generally it is believed
that Indonesia only recently, more precisely since the 1970s onwards, made decisive steps to
what Kuznets would call a modern economy. Since then a sharp relative decline of the
agricultural labour force is found. The indigenous population in Indonesia is thought to have
remained by and large subsistence peasants under the colonial rule. Anthropological
researchers even characterized economic life in colonial Java in the nineteenth and twentieth
century as an „agricultural involution‟ in which the Javanese intensified subsistence
agriculture instead of looking for other sources of income to provide each household a living
(Geertz, 1963). Alexander and Alexander describe this rather persistent school of thought as
follows:
“For these writers, as for others who later drew on their work, the major reasons for
the lack of economic progress should be sought in the essential nature of the Javanese:
an amalgam of traditional society and archetypical personality. Javanese were
characterized as essentially subsistence minded wet-rice agriculturalists with limited
needs who placed a very high value on leisure and social obligations and preferred to
share resources rather than compete for them” (Alexander and Alexander, 1990, p.
33).
In this paper I will argue that if we take the available labour force statistics at face
value one indeed arrives at the conclusion that the process of modern economic growth only
2
started in the second half of the twentieth century. Looking at productivity figures one could
even question whether Indonesia is already a modern economy. However, scrutinizing the
data and especially accounting for the problem of by-employment leads to a more nuanced
view: Whereas agriculture remained the most important sector, already in the second half of
the nineteenth century increasing economic diversification appears to have been a result of a
process of pre-modern economic growth (Fernando, 1996, p. 109).
The remainder of the paper is organized as follows. The next section will briefly
discuss the available data sources for labour statistics in Indonesia. Section 3 analyzes these
data for the twentieth century. In section 4 we will treat the issue of labour productivity and
see what that can tell us about the process of modern economic growth. In section 5 it is
shown how the picture is changed when taking by-occupation into account.
2. Data sources
Already for the early nineteenth century occupational statistics were collected on Java. For
tax collecting purposes local officials kept records of non-agricultural workers, but
unfortunately those records have not survived (Fernando, 1992, p. 3). Into the early 1870s the
colonial administration began to systematically collect statistics on the number of Javanese
engaged in non-agricultural occupations. These statistics were published into the early 1900s
in the Koloniaal Verslag (KV, Colonial Report). Unfortunately these statistics, while still
being collected where no longer published afterwards.
Beginning in 1880 a population survey was carried out every five years. In that first
year, this was only done in the areas under government control in Java and Madura and in the
Residency of Sumatra‟s Westcoast. But by 1900 surveys were carried out wherever possible,
although the reliability remained in doubt. Initially data concerned male adults only.
The most important source which contains detailed information on occupational
structures for our ends is the enumeration of 1905. While this enumeration is considered of
poor quality in absolute terms, it gives a rather accurate picture of the relative distribution of
the labour force. Moreover it is the first time data on both men and women were collected,
and secondary jobs were considered.
The inaccuracy resulting from the time it took to complete the surveys and the local
differences in the commencement and completion times increasingly came to be regarded as
a drawback. Therefore plans were made to hold a real census, at least in the government

3
territories on Java. This census was planned to be carried out on one day, which was set at 1
June 1910. However, due to its high costs and the lack of manpower, this count was
postponed, first to 1915 and then to 1920. When the enumeration of 1920 was finally carried
out, it was held both in Java and in the Outer Islands, but instead on one day, it was spread
over one month.
In comparison with the last population survey, the population census of 1920
produced less information, while the reliability of the results was not much better. For
example, data concerning occupations and numbers of head of livestock were completely
lacking. Because of all this Boomgaard and Gooszen conclude that “in view of all the
inadequacies, which were clearly recognized at the time, the population census of 1920 can
best be considered as a rehearsal for the 1930 census” (Boomgaard en Gooszen, 1991, p. 28).
The quantity of data collected during the 1930 census was considerably greater than in
1920. Not only had it been possible to carry out true counts in greater parts of the Outer
Islands, but also more questions had been asked. Apart from name, sex, civil status, physical
defects, quality of residence and literacy, there were, among others, detailed questions
concerning education, occupation (including secondary occupations) and positions held.
Considering the careful preparation and organization, it seems reasonable to assume
that the 1930 census produced quite reliable results. Encouraged by these results officials
started preparations in the second half of the thirties for a census to be held in 1940.
Unfortunately this census was abandoned because of World War II.
World War II and the subsequent struggle for independence seriously halted back
progress in data collection. It was only in 1958 that new data become available on the
occupational structure, although this survey was limited to Java and Madura. Starting in 1961
data become more abundant and reliable with the population census held in that year. In 1971
a further population census was held and subsequently in 1980, 1990 and 2000. Furthermore
intercensal surveys were conducted in 1976, 1985 and 1995. Moreover, since 1976/7
National Labour Force Surveys (Sakernas) are conducted annually with the exception of the
years 1981, 1983 and 1984. This survey provides a rich data set on the labour force situation
in Indonesia, including data on employment, unemployment, wages, age structure of the
labour force and education.

4
3. Labour force statistics, 1905-2000: Structural change?
As can be seen in figure 1 only a modest number of people was employed in either the
industrial or the service sector at the start of the 20th
century. Not surprisingly, the majority of
the labour force was occupied in agriculture. However, one has to be careful when analyzing
these 1905 data. The share of the category „others‟ in 1905 was namely substantial with 17.1
per cent. This share is most likely not evenly distributed over the primary, secondary and
tertiary sector, and probably biased towards the tertiary sector. These problems can distort the
picture.
Figure 1: Occupational structure, 1905-2000
0%
10%
20%
30%
40%
50%
60%
70%
80%
90%
100%
1905 1930 1961 1971 1980 1990 2000
Services Industry Agriculture
Sources: 1905: Koloniaal Verslag 1907, appendix A; 1930: Volkstelling 1930; 1960, 1971, 1980, 1990 and
2000: Sensus Penduduk
Note: The category „Others‟ mainly consists of „activities not adequately defined‟.
The 1930 census is considered to be of quite a high standard. However, the category
„activities not adequately defined‟ is still large with 9.6 per cent. Nevertheless the 1930
employment figures give a fairly accurate picture of the occupational structure. Therefore it is
promising that this census seems to support the findings for 1905: During the colonial period
agriculture is by far the most important sector with more than 2/3 of the labour force
employed in this sector. During the first decades of the 20th
century there seems to be a

5
moderate shift to the manufacturing sector. The number of people employed in the service
sector does not change much, neither does the composition of the occupational structure
within the service sector.
Unfortunately data on employment are unavailable for the period between 1930 and
1961. The „excellently‟ prepared census that was planned for 1940 was abandoned when
World War II broke out (Van de Graaff 1955, p. 147). This war and the subsequent struggle
for independence seriously halted back data collection. It was not until 1961 that a new
population census was held.
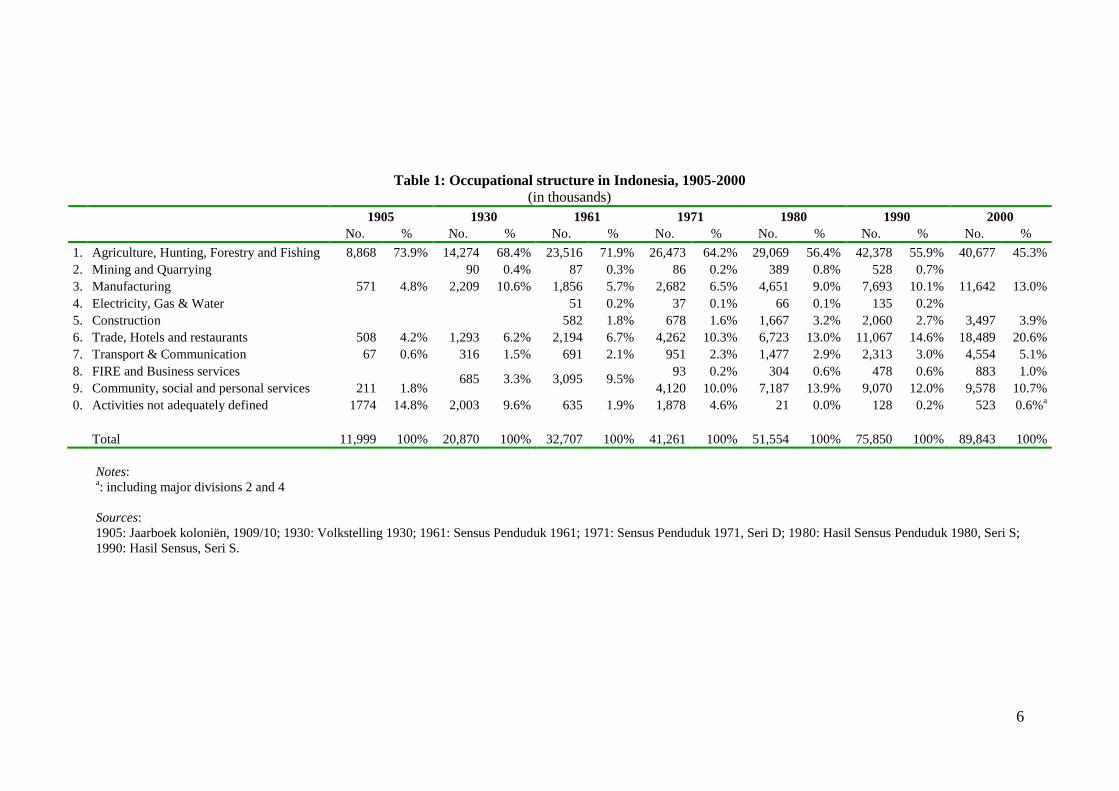
The results of this census reveal some interesting points. Not surprisingly employment
in agriculture was still dominant. What is striking though is that also in relative terms
employment in this sector was even larger than in 1930. At the same time the share of
employment in industry decreased from 11.0 per cent to 7.9 per cent. In 1961 the service
sector absorbed 18.3 per cent of the total labour force. Probably this growth of service sector
employment is partly a statistical reality, since the category „activities not adequately
defined‟ dropped from to 9.6 per cent in 1930 to 1.9 per cent in 1961. However, partly, this
increase is real, mainly because of a rapidly growing bureaucracy. This was a consequence of
Sukarno‟s policy of „Socialism a la Indonesia‟ which resulted in increasing intervention by
the central government. Because of this pattern in which the share of the labour-intensive or
traditional sectors in total output increased while that of the modern, capital-intensive sectors
declined, Booth calls this a period of retrogression (1998, p. 70-72).
From 1961 onwards we see some signs of what Kuznets would call modern economic
growth. The share of agricultural employment decreases to 45.3 per cent in 2000. Striking is
that between 1980 and 1990, a period that was characterized by relatively slow economic
growth and a re-orientation of the economy, this share remained almost constant.
Another remarkable feature is that the share of industry in total employment only
slowly increases from 7.9 per cent in 1961 to 10.8 per cent in 1990 and 13.0 per cent in 2000.
This contradicts the commonly held view that during the process of modern economic growth
there is a shift in employment first from agriculture to industry and in a later phase to
services.
6
Table 1: Occupational structure in Indonesia, 1905-2000
(in thousands)
1905 1930 1961 1971 1980 1990 2000
No. % No. % No. % No. % No. % No. % No. %
1. Agriculture, Hunting, Forestry and Fishing 8,868 73.9% 14,274 68.4% 23,516 71.9% 26,473 64.2% 29,069 56.4% 42,378 55.9% 40,677 45.3%
2. Mining and Quarrying
90 0.4% 87 0.3% 86 0.2% 389 0.8% 528 0.7%
3. Manufacturing 571 4.8% 2,209 10.6% 1,856 5.7% 2,682 6.5% 4,651 9.0% 7,693 10.1% 11,642 13.0%
4. Electricity, Gas & Water
51 0.2% 37 0.1% 66 0.1% 135 0.2%
5. Construction
582 1.8% 678 1.6% 1,667 3.2% 2,060 2.7% 3,497 3.9%
6. Trade, Hotels and restaurants 508 4.2% 1,293 6.2% 2,194 6.7% 4,262 10.3% 6,723 13.0% 11,067 14.6% 18,489 20.6%
7. Transport & Communication 67 0.6% 316 1.5% 691 2.1% 951 2.3% 1,477 2.9% 2,313 3.0% 4,554 5.1%
8. FIRE and Business services
211
1.8% 685 3.3% 3,095 9.5%
93 0.2% 304 0.6% 478 0.6% 883 1.0%
9. Community, social and personal services 4,120 10.0% 7,187 13.9% 9,070 12.0% 9,578 10.7%
0. Activities not adequately defined 1774 14.8% 2,003 9.6% 635 1.9% 1,878 4.6% 21 0.0% 128 0.2% 523 0.6%a
Total 11,999 100% 20,870 100% 32,707 100% 41,261 100% 51,554 100% 75,850 100% 89,843 100%
Notes: a: including major divisions 2 and 4
Sources:
1905: Jaarboek koloniën, 1909/10; 1930: Volkstelling 1930; 1961: Sensus Penduduk 1961; 1971: Sensus Penduduk 1971, Seri D; 1980: Hasil Sensus Penduduk 1980, Seri S;
1990: Hasil Sensus, Seri S.

7
The case of Indonesia reveals two important findings. Firstly, already in an early
phase of development service sector employment is significant and higher than industrial
employment. Secondly, growth of service sector employment is not preceded by a growth in
industrial employment, but rather coincides or is even followed by it.
This argument can further be strengthened if we look at the annual growth in
employment. Looking at the growth rates of the different sectors in table 2, we see that during
the 20th
century service sector employment growth is constantly high. Especially until 1971
this growth is higher than in industry. When industrialization takes off from the mid-1970s
onwards growth in industrial employment becomes slightly higher than that in service sector
employment.
Table 2: Annual growth in employment
Agriculture Industry Services Labour Force
1930-1961 1.6% -0.5% 3.1% 1.5%
1961-1971 1.2% 3.6% 4.7% 2.4%
1971-1980 1.0% 6.9% 5.8% 2.5%
1980-1990 3.8% 5.0% 3.9% 3.9%
1990-2000 -0.4% 3.5% 3.9% 1.7%
Source: own calculations from table 1
Horlings (1995) found that the Netherlands did not follow the „sectoral model‟ either.
He argued that „instead of transfers of labour from agriculture into industry and then into
services, the structure of the Dutch economy became more advanced without significant
growth of industry‟ (Horlings 1995, p. 107). This scenario seems to hold for its former colony
as well. In the case of the Netherlands Smits attributes this development path to important
linkages between agriculture and the service sector, especially distributive services (Smits
1990, p. 90). More research is necessary to explain this „unusual‟ development that emerges
from an analysis of the occupational structure in Indonesia. This is partly done in the next
section where we will look at developments in labour productivity.
8
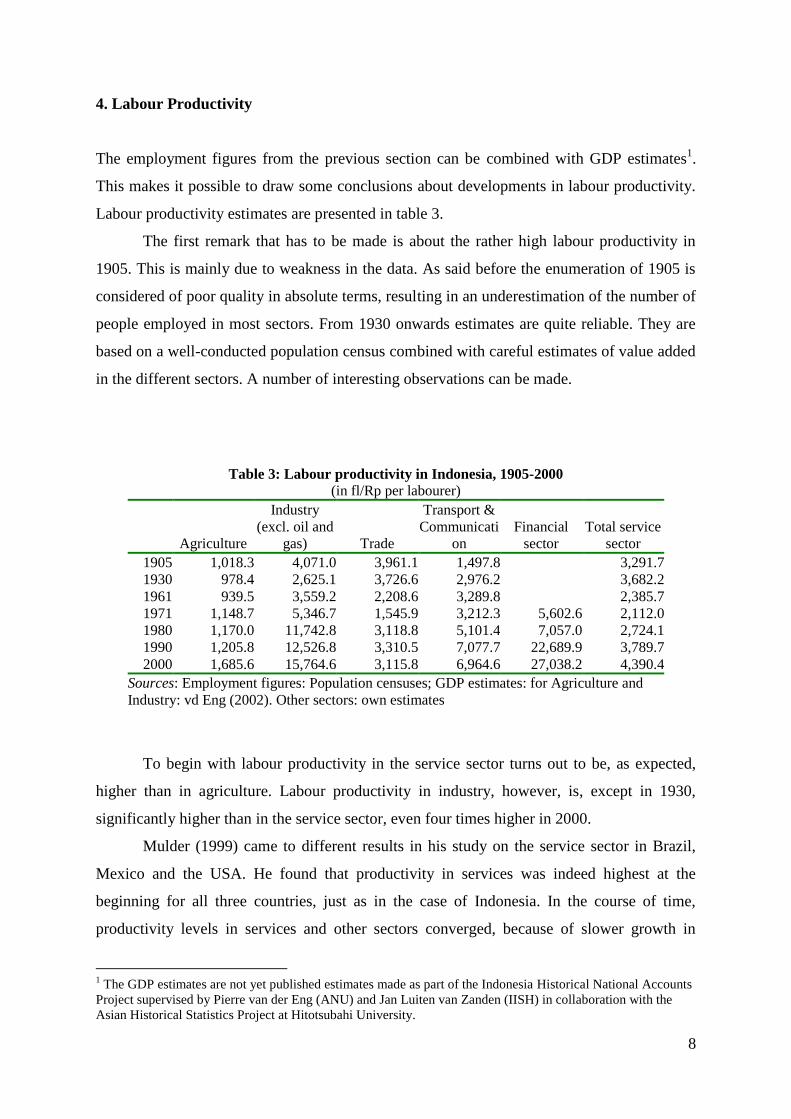
4. Labour Productivity
The employment figures from the previous section can be combined with GDP estimates1.
This makes it possible to draw some conclusions about developments in labour productivity.
Labour productivity estimates are presented in table 3.
The first remark that has to be made is about the rather high labour productivity in
1905. This is mainly due to weakness in the data. As said before the enumeration of 1905 is
considered of poor quality in absolute terms, resulting in an underestimation of the number of
people employed in most sectors. From 1930 onwards estimates are quite reliable. They are
based on a well-conducted population census combined with careful estimates of value added
in the different sectors. A number of interesting observations can be made.
Table 3: Labour productivity in Indonesia, 1905-2000
(in fl/Rp per labourer)
Agriculture
Industry
(excl. oil and
gas) Trade
Transport &
Communicati
on
Financial
sector
Total service
sector
1905 1,018.3 4,071.0 3,961.1 1,497.8 3,291.7
1930 978.4 2,625.1 3,726.6 2,976.2 3,682.2
1961 939.5 3,559.2 2,208.6 3,289.8 2,385.7
1971 1,148.7 5,346.7 1,545.9 3,212.3 5,602.6 2,112.0
1980 1,170.0 11,742.8 3,118.8 5,101.4 7,057.0 2,724.1
1990 1,205.8 12,526.8 3,310.5 7,077.7 22,689.9 3,789.7
2000 1,685.6 15,764.6 3,115.8 6,964.6 27,038.2 4,390.4
Sources: Employment figures: Population censuses; GDP estimates: for Agriculture and
Industry: vd Eng (2002). Other sectors: own estimates
To begin with labour productivity in the service sector turns out to be, as expected,
higher than in agriculture. Labour productivity in industry, however, is, except in 1930,
significantly higher than in the service sector, even four times higher in 2000.
Mulder (1999) came to different results in his study on the service sector in Brazil,
Mexico and the USA. He found that productivity in services was indeed highest at the
beginning for all three countries, just as in the case of Indonesia. In the course of time,
productivity levels in services and other sectors converged, because of slower growth in
1 The GDP estimates are not yet published estimates made as part of the Indonesia Historical National Accounts
Project supervised by Pierre van der Eng (ANU) and Jan Luiten van Zanden (IISH) in collaboration with the
Asian Historical Statistics Project at Hitotsubahi University.
9
productivity in services.2 In Indonesia such a convergence in productivity can not yet be
found. Labour productivity in manufacturing in Indonesia is still much larger than in the
other sectors. This suggests that the shift from labour to services that is taking place now,
raises the overall performance less than a shift to manufacturing.
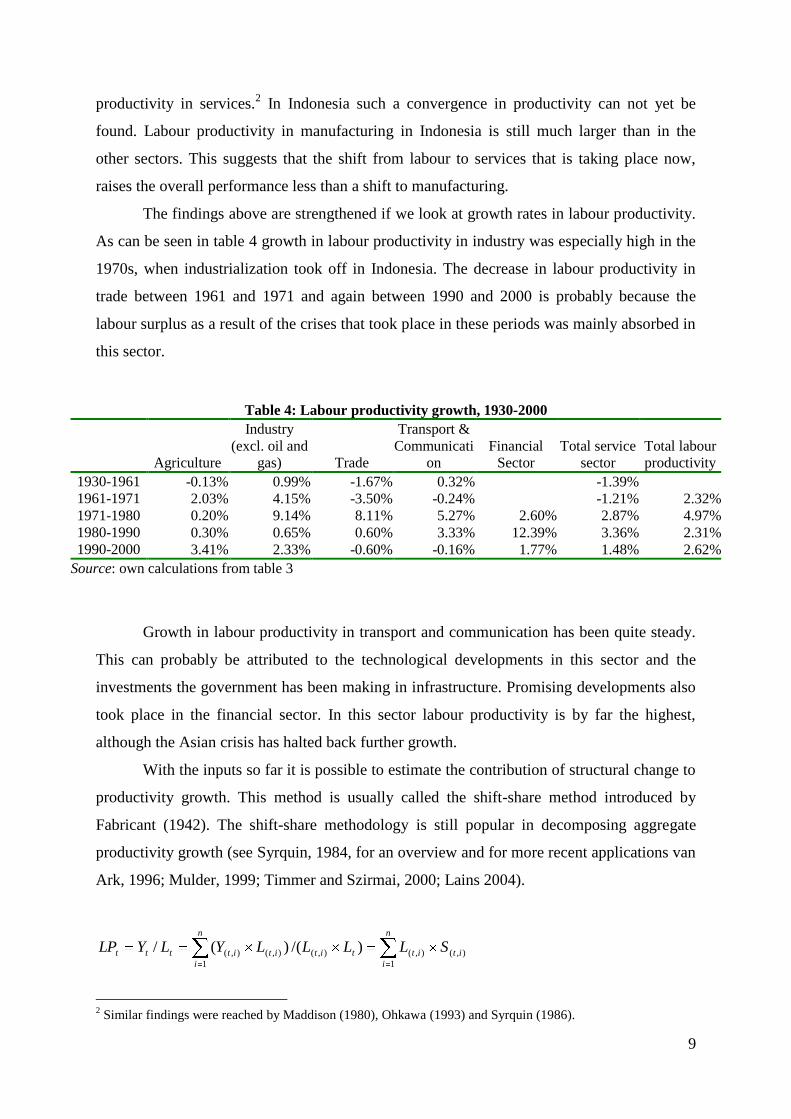
The findings above are strengthened if we look at growth rates in labour productivity.
As can be seen in table 4 growth in labour productivity in industry was especially high in the
1970s, when industrialization took off in Indonesia. The decrease in labour productivity in
trade between 1961 and 1971 and again between 1990 and 2000 is probably because the
labour surplus as a result of the crises that took place in these periods was mainly absorbed in
this sector.
Table 4: Labour productivity growth, 1930-2000
Agriculture
Industry
(excl. oil and
gas) Trade
Transport &
Communicati
on
Financial
Sector
Total service
sector
Total labour
productivity
1930-1961 -0.13% 0.99% -1.67% 0.32% -1.39%
1961-1971 2.03% 4.15% -3.50% -0.24% -1.21% 2.32%
1971-1980 0.20% 9.14% 8.11% 5.27% 2.60% 2.87% 4.97%
1980-1990 0.30% 0.65% 0.60% 3.33% 12.39% 3.36% 2.31%
1990-2000 3.41% 2.33% -0.60% -0.16% 1.77% 1.48% 2.62%
Source: own calculations from table 3
Growth in labour productivity in transport and communication has been quite steady.
This can probably be attributed to the technological developments in this sector and the
investments the government has been making in infrastructure. Promising developments also
took place in the financial sector. In this sector labour productivity is by far the highest,
although the Asian crisis has halted back further growth.
With the inputs so far it is possible to estimate the contribution of structural change to
productivity growth. This method is usually called the shift-share method introduced by
Fabricant (1942). The shift-share methodology is still popular in decomposing aggregate
productivity growth (see Syrquin, 1984, for an overview and for more recent applications van
Ark, 1996; Mulder, 1999; Timmer and Szirmai, 2000; Lains 2004).
n
i
itit
n
i
titititttt SLLLLYLYLP1
),(),(
1
),(),(),( )/()(/
2 Similar findings were reached by Maddison (1980), Ohkawa (1993) and Syrquin (1986).

10
where LP denotes labour productivity, Y output, L the labour force, and S the share of labour
in each sector.
The difference in aggregate labour productivity levels at time 0 and t can be written as:
)()()()( ),(),(),(
1
),(),(),(
1
),(),(),(),(0 ioitio
n
i
itioio
n
i
itioioitt LPLPSSLPSSSLPLPLPLP
The first term on the right hand side represents the intrasectoral productivity growth,
and corresponds to that part of the productivity change which is caused by productivity
growth within the sectors. The second term is referred to as the static shift effect, and
represents the effect of the change in sectoral employment shares on overall growth. This
effect is positive when labour moves to branches with relatively high productivity levels. The
third effect measures the dynamic shift effect, and is positive when labour shifts to sectors
which improve their productivity performance. The sum of the second and third term is
referred to as the total structural change effect.
Table 5: Decomposition of labour productivity growth, 1930-2000
1930-1961 1961-1971 1971-1980 1980-1990 1990-2000
Labour productivity
growth per year -0.03% 1.53% 4.94% 2.57% 2.97%
Intrasectoral
growth 52.4% 67.0% 84.0% 56.4%
Structural change Static 62.0% 21.8% 12.8% 38.4%
Dynamic -14.4% 11.2% 3.1% 5.1%
Total 100.0% 100.0% 100.0% 100.0%
Source: own calculations
The results of this exercise are given in table 5. In Indonesia productivity growth is
increasingly explained by productivity growth within sectors. Structural change accounted for
almost 50 per cent of the growth between 1961 and 1971, but only 15 per cent of the growth
between 1980 and 1990. The static effect was especially large in the 1960s and the 1990s
indicating that in these periods labour shifted to more productive sectors. The dynamic effect
has been relatively small.
11
5. Distorting the picture? The issue of by-employment
“Although it has not been completely neglected, an entire socio-economic stratum of
rural (...) society is not easily accounted for in any of the taxonomic formulations
presently available (...). Characteristic of this population segment is occupational
multiplicity or plurality wherein the modal adult is systematically engaged in a
number of gainful activities, which for him form an integrated economic complex.”
(Comitas, 1973, p. 157)3
If we take the figures in the preceding paragraphs at face value, we would conclude
that a shift in employment from agriculture to industries and services only took place in the
second half of the twentieth century, especially since the late 1970s. Moreover, the decisive
step to a truly modern economy still has to be made since the number of workers employed in
high productivity sectors is still limited. However, and maybe quite surprisingly, one could
say that already in the second half of the nineteenth century a first wave of development
towards a modern economy took place in Indonesia. This argument can be made when we
critically assess the statistical data and take into account some descriptive evidence and
anthropological studies. That is, as we will see below, tackling the problem of by-
employment significantly alters the picture.
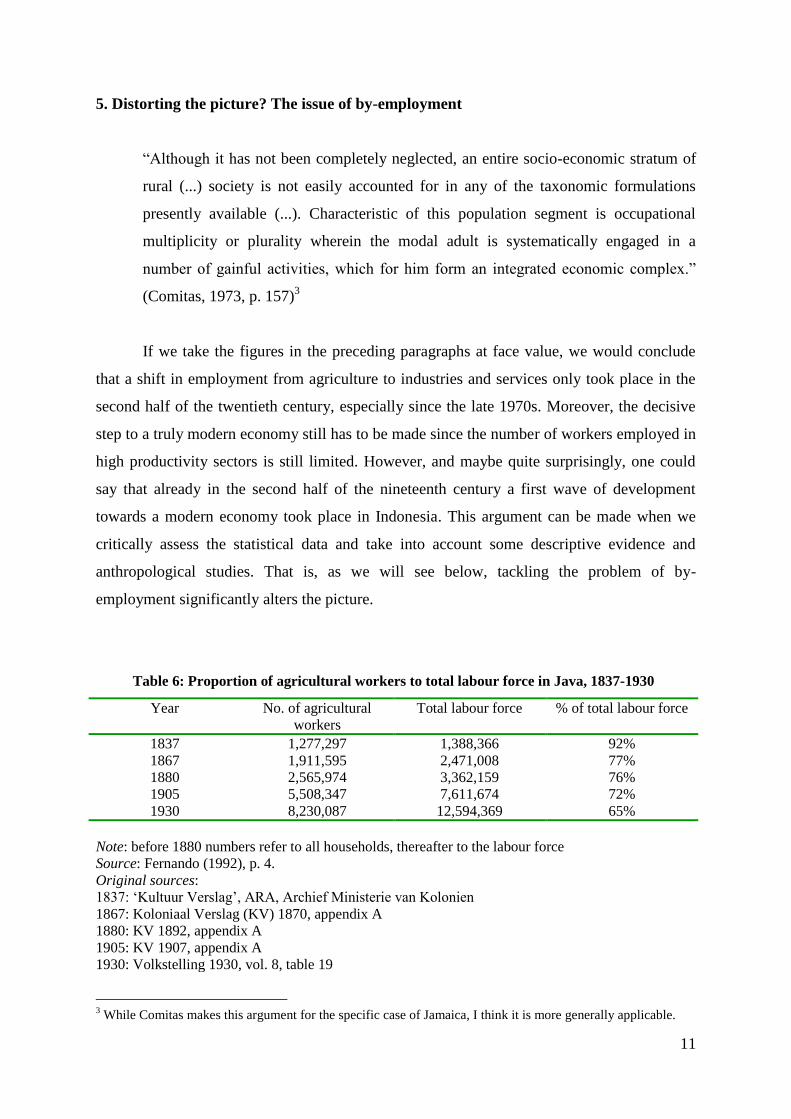
Table 6: Proportion of agricultural workers to total labour force in Java, 1837-1930
Year No. of agricultural
workers
Total labour force % of total labour force
1837 1,277,297 1,388,366 92%
1867 1,911,595 2,471,008 77%
1880 2,565,974 3,362,159 76%
1905 5,508,347 7,611,674 72%
1930 8,230,087 12,594,369 65%
Note: before 1880 numbers refer to all households, thereafter to the labour force
Source: Fernando (1992), p. 4.
Original sources:
1837: „Kultuur Verslag‟, ARA, Archief Ministerie van Kolonien
1867: Koloniaal Verslag (KV) 1870, appendix A
1880: KV 1892, appendix A
1905: KV 1907, appendix A
1930: Volkstelling 1930, vol. 8, table 19
3 While Comitas makes this argument for the specific case of Jamaica, I think it is more generally applicable.
12
In table 6 labour force statistics in Java for the colonial period only are summarized. It
must be noted that strictly speaking the figures before 1867 and after 1867 cannot be
compared, since before 1870 agricultural workers were counted as households whereas
thereafter individual workers were registered. Nevertheless, table 6 clearly shows that the
number of agricultural workers increased steadily from the 1830s onwards.
The increase in the number of agricultural workers would seem to confirm that for the
native people agriculture was still by far the most important occupation. At the same time,
however, the number of agricultural workers as percentage of the total labour force was
declining, implying that more and more people were looking for means of livelihood outside
agriculture. In this respect Fernando argues:
“This moving out of agriculture became widespread in the first three decades of this
century [i.e. 20th
century] as shown by the slow pace of absorbing people into the
agricultural sector at a time when other sectors of the economy were developing
rapidly with more employment opportunities on a large scale” (Fernando, 1992, p. 4).
The statistics clearly suggest a significant transformation from a subsistence peasant
economy to a more diverse economy in which a growing number of people earned their
living from a range of activities outside agriculture. It is probable that these developments
were even more significant than table 6 would suggest since quite a significant part of the
population had more than one job, a phenomenon that is not well captured in these early
statistics.
There is thus quite some anecdotal evidence of this phenomenon. This, however, is
insufficient to draw any conclusions to the level of such economic activity. The enumeration
of 1905, however, provides some „hard‟ evidence. Fernando (1989) put together table 7
below.
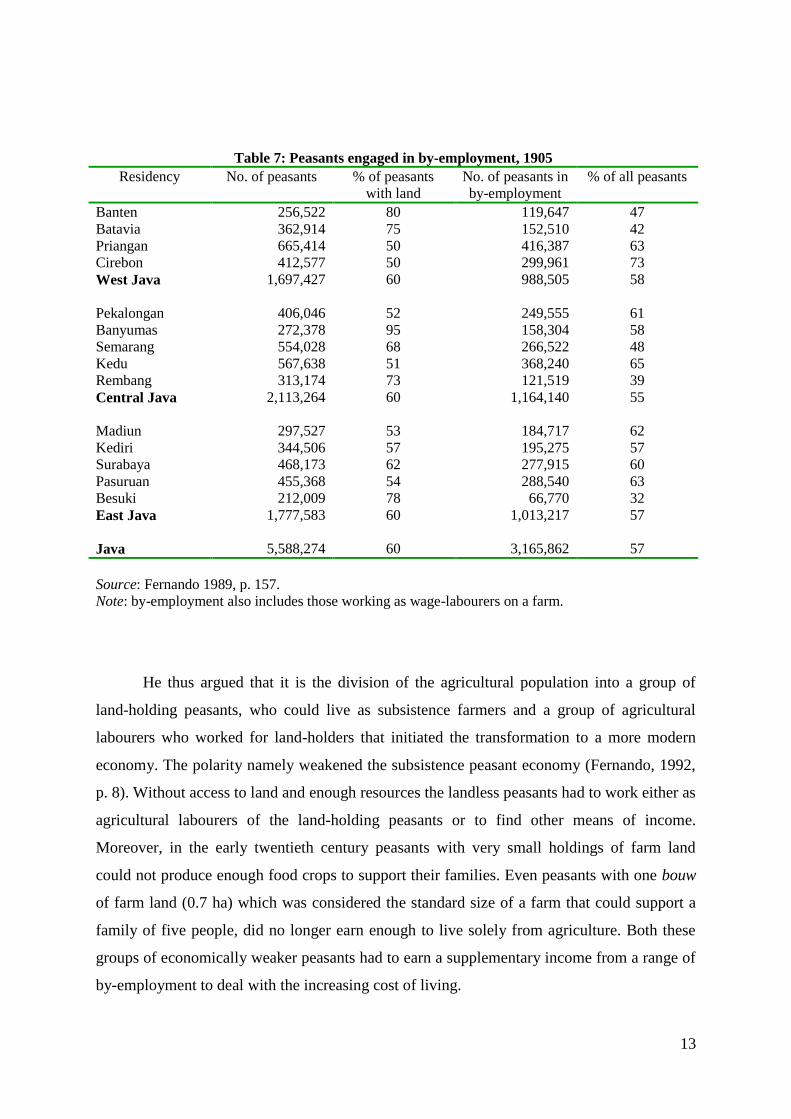
This table shows that by-employment was not evenly distributed around Java. The
number of peasants having a secondary job was relatively low in areas where a majority of
peasants had access to farm land and subsistence agriculture still provided for nearly all their
needs, such as in Banten, Semarang, Rembang and Besuki. In regions where land ownership
was more limited agricultural labourers had to find other means of income to meet ends.
13
Table 7: Peasants engaged in by-employment, 1905
Residency No. of peasants % of peasants
with land
No. of peasants in
by-employment
% of all peasants
Banten 256,522 80 119,647 47
Batavia 362,914 75 152,510 42
Priangan 665,414 50 416,387 63
Cirebon 412,577 50 299,961 73
West Java 1,697,427 60 988,505 58
Pekalongan 406,046 52 249,555 61
Banyumas 272,378 95 158,304 58
Semarang 554,028 68 266,522 48
Kedu 567,638 51 368,240 65
Rembang 313,174 73 121,519 39
Central Java 2,113,264 60 1,164,140 55
Madiun 297,527 53 184,717 62
Kediri 344,506 57 195,275 57
Surabaya 468,173 62 277,915 60
Pasuruan 455,368 54 288,540 63
Besuki 212,009 78 66,770 32
East Java 1,777,583 60 1,013,217 57
Java 5,588,274 60 3,165,862 57
Source: Fernando 1989, p. 157.
Note: by-employment also includes those working as wage-labourers on a farm.
He thus argued that it is the division of the agricultural population into a group of
land-holding peasants, who could live as subsistence farmers and a group of agricultural
labourers who worked for land-holders that initiated the transformation to a more modern
economy. The polarity namely weakened the subsistence peasant economy (Fernando, 1992,
p. 8). Without access to land and enough resources the landless peasants had to work either as
agricultural labourers of the land-holding peasants or to find other means of income.
Moreover, in the early twentieth century peasants with very small holdings of farm land
could not produce enough food crops to support their families. Even peasants with one bouw
of farm land (0.7 ha) which was considered the standard size of a farm that could support a
family of five people, did no longer earn enough to live solely from agriculture. Both these
groups of economically weaker peasants had to earn a supplementary income from a range of
by-employment to deal with the increasing cost of living.

14
The findings of Fernando are in some respect misleading however. In his table he also
includes peasants working as agricultural labourers as being engaged in by-employment. He
does not make explicit why he chose this procedure. A possible explanation can be that the
transition from a peasant society towards one in which wage working becomes more
important.
Table 8: 1905 enumeration
Java &
Madoera
Outer
Islands
Total
Agricultural workers
Landowners 3,787,564 1,744,040
5,531,604
Landless
Renting land 341,110 152,007
493,117
Wage labourers 2,599,557 252,934
2,852,491
Total 6,728,231 2,148,981
8,877,212
Non-agricultural workers
Central Government 31,172 10,485
41,657
Local Government A 322,640 46,219
368,859
B 26,910 10,074
36,984
Religious services A 8,272 10,325
18,597
B 8,009 5,654
13,663
Teachers A 10,166 4,415
14,581
B 5,993 2,379
8,372
Trade A 187,070 24,317
211,387
B 455,202 52,967
508,169
Transport workers A 63,144 14,853
77,997
B 54,044 12,661
66,705
Industry A 145,609 46,489
192,098
B 384,891 72,190
457,081
Proto-industry 62,866 49,835
112,701
Domestic servants
100,181 10,057
110,238
Others A 483,698 63,431
547,129
B 1,625,204 149,013
1,774,217
Total work force 9,482,712 2,524,296
12,007,008
Note:
A: already included as agricultural worker (thus having a secondary job);
B: not yet included
Source: Koloniaal Verslag 1907, appendix A
Table 8 presents the raw data from the 1905 enumeration. If we take all categories
classified with an A (indicating already being included under agricultural labourers) and not
15
including the category agricultural wage labourers it turns out that 18.2 per cent of all
peasants on Java and Madura has a secondary job. For the Outer Islands this figure is 9.8 per
cent, while for the Netherlands-Indies as a whole it is 16.1 per cent. This is equal to 12.9 per
cent, 8.3 per cent and 11.9 per cent of the labour force for Java and Madura, the Outer Islands
and the Netherlands-Indies respectively. So while by-employment is definitely not negligible,
it is much less common than suggested by the figures from Fernando.
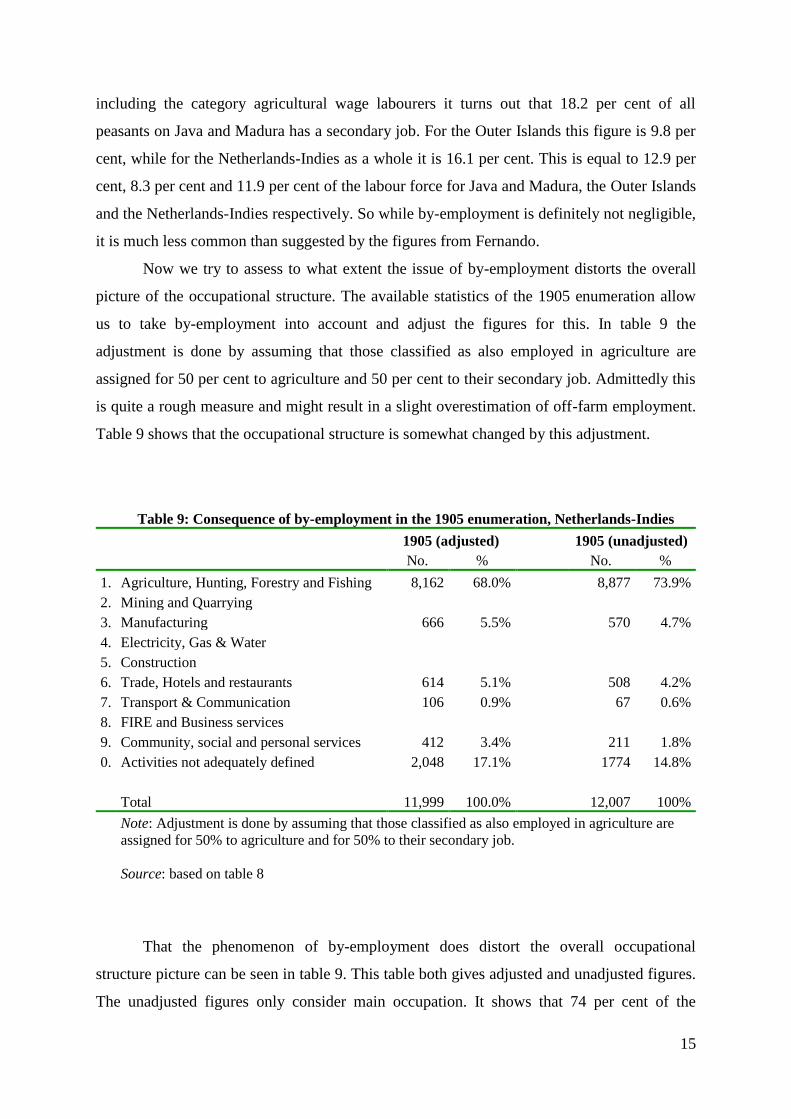
Now we try to assess to what extent the issue of by-employment distorts the overall
picture of the occupational structure. The available statistics of the 1905 enumeration allow
us to take by-employment into account and adjust the figures for this. In table 9 the
adjustment is done by assuming that those classified as also employed in agriculture are
assigned for 50 per cent to agriculture and 50 per cent to their secondary job. Admittedly this
is quite a rough measure and might result in a slight overestimation of off-farm employment.
Table 9 shows that the occupational structure is somewhat changed by this adjustment.
Table 9: Consequence of by-employment in the 1905 enumeration, Netherlands-Indies
1905 (adjusted)
1905 (unadjusted)
No. %
No. %
1. Agriculture, Hunting, Forestry and Fishing 8,162 68.0%
8,877 73.9%
2. Mining and Quarrying
3. Manufacturing 666 5.5%
570 4.7%
4. Electricity, Gas & Water
5. Construction
6. Trade, Hotels and restaurants 614 5.1%
508 4.2%
7. Transport & Communication 106 0.9%
67 0.6%
8. FIRE and Business services
9. Community, social and personal services 412 3.4%
211 1.8%
0. Activities not adequately defined 2,048 17.1%
1774 14.8%
Total 11,999 100.0%
12,007 100%
Note: Adjustment is done by assuming that those classified as also employed in agriculture are
assigned for 50% to agriculture and for 50% to their secondary job.
Source: based on table 8
That the phenomenon of by-employment does distort the overall occupational
structure picture can be seen in table 9. This table both gives adjusted and unadjusted figures.
The unadjusted figures only consider main occupation. It shows that 74 per cent of the
16
population in the Netherlands-Indies in 1905 had its main occupation in agriculture.
However, if we correct for the fact that quite a significant number of agricultural workers also
worked part of their time in non-agricultural sectors this percentage declines to 68 per cent.
Striking is the large number of workers having activities classified as „not adequately
defined‟. It is believed that this is caused by the fact that officials who compiled the
workforce data encountered considerable problems in classifying certain activities in the
other categories, so they lumped these together as „other‟. Fernando suggests that part of
these „others‟ were probably wage labourers employed by craftsmen and manufacturers
(Fernando, 1992, p. 12). I would argue that also a significant part of these workers should be
classified as service workers. I think that problems with classifying agricultural work were
less frequent than with classifying non-agricultural work.
Peasant by-employment can be categorized into rural manufacturing industries, petty
trade, transport and services. It is believed that the officials who compiled the workforce data
encountered considerable difficulties in ascertaining the actual number of peasants engaged
in the first three categories so that they lumped together a large number of people employed
by manufacturers, traders and transporters as being engaged in services (Fernando, 1989, p.
158).
Table 10 shows that manufacturing, mainly small scale, attracted around 100,000
people who were classified as peasants as seasonal or part-time workers. Petty trading was
slightly more important as secondary employment. Almost 165,000 traders or 31 per cent of
all traders still had their roots in agriculture. Rural manufacturing and petty trading
undertaken as by-employment were usually conducted on a small scale, centred around the
peasant household. These activities required only a very small capital input, but consequently
generated only a small cash income. Often this was just enough to meet the needs of families,
but hardly enough to improve their social standing (Fernando, 1989, p. 155).
Also the transport sector was a substantial source of by-employment, but because
draught animals, carts and boats required a fairly big capital outlay this was usually beyond
the capacity of many peasants.

17
Table 10: Peasants engaged in by-employment in 1905, by category of employment
Residency
No. of
peasants
manu
facturers
% of all
manu
facturers
No. of
peasant
transporters
% of all
transporters
No. of
peasant
traders
% of all
traders
No. of
peasants in
services
% of all in
services
No. of
peasants in
unspecific
work
% of all in
unspecific
work
Banten 3,981 86 4,034 88 11,676 81 37,269 95 1,690 14
Batavia 6,416 20 1,739 40 8,592 25 9,327 37 23,380 51
Priangan 9,373 31 1,713 59 25,591 48 23,086 22 3,816 14
Cirebon 3,176 48 1,598 61 14,199 47 52,993 66 3,614 16
West Java 22,946 31 9,084 63 60,058 45 122,675 49 32,500 30
Pekalongan 11,881 30 3,643 71 12,210 21 8,465 10 3,696 17
Banyumas 5,981 22 197 61 10,158 36 1,901 1 2,113 3
Semarang 6,968 27 3,873 56 14,013 19 16,446 51 8,654 25
Kedu 18,318 24 2,070 77 20,979 35 6,679 8 6,446 8
Rembang 4,010 15 2,292 82 7,957 31 1,960 17 5,515 15
Central
Java 47,158 24 12,075 60 65,317 27 35,451 9 26,424 10
Madiun 10,840 83 3,627 86 12,348 49 955 52 5,035 84
Kediri 6,560 28 6,848 73 5,886 20 1,925 4 8,809 16
Surabaya 6,581 14 10,057 66 8,647 16 5,044 7 34,852 27
Pasuruan 4,604 27 13,455 59 9,462 20 18,557 19 17,566 17
Besuki 1,693 41 8,545 82 2,552 37 702 5 1,020 13
East Java 30,278 29 42,532 67 38,895 24 27,183 11 67,282 22
Java 100,382 27 63,691 63 164,270 31 185,309 21 126,206 19
Source: Koloniaal Verslag 1907, appendix A
18
In conclusion it seems fair to say that for peasants in Java in the late nineteenth/early
twentieth century by-employment was an important feature of the changing rural economy.
The majority of peasants with access to cultivated land had only small holdings of wet-rice
fields, hardly enough to meet their food requirements even under favourable conditions
(Fernando, 1989, p. 169). Therefore self-sufficient subsistence peasant households had
largely disappeared and, except in remote and isolated areas, peasant households had become
accustomed to buying a proportion of their domestic requirements in the local markets.
6. How distorting is the effect of by-employment?
I believe that the extent to which by-employment distorts the overall picture of occupational
structure depends very much on the stage of economic development. In initial stages of
development most households will depend solely on agriculture. The first steps of economic
diversification will be taken besides the agricultural occupation. Only in the later stages of
development a majority of labourers will find full-time wage employment outside agriculture
and consequently by-employment will decrease.4 This path of development is illustrated in
figure 2.
In the specific case of Indonesia I would argue that not taking by employment into
account significantly changes the picture somewhat for the period 1905 through 1980.
Evidence suggests that before 1890 by-employment distorts the picture of the occupational
structure in Indonesia to a negligible extent. Arminius (1889) presented an account of the
hours worked for the head of the family. Allowing for one day off per week it turns out that
in all three cases the men worked more than 7 ½ hours per day throughout the entire year.
Clearly, this does not leave much time for a secondary job. For the 1970s evidence is mixed.
One study found that male heads of agricultural households worked more than 8 hours per
day, and their wives worked even longer (Edmundson and Sukhatme, 1990, p. 265-266). A
different study found that in ten villages in Java in 1980-81 out of 2393 persons 1297 were
solely employed in agriculture. 665 were employed in the non-agricultural sector and 431 had
mixed employment (Kasryno, 1986, p. 294). This means that 18.0 per cent of the total labour
4 A similar argument is made by Manning (1998) concerning underemployment. He argues that with economic
development underemployment is expected to decline, because of a shift from family work and self-employed
jobs in agriculture into non-agricultural wage employment. At later stages of development more flexible work
arrangements may lead to an increase in those working less than a full-time working week (Manning 1998, p.
189, footnote 28).

19
force in these villages was engaged in by-employment which is roughly equal to the
proportion in 1905.
Figure 2: Distortion of occupational structure figures due to by-employment
Dis
tort
ion
du
e t
o b
y-e
mp
loym
en
t
Stage of Economic Development
For 1905 it has been possible to make some adjustments. Unfortunately for later years
data on secondary occupation is missing.
7. By-employment: individual versus household income diversification
Surprisingly little attention is paid to this problem of by-employment in the literature on
employment in Indonesia. Discussion often concentrates on non-farm income of agricultural
households. Based on a substantial sample of farms households for the whole of Java and
Madura Meijer Ranneft and Huender estimated for 1925 that 30 per cent of total income
before tax was off-farm income (Meijer Ranneft & Huender, 1926, p. 41). Moreover, Booth
shows that in 1984 18.3 per cent of agricultural households had their main income for non-
agricultural activities rising even to 21.5 per cent in 1993 (Booth, 2002, p. 184).
20
But this is a different, although related issue. It is mainly an issue of definition. In
most cases these workers are probably rightly classified as being employed in, for example,
petty trade or small scale industry. But since their husband is working in the agricultural
sector, the household is also classified as agricultural. In this case there is no distortion in the
occupational structures obtained from population censuses, although these issues of definition
can be very confusing. Often it is unclear which definition is used and definitions are used
interchangeably. But rural is not equal to agricultural. And a rural non-agricultural household
is a possibility. We even find urban agricultural households in Indonesia‟s population
statistics. And are we talking about households or individuals?
Table 11: Definition checklist
Agricultural or Non-agricultural
Rural or Urban
Individual or Household
Relating the table above to our findings on the occupational structure and by-
employment the following can be said. In our discussion we concentrated on the level of the
individual and did not look at households. Moreover no distinction between rural and urban is
made. We looked at by-employment of agricultural workers in the non-agricultural sector.
However it should be kept in mind that workers in the non-agricultural sector can also have a
secondary job in a different sub-sector of the non-agricultural sector. This is probably more
often found in later stages of development as a survival strategy of the urban poor.
Census statistics are usually collected at the level of an individual. Therefore by-
employment only blurs the overall picture if individual household members have more than
one job. In many cases however, diversification of income occurs on a household level and
not necessarily on an individual level. In cases where each member of a household has a
different, but only one job, this is probably pretty well captured in the census statistics. Most
research, however, is at the level of the household and therefore it is frequently found that an
agricultural household earns a significant part of its income in the non-agricultural sector.
These effects of income diversification do not, however, distort the picture of the
occupational structure in a country. However, one should acknowledge both the structural
change on the level of an individual as well as changes in employment within a household to
understand the dynamics of employment, structural change and economic development.

21
8. Conclusion
Simply looking at the Indonesia‟s employment statistics would lead one to conclude that only
in the second half of the twentieth century a shift from agriculture to industry and services
occurred. In Kuznets terminology only then Indonesia made a step towards a modern
economy. Strikingly, developments in Indonesia‟s occupational structure seem to reveal an
unusual pattern. Whereas according to standard development theory labor moves first from
agriculture then to industry and then to services, in Indonesia the service sector turns out to
be already a large labor-absorbing sector in early stages of development.
If we look at labor productivity we have to adjust the conclusion a little. It was shown
that the labor shifting away from the agricultural sector did not go to higher productive
sectors. In this respect one could question whether Indonesia truly made a step towards a
modern economy.
Taking into account the problem of by-employment further nuances the picture. It is
quite common and persistent to portray the Javanese peasant economy as solely agricultural.
Even the term „agricultural involution‟ is used to describe developments during the colonial
period. However, if we adjust the available statistics for the fact that quite a significant
number of people had some kind of secondary job, we see that non-agricultural employment
already played an important role in the Javanese economy in the late nineteenth century. In
most cases looking for other means of income was necessary to earn enough income to
support the family.
Whether this sectoral shift out of agriculture in colonial Java can be compared to the
phenomenon of „proto-industrialization‟ in Europe is not clear (Mendels, 1972). Different
from Europe or late Tokugawa Japan, the growth of non-agricultural economic activity
during the phase of pre-modern economic growth in Java failed to produce a steady growth in
per-capita income, stimulating capital formation leading to the industrialization (Smith,
1973). At the same time one could argue that these changes could be indeed be characterized
as a modern economic transformation, but retarded by the Great Depression, Japanese
occupation and struggle for independence (Fernando, 1992, p. 16).
22
Bibliography
Alexander J. and P. Alexander (1990), „The Invisible Economy: Javanese Commerce in the
Later Colonial State‟, The Australian Journal of Anthropology, Vol. 1, No. 1, pp. 32-43.
Ark, B. van (1996), „Sectoral Growth Accounting and Structural Change in Post-war
Europe‟, in: B. van Ark and N. Crafts (eds.) Quantitive Aspects of Post-war European
Economic Growth, Cambridge, pp. 84-164.
Booth, A. (1998), The Indonesian Economy in the Nineteenth and Twentieth Century: A
History of Missed Opportunities, London.
Comitas, Lambros (1973), „Occupational Multiplicity in Rural Jamaica‟, in: Lambros
Comitas and David Lowenthal Work and Family Life: West Indian Perspectives, Garden
City, NY: Anchor Press/Doubleday, pp. 157-173.
Edmundson, W.C. and P.V. Sukhatme (1990), „Food and Work: Poverty and Hunger?‟,
Economic Development and Cultural Change, Vol. 38, No. 2, pp. 263-280.
Eng, P. van der (2002), „Indonesia‟s Growth Performance in the Twentieth Century‟, in: A.
Maddison, D.S. Prasada Rao and W.F. Shepherd (eds.) The Asian Economies in the Twentieth
Century, Cheltenham, pp. 143-179.
Fabricant, S. (1942), Employment in Manufacturing, 1899-1939, New York.
Fernando, M.R. (1989), „Javanese Peasants and By-Employment at the Turn of the Century‟,
in: R.J. May and W.J. O‟Malley (eds.) Observing Change in Asia: Essays in Honour of
J.A.C. Mackie, Bathurst: Crawford House Press, pp. 155-169.
Fernando, M.R. (1992), „Changing Character of Work-Force in Colonial Java, 1820-1930‟,
paper presented at the Economic History Society of Australia and New Zealand Conference,
July 1992.
Fernando, M.R. (1996), „Growth of Non-Agricultural Economic Activities in Java in the
Middle Decades of the Nineteenth Century‟, Modern Asian Studies, Vol. 30, No. 1, pp. 77-
119.
Graaf, E.A. van den (1955), De Statistiek in Indonesië, ‟s Gravenhage.
Horlings, E. (1995), The Economic Development of the Dutch Service Sector 1800-1850.
Trade and Transport in a Premodern Economy, Amsterdam, Aksant.
Kasryno, Faisal (1986), „Impact of Off-Farm Employment on Agircultural Labour
Absorption and Wages in Indonesia‟, in: R.T. Shand Off-Farm Employment in the
Development of Rural Asia, Canberra: Australian National University.
Kuznets, S. (1957), „Quantitative Aspects of the Economic Growth of Nations: Industrial
Distribution of National Product and Labor Force‟, Economic Development and Cultural
Change, Vol. 5, No.3, pp. 3-111.

23
Kuznets, S. (1966), Modern Economic Growth, New Haven.
Kuznets, S. (1973), „Modern Economic Growth: Findings and Reflections‟, American
Economic Review Vol. 63, pp. 247-258.
Lains, P. (2004), „Structural Change and Economic Growth in Portugal, 1950-1990‟, in: S.
Heikkinen and J.L. van Zanden (eds.) Explorations in Economic Growth, Amsterdam, pp.
321-340.
Maddison, A. (1980), „Economic Growth and Structural Change in the Advanced Countries‟,
in: I. Leveson and J.W. Wheeler (eds.) Western Economies in Transition: Structural Change
and Adjustment Policies in Industrial Countries, Colorado.
Manning, C. (1998), Indonesian Labour in Transition: An East-Asian Success Story?,
Cambridge: Cambridge University Press.
Meijer Ranneft, J.W. and W. Huender (1926), Onderzoek naar den Belastingdruk op de
Inlandsche Bevolking, Weltevreden: Landsdrukkerij.
Mendels, F.F. (1972), „Proto-industrialization: The First Phase of the Industrialization
Process‟, Journal of Economic History, Vol. 32, No. 1, pp. 241-261.
Mulder, N. (1999), The Economic Performance of the Service Sector in Brazil, Mexico and
the USA: A Comparative Historical Perspective, Groningen, PhD thesis.
Ohkawa, K. (1993), Growth Mechanism of Developing Countries: Investment, Productivity,
and Employment, San Francisco.
Smith, T.C. (1973), „Pre-modern Economic Growth: Japan and the West‟, Past and Present,
No. 60, pp. 127-160.
Smits, J.P. (1990), „The Size and Structure of the Dutch Service Sector in International
Perspective, 1850-1914‟, Economic and Social History in the Netherlands Vol. 2, pp. 81-98.
Smits, J.P. (1995), Economische Groei en Structuurveranderingen in de Nederlandse
Dienstensector, 1850-1913. De Bijdrage van Handel en Transport aan het Proces van
‘Moderne Economische Groei, Amsterdam, PhD thesis.
Syrquin, M. (1984), „Resource Allocation and Productivity Growth‟, in: M. Syrquin, L.
Taylor and L.E. Westphal (eds.) Economic Structure Performance – Essays in Honor of
Hollis B. Chenery, Orlando.
Syrquin, M. (1986), „Productivity Growth and Factor Reallocation‟, in: H.B. Chenery,
S.Robinson, and M. Syrquin (eds.) Industrialisation and Growth: A Comparative Study, New
York.
Timmer, M.P. and A. Szirmai (2000), „Productivity Growth in Asian Manufacturing: The
Structural Bonus Hypothesis Examined‟, Structural Change and Economic Dynamics Vol.
11, pp. 371-392.


