Occupational stress and well-being across the teaching career · PDF fileOccupational stress...
40
Supporting the Educators: Occupational stress and well-being across the teaching career span Authors: Paula Brough, Rachel Morrow, and Laura Harding
Transcript of Occupational stress and well-being across the teaching career · PDF fileOccupational stress...

Supporting the Educators: Occupational stress and well-being across the
teaching career span
Authors: Paula Brough, Rachel Morrow, and Laura Harding
SUPPORTING THE EDUCATORS
2
Table of Contents Project Overview ..................................................................................................................................... 3
Interview Results ..................................................................................................................................... 4
Survey Results ......................................................................................................................................... 5
Respondents Characteristics ............................................................................................................... 6
Job Satisfaction .................................................................................................................................... 7
Work-Life Balance ............................................................................................................................. 10
Job Demands ..................................................................................................................................... 12
Technology at Work .......................................................................................................................... 15
Bullying .............................................................................................................................................. 17
Workload Management .................................................................................................................... 19
Role Demands ................................................................................................................................... 20
Social Support .................................................................................................................................... 21
Colleague Support ......................................................................................................................... 21
Supervisor Support ........................................................................................................................ 23
Family/Friend Support ................................................................................................................... 24
Job Control ........................................................................................................................................ 26
Coping ................................................................................................................................................ 28
Strain ................................................................................................................................................. 30
Turnover Intentions ........................................................................................................................... 32
Summary ............................................................................................................................................... 33
Recommendations ................................................................................................................................ 35
Additional Comments ............................................................................................................................ 37
References ............................................................................................................................................. 37
Interview questions and survey measures have not been included as appendices in this report. However, if any parties are
interested in finding out more information regarding the measures used and/or the interview questions asked, please feel
free to contact Professor Paula Brough ([email protected]) for more information.

SUPPORTING THE EDUCATORS
3
Project Overview
The necessity and value in providing effective workplace support and personal development
opportunities for teachers as they transition through their careers is of increasing concern to
education interest groups, education advocacy groups and employing authorities alike.
Evidence suggests that teachers are working longer hours in order to meet obligations and
are experiencing increased workloads, both of which factors are unsustainable in the long-
term (Timms, Graham & Cottrell, 2007). As a result, teachers may be at risk of physical and
mental ill-health as well as reduced well-being and career satisfaction (Timms et al., 2007).
Although recent findings indicate that career satisfaction is influenced by teacher
perceptions of meaning and fulfilment in their role (Timms & Brough, 2013), few studies
have sought to identify how perceptions vary among career stages. Furthermore, current
knowledge is limited in identifying the specific experiences of occupational stress, work-life
balance, and technological demands for teaching employees at the early-career, mid-career,
late-career and pre-retirement career stages.
To address these issues, Griffith University instigated a 2015 research project to assess
teachers’ job attitudes and outcomes across their careers. The Queensland College of
Teachers (QCT) and the Independent Education Union (IEUA-QNT) were both approached to
collaborate with this project and both agreed to provide in kind and direct support.
This project was implemented across two phases. The first phase was conducted in July
2015 and involved interviews with teachers of different career stages and school regions in
Queensland. The second phase of this research was conducted in November 2015 and
included a state-wide survey distributed to teachers who were registered with the QCT and
/or members of the IEUA-QNT.
The aim of this project is to provide recommendations regarding support practices and
development strategies for teachers across career stages and in doing so, identify practices
that will retain productive and engaged teaching employees.
This research project was approved through and subject to the Griffith University research ethics requirements. Participation in any aspect of this research was voluntary and confidential. All data is strictly confidential and is retained by Griffith University researchers in a secure holding on premises. All results and information provided in any form are based on amalgamated data only.
Overall, there were 794 survey responses; however, after accounting for missing data and incomplete responses, the final sample was approximately 560 complete responses.
This report was prepared by Rachel Morrow, Laura Harding and Professor Paula Brough. The views expressed in this research are our own
and do not necessarily reflect the position or policy of the organisations involved in this research. This research received some funding from
both QCT and QIEU, and this support is gratefully acknowledged.

SUPPORTING THE EDUCATORS
4
Interview Results
Interviews were conducted in July 2015 with a total of ten respondents. Based on the
findings of the interviews three major themes emerged as current work issues. These
themes informed the content of the subsequent survey questions, to ensure the survey
addressed current concerns.
1. Administration
Administration includes aspects such as paperwork, reporting and general administrative
duties. Respondents suggested that they were required to perform excessive paperwork
that often impacted on non-work hours. Additionally, respondents indicated that
paperwork was seen to be intensifying their work responsibilities through an increased
number of report writing deadlines.
2. Workload
Workload refers to the management and intensification of various teacher roles.
Respondents indicated that traditional teaching roles were “a thing of the past” and they
felt they were now required to perform multiple roles including counsellor, parent, nurse
etc.
3. Accountability
Accountability includes management of others’ expectations and of student behaviour.
Respondents suggested that it was becoming increasingly difficult to manage student
behaviour; they felt that excessive attention on disruptive students deprived engaged
students of learning opportunities. Additionally, respondents indicated that parental
expectations were becoming difficult to meet, including increased expectations of
accountability on low student grades and less favourable student reports. Excessive
accountability expectations were also reported to occur from principals and administration
staff within schools.
SUPPORTING THE EDUCATORS
5
Survey Results
This section of the report focuses on results obtained for each of the constructs measured in
the survey. The survey measured different aspects that may contribute to teacher stress.
Results are assessed and are identified as being statistically significant only in some specific
cases. All other results are not necessarily statistically significant. The report will present
findings according to the following measures:
1. Job Satisfaction
2. Work-life Balance
3. Job Demands
4. Technology at Work
5. Bullying
6. Workload Management
7. Role Demands
8. Social Support
9. Job Control
10. Coping
11. Strain
12. Turnover Intentions
In addition to the above analyses, the results have also been reported as amalgamated
sample averages according to:
Career stage
School setting
Teaching year level
Teacher job status
This report will conclude with recommendations and additional comments provided by
respondents within the survey.
SUPPORTING THE EDUCATORS
6
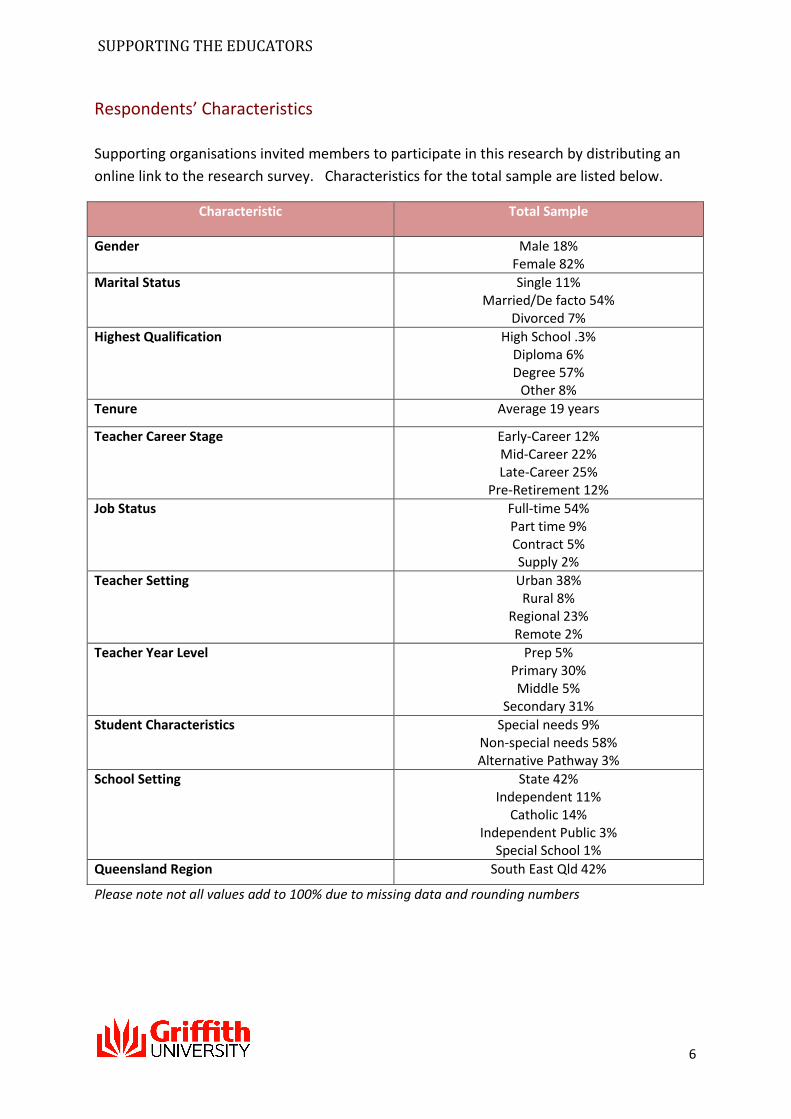
Respondents’ Characteristics
Supporting organisations invited members to participate in this research by distributing an
online link to the research survey. Characteristics for the total sample are listed below.
Characteristic Total Sample
Gender Male 18% Female 82%
Marital Status Single 11% Married/De facto 54%
Divorced 7%
Highest Qualification High School .3% Diploma 6% Degree 57%
Other 8%
Tenure Average 19 years
Teacher Career Stage Early-Career 12% Mid-Career 22% Late-Career 25%
Pre-Retirement 12%
Job Status Full-time 54% Part time 9% Contract 5% Supply 2%
Teacher Setting Urban 38% Rural 8%
Regional 23% Remote 2%
Teacher Year Level Prep 5% Primary 30% Middle 5%
Secondary 31%
Student Characteristics Special needs 9% Non-special needs 58% Alternative Pathway 3%
School Setting State 42% Independent 11%
Catholic 14% Independent Public 3%
Special School 1%
Queensland Region South East Qld 42%
Please note not all values add to 100% due to missing data and rounding numbers
SUPPORTING THE EDUCATORS
7
Job Satisfaction
Job satisfaction refers to the acceptance of a situation that can be based on intrinsic (e.g.,
pride) and/or extrinsic (e.g., rewards) factors. Overall job satisfaction (as reported in this
research) reflects the degree to which teachers are satisfied with their current job as a
whole.
Job satisfaction therefore includes general satisfaction with aspects of the physical working
environment (e.g., facilities, workspace), method of working (e.g., task vs process,
independent vs collaborative), colleagues, recognition, immediate supervisor, level of
responsibility, pay, personal abilities (e.g., skills application and learning), industrial
relations, promotion, school management, work hours, job variety and job security (Warr,
Cook & Wall, 1979).
Job satisfaction is an important consideration for organisations as it reflects the positive
perceptions and feelings of employees about how their job is helping them to achieve
desirable outcomes or values, e.g., pay, personal development. If employees show low
satisfaction (demonstrated as low scores) they are more likely to also experience a reduction
in motivation and engagement at work.
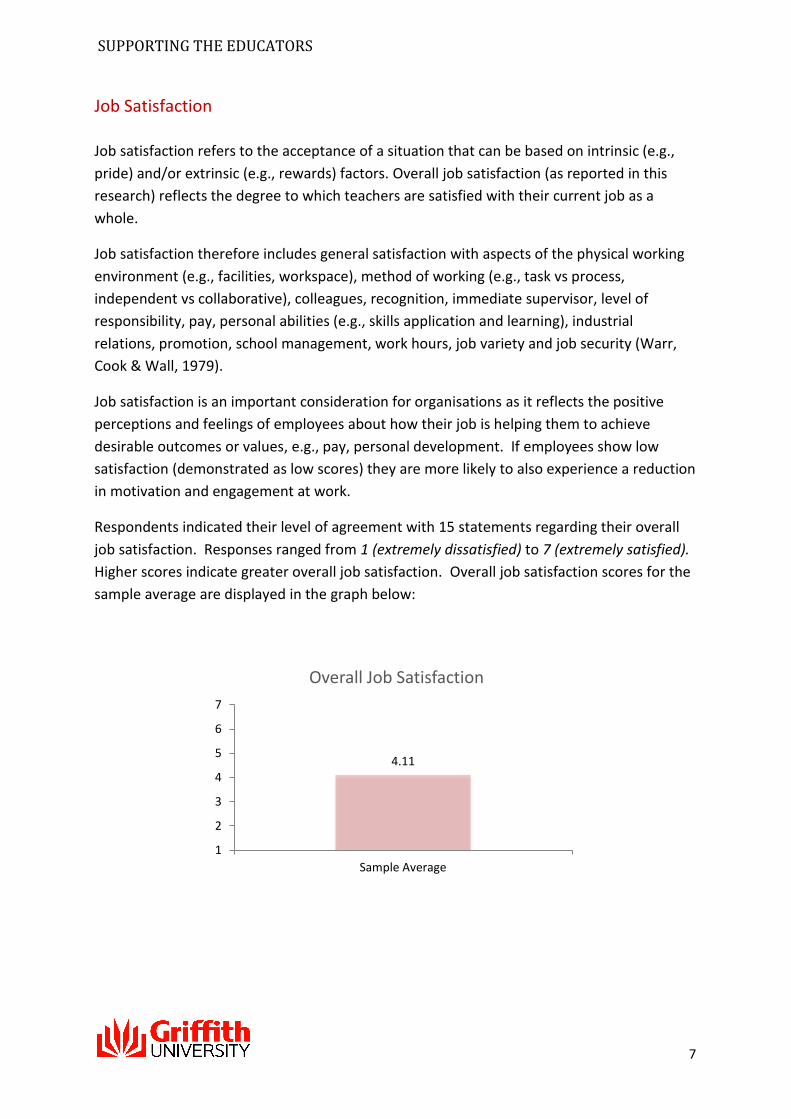
Respondents indicated their level of agreement with 15 statements regarding their overall
job satisfaction. Responses ranged from 1 (extremely dissatisfied) to 7 (extremely satisfied).
Higher scores indicate greater overall job satisfaction. Overall job satisfaction scores for the
sample average are displayed in the graph below:
4.11
1
2
3
4
5
6
7
Sample Average
Overall Job Satisfaction

SUPPORTING THE EDUCATORS
8
Key findings for the sample:
Respondents reported moderate job satisfaction
Respondents indicated that they were most satisfied with their colleagues at work
and least satisfied with their work hours
Many respondents’ scores fell above the scale midpoint for responses (1 being no
satisfaction, 3.5 being average and 7 being satisfied), indicating general overall job
satisfaction
Additional key findings:
5.15 5.04 4.84 4.67 4.42 4.38 4.33 4.163.74 3.71 3.65 3.63 3.6 3.6
2.72
1
2
3
4
5
6
7
Aspects of Job Satisfaction
4.18 4.16 4.02 4.06
1
2
3
4
5
6
7
Early-career Mid-career Late-career Pre-retirement
Teacher Career Stage Early-career teachers reported
slightly higher overall job
satisfaction scores compared to
other career stages
All career stages were above the
scale average, indicating general
overall job satisfaction
SUPPORTING THE EDUCATORS
9
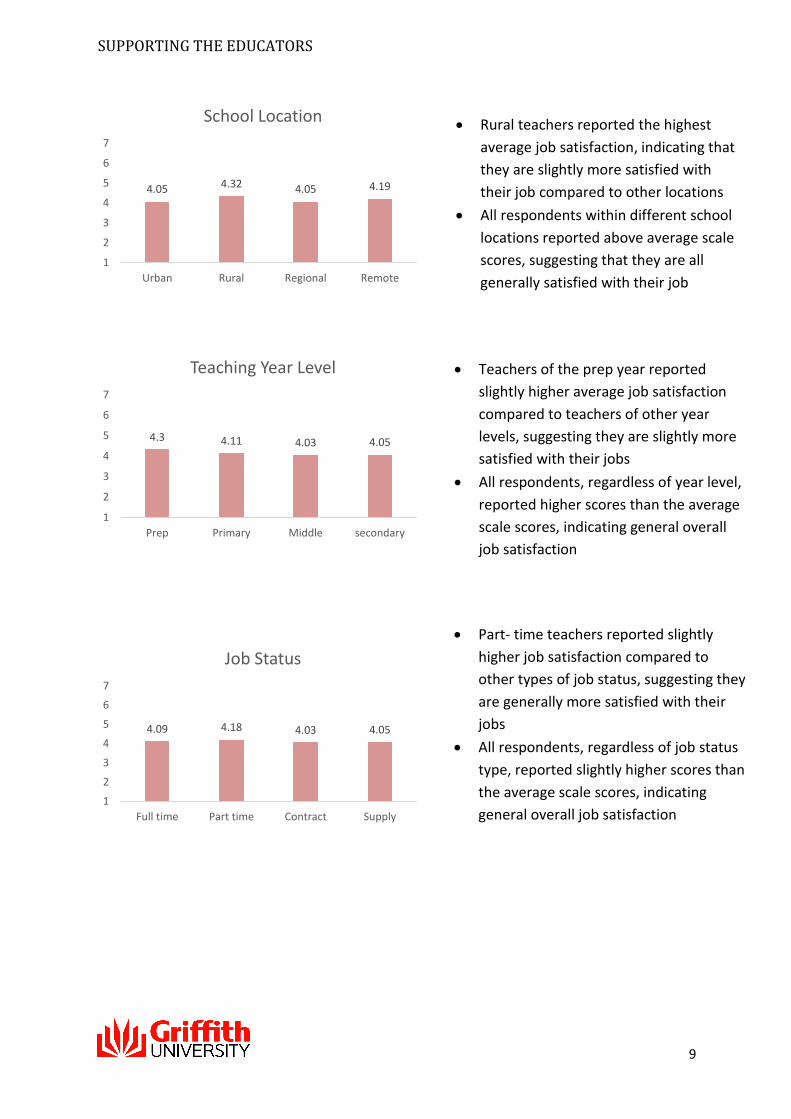
4.05 4.32 4.05 4.19
1
2
3
4
5
6
7
Urban Rural Regional Remote
School Location
4.3 4.11 4.03 4.05
1
2
3
4
5
6
7
Prep Primary Middle secondary
Teaching Year Level
4.09 4.18 4.03 4.05
1
2
3
4
5
6
7
Full time Part time Contract Supply
Job Status
Rural teachers reported the highest
average job satisfaction, indicating that
they are slightly more satisfied with
their job compared to other locations
All respondents within different school
locations reported above average scale
scores, suggesting that they are all
generally satisfied with their job
Teachers of the prep year reported
slightly higher average job satisfaction
compared to teachers of other year
levels, suggesting they are slightly more
satisfied with their jobs
All respondents, regardless of year level,
reported higher scores than the average
scale scores, indicating general overall
job satisfaction
Part- time teachers reported slightly
higher job satisfaction compared to
other types of job status, suggesting they
are generally more satisfied with their
jobs
All respondents, regardless of job status
type, reported slightly higher scores than
the average scale scores, indicating
general overall job satisfaction
SUPPORTING THE EDUCATORS
10
Work-Life Balance
Work-life balance refers to an individual’s subjective appraisal of the balance between
his/her work, non-work and life activities (Brough et al., 2014). As such, work-life balance
describes how different types of role demands interact with work and non-work factors.
Recently, it has been suggested that multiple work and non-work demands may not be
negative (e.g., as they may also be enriching; Brough et al., 2014). However, maintaining
perceived balance is critical for employee well-being, satisfaction and performance.
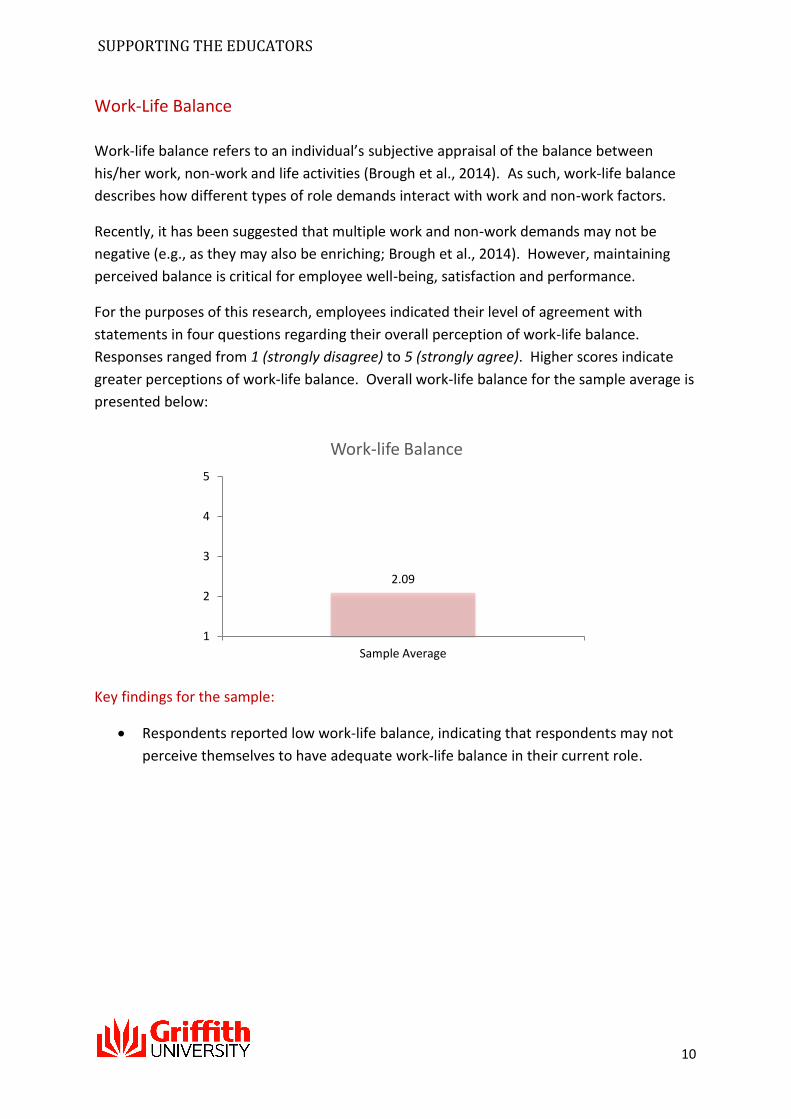
For the purposes of this research, employees indicated their level of agreement with
statements in four questions regarding their overall perception of work-life balance.
Responses ranged from 1 (strongly disagree) to 5 (strongly agree). Higher scores indicate
greater perceptions of work-life balance. Overall work-life balance for the sample average is
presented below:
Key findings for the sample:
Respondents reported low work-life balance, indicating that respondents may not
perceive themselves to have adequate work-life balance in their current role.
2.09
1
2
3
4
5
Sample Average
Work-life Balance
SUPPORTING THE EDUCATORS
11
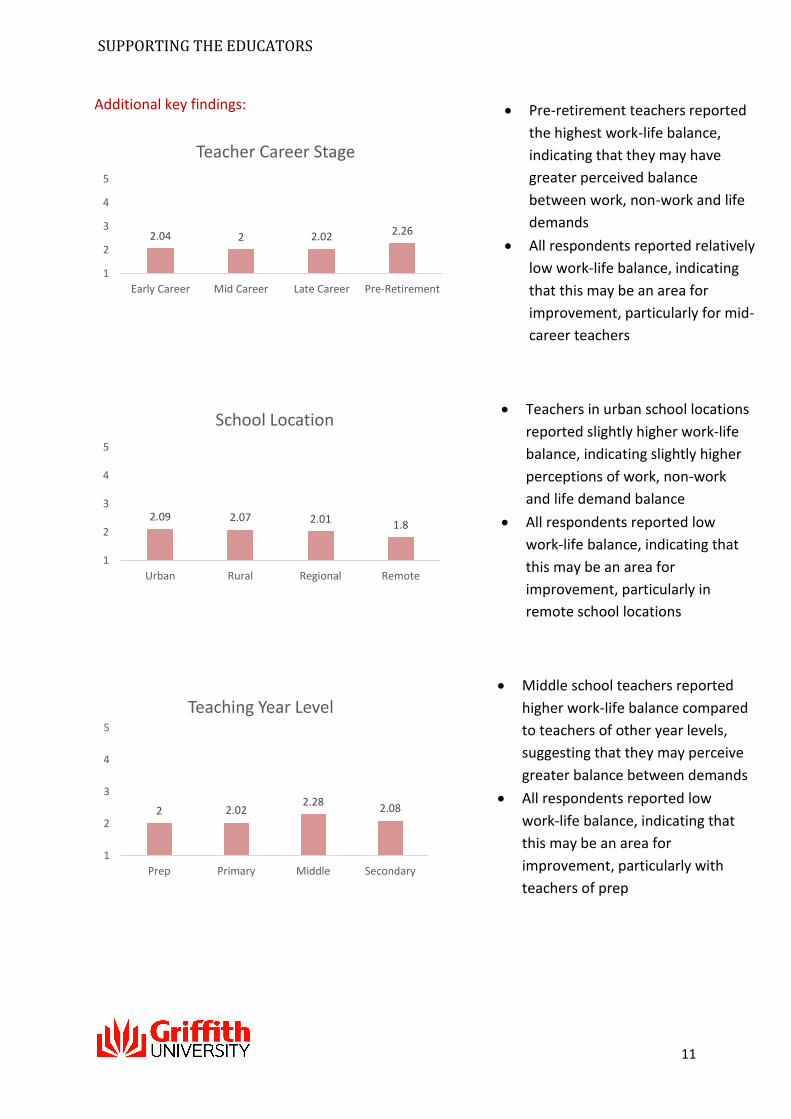
Additional key findings:
2.04 2 2.02 2.26
1
2
3
4
5
Early Career Mid Career Late Career Pre-Retirement
Teacher Career Stage
2.09 2.07 2.01 1.8
1
2
3
4
5
Urban Rural Regional Remote
School Location
2 2.022.28
2.08
1
2
3
4
5
Prep Primary Middle Secondary
Teaching Year Level
Pre-retirement teachers reported
the highest work-life balance,
indicating that they may have
greater perceived balance
between work, non-work and life
demands
All respondents reported relatively
low work-life balance, indicating
that this may be an area for
improvement, particularly for mid-
career teachers
Teachers in urban school locations
reported slightly higher work-life
balance, indicating slightly higher
perceptions of work, non-work
and life demand balance
All respondents reported low
work-life balance, indicating that
this may be an area for
improvement, particularly in
remote school locations
Middle school teachers reported
higher work-life balance compared
to teachers of other year levels,
suggesting that they may perceive
greater balance between demands
All respondents reported low
work-life balance, indicating that
this may be an area for
improvement, particularly with
teachers of prep
SUPPORTING THE EDUCATORS
12
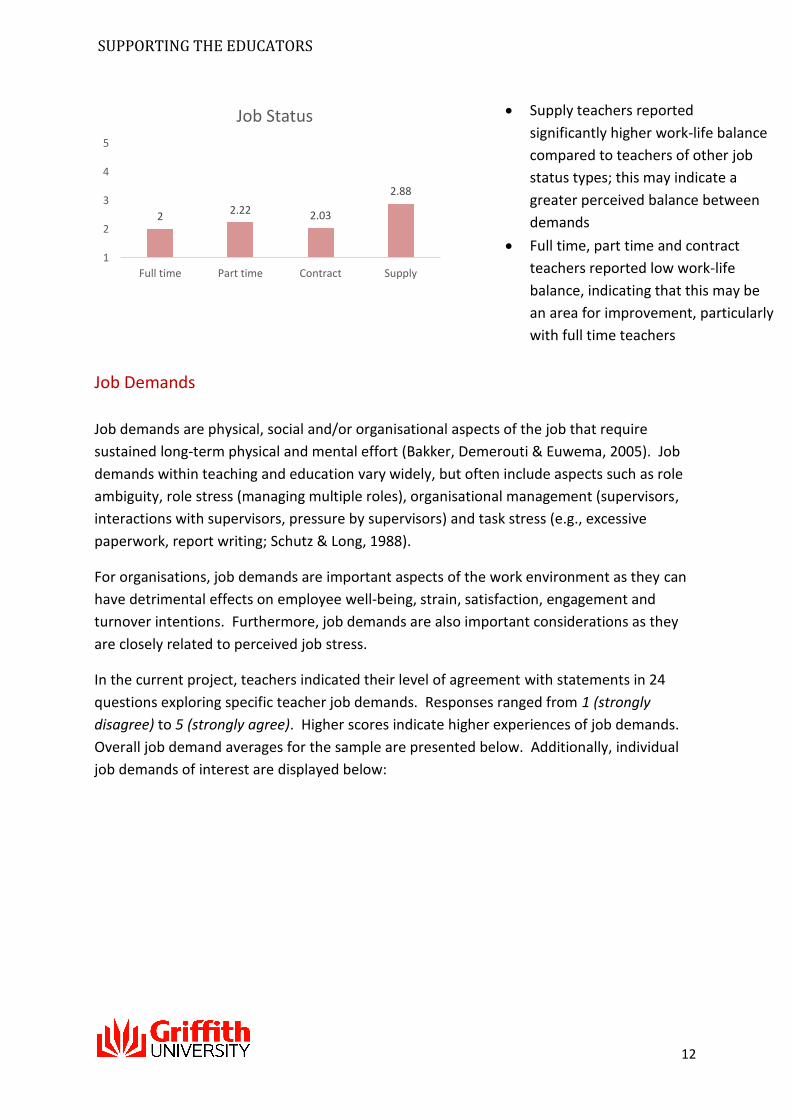
Job Demands
Job demands are physical, social and/or organisational aspects of the job that require
sustained long-term physical and mental effort (Bakker, Demerouti & Euwema, 2005). Job
demands within teaching and education vary widely, but often include aspects such as role
ambiguity, role stress (managing multiple roles), organisational management (supervisors,
interactions with supervisors, pressure by supervisors) and task stress (e.g., excessive
paperwork, report writing; Schutz & Long, 1988).
For organisations, job demands are important aspects of the work environment as they can
have detrimental effects on employee well-being, strain, satisfaction, engagement and
turnover intentions. Furthermore, job demands are also important considerations as they
are closely related to perceived job stress.
In the current project, teachers indicated their level of agreement with statements in 24
questions exploring specific teacher job demands. Responses ranged from 1 (strongly
disagree) to 5 (strongly agree). Higher scores indicate higher experiences of job demands.
Overall job demand averages for the sample are presented below. Additionally, individual
job demands of interest are displayed below:
22.22 2.03
2.88
1
2
3
4
5
Full time Part time Contract Supply
Job Status Supply teachers reported
significantly higher work-life balance
compared to teachers of other job
status types; this may indicate a
greater perceived balance between
demands
Full time, part time and contract
teachers reported low work-life
balance, indicating that this may be
an area for improvement, particularly
with full time teachers

SUPPORTING THE EDUCATORS
13
Key findings for the sample:
Respondents reported that the highest area contributing to overall job demands was
task stress; this suggests that teachers may find administrative duties and paperwork
to be more demanding
Respondents indicated that role ambiguity was least likely to be perceived as a job
demand
Additional key findings:
3.3
1
2
3
4
5
Sample Average
Overall Job Demands
2.64
3.4 3.19
3.75
1
2
3
4
5
Role Ambiguity Role Stress OrganisationalManagement
Task Stress
Individual Job Demands
3.22 3.26 3.35 3.33
1
2
3
4
5
Early Career Mid Career Late Career Pre-Retirement
Teacher Career Stage Late career teachers reported slightly
higher job demands compared to
teachers at other career stages, indicating
that they perceive more job demands
All respondents indicated mild to
moderate experiences of job demands at
each career stage, indicating mild
experiences of stress
SUPPORTING THE EDUCATORS
14
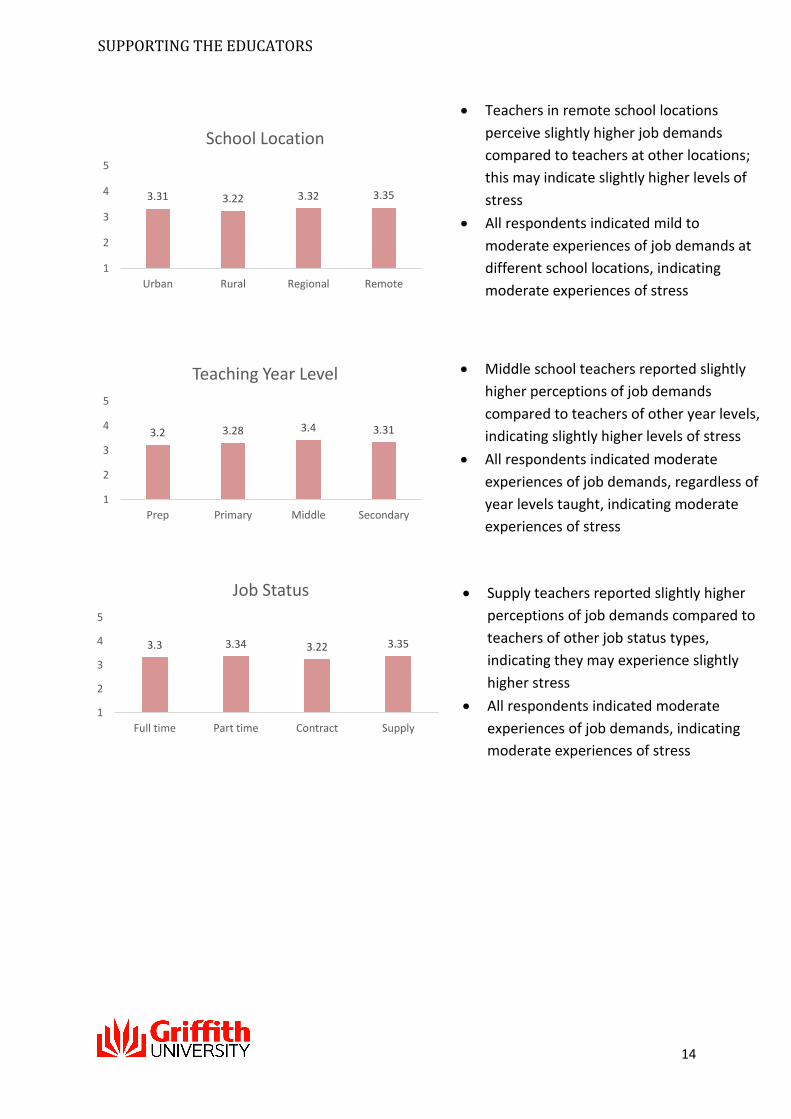
3.31 3.22 3.32 3.35
1
2
3
4
5
Urban Rural Regional Remote
School Location
3.2 3.28 3.4 3.31
1
2
3
4
5
Prep Primary Middle Secondary
Teaching Year Level
Teachers in remote school locations
perceive slightly higher job demands
compared to teachers at other locations;
this may indicate slightly higher levels of
stress
All respondents indicated mild to
moderate experiences of job demands at
different school locations, indicating
moderate experiences of stress
Middle school teachers reported slightly
higher perceptions of job demands
compared to teachers of other year levels,
indicating slightly higher levels of stress
All respondents indicated moderate
experiences of job demands, regardless of
year levels taught, indicating moderate
experiences of stress
Supply teachers reported slightly higher
perceptions of job demands compared to
teachers of other job status types,
indicating they may experience slightly
higher stress
All respondents indicated moderate
experiences of job demands, indicating
moderate experiences of stress
3.3 3.34 3.22 3.35
1
2
3
4
5
Full time Part time Contract Supply
Job Status
SUPPORTING THE EDUCATORS
15
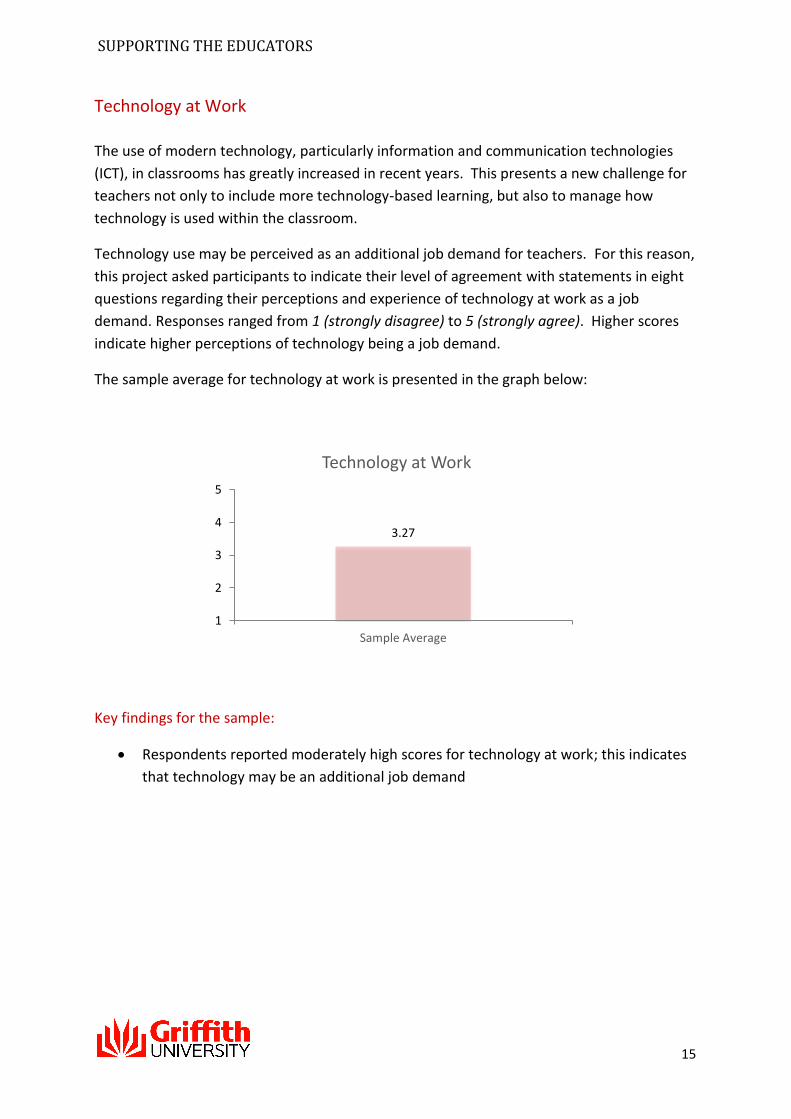
Technology at Work
The use of modern technology, particularly information and communication technologies
(ICT), in classrooms has greatly increased in recent years. This presents a new challenge for
teachers not only to include more technology-based learning, but also to manage how
technology is used within the classroom.
Technology use may be perceived as an additional job demand for teachers. For this reason,
this project asked participants to indicate their level of agreement with statements in eight
questions regarding their perceptions and experience of technology at work as a job
demand. Responses ranged from 1 (strongly disagree) to 5 (strongly agree). Higher scores
indicate higher perceptions of technology being a job demand.
The sample average for technology at work is presented in the graph below:
Key findings for the sample:
Respondents reported moderately high scores for technology at work; this indicates
that technology may be an additional job demand
3.27
1
2
3
4
5
Sample Average
Technology at Work
SUPPORTING THE EDUCATORS
16
Additional key findings:
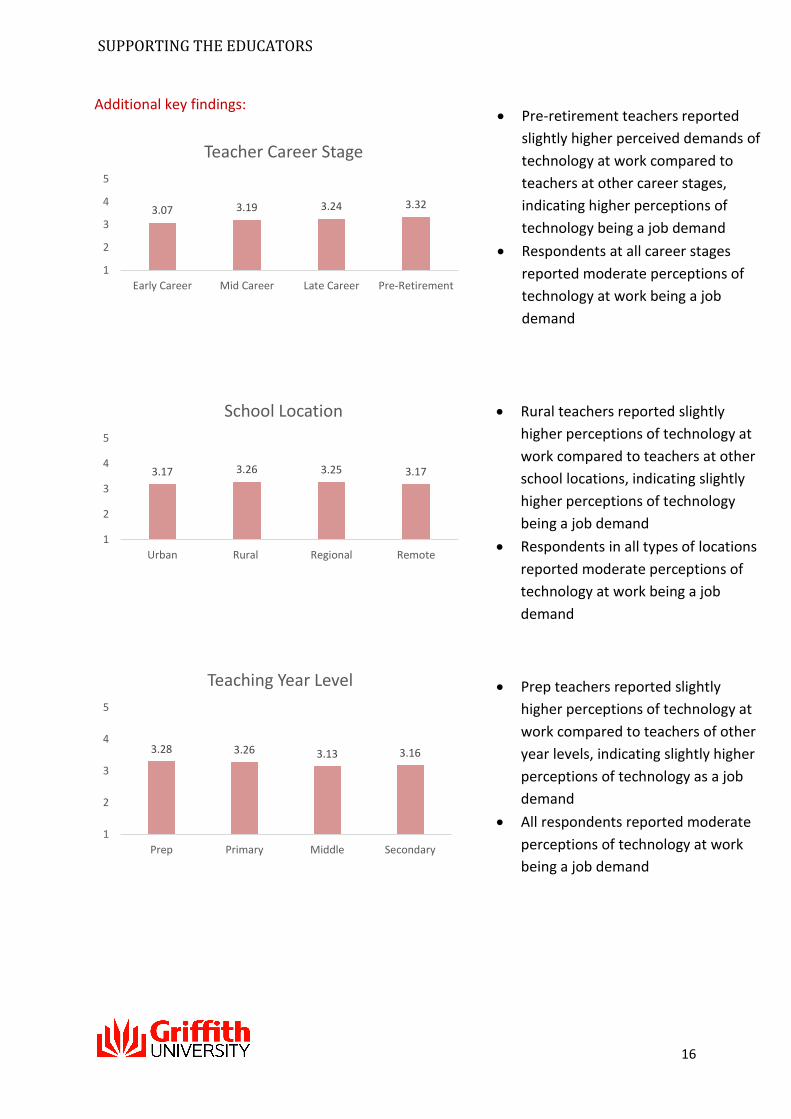
3.07 3.19 3.24 3.32
1
2
3
4
5
Early Career Mid Career Late Career Pre-Retirement
Teacher Career Stage
3.17 3.26 3.25 3.17
1
2
3
4
5
Urban Rural Regional Remote
School Location
3.28 3.26 3.13 3.16
1
2
3
4
5
Prep Primary Middle Secondary
Teaching Year Level
Pre-retirement teachers reported
slightly higher perceived demands of
technology at work compared to
teachers at other career stages,
indicating higher perceptions of
technology being a job demand
Respondents at all career stages
reported moderate perceptions of
technology at work being a job
demand
Rural teachers reported slightly
higher perceptions of technology at
work compared to teachers at other
school locations, indicating slightly
higher perceptions of technology
being a job demand
Respondents in all types of locations
reported moderate perceptions of
technology at work being a job
demand
Prep teachers reported slightly
higher perceptions of technology at
work compared to teachers of other
year levels, indicating slightly higher
perceptions of technology as a job
demand
All respondents reported moderate
perceptions of technology at work
being a job demand

SUPPORTING THE EDUCATORS
17
Bullying
According to the Prevention of Workplace Harassment Code of Practice 2004,
bullying/harassment involves the perpetration of repeated unwelcome and unsolicited
behaviours, which could be considered by a reasonable person to be offensive, humiliating,
intimidating, or threatening. This does not, however, include reasonable management
actions (e.g. performance management and disciplinary actions), unless they are primarily
intended to offend or humiliate an individual, or create an environment that encourages
bullying and harassment.
Bullying is a growing concern for both organisations and employees as it has been shown to
cause detrimental outcomes such as burnout, strain, reduced performance and increased
turnover of staff.
Respondents were asked to indicate their levels of experience of bullying (20 questions) in
their occupational setting. Responses ranged from 0 (never) to 4 (daily). Higher scores
indicate greater experiences of bullying at work. The bullying sample average is presented
in the graph below:
3.18 3.36 3.163.38
1
2
3
4
5
Full time Part time Contract Supply
Job Status
0.67
0
1
2
3
4
Sample Average
Bullying
Supply teachers reported slightly
higher perceptions of technology at
work compared to teachers at other
levels of job status, indicating slightly
higher perceptions of technology
being a job demand
All respondents reported moderate
perceptions of technology at work
being a job demand
SUPPORTING THE EDUCATORS
18
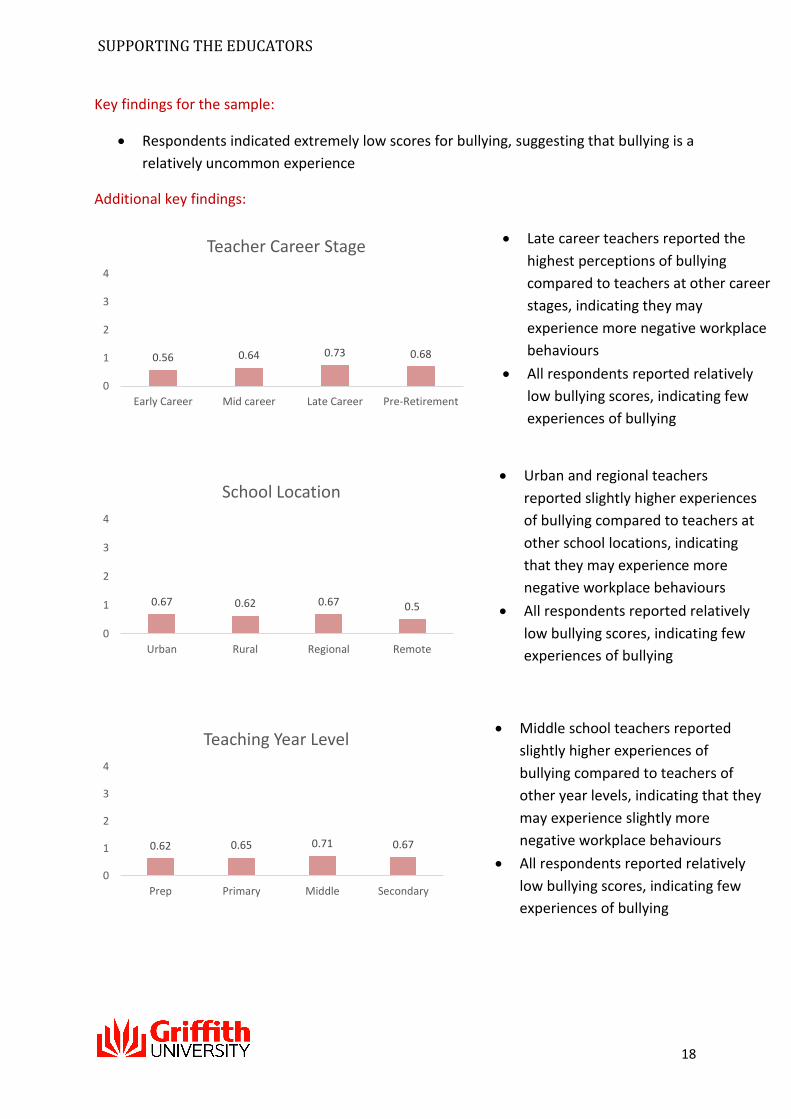
Key findings for the sample:
Respondents indicated extremely low scores for bullying, suggesting that bullying is a
relatively uncommon experience
Additional key findings:
0.56 0.64 0.73 0.68
0
1
2
3
4
Early Career Mid career Late Career Pre-Retirement
Teacher Career Stage
0.67 0.62 0.67 0.5
0
1
2
3
4
Urban Rural Regional Remote
School Location
0.62 0.65 0.71 0.67
0
1
2
3
4
Prep Primary Middle Secondary
Teaching Year Level
Late career teachers reported the
highest perceptions of bullying
compared to teachers at other career
stages, indicating they may
experience more negative workplace
behaviours
All respondents reported relatively
low bullying scores, indicating few
experiences of bullying
Urban and regional teachers
reported slightly higher experiences
of bullying compared to teachers at
other school locations, indicating
that they may experience more
negative workplace behaviours
All respondents reported relatively
low bullying scores, indicating few
experiences of bullying
Middle school teachers reported
slightly higher experiences of
bullying compared to teachers of
other year levels, indicating that they
may experience slightly more
negative workplace behaviours
All respondents reported relatively
low bullying scores, indicating few
experiences of bullying
SUPPORTING THE EDUCATORS
19
Workload Management
How an individual manages their workload is an important aspect of managing occupational
demands. During interviews conducted for this project in July 2015, interviewees indicated
that there were many techniques useful for managing workload. The interview results were
compiled into a measure of workload management.
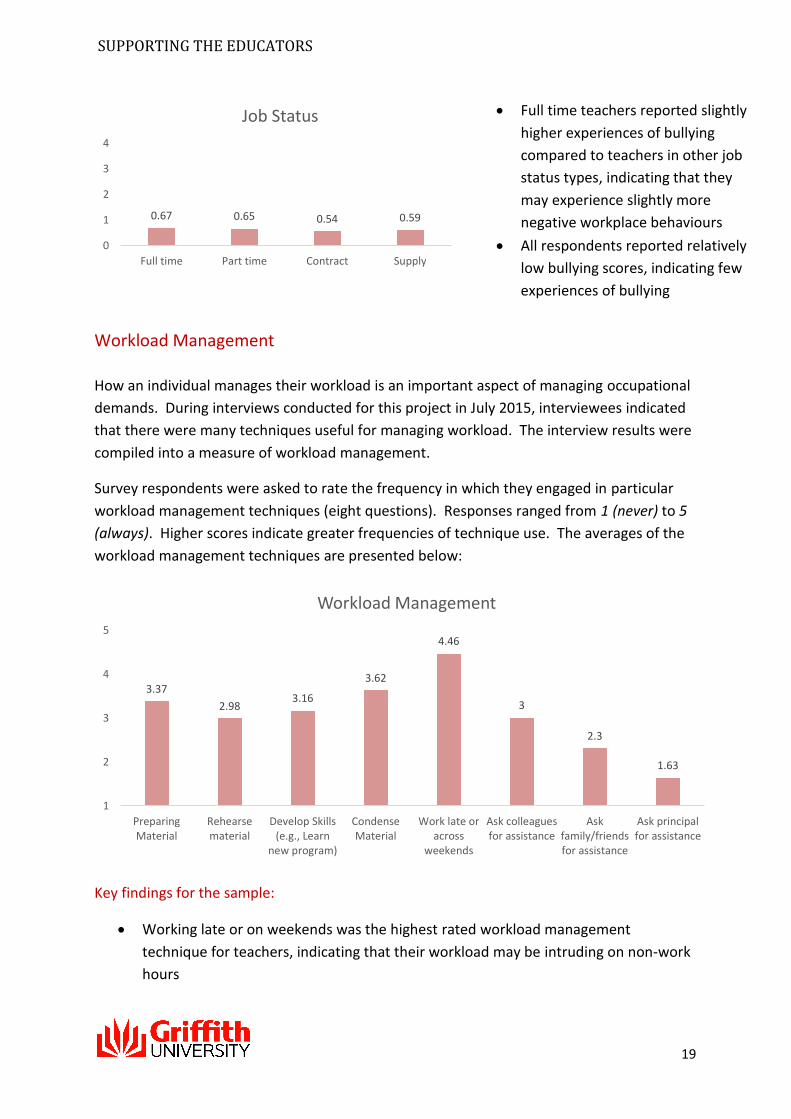
Survey respondents were asked to rate the frequency in which they engaged in particular
workload management techniques (eight questions). Responses ranged from 1 (never) to 5
(always). Higher scores indicate greater frequencies of technique use. The averages of the
workload management techniques are presented below:
Key findings for the sample:
Working late or on weekends was the highest rated workload management
technique for teachers, indicating that their workload may be intruding on non-work
hours
0.67 0.65 0.54 0.59
0
1
2
3
4
Full time Part time Contract Supply
Job Status
3.37
2.983.16
3.62
4.46
3
2.3
1.63
1
2
3
4
5
PreparingMaterial
Rehearsematerial
Develop Skills(e.g., Learn
new program)
CondenseMaterial
Work late oracross
weekends
Ask colleaguesfor assistance
Askfamily/friendsfor assistance
Ask principalfor assistance
Workload Management
Full time teachers reported slightly
higher experiences of bullying
compared to teachers in other job
status types, indicating that they
may experience slightly more
negative workplace behaviours
All respondents reported relatively
low bullying scores, indicating few
experiences of bullying

SUPPORTING THE EDUCATORS
20
Role Demands
‘Role demands’ refers to the perception by employees of having to perform additional roles
outside their traditional role requirements. In interviews conducted in July 2015,
interviewees indicated that teachers were being required to perform multiple roles
including that of a parent, nurse, administrator etc. The interview results were compiled
into a measure of teacher role demands.
Survey respondents were asked to indicate the frequency with which they experience
particular role demands (seven questions). Responses ranged from 1 (never) to 5 (always).
Higher scores indicate a greater frequency of particular role demands being performed. The
averages of the role demands measure are presented below:
Key findings for the sample:
Respondents indicated that they perform administrator roles more frequently
compared to other additional roles
Respondents reported performing nurse roles least (this included attending to
medical needs of students)
3.66 3.67
2.94
3.71 3.833.7 3.64
1
2
3
4
5
Parent Mediator Nurse Counsellor Administrator Manager Social Worker
Role Demands

SUPPORTING THE EDUCATORS
21
Social Support
‘Social support’ refers to the perception that one is cared for and loved by others (Cobb,
1976). Furthermore, social support has been widely shown to be a beneficial resource for
employees as it increases positive employee outcomes.
Social support can be further broken down into various support networks. For teachers,
three critical support networks have been identified, including work colleagues, supervisors
at work and family/friend support.
Respondents were asked to indicate the extent to which they received support from their
various support networks (12 questions). Responses ranged from 1 (never) to 6 (all the
time). Higher scores indicate more frequent experiences of support. The sample average
for social support is presented in the graph below:
Colleague Support
Key findings for the sample:
Respondents reported moderate colleague support, suggesting greater or more
positive experiences of colleague support
3.31
1
2
3
4
5
6
Sample Average
Colleague Support
SUPPORTING THE EDUCATORS
22
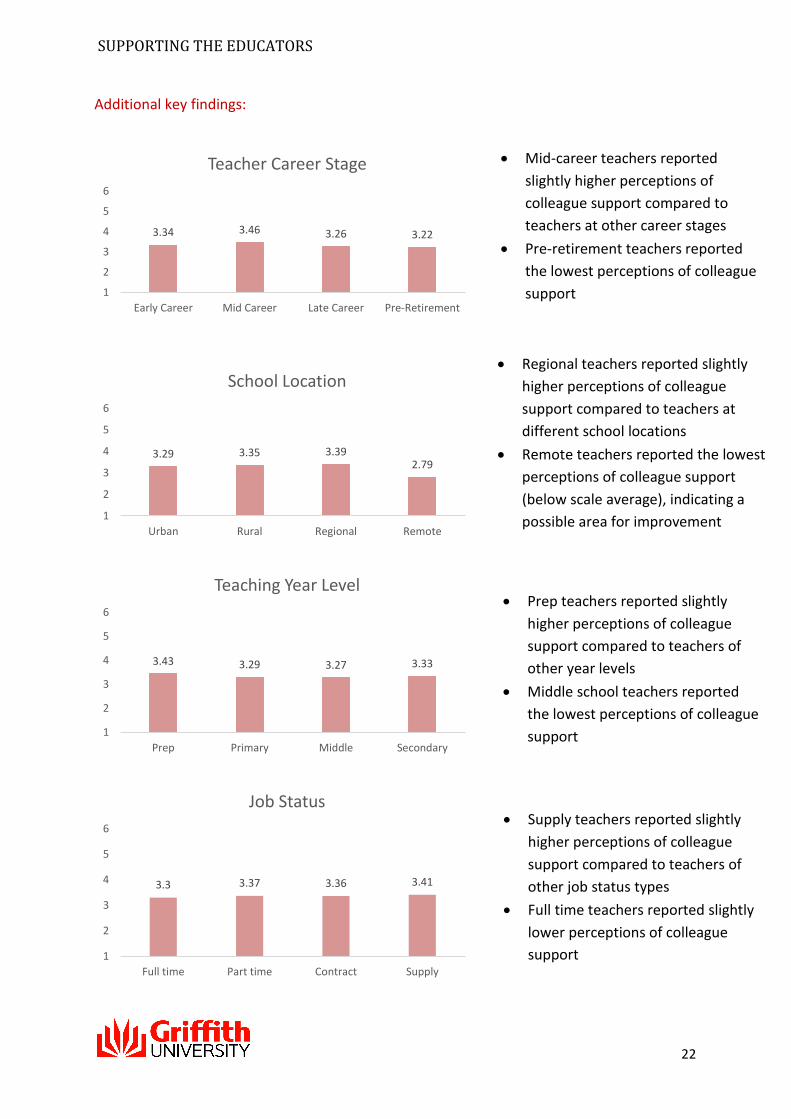
Additional key findings:
3.29 3.35 3.392.79
1
2
3
4
5
6
Urban Rural Regional Remote
School Location
3.43 3.29 3.27 3.33
1
2
3
4
5
6
Prep Primary Middle Secondary
Teaching Year Level
3.3 3.37 3.36 3.41
1
2
3
4
5
6
Full time Part time Contract Supply
Job Status
Mid-career teachers reported
slightly higher perceptions of
colleague support compared to
teachers at other career stages
Pre-retirement teachers reported
the lowest perceptions of colleague
support
Regional teachers reported slightly
higher perceptions of colleague
support compared to teachers at
different school locations
Remote teachers reported the lowest
perceptions of colleague support
(below scale average), indicating a
possible area for improvement
Prep teachers reported slightly
higher perceptions of colleague
support compared to teachers of
other year levels
Middle school teachers reported
the lowest perceptions of colleague
support
Supply teachers reported slightly
higher perceptions of colleague
support compared to teachers of
other job status types
Full time teachers reported slightly
lower perceptions of colleague
support
3.34 3.46 3.26 3.22
1
2
3
4
5
6
Early Career Mid Career Late Career Pre-Retirement
Teacher Career Stage
SUPPORTING THE EDUCATORS
23
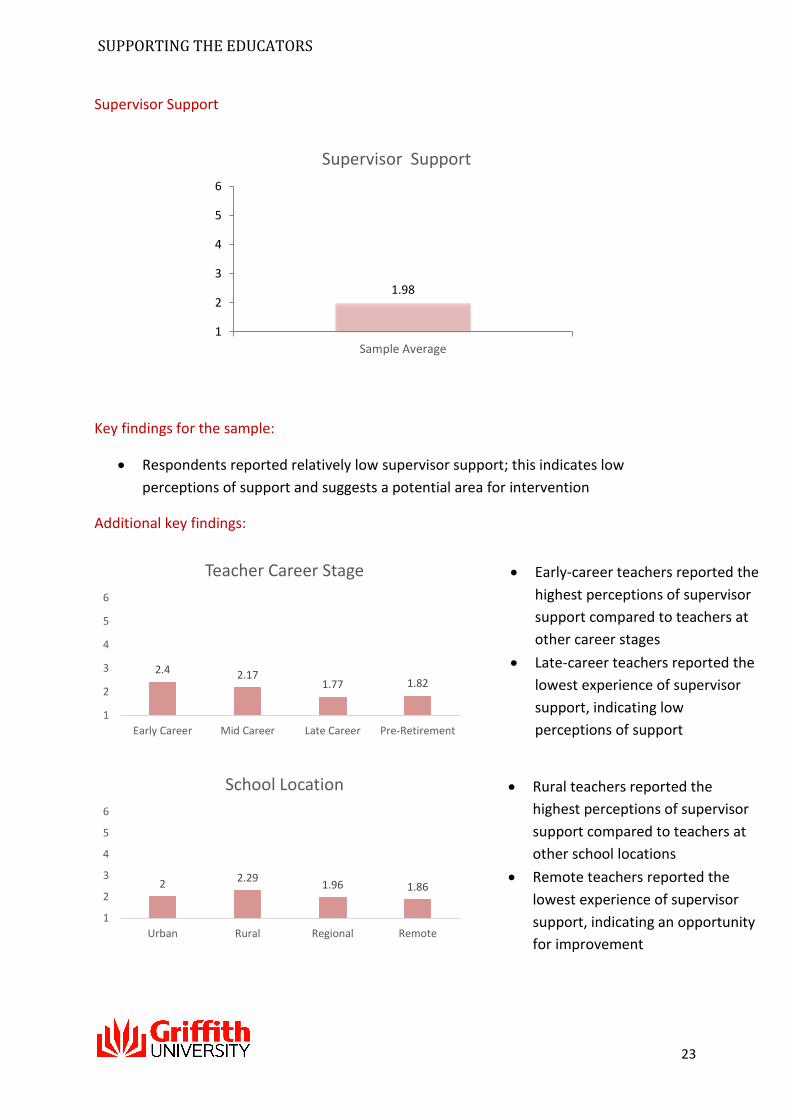
Supervisor Support
Key findings for the sample:
Respondents reported relatively low supervisor support; this indicates low
perceptions of support and suggests a potential area for intervention
Additional key findings:
1.98
1
2
3
4
5
6
Sample Average
Supervisor Support
2.4 2.171.77 1.82
1
2
3
4
5
6
Early Career Mid Career Late Career Pre-Retirement
Teacher Career Stage
22.29
1.96 1.86
1
2
3
4
5
6
Urban Rural Regional Remote
School Location
Early-career teachers reported the
highest perceptions of supervisor
support compared to teachers at
other career stages
Late-career teachers reported the
lowest experience of supervisor
support, indicating low
perceptions of support
Rural teachers reported the
highest perceptions of supervisor
support compared to teachers at
other school locations
Remote teachers reported the
lowest experience of supervisor
support, indicating an opportunity
for improvement

SUPPORTING THE EDUCATORS
24
Family/Friend Support
Key findings for the sample:
Respondents reported moderate perceptions of family/friend support
2 1.9 2.17 2.08
1
2
3
4
5
6
Prep Primary Middle Secondary
Teaching Year Level
2 22.37
2.03
1
2
3
4
5
6
Full time Part time Contract Supply
Job Status
2.95
1
2
3
4
5
6
Sample Average
Family/Friend Support
Middle-school teachers reported
the highest perceptions of
supervisor support compared to
teachers of other year levels
Primary teachers reported the
lowest experience of supervisor
support, indicating an opportunity
for improvement
Contract teachers reported the
highest perceptions of supervisor
support compared to teachers
with other types of job status
Both full time and part time
teachers reported the lowest
experience of supervisor support,
indicating an opportunity for
improvement
SUPPORTING THE EDUCATORS
25
Supply teachers reported the
highest perceptions of
family/friend support
compared to teachers at
different levels of job status
Contract teachers reported
slightly lower perceptions of
family/friend support
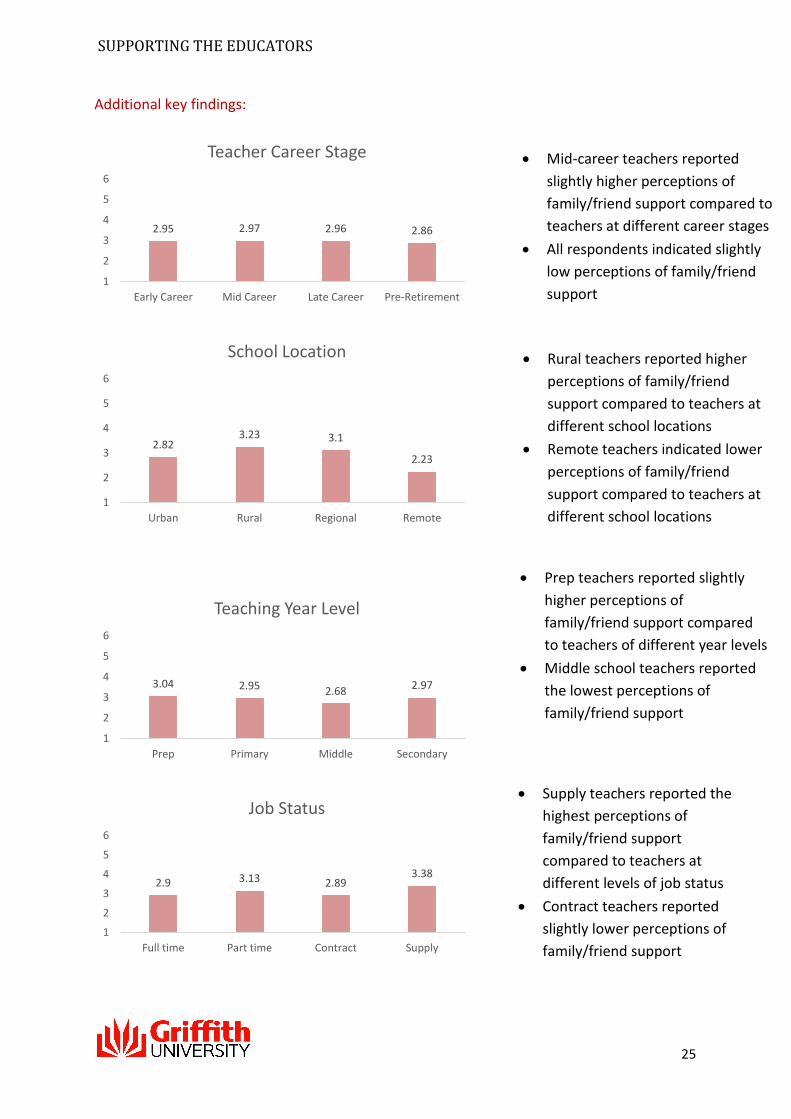
Additional key findings:
2.95 2.97 2.96 2.86
1
2
3
4
5
6
Early Career Mid Career Late Career Pre-Retirement
Teacher Career Stage
2.823.23 3.1
2.23
1
2
3
4
5
6
Urban Rural Regional Remote
School Location
3.04 2.95 2.68 2.97
1
2
3
4
5
6
Prep Primary Middle Secondary
Teaching Year Level
2.9 3.13 2.893.38
1
2
3
4
5
6
Full time Part time Contract Supply
Job Status
Mid-career teachers reported
slightly higher perceptions of
family/friend support compared to
teachers at different career stages
All respondents indicated slightly
low perceptions of family/friend
support
Rural teachers reported higher
perceptions of family/friend
support compared to teachers at
different school locations
Remote teachers indicated lower
perceptions of family/friend
support compared to teachers at
different school locations
Prep teachers reported slightly
higher perceptions of
family/friend support compared
to teachers of different year levels
Middle school teachers reported
the lowest perceptions of
family/friend support

SUPPORTING THE EDUCATORS
26
Job Control
Job control refers to the extent individuals perceive themselves to have control over how
they perform their job. Job control is important for employees as it may have stress-
buffering effects and reduce the detrimental effects of job demands.
Job control includes aspects of employee decision making and planning during everyday job
tasks. For the purposes of this research, job control has been reported as an overall
measure.
Respondents were asked to indicate the degree to which they perceive themselves to have
job control (10 questions). Responses ranged from 1 (not at all) to 5 (a great deal). Higher
scores indicate greater perceptions of job control. The sample average for job control is
presented in the graph below:
Key findings for this sample:
Respondents reported moderately high job control, indicating generally good
perceptions of job control within their role
3.5
1
2
3
4
5
Sample Average
Job Control
SUPPORTING THE EDUCATORS
27
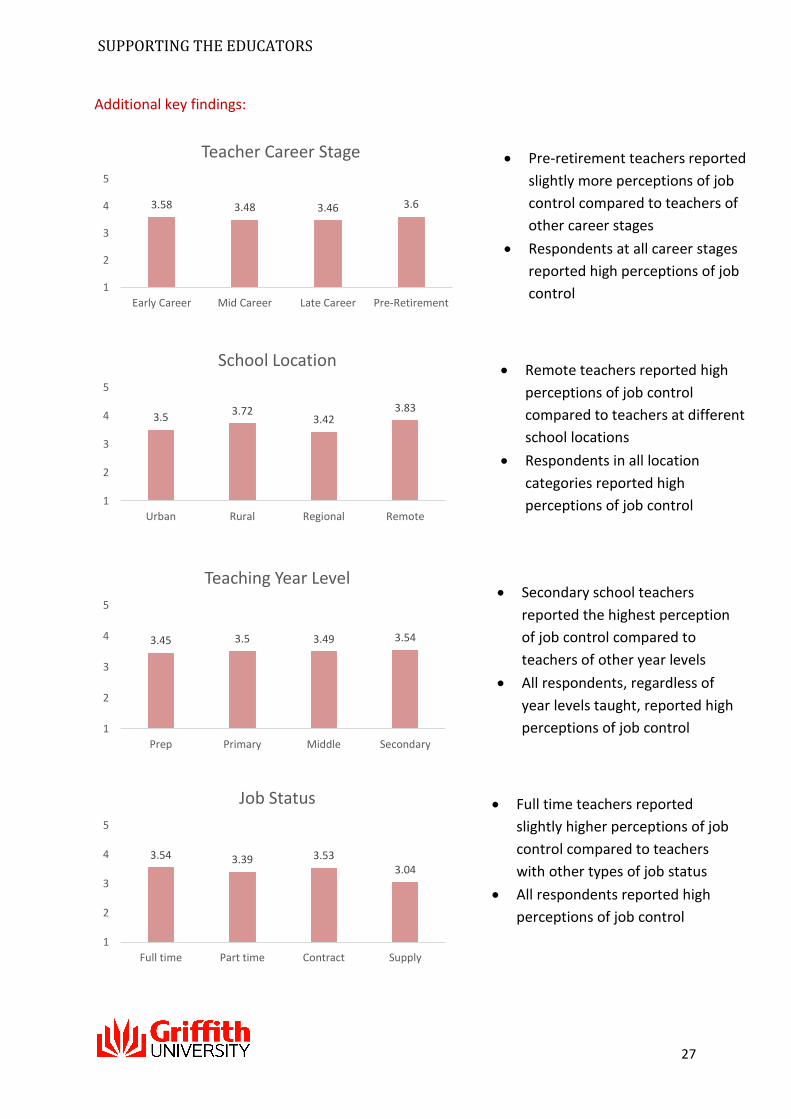
Additional key findings:
3.58 3.48 3.46 3.6
1
2
3
4
5
Early Career Mid Career Late Career Pre-Retirement
Teacher Career Stage
3.53.72
3.423.83
1
2
3
4
5
Urban Rural Regional Remote
School Location
3.45 3.5 3.49 3.54
1
2
3
4
5
Prep Primary Middle Secondary
Teaching Year Level
3.54 3.39 3.533.04
1
2
3
4
5
Full time Part time Contract Supply
Job Status
Pre-retirement teachers reported
slightly more perceptions of job
control compared to teachers of
other career stages
Respondents at all career stages
reported high perceptions of job
control
Remote teachers reported high
perceptions of job control
compared to teachers at different
school locations
Respondents in all location
categories reported high
perceptions of job control
Secondary school teachers
reported the highest perception
of job control compared to
teachers of other year levels
All respondents, regardless of
year levels taught, reported high
perceptions of job control
Full time teachers reported
slightly higher perceptions of job
control compared to teachers
with other types of job status
All respondents reported high
perceptions of job control
SUPPORTING THE EDUCATORS
28
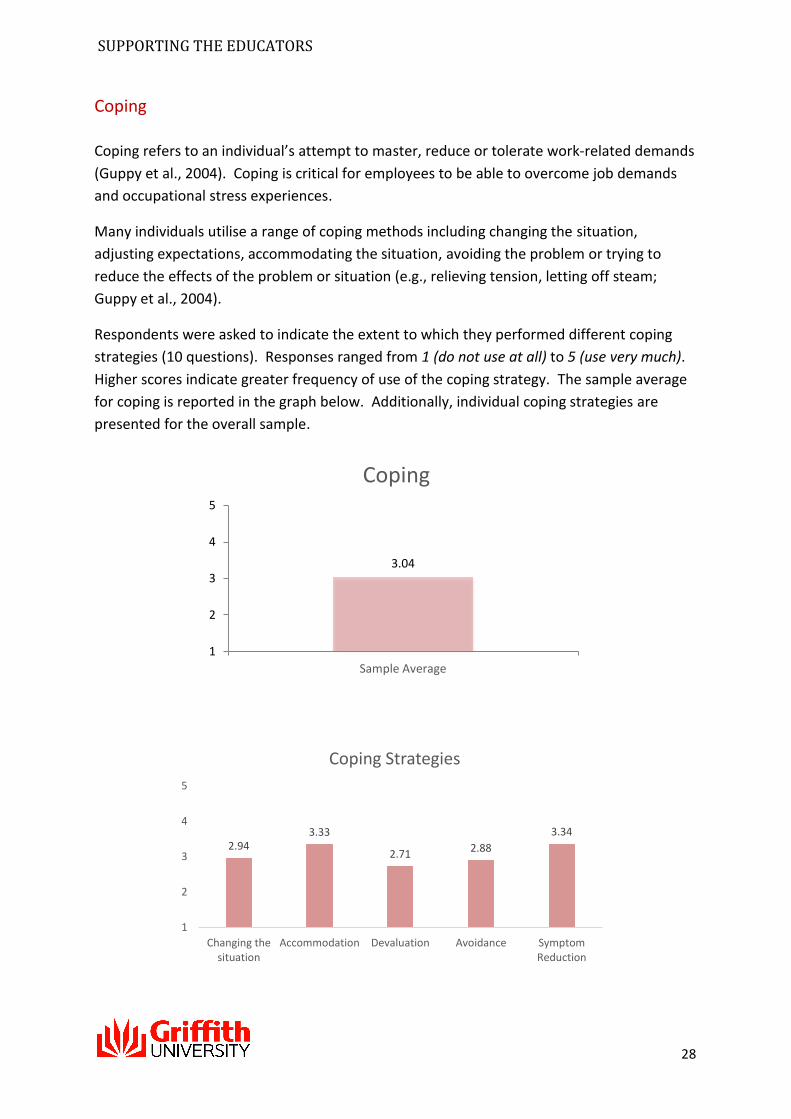
Coping
Coping refers to an individual’s attempt to master, reduce or tolerate work-related demands
(Guppy et al., 2004). Coping is critical for employees to be able to overcome job demands
and occupational stress experiences.
Many individuals utilise a range of coping methods including changing the situation,
adjusting expectations, accommodating the situation, avoiding the problem or trying to
reduce the effects of the problem or situation (e.g., relieving tension, letting off steam;
Guppy et al., 2004).
Respondents were asked to indicate the extent to which they performed different coping
strategies (10 questions). Responses ranged from 1 (do not use at all) to 5 (use very much).
Higher scores indicate greater frequency of use of the coping strategy. The sample average
for coping is reported in the graph below. Additionally, individual coping strategies are
presented for the overall sample.
3.04
1
2
3
4
5
Sample Average
Coping
2.943.33
2.712.88
3.34
1
2
3
4
5
Changing thesituation
Accommodation Devaluation Avoidance SymptomReduction
Coping Strategies
SUPPORTING THE EDUCATORS
29
Key findings for the sample:
Respondents reported moderate use of coping methods and strategies
Respondents indicated that they perform symptom reduction strategies slightly
more than accommodation strategies
Respondents indicated that they utilise more proactive coping strategies as opposed
to more maladaptive techniques such as avoidance
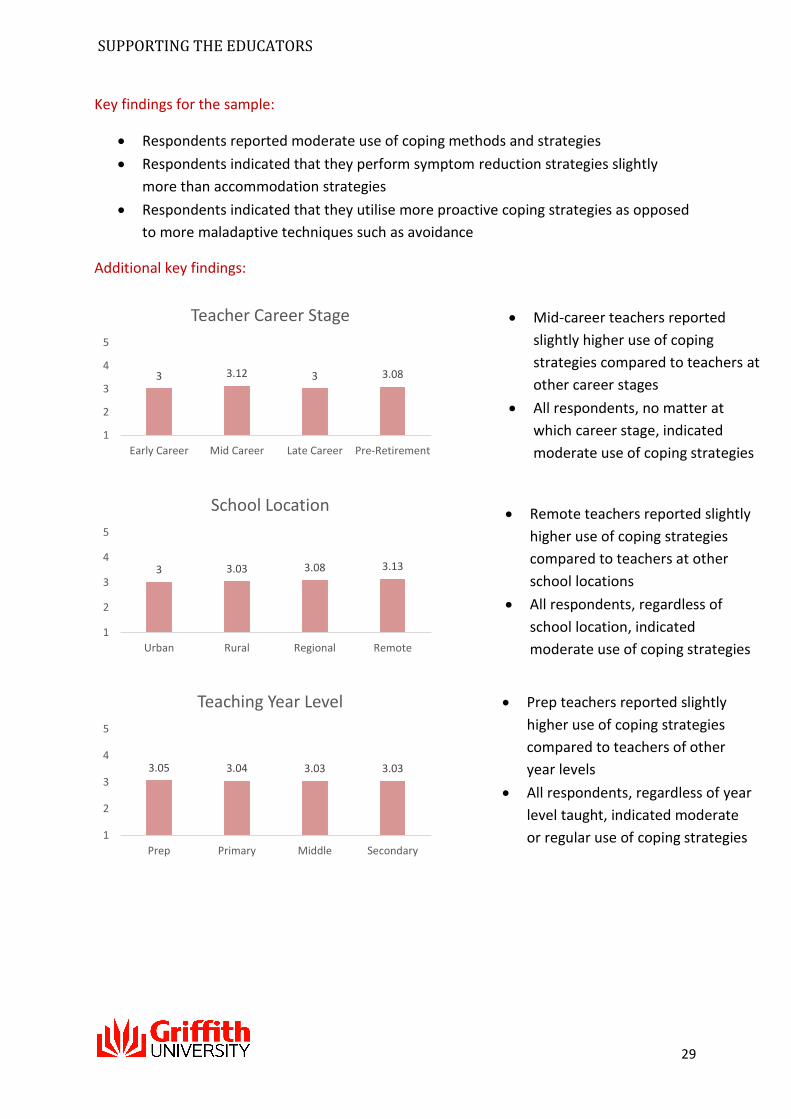
Additional key findings:
3 3.12 3 3.08
1
2
3
4
5
Early Career Mid Career Late Career Pre-Retirement
Teacher Career Stage
3 3.03 3.08 3.13
1
2
3
4
5
Urban Rural Regional Remote
School Location
3.05 3.04 3.03 3.03
1
2
3
4
5
Prep Primary Middle Secondary
Teaching Year Level
Mid-career teachers reported
slightly higher use of coping
strategies compared to teachers at
other career stages
All respondents, no matter at
which career stage, indicated
moderate use of coping strategies
Remote teachers reported slightly
higher use of coping strategies
compared to teachers at other
school locations
All respondents, regardless of
school location, indicated
moderate use of coping strategies
Prep teachers reported slightly
higher use of coping strategies
compared to teachers of other
year levels
All respondents, regardless of year
level taught, indicated moderate
or regular use of coping strategies
SUPPORTING THE EDUCATORS
30
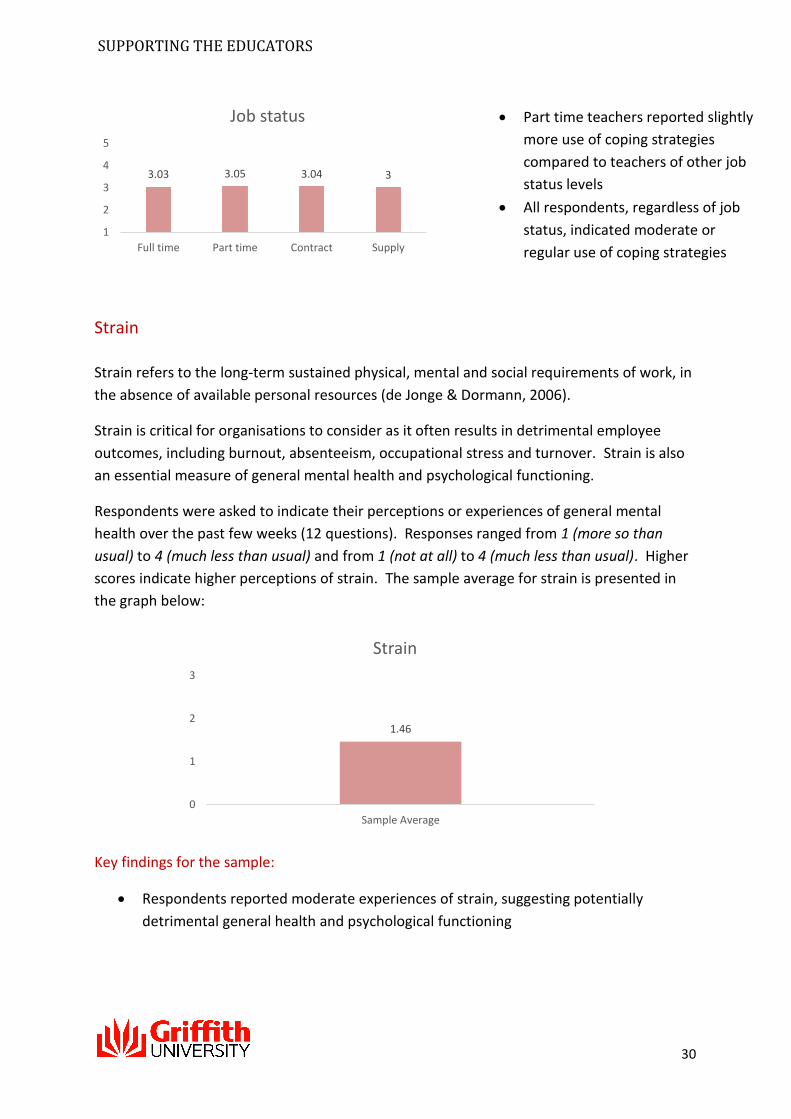
Strain
Strain refers to the long-term sustained physical, mental and social requirements of work, in
the absence of available personal resources (de Jonge & Dormann, 2006).
Strain is critical for organisations to consider as it often results in detrimental employee
outcomes, including burnout, absenteeism, occupational stress and turnover. Strain is also
an essential measure of general mental health and psychological functioning.
Respondents were asked to indicate their perceptions or experiences of general mental
health over the past few weeks (12 questions). Responses ranged from 1 (more so than
usual) to 4 (much less than usual) and from 1 (not at all) to 4 (much less than usual). Higher
scores indicate higher perceptions of strain. The sample average for strain is presented in
the graph below:
Key findings for the sample:
Respondents reported moderate experiences of strain, suggesting potentially
detrimental general health and psychological functioning
3.03 3.05 3.04 3
1
2
3
4
5
Full time Part time Contract Supply
Job status
1.46
0
1
2
3
Sample Average
Strain
Part time teachers reported slightly
more use of coping strategies
compared to teachers of other job
status levels
All respondents, regardless of job
status, indicated moderate or
regular use of coping strategies
SUPPORTING THE EDUCATORS
31
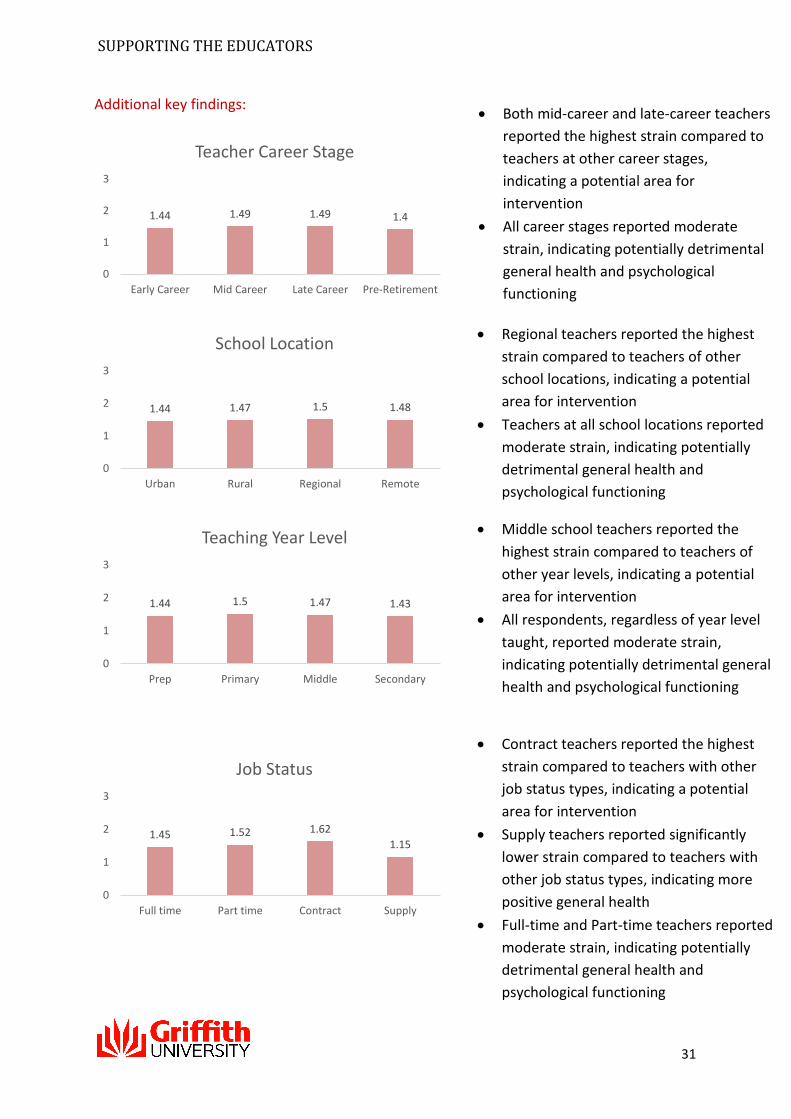
Additional key findings:
1.44 1.49 1.49 1.4
0
1
2
3
Early Career Mid Career Late Career Pre-Retirement
Teacher Career Stage
1.44 1.47 1.5 1.48
0
1
2
3
Urban Rural Regional Remote
School Location
1.44 1.5 1.47 1.43
0
1
2
3
Prep Primary Middle Secondary
Teaching Year Level
1.45 1.52 1.62
1.15
0
1
2
3
Full time Part time Contract Supply
Job Status
Both mid-career and late-career teachers
reported the highest strain compared to
teachers at other career stages,
indicating a potential area for
intervention
All career stages reported moderate
strain, indicating potentially detrimental
general health and psychological
functioning
Regional teachers reported the highest
strain compared to teachers of other
school locations, indicating a potential
area for intervention
Teachers at all school locations reported
moderate strain, indicating potentially
detrimental general health and
psychological functioning
Middle school teachers reported the
highest strain compared to teachers of
other year levels, indicating a potential
area for intervention
All respondents, regardless of year level
taught, reported moderate strain,
indicating potentially detrimental general
health and psychological functioning
Contract teachers reported the highest
strain compared to teachers with other
job status types, indicating a potential
area for intervention
Supply teachers reported significantly
lower strain compared to teachers with
other job status types, indicating more
positive general health
Full-time and Part-time teachers reported
moderate strain, indicating potentially
detrimental general health and
psychological functioning
SUPPORTING THE EDUCATORS
32
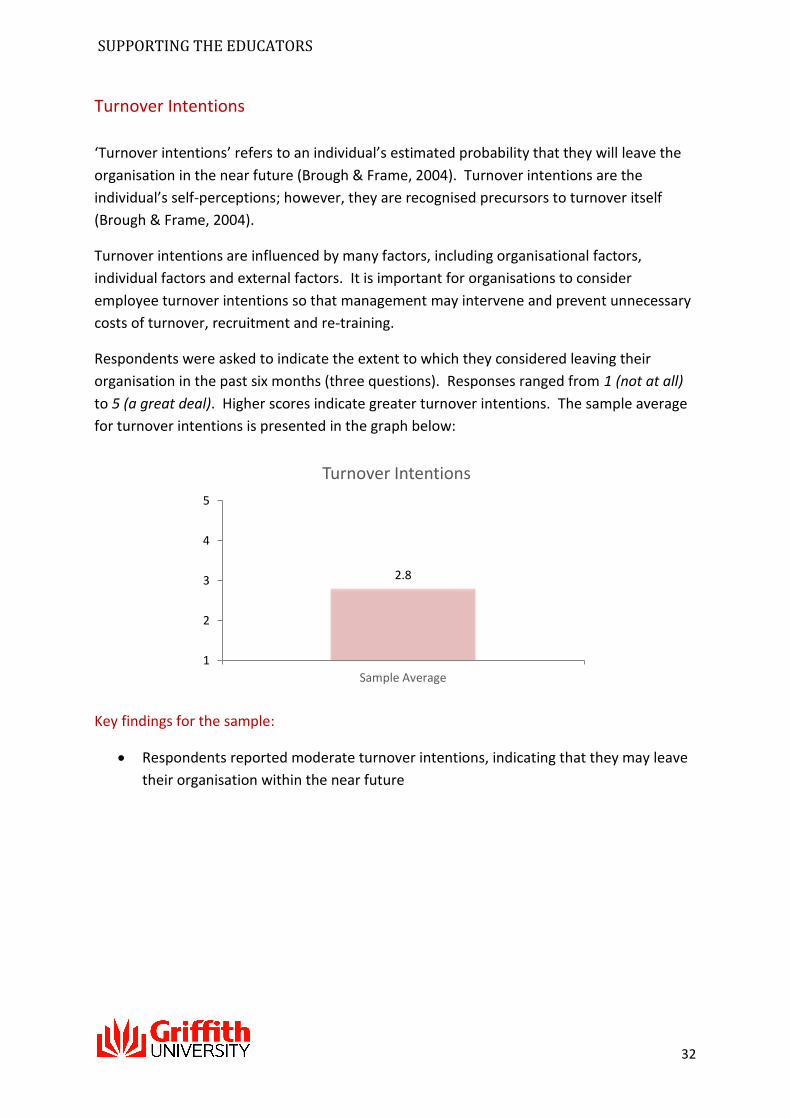
Turnover Intentions
‘Turnover intentions’ refers to an individual’s estimated probability that they will leave the
organisation in the near future (Brough & Frame, 2004). Turnover intentions are the
individual’s self-perceptions; however, they are recognised precursors to turnover itself
(Brough & Frame, 2004).
Turnover intentions are influenced by many factors, including organisational factors,
individual factors and external factors. It is important for organisations to consider
employee turnover intentions so that management may intervene and prevent unnecessary
costs of turnover, recruitment and re-training.
Respondents were asked to indicate the extent to which they considered leaving their
organisation in the past six months (three questions). Responses ranged from 1 (not at all)
to 5 (a great deal). Higher scores indicate greater turnover intentions. The sample average
for turnover intentions is presented in the graph below:
Key findings for the sample:
Respondents reported moderate turnover intentions, indicating that they may leave
their organisation within the near future
2.8
1
2
3
4
5
Sample Average
Turnover Intentions
SUPPORTING THE EDUCATORS
33
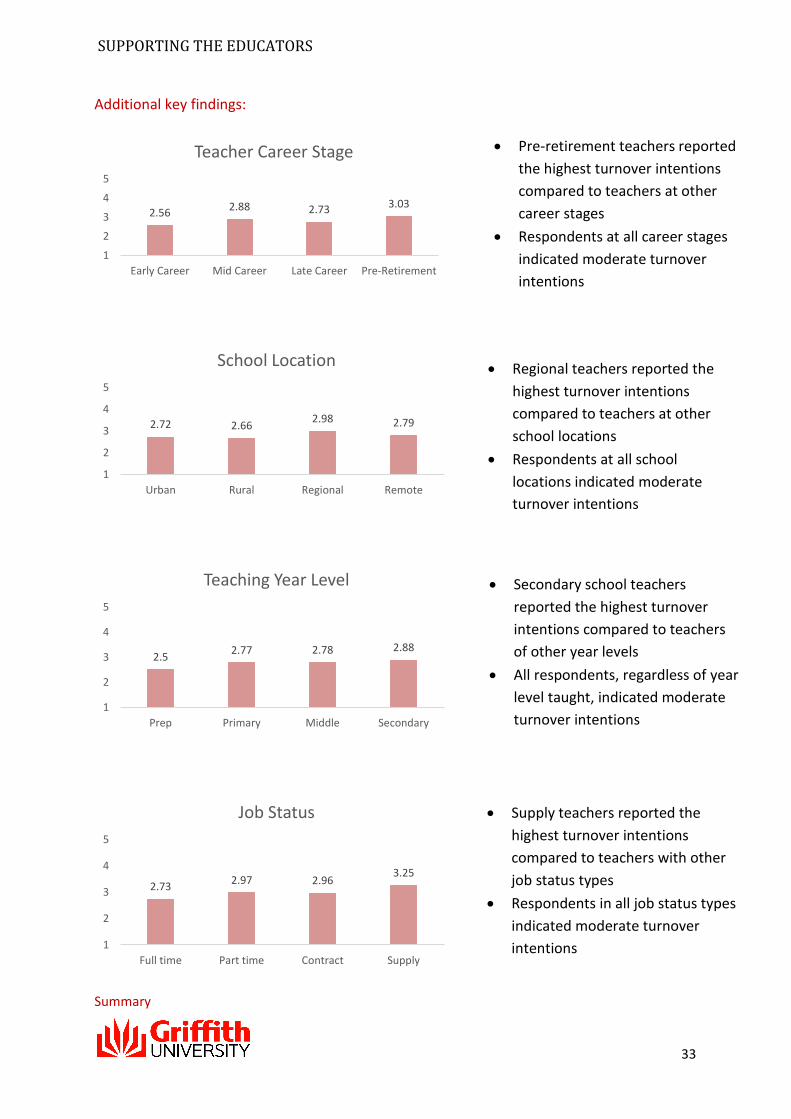
Additional key findings:
Summary
2.562.88 2.73 3.03
1
2
3
4
5
Early Career Mid Career Late Career Pre-Retirement
Teacher Career Stage
2.72 2.662.98 2.79
1
2
3
4
5
Urban Rural Regional Remote
School Location
2.52.77 2.78 2.88
1
2
3
4
5
Prep Primary Middle Secondary
Teaching Year Level
2.732.97 2.96
3.25
1
2
3
4
5
Full time Part time Contract Supply
Job Status
Pre-retirement teachers reported
the highest turnover intentions
compared to teachers at other
career stages
Respondents at all career stages
indicated moderate turnover
intentions
Regional teachers reported the
highest turnover intentions
compared to teachers at other
school locations
Respondents at all school
locations indicated moderate
turnover intentions
Secondary school teachers
reported the highest turnover
intentions compared to teachers
of other year levels
All respondents, regardless of year
level taught, indicated moderate
turnover intentions
Supply teachers reported the
highest turnover intentions
compared to teachers with other
job status types
Respondents in all job status types
indicated moderate turnover
intentions

SUPPORTING THE EDUCATORS
34
The current project sought to identify current work experiences of teachers within different
career stages. The results of this project have informed the recommendations we present
here for consideration by relevant employers and other teaching organisations.
The results of this project indicate that on average, teachers are generally satisfied with
their jobs; report relatively few bullying experiences, high colleague support, and high job
control; utilise more proactive coping strategies; and experience relatively low strain.
However, on average, teachers also reported poor work-life balance, high perceptions of
task stress, excessive technological demands within the classroom, detrimental workload
management techniques, relatively high role demands and low supervisor support.
Furthermore, the results of the survey support findings identified from interviews conducted
in July 2015 and previous literature on teacher workload management and task stress
(Timms et al., 2007). It is apparent that administrative duties (task stress) produce the most
demands and often force teachers to utilise detrimental workload management techniques
(working late or on weekends) to stay on top of paperwork and other administrative duties.
Additionally, as suggested by respondents, the use of detrimental workload management
techniques may also be contributing to poor perceptions of work-life balance and of
supervisor support. As a result, teachers have reported moderate strain and turnover
intentions.
Lastly, as teachers also reported general job satisfaction, it may suggest they are intrinsically
motivated by their career and job role (further supported by additional research findings,
see Timms & Brough, 2013). Therefore, teachers may be inherently driven to perform their
role and this may indicate that turnover intentions could be reduced by providing additional
support in the required work areas.
Please see recommendations for improving support practices and teacher development
opportunities below.

SUPPORTING THE EDUCATORS
35
Recommendations of this Research
1. Improving work-life balance
Work-life balance was identified as an area for improvement for the overall sample.
Teachers in mid-career, teachers in remote locations, prep teachers and full time teachers
reported the lowest work-life balance. It is therefore recommended that employers of
teachers encourage schools to support improved work-life balance policy and practices for
their teachers.
This may include helping to disseminate information to teachers on training or workshops
on how to effectively manage workload, and/or on looking after themselves in non-work
hours (e.g., self-care training, fitness training or relaxation techniques).
Improving teacher work-life balance also provides opportunities for teachers to decrease
experiences of task stress and detrimental workload management. Furthermore, an
increase in perceived work-life balance may also decrease turnover intentions.
2. Increasing support for use of technology at work
Technology at work is an inevitable aspect of modern society and occupational settings.
However, teachers indicated that they perceive the use of technology as an additional
demand at work.
In particular, pre-retirement teachers, rural teachers, prep teachers and supply teachers
reported the highest experiences of technology demands at work. Therefore, it is
recommended that employers of teachers target support for teachers in coping with
technology demands to these groups.
Identified areas where support may be improved include providing teachers with
information about specialised training in classroom learning technologies (e.g., different
programs, platforms), about teacher friendly technologies to reduce task stress (e.g., apps
that reduce marking times, automatic reporting systems) and about incorporating
technology more effectively into work schedules.
Improving how teachers use technology at work also allows additional support for reducing
task stress and improving workload management. Additionally, if teachers have the skills to
effectively utilise technology it may also improve their own well-being and subsequently
improve overall student learning.
SUPPORTING THE EDUCATORS
36
3. Improving how teachers experience multiple role demands
Educational settings are now seeing an expansion of teacher roles, where societal,
organisational and parental expectations have produced additional role demands beyond
the traditional teaching role.
Teachers are now experiencing an increase in the diversity of their occupational roles, where
they reported performing additional roles such as parent (acting as disciplinarian), nurse
(acting as medical caregiver) and administrator. In particular, administrator, counsellor and
manager were the three highest-reported role demands.
It is recommended that employers of teachers consider providing support for teachers on
how they perceive their role demands. This may include information on targeted training or
workshops around managing competing roles.
Although teacher experiences of multiple role demands may never cease, occupational
stress and turnover intentions may be reduced by improving how they are supported in
their experiences.
4. Improving supervisor support
It is widely acknowledged that support has stress-buffering effects. However, although
teachers reported high colleague and family/friend support, supervisor support was
reported to be relatively low.
In particular, early-career, rural, middle-school and contract teachers reported the lowest
perceptions of supervisor support. Therefore, it is recommended that employers of
teachers target any actions to these groups. Employers of teachers could, for example,
provide information to supervisors in such situations on how to better recognise and
support teachers they supervise.
Support from supervisors is a critical component of work. Improving how such support is
perceived by teachers may further increase their satisfaction and additionally reduce
experiences of stress and turnover intentions.
The research team acknowledges that QCT only has a limited capacity to action the above recommendations
within the teaching environment due to their statutory roles and functions. However, advocacy of the above
recommendations will still have an impact on teachers and the overall teaching environment.

SUPPORTING THE EDUCATORS
37
Additional Comments
At the end of the survey, each respondent was given the option to provide additional,
general comments about their experiences in the teaching profession. In total, 246
comments were made.
An analysis of these comments revealed five key themes, illustrated in the graph below. A
sixth, miscellaneous, category was also identified, including comments that were survey-
related (e.g., phrasing of questions) and as such will not be discussed in further detail in this
report.
All comments provided by respondents have been de-identified and provided to QCT and
QIEU in a separate document.
1. Workplace stressors
A total of 132 comments were provided by respondents that made reference to perceived
stressors in the workplace. Some of the key stressors as identified in these comments were:
additional work demands, administration, data collection and student behaviour. Some
example comments include:
“The fact students are so widely varied in achievement levels and often have multiple
learning needs is putting undue stress on the job.”
“Teachers are being made to do jobs outside their teaching profession. This is eroding on
curriculum time and creating stress.”
“Too much admin not enough teaching.”
0 20 40 60 80 100 120 140
Workplace Stressors
Work-life Balance and Teacher Welfare
Support and Leadership
Workload
Performance, remuneration andopportunities for development
Frequency of themes in survey comments
SUPPORTING THE EDUCATORS
38
“I love teaching but way too much focus on collecting data. It is not useful data - just done
for the sake of collecting data.”
“Parents are becoming more and more demanding and have less and less respect for
teachers.”
“Student attitudes, behaviour and treatment of teachers are having a significant impact on
enjoyment and satisfaction in this job.”
“Teaching can be the best job in the world, if we could only concentrate on doing just that!”
2. Work-life balance and teacher welfare
A total of 27 comments highlighted concerns around work-life balance and welfare of
teachers. Some example comments include:
“Technology places high time demands on teachers. It is more difficult to have a good
work/life balance now as compared with 15 years ago.”
“My current state of mental health is not related to stress at work. I find that work makes
me feel worthwhile.”
“I love teaching so much, it is my vocation! The stress levels and expectations on us seem to
go up every year and I feel that my health is being affected due to the high stress levels
experienced.”
3. Support and leadership
The importance of support and positive leadership was highlighted in 27 comments,
examples of which include:
“I see talented teachers question themselves about staying in the profession every day
because of the unrelenting pressure and the failure of our principal to even conceive that it is
time to do things differently and to listen to staff.”
“All of my close colleagues and I hate the job, feeling under pressure from student
behaviours, and unsupported by our superiors.”
“With a supportive staff and colleagues that care, much more is achievable. It becomes a
joint effort not a competition.”
SUPPORTING THE EDUCATORS
39
4. Workload
Concerns were raised around workload in 22 comments. Example comments include:
“It’s the job that never ends.”
“Work expectations are ever increasing.”
“Mostly enjoyed as a very rewarding career, but it can be extremely disheartening when
stress builds due to extremely high workload.”
5. Performance, remuneration and opportunities for development
A total of 18 comments referred to concerns around teacher performance, perceptions of
remuneration and opportunities for development. Example comments include:
“The union needs to stop protecting poor performing teachers. It places too much of a
burden on colleagues having to pick up the slack.”
“The promotional system seems to be favouring administrators (not leaders) who are more
interested in appearances, spin, data and self-advancement rather than substance, quality or
leadership.”
“…I think it is very easy to say teachers are more stressed than other professions - but I think
it is because the financial rewards for the job and the thanks and prestige people afford the
teaching profession are terribly low. Society in general should value teachers a lot more than
they do. I think teachers are often not seen as being professional which is a real shame.”
SUPPORTING THE EDUCATORS
40
References
Bakker, A., Demerouti, E., & Euwema, M. (2005). Job Resources Buffer the Impact of Job
Demands on Burnout. Journal of Occupational Health Psychology, 10(2), 170-180. doi:
10.1037/1076-8998.10.2.170
Brough, P., & Frame, R. (2004). Predicting police job satisfaction and turnover intentions: the
role of social support and police organisational variables. New Zealand Journal of
Psychology, 33(1), 8-16. Retrieved from http://www.psychology.org.nz
Brough, P., Timms, C., O’Driscoll, M. P., Kalliath, T., Siu, O., Sit, C., & Lo, D. (2014). Work-life
balance: A longitudinal evaluation of a new measure across Australia and New Zealand
workers. The International Journal of Human Resource Management, 25(19), 2724-2744.
doi:10.1080/09585192.2014.899262
Cobb, S. (1976). Social support as moderator of life stress. Psychosomatic Medicine, 38, 300-
314. Retrieved from http://journals.lww.com/psychosomaticmedicine
de Jonge, J., & Dormann, C. (2006). Stressors, Resources, and Strain at Work: A Longitudinal
Test of the Triple-Match Principle. Journal of Applied Psychology, 91(5), 1359-1374. doi:
10.1037/0021-9010.91.5.1359
Guppy, A., Edwards, J. A., Brough, P., Peters-Bean, K. M., Sale, C., & Shorts, E. (2004). The
psychometric properties of the short version of the cybernetic coping scale: A multi-group
confirmatory factor analysis across four samples. Journal of Occupational and Organizational
Psychology, 77(1), 39.
Schutz, R. W., & Long, B. C. (1988). Confirmatory factor analysis, validation and revision of a
teacher stress inventory. Educational and Psychological Measurement, 48(2), 497-511.
doi:10.1177/0013164488482025
Timms, C., & Brough, P. (2013). “I like being a teacher” Career satisfaction, the work
environment and work engagement. Journal of Educational Administration, 51(6), 768-789.
doi: 10.1108/JEA-06-2012-0072
Timms, C., Graham, D., & Cottrell, D. (2007). “I just want to teach” Queensland independent
school teachers and their workload. Journal of Educational Administration, 45(5), 569-586.
doi: 10.1108/09578230710778204
Warr, P., Cook, J. D., & Wall, T. D. (1979). Scales for the measurement of work attitudes and
psychological well-being. Journal of Occupational and Organizational Psychology, 58, 129–
148. doi:10.1111/j.2044-8325.1979.tb00448.x