Segregation, Discrimination & Culture Life During the Gilded Age.

Economics and REsEaRch dEpaRtmEnt
Printed in the Philippines
occupational segregation and Gender discrimination in Labor markets: thailand and Viet nam
Hyun H. Son
November 2007
about the paper
Hyun H. Son writes develops a decomposition methodology to explain the welfare disparity between male and female workers in terms of three components: segregation, discrimination, and inequality. Based on Atkinson’s welfare function, the proposed decomposition methodology takes into account the sensitivity of inequality within occupational groups and also by gender. The proposed methodologies are applied to Thailand and Viet Nam.
Asian Development Bank6 ADB Avenue, Mandaluyong City1550 Metro Manila, Philippineswww.adb.org/economicsISSN: 1655-5252Publication Stock No.
about the asian development Bank
ADB aims to improve the welfare of the people in the Asia and Pacific region, particularly the nearly 1.9 billion who live on less than $2 a day. Despite many success stories, the region remains home to two thirds of the world’s poor. ADB is a multilateral development finance institution owned by 67 members, 48 from the region and 19 from other parts of the globe. ADB’s vision is a region free of poverty. Its mission is to help its developing member countries reduce poverty and improve their quality of life.
ADB’s main instruments for helping its developing member countries are policy dialogue, loans, equity investments, guarantees, grants, and technical assistance. ADB’s annual lending volume is typically about $6 billion, with technical assistance usually totaling about $180 million a year.
ADB’s headquarters is in Manila. It has 26 offices around the world and more than 2,000 employees from over 50 countries.
ERD WoRking PaPER SERiES no. 108


ERD Working Paper No. 108
OccupatiOnal SegregatiOn and gender diScriminatiOn in labOr marketS:
thailand and Viet nam
hyun h. SOn
nOVember 2007
Hyun H. Son is Economist in the Economic Analysis and Operations Support Division, Economics and Research Department, Asian Development Bank.

Asian Development Bank6 ADB Avenue, Mandaluyong City1550 Metro Manila, Philippineswww.adb.org/economics
©2007 by Asian Development BankNovember 2007ISSN 1655-5252
The views expressed in this paperare those of the author(s) and do notnecessarily reflect the views or policiesof the Asian Development Bank.
FoREWoRD
The ERD Working Paper Series is a forum for ongoing and recently completed research and policy studies undertaken in the Asian Development Bank or on its behalf. The Series is a quick-disseminating, informal publication meant to stimulate discussion and elicit feedback. Papers published under this Series could subsequently be revised for publication as articles in professional journals or chapters in books.


CoNtENts
Abstract vii
I. Introduction 1
II. Social WelfareII. Social Welfare 2
III. Decomposition Methodology�� Segregation, Discrimination,and InequalityIII. Decomposition Methodology�� Segregation, Discrimination,and Inequality 4
I�. Adjusting Welfare by Individual CharacteristicsI�. Adjusting Welfare by Individual Characteristics 6
�. Net Effect of Individual Characteristics on �ender Welfare Disparity�. Net Effect of Individual Characteristics on �ender Welfare Disparity 6
�I. Empirical Analysis�I. Empirical Analysis 7
A. Data DescriptionA. Data Description 7 B. Data Results�� Decomposition Analysis 7 C. Data Results�� Analyzing Net Effects of Individual Attributes based on Shapley Decomposition 10 D. Unexplained Factors for �ender Disparity 12
�II. Conclusions 1�II. Conclusions 13
Appendix 1Appendix 15 References 21


AbstRACt
This study develops a decomposition methodology to explain the welfare disparity between male and female workers in terms of three components�� segregation, discrimination, and inequality. While segregation captures occupational segregation by gender, discrimination measures the earning differential between males and females within occupations. The inequality component shows the inequality in earnings within male and female groups�� if this component is positive (negative), the earning inequality is greater (smaller) among females than males. Based on Atkinson’s welfare function, the proposed decomposition methodology takes into account the sensitivity of inequality within occupational groups and also by gender. Moreover, the study proposes a new approach to adjusting earnings by a host of personal and job characteristics such as hours of work, education, work experience, race, and regions and urban/rural areas. The paper also attempts to capture the net effect of each of these individual characteristics on segregation, discrimination, and inequality in earnings between male and female workers. The proposed methodologies are applied to Thailand and �iet Nam.


I. INtRoDuCtIoN
The afflicted world in which we live is characterized by deeply unequal sharing of the burden of adversities between women and men. �ender inequality exists in most parts of the world, from Japan to Morocco, from Uzbekistan to the United States of America. However, inequality between women and men can take many different forms. Of the different kinds of disparity, this study deals with the inequality in earnings in the labor market.1 In addition, this study also helps to understand gender issues related to the labor market that are important dimensions of promoting broad-based or inclusive growth (Behrman and Zhang 1995).
The gender pay gap exists universally but its size might vary from one country to another. The objective of this study is to analyze the earnings disparity between male and female workers in labor market. Disparity in male–female earnings can be explained in terms of individual characteristics, occupational segregation, and gender discrimination in the labor market. Many studies have attempted to capture the earnings disparity between males and females in terms of the degree of occupational segregation and gender discrimination that exists in the labor market. Of many, Oaxaca (1973) proposed a decomposition methodology that explains the wage gap between males and females in terms of two components. One component shows the difference due to observable male and female characteristics. The other component captures the difference in earnings’ generating function and is sometimes interpreted as a measure of discrimination. Since the pioneering paper by Oaxaca (1973), there have been a number of studies that look into the gender differential in earnings. Prominent studies in this area include��2 Cotton (1988), which analyzed costs and benefit analysis of discrimination; Neumark (1988), which proposed an alternative procedure from a particular Beckerian discrimination model; and Oaxaca and Ransom (1988 and 1994), which proposed a procedure to estimate the nondiscriminatory wage structure in analyzing union/nonunion wage differentials.
This study proposes a decomposition methodology to explain the welfare disparity between male and female workers in terms of occupational segregation by gender, discrimination within occupation, and inequality in earnings. Based on Atkinson’s welfare function, the proposed decomposition method takes into account the sensitivity of inequality within occupational groups as well as between male and female workers.3 This enables the investigation of the extent of gender disparity in welfare and earnings that will differ between the not-so-poor and the ultra-poor.
1 Sen (2001) argues that gender inequality is not one homogeneous phenomenon, but a collection of disparate andSen (2001) argues that gender inequality is not one homogeneous phenomenon, but a collection of disparate and interlinked problems. He discusses different types of disparity including mortality inequality, natality inequality, basic facility inequality, special opportunity inequality, professional inequality, ownership inequality, and household inequality.
2 In this area, there are also studies by Blinder (1973) and Deutsch and Silber (2003). While Blinder takes a similarIn this area, there are also studies by Blinder (1973) and Deutsch and Silber (2003). While Blinder takes a similar framework of analysis to Oaxaca, Deutsch and Silber provide an extension of Oaxaca’s approach. The method proposed by Deutsch and Silber is based on two techniques�� (i) the breakdown of inequality by population subgroups; and (ii) Mincerian earnings functions to derive a decomposition of wage disparity into differences in human capital, differences in rates of return, and differences in unobservable characteristics.
3 Although we have used Atkinson’s welfare function to derive an inequality component for this study, other welfareAlthough we have used Atkinson’s welfare function to derive an inequality component for this study, other welfare functions and hence other inequality measures may be also used.

� November 2007
occupatioNal SegregatioN aNd geNder diScrimiNatioN iN labor marketS: thailaNd aNd viet NamhyuN h. SoN
This study also proposes an approach to adjusting per capita earnings by a host of personal and job characteristics, which are generally considered as major controlling factors in determining individual earnings in labor market. These factors include, among others, years of education, weekly hours worked, work experience, race, and geographical location. This adjustment differs from a Mincerian type of earnings regression. Moreover, this study attempts to isolate the net impact of each of those controlling factors on segregation, discrimination, and inequality in earnings. This is carried out using the so-called Shapley decomposition (Shapley 1953), which looks at all possible elimination sequences.
This study is organized in the following manner�� Section II delineates a welfare measure that captures the disparity in earning. Section III derives a new decomposition methodology that explains gender welfare disparity in terms of segregation, discrimination, and inequality in earnings. Section I� describes a new method to adjust welfare by a host of personal and job characteristics. Section � looks into capturing the net impact of the personal and job characteristics on the gender welfare disparity. Section �I is devoted to empirical analysis on the two labor markets, including Thailand and �iet Nam; and Section �II concludes.
II. soCIAl WElFARE
To derive a welfare measure, it is assumed that social welfare is the sum of individual utilities that are functions of their respective incomes, and that every individual has the same utility function. The social welfare function based on these assumptions will be additive, separable, and symmetric.
Suppose x is the labor market earning of an individual. It is assumed that x is a random variable with probability density function f(x). If u(x) is the individual utility function, which is increasing in x, i.e., u’(x) > 0, and concave, i.e., u’’(x) < 0, then the average welfare of society is defined as
W u x f x dx= ( ) ( )∞
∫0
Atkinson (1970) proposed a welfare measure that is invariant with respect to any positive linear transformation of individual utilities. It is derived from the concept of the equally distributed equivalent level of income, x*, which, if received by every individual, would result in the same level of social welfare as the present distribution, that is,
u(x*) = u x f x dx( ) ( )∞
∫0
(1)
where x* is the per person welfare measure of society and is a measure of social welfare in terms of income.
The inequality measure proposed by Atkinson is
A = 1 – x*
µ (2)
where µ given by
µ = xf x dx( )∞
∫0
(3)

SectioN iiSocial Welfare
erd WorkiNg paper SerieS No. 108 �
is the mean income of the society. Using (2), the social welfare x* can be written as
x* = µ 1 −( )A (4)
which shows that the social welfare x* depends on two factors, mean income and inequality in the society.
If the inequality measure A is to be scale-independent, the utility function must be homothetic. A class of homothetic utility functions is given by
u(x) = a bε
ε+
−
−x1
1 , ε ≠ 1
= a b+ ( )ln x , ε = 1 (5)
where b > 0 and a and b are any two constants. Note that ε is a measure of the degree of inequality aversion. As ε rises, greater weight is given to transfers at the lower end of income distribution and less weight to transfers at the top. If ε = 0, it reflects an inequality-neutral attitude, in which case social welfare is measured by the mean income of society. The larger the value of ε , the greater is the concern of society about inequality. When ε approaches infinity, the society becomes most concerned about the poorest person. In this case, social welfare is measured by the income of the poorest person in society. Thus, ε is a measure of society’s concern about inequality, which is generally not estimated from the data. This study assumes two alternative values of ε, 1 and 2.
Substituting (5) into (1) gives the average welfare level of society as
x* = x f x dx1
0
11
−∞ −
∫
εε
( )( )
ε ≠ 1
= exp ln x f x dx( ) ( )
∞
∫0 ε = 1 (6)
where exp stands for exponential. Note that x* is independent of A and B, which implies that the social welfare measure x* is invariant to any positive linear transformation of utility function. The social welfare measure x* can be defined for males in the society��
x x f x dxm m* = ( )
−∞ −
∫ 1
0
11
εε ε ≠ 1
= ( ) ( )
∞
∫exp ln x0
f x dxm
ε = 1 (7)
where fm(x) is the density function for males. Similarly, the social welfare function for females can be defined as��
x x f x dxf f* = ( )
−∞ −
∫ 1
0
11
εε ε ≠ 1

� November 2007
occupatioNal SegregatioN aNd geNder diScrimiNatioN iN labor marketS: thailaNd aNd viet NamhyuN h. SoN
= ( ) ( )
∞
∫exp ln x0
f x dxf
ε = 1 (8)where ff (x) is the density function for female.
Substituting x* into (2) gives Atkinson’s measure of inequality for different values of the aversion parameter ε. Thus, Atkinson’s inequality measure among males and females can be written as��
Ax
mm
m
= −1*
µ
and
Ax
ff
f
= −1*
µ (9)
where µm and µf are the mean earnings of male and female workers, respectively.
III. DEComPosItIoN mEthoDology: sEgREgAtIoN, DIsCRImINAtIoN, AND INEquAlIty
This study defines an index of welfare disparity between males and females as
π = × ( ) − ( )
100 ln ln* *x xm f (10)
which is the welfare of male workers over female workers, expressed in percentage. If, for instance π = 110, this implies that male workers enjoy 10% greater welfare compared to female workers. Utilizing (9) into (10), one can write
π µ µ= × ( ) − ( ) + × −( ) − −( ) 100 100 1 1ln ln ln lnm f m fA A (11)
where the first term in (11) measures the disparity in the mean earnings of males and females and the second term measures the disparity that is caused by the inequality in earnings between males and females. If the second term is positive (negative), this implies that inequality in earnings is greater (less) within the female group than within the male group.
The first term in (11) can be further decomposed into two components, i.e., occupational segregation and labor market discrimination (within occupation). Suppose there are k mutually exclusive occupations or industries in an economy. The ith occupation has Fi female labor force and Mi male labor force such that F Fii
k
=∑ =1
and M Mii
k ==∑ 1, where F and M are the total number
of female and male workers in the economy, respectively.
Let us define δ fi = Fi / F and δmi = Mi / M , where δ fi and δmi refer to the proportion of
female and male workers in occupation i. Then δ fii
k ==∑ 11
and δmii
k ==∑ 11 must always hold. The
mean male and female earnings can be written as
µ δ µm mi mii
k
==∑
1

SectioN iiidecompoSitioN methodology: SegregatioN, diScrimiNatioN,
aNd iNequality
erd WorkiNg paper SerieS No. 108 �
and
µ δ µf fi fii
k
==∑
1
where µmi is the mean earnings of males in the ith occupation and similarly, µfi is the mean earnings of females in the ith occupation. The difference between µmi and µfi indicates the gender discrimination in the ith occupation, whereas the difference between δmi and δfi captures the gender segregation in the ith occupation. We can aggregate the discrimination and segregation over all occupations in order to obtain overall measures of discrimination and segregation in the labor market. This is done by using the Shapley decomposition, which is as follows��
100 1001 1
× ( ) − ( ) = ×
−
= =∑ln ln ln lnµ µ δ µ δ µm f fi mii
k
fi fii
k
∑∑ ∑ ∑
+
−
= =
ln lnδ µ δ µmi mii
k
mi fii
k
1 1
+ ×
−
+
= = =∑ ∑ ∑100
1 1 1
ln ln lnδ µ δ µ δ µmi fii
k
fi fii
k
mi mii
k
−
=
∑ln δ µfi mii
k
1 (12)
where the first term in the right-hand side of (12) measures the contribution of differences in the mean earnings of males and females in different occupations to the total disparity in the mean earnings. This term is an overall measure of discrimination in the labor market.4 On the other hand, the second term in the right-hand side of (12) measures the contribution of differences in the proportion of male and female workers in different occupations, which is an overall measure of occupational segregation by gender. Thus, combining (11) and (12), the equation can be written as
π = + +D S A (13)
which shows that the welfare disparity between male and female workers can be written as the sum of three components��
(i) Discrimination in the labor market (D), which is measured by the first term in the right-hand side of (12). D = 0 if the mean earnings of male and female are equal in every occupation from i to k.
(ii) Segregation in the labor market (S), which is measured by the second term in the right-hand side of (12). S = 0 if the proportion of male is equal to that of female for every occupation from i to k.
(iii) Inequality of earnings within male and female groups (A), which is measured by the second term in the right-hand side of (11). A = 0 if inequality of earnings among males (Am) is equal to inequality of earnings among females (Af).
4 In comparing the Blinder-Oaxaca (B-O) and the Son (S) approaches to understand this discrimination component, earnings may be assumed to depend on (i) individual characteristics (often labeled human capital variables), (ii) rates of return on these human capital characteristics (often labeled discrimination component), and (iii) unobservable factors. The B-O approach gets rid of (iii) by working only with the means of the two groups so that the gender earnings differential depends only on (i) and (ii). The S approach gets rid of (i) by proposing a new method that equalizes all the individual characteristics.

� November 2007
occupatioNal SegregatioN aNd geNder diScrimiNatioN iN labor marketS: thailaNd aNd viet NamhyuN h. SoN
IV. ADjustINg WElFARE by INDIVIDuAl ChARACtERIstICs
Both male and female individuals possess different attributes in education, age, geographical location, ethnicity, and so forth. All these attributes affect welfare disparity and its components in various ways. It is clearly important to control these attributes, before measuring the true magnitude of male–female earnings disparity. While this can be generally achieved by a regression model, this study proposes an alternative methodology to adjust individual earnings by various attributes that male and female earners face. This methodology is delineated as follows��
Let X be a n x 1 vector of earnings for both males and females. Suppose there are four attributes that largely determine individual earnings, which include educational level (denoted by E); years of work experience (denoted by G); geographical location (regions and urban/rural areas, denoted by R); and ethnic group (denoted by W). The vector X will change as one eliminates the differences in earnings due to these four attributes. The following illustrates adjustments with respect to education only.
Suppose there are ek educational groups in the population and µ je is the mean earnings of all
individuals in the jth education group, where j varies from 1 to ek. Each education group has different mean earnings. Thus, the idea here is to construct a new vector of earnings, which eliminates the difference in the mean earnings attributed to education. Denoting this vector by X E( ) ,
X EX
je
( ) = µ
µ (14)
Note that the mean of X E( ) will be same as the mean of X, which is equal to µ. If the vector
X E( ) is partitioned by ek educational groups, we will find that the mean earnings of each partitioned education group will have the same mean equal to µ. The disparity index π and its components using the vector X E( ) can then be calculated. Thus, π[ ( )]X G will be the male–female welfare disparity index when the variation in earnings due to education is controlled. This methodology can be used for controlling any number of attributes.
In this study, we have controlled three attributes in the cases of Thailand and �iet Nam namely education (E), work experience (G), and geographical location (by province and urban/rural areas) (R). Thus, π X E G R, ,( ) is the male–female disparity index when the three attributes, E, G, and R are simultaneously controlled. Any male–female disparities that still remain after controlling for these three attributes signify the unexplained factors.
It should be noted that due to complex interactions among different attributes, π X E G R, ,( ) will not be equal to the sum of π[ ( )]X E , π[ ( )]X G , and π[ ( )]X R . The following section discusses a method to separate or isolate the net effect of each individual attribute on the male–female disparity index.
V. NEt EFFECt oF INDIVIDuAl ChARACtERIstICs oN gENDER WElFARE DIsPARIty
This section provides a methodology to separate the impact of individual attributes on male–female disparity. This methodology is important as it provides answers to questions such as�� What is the impact of education on occupational segregation by gender? How does education affect labor market

SectioN viempirical aNalySiS
erd WorkiNg paper SerieS No. 108 �
discrimination against or in favor of females? Is discrimination against females different between rural and urban areas? Does ethnicity increase or decrease segregation and discrimination?
π(X) is the male–female disparity index, obtained before controlling for a host of personal and job characteristics, and π[ ( )]X E is the disparity index when the earning differences due to education is eliminated. Hence, π π( ) [ ( )]X X E− should measure the impact of education on male–female disparity. Similarly, one can capture the effects of other attributes such as experience and geographical regions. These are the total effects of each attribute. The major difficulty with this methodology stems from the fact that individual attributes interact with one another. Hence, there is a need to separate and isolate the net effect of individual attributes on the total male–female earnings disparity.
The total effect of all four attributes can be written as
π π θ θ θX X E G R E G R( ) − ( ) = ( ) + ( ) + ( ), , (15)
where θ(E) is the net effect of education, which as discussed earlier, is not equal to the total effect of education given by π π( ) [ ( )]X X E− . To compute the net effects, there is a need to take into account all possible interactions. This can be done by means of the Shapley decomposition, which looks at all possible elimination sequences.
VI. EmPIRICAl ANAlysIs
A. Data Description
This study has utilized two labor force surveys for �iet Nam and Thailand. These are the “employment” module from the 2002 �ietnam Living Standard Survey and the 2004 labor force surveys for Thailand. For the purpose of this study, the data selected are wage and salary earners aged 15 to 65 years old, both male and female. From this process, the total sample size was 39,555 workers for �iet Nam and 566,833 for Thailand. The working population was divided into 28 and 58 occupations for Thailand and �iet Nam, respectively. The occupational groups for the two countries are presented in Appendix Tables 1 and 2. In addition, wage or salary is defined to include monetary wage earned from employment and fringe benefits such as holiday allowance; social subsidies (e.g., sickness leave, maternity leave, etc.); business trip allowances; and other benefits.
b. Data Results: Decomposition Analysis
The methodology developed in Section III (to explain the disparity in welfare between male and female workers in terms of the three components of occupational segregation, gender discrimination, and inequality in earnings), is applied to data for the two countries. The results of these estimations are given in Table 1.
It appears that �iet Nam shows a far greater disparity in welfare between male workers and female workers relative to Thailand. For instance, average welfare of males is 17.90% higher than that of females in �iet Nam, whereas the males’ average welfare is 8.29% higher than females’ for Thailand. This result holds for the value of inequality aversion parameter (discussed in Section II) equal to unity. �ender welfare disparity tends to increase with the value of the inequality aversion parameter. In the case of �iet Nam, the disparity escalates by almost two fold when the aversion

8 November 2007
occupatioNal SegregatioN aNd geNder diScrimiNatioN iN labor marketS: thailaNd aNd viet NamhyuN h. SoN
parameter changes from 1 to 2. This suggests moreover, that the gender welfare disparity is far greater among the ultra-poor compared to the not-so-poor in the labor market.
table 1decOmpOSitiOn Of tOtal diSparity in Welfare betWeen male and female WOrkerS
aVerSiOn parameter tOtal diSparity SegregatiOn diScriminatiOn inequality
unadjustedthailandε = 1 8.29 –7.24 13.53 2.00ε = 2 11.34 –7.24 13.53 5.06Viet Nam ε = 1 17.90 –1.93 14.36 5.47ε = 2 33.80 –1.93 14.36 21.37
Adjusted for education, experience, and regions/areasthailandε = 1 15.20 3.42 12.16 –0.38ε = 2 14.78 3.42 12.16 –0.80Viet Namε = 1 16.84 0.82 13.62 2.39ε = 2 29.88 0.82 13.62 15.44
Source�� Author’s calculations.
Using the proposed decomposition methodology, discrimination appears to be the dominant factor that explains welfare disparity. As expected, the discrimination component leads to a widening gap between male and female welfare. These findings are true for both countries.
In terms of occupational segregation by gender, a reduction in the gender disparity of earnings is observed for the two Asian countries. In particular, the impact of the segregation component on total welfare disparity is far greater in Thailand compared to �iet Nam. More importantly, the strong and positive effect of segregation in Thailand tends to offset the negative impact of discrimination on the gender welfare gap.
Segregation is related to the extent to which it is possible to distinguish between male- and female-intensive occupations. Accordingly, the degree of segregation, which depends upon the shape of the distribution across occupations based on gender ratio, is examined. �ender ratio here is defined as the difference between proportion of male workers and proportion of female workers engaged in each of the 28 and 58 occupations for Thailand and �iet Nam, respectively. The results are presented in Appendix Tables 1 and 2.
The results reveal that in Thailand, female workers are largely in clerical and service occupations, or professions such as education, life science, and health; male workers are heavily employed in the extraction and building trades, as drivers, and in mobile-plant operations. Appendix Table 1 also suggests that elementary jobs (e.g., crafts and related trade, machine assembly, sales and services) as well as teaching professions appear to be particularly female-intensive in Thailand. While these two occupations are both female-intensive, they differ substantially in terms of hourly wage. For
SectioN viempirical aNalySiS
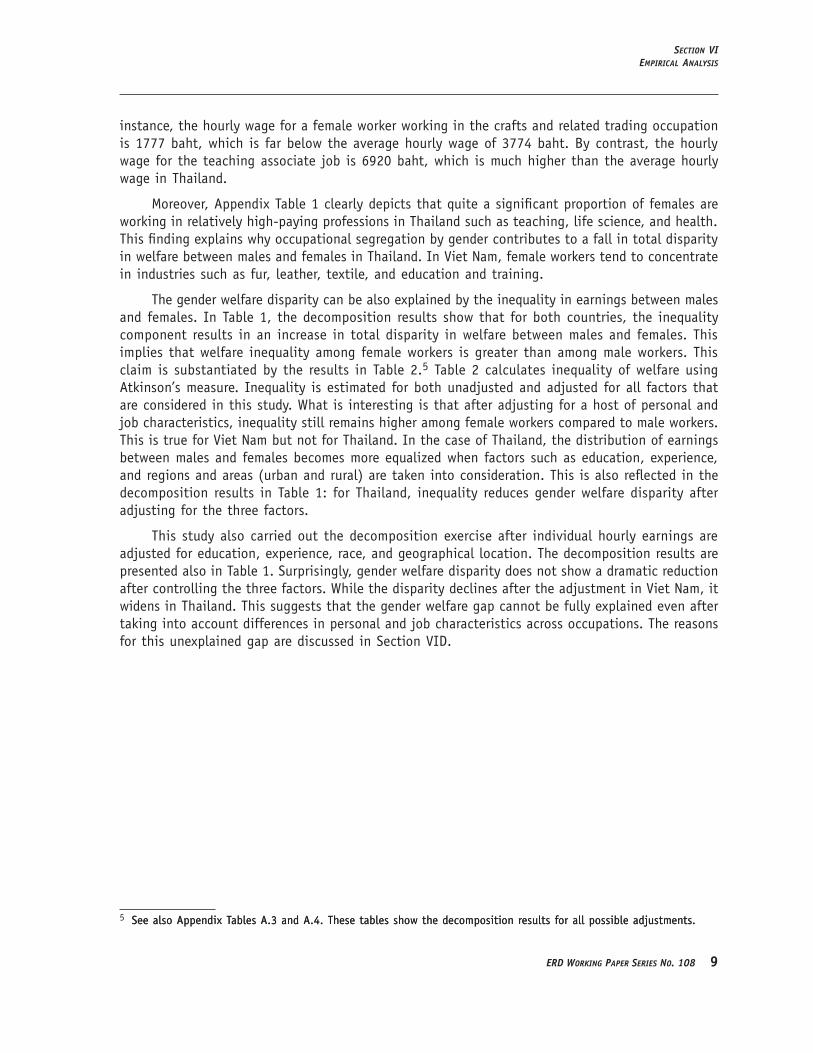
erd WorkiNg paper SerieS No. 108 �
instance, the hourly wage for a female worker working in the crafts and related trading occupation is 1777 baht, which is far below the average hourly wage of 3774 baht. By contrast, the hourly wage for the teaching associate job is 6920 baht, which is much higher than the average hourly wage in Thailand.
Moreover, Appendix Table 1 clearly depicts that quite a significant proportion of females are working in relatively high-paying professions in Thailand such as teaching, life science, and health. This finding explains why occupational segregation by gender contributes to a fall in total disparity in welfare between males and females in Thailand. In �iet Nam, female workers tend to concentrate in industries such as fur, leather, textile, and education and training.
The gender welfare disparity can be also explained by the inequality in earnings between males and females. In Table 1, the decomposition results show that for both countries, the inequality component results in an increase in total disparity in welfare between males and females. This implies that welfare inequality among female workers is greater than among male workers. This claim is substantiated by the results in Table 2.5 Table 2 calculates inequality of welfare using Atkinson’s measure. Inequality is estimated for both unadjusted and adjusted for all factors that are considered in this study. What is interesting is that after adjusting for a host of personal and job characteristics, inequality still remains higher among female workers compared to male workers. This is true for �iet Nam but not for Thailand. In the case of Thailand, the distribution of earnings between males and females becomes more equalized when factors such as education, experience, and regions and areas (urban and rural) are taken into consideration. This is also reflected in the decomposition results in Table 1�� for Thailand, inequality reduces gender welfare disparity after adjusting for the three factors.
This study also carried out the decomposition exercise after individual hourly earnings are adjusted for education, experience, race, and geographical location. The decomposition results are presented also in Table 1. Surprisingly, gender welfare disparity does not show a dramatic reduction after controlling the three factors. While the disparity declines after the adjustment in �iet Nam, it widens in Thailand. This suggests that the gender welfare gap cannot be fully explained even after taking into account differences in personal and job characteristics across occupations. The reasons for this unexplained gap are discussed in Section �ID.
5 See also Appendix Tables A.3 and A.4. These tables show the decomposition results for all possible adjustments.See also Appendix Tables A.3 and A.4. These tables show the decomposition results for all possible adjustments.

10 November 2007
occupatioNal SegregatioN aNd geNder diScrimiNatioN iN labor marketS: thailaNd aNd viet NamhyuN h. SoN
table 2Welfare inequality baSed On atkinSOn’S meaSure
inequality aVerSiOn parameter tOtal maleS femaleS
unadjustedthailandε = 1 36.82 36.24 37.50ε = 2 54.02 52.90 55.22Viet Namε = 1 37.76 36.38 39.76ε = 2 67.62 64.42 71.26
Adjusted for education, experience, and regions/areasthailand ε = 1 17.02 16.90 16.59ε = 2 29.96 29.80 29.24Viet Nam ε = 1 30.81 30.04 31.69ε = 2 60.24 57.36 63.46
Source�� Author’s calculations.
C. Data Results: Analyzing Net Effects of Individual Attributes based on shapley Decomposition
This section discusses the empirical results of the methodology proposed by this author, to separate the impact of individual attributes on male–female disparity in welfare (see Section �). The results are shown in Tables 3 and 4 for Thailand and �iet Nam, respectively.
In the case of Thailand, Table 3 shows that the net effects of education, experience, and regions and areas can explain 6.92% of the welfare disparity between male and female workers. While all three attributes appear to play significant roles in explaining the disparity, education is the major contributor to reducing gender disparity, suggesting that female workers are more educated in Thailand, where a greater proportion of female workers is found to have been educated at the university level (see Appendix Figure 1). Among the ultra-poor in the labor market, the average level of education appears to be also higher among females than among males (see Table 3). Moreover, the results indicate that experience increases gender disparity in welfare while location reduces it. These suggest that female workers in Thailand tend to have less years of working experience than male workers, and that females are more likely to live in richer regions such as Bangkok and the central region.
Education plays a critical role in explaining segregation and earnings inequality in Thailand. The results in Table 3 indicate that education reduces segregation and increases inequality in earnings between male and female workers. In explaining discrimination, two factors are shown to be important contributors. These are location and experience. While location contributes to a reduction in discrimination against female workers, years of working experience increases the discrimination. More importantly, the results suggest that in Thailand, experience is more important than education

SectioN viempirical aNalySiS
erd WorkiNg paper SerieS No. 108 11
and location in reducing discrimination and thus in closing the male–female earnings gap. Women are more likely to have worked part-time rather than full-time. As women have increased their labor force participation over time, their accumulated work experience has also grown. Based on data on experience in the Panel Survey of Income Dynamics, Blau and Kahn (1997) showed that changes in accumulated experience have been far larger, and that a much larger share of the decline was in male–female wages than in education. A number of recent studies have explored the contribution of gender differences in actual experience and labor force interruptions to the gender earnings gap (Light and Ureta 1995, Kim and Polachek 1994). These studies confirm that differences between men and women in labor market participation are important causes of the gender pay gap.
table 3cOntributiOnS Of indiVidual attributeS tO tOtal diSparity, thailand
cOntributiOnS by tOtal diSparity SegregatiOn diScriminatiOn inequality
Educationε = 1 –7.04 –10.63 –0.44 4.04ε = 2 –2.23 –10.63 –0.44 8.85Experienceε = 1 4.05 0.25 5.44 –1.63ε = 2 1.89 0.25 5.44 –3.79Regions and areasε = 1 –3.93 –0.28 –3.62 –0.03ε = 2 –3.11 –0.28 –3.62 0.79total ε = 1 –6.92 –10.66 1.37 2.38ε = 2 –3.44 –10.66 1.37 5.85
Source�� Author’s calculations.
Table 4 presents empirical results for �iet Nam. Like Thailand, education is one of the major contributors to the total gender disparity in welfare for �iet Nam. Education reduces the total gender disparity by 1.84%, suggesting that a greater proportion of female wage earners are concentrated at higher educational levels such as junior college diploma and masters (see Appendix Figure A.2). �iven the concern with ultra-poor, the net contribution of education to total gender disparity in welfare increases to 2.12%. This suggests that among the ultra-poor, female workers have a lower level of education than their counterparts. In �iet Nam, over 25% of female workers have no formal education, while slightly over 20% of male workers belong to that category (see Appendix Figure 2).
Similar to Thailand, working experience can significantly impact on total gender disparity in welfare in �iet Nam. Working experience increases the gender disparity by 2.92% and 1.74% for the aversion parameters equal to 1 and 2, respectively. This implies that female wage earners in �iet Nam have less working experience compared to their male counterparts. It is found that whereas female workers are concentrated in the younger age cohort (between 15 and 30 years old), male workers are clustered at the older age cohort (between 30 and 65 years old).
1� November 2007
occupatioNal SegregatioN aNd geNder diScrimiNatioN iN labor marketS: thailaNd aNd viet NamhyuN h. SoN
table 4cOntributiOnS Of indiVidual attributeS tO tOtal diSparity, Viet nam
cOntributiOnS by tOtal diSparity SegregatiOn diScriminatiOn inequality
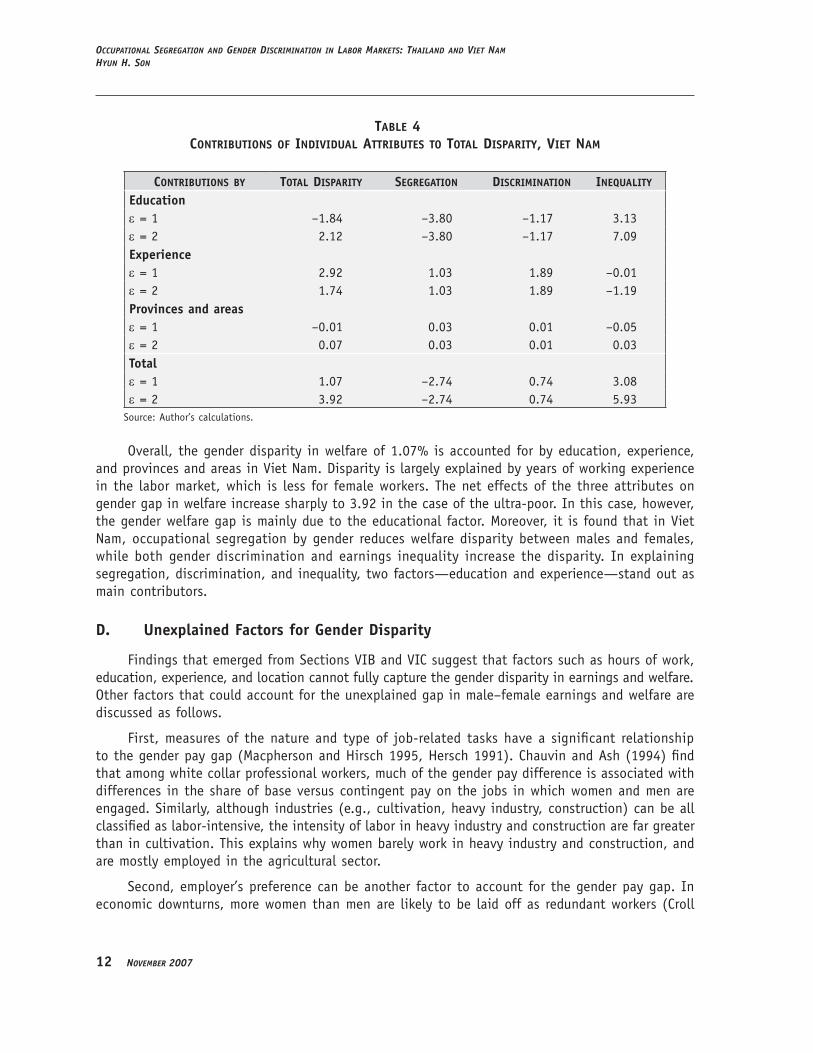
Education ε = 1 –1.84 –3.80 –1.17 3.13ε = 2 2.12 –3.80 –1.17 7.09Experience ε = 1 2.92 1.03 1.89 –0.01ε = 2 1.74 1.03 1.89 –1.19Provinces and areas ε = 1 –0.01 0.03 0.01 –0.05ε = 2 0.07 0.03 0.01 0.03total ε = 1 1.07 –2.74 0.74 3.08ε = 2 3.92 –2.74 0.74 5.93
Source�� Author’s calculations.
Overall, the gender disparity in welfare of 1.07% is accounted for by education, experience, and provinces and areas in �iet Nam. Disparity is largely explained by years of working experience in the labor market, which is less for female workers. The net effects of the three attributes on gender gap in welfare increase sharply to 3.92 in the case of the ultra-poor. In this case, however, the gender welfare gap is mainly due to the educational factor. Moreover, it is found that in �iet Nam, occupational segregation by gender reduces welfare disparity between males and females, while both gender discrimination and earnings inequality increase the disparity. In explaining segregation, discrimination, and inequality, two factors—education and experience—stand out as main contributors.
D. unexplained Factors for gender Disparity
Findings that emerged from Sections �IB and �IC suggest that factors such as hours of work, education, experience, and location cannot fully capture the gender disparity in earnings and welfare. Other factors that could account for the unexplained gap in male–female earnings and welfare are discussed as follows.
First, measures of the nature and type of job-related tasks have a significant relationship to the gender pay gap (Macpherson and Hirsch 1995, Hersch 1991). Chauvin and Ash (1994) find that among white collar professional workers, much of the gender pay difference is associated with differences in the share of base versus contingent pay on the jobs in which women and men are engaged. Similarly, although industries (e.g., cultivation, heavy industry, construction) can be all classified as labor-intensive, the intensity of labor in heavy industry and construction are far greater than in cultivation. This explains why women barely work in heavy industry and construction, and are mostly employed in the agricultural sector.
Second, employer’s preference can be another factor to account for the gender pay gap. In economic downturns, more women than men are likely to be laid off as redundant workers (Croll

SectioN viicoNcluSioNS
erd WorkiNg paper SerieS No. 108 1�
1998). One rationale for this is that in the face of pressures from product and market competition, enterprises prefer to recruit or retain male workers rather than shoulder the benefits or costs to pay for the reproductive time of female workers. For instance, industries (e.g., airlines, garment and other manufacturing) in �iet Nam have a regulation forbidding the birth of a child in the first two years of employment (Long et al. 2000).
Third, cultural factors can play a role in explaining the pay differential between males and females. Hersch and Stratton (1997) examined an issue as to whether the greater time and energy that women devote to home work may influence their productivity in the labor market, as well as their preferences for particular types of employment. They found that hours devoted to housework have a negative effect on hourly wage rates even when individual fixed effects are controlled for. This result is broadly consistent with Becker’s (1985) theory that a share of the male–female wage differential is due to productivity differences that arise from the fact that women carry a heavier load of responsibilities at home than men do. In a similar context, a recent study (2006) by the Institute for Fiscal Studies shows that the hourly pay of women relative to that of men in Britain tends to take a U-shape over women’s working lifetime�� the gender pay gap widens up to a certain age and then improves. The supporting argument for this is that women make choices to sacrifice their careers when they have children, with consequences for a reduction in their lifetime earnings. Thus, gender differences in the formal labor market stem from the division of parental duties between mothers and fathers, and that the reason for the pay gap lies in the home, with mothers being primarily responsible for the care of children. Further research on this issue is clearly needed after taking into account the female’s domestic work outside her labor in the market.
Finally, the unexplained gender pay gap may be attributed to the fact that men and women make different education and career choices. At school, boys and girls study different subjects, and boys’ chosen subjects often lead to more lucrative careers. Later, men and women specialize in different degrees and work in different professions. As a result, the average hourly pay for a female worker at the start of her working life is likely to be lower than that of a male worker, even though she may be more qualified.
VII. CoNClusIoNs
The study has proposed a new decomposition methodology to explain the welfare disparity between male and female workers in terms of three components. Welfare disparity is decomposed into three components, i.e., segregation, discrimination, and inequality. While segregation captures occupational segregation by gender, discrimination measures the earning differential between males and females within occupation. The inequality component shows the inequality in earnings for male and female workers. If this component is positive (negative), the earning inequality is greater (smaller) among females than males.
When the proposed decomposition methodology is applied to Thailand and �iet Nam, the results suggest that the gender disparity in welfare is largely contributed by the labor market discrimination against female workers. Relative to discrimination, the other two components—occupational segregation and inequality in earnings—play a smaller role in explaining the gender welfare gap. Regarding segregation and earnings inequality, both countries tend to have a similar pattern�� female workers are mainly in sales and services or professions in teaching and clerical work, whereas male workers are highly present in heavy industry and construction and machine operation, with earnings

1� November 2007
occupatioNal SegregatioN aNd geNder diScrimiNatioN iN labor marketS: thailaNd aNd viet NamhyuN h. SoN
among female workers more unequal compared to male workers. Even taking into account different individual characteristics such as hours of work, education, experience, and location, discrimination still dominates over the other two components. This is consistently true for both Thailand and �iet Nam. Surprisingly, when differences in education, experience, and location are controlled, there is not much change in the gender welfare disparity for �iet Nam. In contrast, the gender welfare gap opens up markedly in Thailand after accounting for education, experience, and location. On this account, the unexplained gender gap could be due largely to other reasons, including cultural factors, employer’s preference, and nature and type of job-related tasks.
This study has also proposed a new approach to adjusting earnings by a host of personal and job characteristics. Using this methodology, per capita earnings are adjusted by hours of work, education, experience, and location (regions and urban/rural areas). Although only four variables were used as controlling factors (which are considered the key factors in discussions of gender differences in earnings), the proposed method can be applied to any number of other variables of interest.
Furthermore, the study has attempted to isolate the net impact of each of these individual characteristics on segregation, discrimination, and earnings inequality. In this process, the findings suggest that schooling and working experience play key roles in determining segregation, discrimination, and earning inequality. The empirical results show that education tends to reduce segregation and discrimination, but can increase inequality in earnings between male and female workers. Overall, education reduces gender disparity in welfare for the two countries. This indicates that female workers have higher levels of education than their male counterparts in these countries. Among the ultra-poor, a higher level of education was also observed among female workers in Thailand, which was not the case for �iet Nam. As for experience, it had a strong net effect on segregation, discrimination, and earning inequality. This was true for both Asian countries. This finding thus suggests that in Thailand and �iet Nam, women have worked fewer years than men.
The findings of this study pose a number of policy implications. To narrow gender gaps, governments can gear resources toward providing affordable child care, in order to reduce the opportunity costs of working and raising women’s productivity as formal workers. �overnments can also pursue programs that enhance girls’ subject choices and improve career advice at school to ensure that girls are encouraged to pursue fields such as mathematics and science. Such public actions can help reduce the gender gap in the labor market.

appeNdix
erd WorkiNg paper SerieS No. 108 1�
APPENDIX
appendix table 1male- and female-dOminated OccupatiOnS in thailand
OccupatiOnal grOupS tOtal male female difference
male-dominated occupations Legislators and senior officials 0.59 0.95 0.10 0.84Corporate managers 1.32 1.67 0.85 0.82�eneral managers 0.65 0.79 0.46 0.33Physical, math, and engineering science professionals 0.70 1.00 0.30 0.71Physical and engineering science associate professionals 2.71 3.18 2.06 1.12Market-oriented skilled agricultural and fishery workers 6.18 6.69 5.49 1.20Extraction and building trades workers 7.33 12.00 1.08 10.91Metal, machinery, and related trades workers 5.40 9.22 0.28 8.94Stationary-plant and related operators 1.13 1.53 0.60 0.93Drivers and mobile-plant operators 5.46 9.45 0.12 9.33Laborers in mining, construction, manufacturing, and transport
7.25 7.67 6.68 0.99
Female-dominated occupations Life science and health professionals 1.19 0.61 1.97 –1.36Teaching professionals 3.40 2.28 4.90 –2.62Other professionals 1.35 1.12 1.66 –0.54Life science and health associate professionals 0.54 0.36 0.79 –0.42Teaching associate professionals 0.21 0.10 0.36 –0.25Other associate professionals 4.20 3.03 5.75 –2.73Office clerks 5.72 3.75 8.33 –4.58Customer services clerks 1.26 0.83 1.85 –1.02Personal and protective services workers 5.71 4.98 6.68 –1.70Model, sales persons, and demonstrators 4.96 3.58 6.79 –3.21Subsistence agricultural and fishery workers 0.03 0.02 0.03 –0.01Precision, handicraft, printing, and related trade workers
1.77 1.53 2.08 –0.55
Other craft and related trades workers 5.72 3.24 9.03 –5.79Machine operators and assemblers 9.40 6.44 13.40 –6.96Sales and services elementary occupations 8.10 6.39 10.47 –4.07Agricultural, fishery, and related laborers 7.57 7.44 7.74 –0.30Armed forces 0.15 0.15 0.16total 100.0 100.0 100.0 0.0
Note�� Difference is obtained by subtracting the proportion of female workers from the proportion of male workers in each occupational group.

1� November 2007
occupatioNal SegregatioN aNd geNder diScrimiNatioN iN labor marketS: thailaNd aNd viet NamhyuN h. SoN
appendix table 2male- and female-dOminated OccupatiOnS in Viet nam
induStry tOtal male female difference
male-dominated occupations Forestry workers 0.38 0.46 0.25 0.22Aquaculture 3.06 4.11 1.27 2.84Laborers in coal mining 0.49 0.57 0.37 0.19Laborers in oil and gas drilling 0.07 0.09 0.03 0.05Metal mining workers 0.08 0.10 0.05 0.05Mining for rocks and stones 0.86 1.18 0.32 0.87Tobacco products 0.06 0.07 0.03 0.04Other nonmetal mineral production 1.94 2.06 1.75 0.31Metal production and products 0.28 0.37 0.12 0.25Metal products (e.g., tools, boiler, etc.) 1.27 1.76 0.43 1.33Other equipment and machinery 0.20 0.24 0.14 0.11Motor vehicles and spare parts 0.09 0.09 0.08 0.01Other transportation equipment 0.45 0.60 0.19 0.40Furniture production 2.12 2.74 1.07 1.67Recycling and reprocessing 0.07 0.07 0.07 0.00Electricity production and distribution 0.59 0.81 0.22 0.59Extract, clean, and distribute water 0.17 0.20 0.12 0.08Construction 11.93 17.50 2.44 15.06�ehicle sales, maintenance, and repair 0.84 1.15 0.32 0.83Wholesale and agent sales 1.13 1.21 1.01 0.20Road, railroad, and pipeline transport 2.31 3.44 0.39 3.05Water transport 0.49 0.70 0.15 0.55Airline transport 0.06 0.08 0.03 0.05Services in transport 1.13 1.49 0.51 0.98Real estate 0.10 0.12 0.06 0.06Rental of equipment and computer-related activities 0.09 0.11 0.06 0.05Other business activities 0.57 0.63 0.45 0.19�overnment administration and national defense 4.63 5.87 2.55 3.32Communist party, professional associations 0.95 1.13 0.64 0.48Female-dominated industriesWood processing and production 1.81 1.67 2.05 –0.38Paper and paper products 0.39 0.32 0.52 –0.20Printing and publishing 0.34 0.29 0.42 –0.13Coke, crude oil, uranium processing 0.05 0.04 0.05 –0.00Chemicals and chemical products 0.47 0.46 0.49 –0.03Plastic and rubber production 0.51 0.37 0.73 –0.36Office and computer equipment production 0.06 0.06 0.07 –0.01Other electronic, electric equipment 0.27 0.26 0.30 –0.05
continued next page.

appeNdix
erd WorkiNg paper SerieS No. 108 1�
Communication equipment 0.12 0.08 0.17 –0.09Medical and laboratory equipment 0.07 0.02 0.15 –0.12Retail sales workers 2.85 2.33 3.74 –1.41Workers in hotel and restaurant 1.63 0.88 2.93 –2.05Post and telecommunications 0.46 0.41 0.53 –0.12Financial intermediary 0.23 0.18 0.31 –0.13Insurance and pensions 0.19 0.15 0.27 –0.12Assistance in finance 0.29 0.21 0.41 –0.20Science and technology activities 0.25 0.22 0.30 –0.08Education and training 6.50 3.17 12.15 –8.99Social relief (hospital, clinic, etc.) 1.48 1.00 2.30 –1.30Culture and sports 0.51 0.51 0.52 –0.02Public sanitation 0.43 0.39 0.49 –0.10Other services (ironing, laundry, etc.) 0.74 0.60 0.96 –0.36Personal services 1.51 0.69 2.89 –2.20Total 100.0 100.0 100.0 0.0
Note�� Difference is obtained by subtracting the proportion of female workers from the proportion of male workers in each occupational group.
table a.2 cOntinued.
18 November 2007
occupatioNal SegregatioN aNd geNder diScrimiNatioN iN labor marketS: thailaNd aNd viet NamhyuN h. SoN
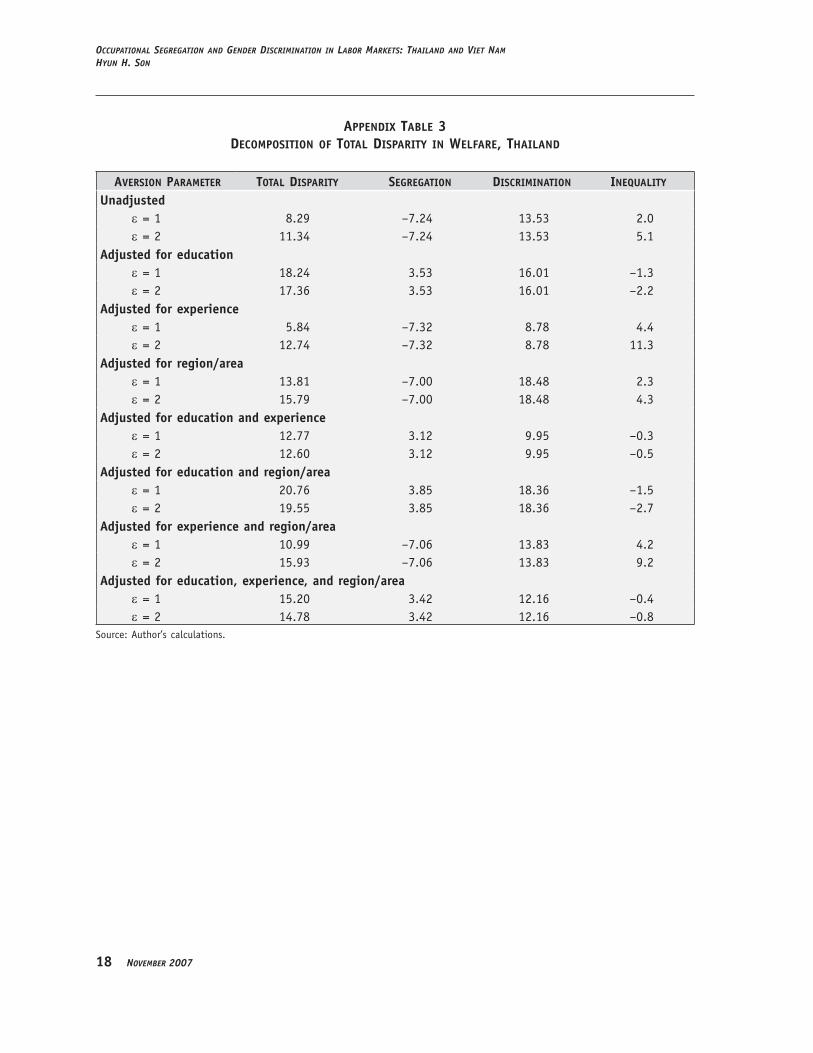
appendix table 3decOmpOSitiOn Of tOtal diSparity in Welfare, thailand
aVerSiOn parameter tOtal diSparity SegregatiOn diScriminatiOn inequality
unadjustedε = 1 8.29 –7.24 13.53 2.0ε = 2 11.34 –7.24 13.53 5.1
Adjusted for educationε = 1 18.24 3.53 16.01 –1.3ε = 2 17.36 3.53 16.01 –2.2
Adjusted for experienceε = 1 5.84 –7.32 8.78 4.4ε = 2 12.74 –7.32 8.78 11.3
Adjusted for region/areaε = 1 13.81 –7.00 18.48 2.3ε = 2 15.79 –7.00 18.48 4.3
Adjusted for education and experienceε = 1 12.77 3.12 9.95 –0.3ε = 2 12.60 3.12 9.95 –0.5
Adjusted for education and region/areaε = 1 20.76 3.85 18.36 –1.5ε = 2 19.55 3.85 18.36 –2.7
Adjusted for experience and region/areaε = 1 10.99 –7.06 13.83 4.2ε = 2 15.93 –7.06 13.83 9.2
Adjusted for education, experience, and region/areaε = 1 15.20 3.42 12.16 –0.4ε = 2 14.78 3.42 12.16 –0.8
Source�� Author’s calculations.

appeNdix
erd WorkiNg paper SerieS No. 108 1�
appendix table 4decOmpOSitiOn Of tOtal diSparity in Welfare, Viet nam
tOtal diSparity SegregatiOn diScriminatiOn inequality
unadjustedε = 1 17.90 –1.93 14.36 5.5ε = 2 33.80 –1.93 14.36 21.4
Adjusted for educationε = 1 19.39 1.92 15.26 2.2ε = 2 31.82 1.92 15.26 14.6
Adjusted for experienceε = 1 14.63 –2.89 12.15 5.4ε = 2 32.23 –2.89 12.15 23.0
Adjusted for province and area (urban and rural)ε = 1 17.91 –1.97 14.37 5.5ε = 2 33.68 –1.97 14.37 21.3
Adjusted for education and experienceε = 1 16.83 0.83 13.66 2.3ε = 2 29.90 0.83 13.66 15.4
Adjusted for education and province/areaε = 1 19.40 1.93 15.21 2.3ε = 2 31.79 1.93 15.21 14.7
Adjusted for experience and province/areaε = 1 14.64 –2.94 12.18 5.4ε = 2 32.14 –2.94 12.18 22.9
Adjusted for education, experience, and province/areaε = 1 16.84 0.82 13.62 2.4ε = 2 29.88 0.82 13.62 15.4
Source�� Author’s calculations.

�0 November 2007
occupatioNal SegregatioN aNd geNder diScrimiNatioN iN labor marketS: thailaNd aNd viet NamhyuN h. SoN
Male Female
Male Female
30.0
25.0
20.0
15.0
10.0
5.0
0.0
25.0
20.0
15.0
10.0
5.0
0.0
No degree
Less than primary
Elementary
Lower secondary
Upper secondary (
general/acad
emic)
Upper secondary (
vocational)
Upper secondary (
teacher tr
aining)
Diploma (academic)
Diploma (higher te
chnical educatio
n)
Diploma (teacher tr
aining)
University (
academic)
University (
higher technical
education)
University (
teacher tr
aining)Others
Unknown
No degree Primary
Lower secondary
Upper secondary
Technical/
vocational
Professional se
condary
Junior college diplomaBachelor
Masters
Doctorate
APPENDIX FIGURE 1EDUCATIONAL LEVELS OF MALE AND FEMALE WORKERS IN THAILAND
APPENDIX FIGURE 2PERCENTAGE OF MALE AND FEMALE WORKERS BY EDUCATIONAL LEVEL, VIET NAM

refereNceS
erd WorkiNg paper SerieS No. 108 �1
REFERENCEs
Altonji, J. �., and R. M. Blank. 1999. “Race and �ender in the Labor Market.” In J. Behrman and T. N. Srinivasan, eds., Handbook of Development Economics. �ol. 3A. North-Holland.
Atkinson, A. B. 1970. “On the Measurement of Inequality.” Journal of Economic Theory 2��244–63.Baldwin, M., and W. �. Johnson. 1992. “Estimating the Effects of Wage Discrimination.” Review of Economics
and Statistics 74(3)��446–55.Becker, �. S. 1985. “Human Capital, Efforts and the Sexual Division of Labor.” Journal of Labor Economics
3(1, Suppl.)��S33–58.Behrman, J. R., and Z. Zhang. 1995. “�ender Issues and Employment in Asia.” Asian Development Review
13(2)��1–49.Bergmann, B. 1971. “The Effect on White Incomes of Discrimination in Employment.” Journal of Political
Economy 79��294–313.Blau, F. D., and L. M. Kahn. 1997. “Swimming Upstream�� Trends in the �ender Wage Differential in the 1980s.”
Journal of Labor Economics 15(1)��1–42.Blinder, A. S. 1973. “Wage Discrimination�� Reduced Form and Structural Estimates.” Journal of Human Resources
8��436–55.Chauvin, K. W., and R. A. Ash. 1994. “�ender Earnings Differentials in Total Pay, Base Pay and Contingent
Pay.” Industrial and Labor Relations Review 47(4)��634–49.Cotton, J. 1988. “On the Decomposition of Wage Differentials.” Review of Economics and Statistics 70��236–
43.Croll, E. J. 1998. Gender and Transition in China and Vietnam. Swedish International Development Agency,
Stockholm.Deutsch, J., and J. Silber. 2003. “Earnings Functions and the Measurement of the Determinants of Wage
Dispersion�� Extending Oaxaca’s Approach.” Paper presented at the Bocconi Conference, Milan.�oldin, C. 1990. Understand the Gender Gap: An Economic History of American Women. Oxford�� Oxford University
Press.Hersch, J. 1991. “Male–Female Differences in Hourly Wage�� The Role of Human Capital, Working Conditions
and Housework.” Industrial and Labor Relations Review 44(4)��746–59.Hersch, J., and L. S. Stratton. 1997. “Housework, Fixed Effects and Wages of Married Workers.” Journal of
Human Resources 32(2)��285–307.Institute for Fiscal Studies. 2006. Newborns and New Schools�� Critical Times in Women’s Employment. Research
Report No. 308, London.Kim, M. K., and S. W. Polachek. 1994. “Panel Estimates of Male–Female Earnings Functions.” Journal of Human
Resources 29(2)��406–28.Light, A., and M. Ureta. 1995. “Early Career Work Experience and �ender Wage Differentials.” Journal of Labor
Economics 13(1)��121–54.Long, L. D., L. N. Hung, A. Truitt, L. P. Mai, and D. N. Anh. 2000. Changing �ender Relations in �ietnam’s
Post Doi Moi Era. Working Paper No. 14, World Bank, Washington, DC.Macpherson, D. A., and B.T. Hirsch. 1995. “Wages and �ender Composition�� Why do Women’s Jobs Pay Less?”
Journal of Labor Economics 13(3)��426–71.Madden, J. F. 1975. “Discrimination—A Manifestation of Male Market Power?” In C. B. Lloyd, ed., Sex,
Discrimination, and the Division of Labor. New York�� Columbia University Press.Neumark, D. 1988. “Employer’s Discriminatory Behavior and the Estimation of Wage Discrimination.” Journal
of Human Resources 23��279–95.Oaxaca, R. 1973. “Male–Female Wage Differentials in Urban Labor Markets. International Economic Review
9��693–709.Oaxaca, R., and M. Ransom. 1988. “Searching for the Effect of Unionism on the Wages of Union and Nonunion
Workers.” Journal of Labor Research 9��139–48.

�� November 2007
occupatioNal SegregatioN aNd geNder diScrimiNatioN iN labor marketS: thailaNd aNd viet NamhyuN h. SoN
———.1994. “On Discrimination and the Decomposition of Wage Differentials.” Journal of Econometrics 61��5–21.
Sen, A. 2001. “Many Faces of �ender Inequality.” India’s National Magazine 18(22)��1–10.Shapley, L. 1953. “A �alue for n-person �ames.” In H. W. Kuhn and A. W. Tucker, eds., Contributions to the
Theory of Games, �ol. 2. New Jersey�� Princeton University Press.Smith, J. P., and M. P. Ward. 1989. “Women in the Labor Market and in the Family.” Journal of Economic
Perspectives 3(1)��9–23.Thurow, L. C. 1969. Poverty and Discrimination. Brookings Institution, Washington, DC.
Economics and REsEaRch dEpaRtmEnt
Printed in the Philippines
occupational segregation and Gender discrimination in Labor markets: thailand and Viet nam
Hyun H. Son
November 2007
about the paper
Hyun H. Son writes develops a decomposition methodology to explain the welfare disparity between male and female workers in terms of three components: segregation, discrimination, and inequality. Based on Atkinson’s welfare function, the proposed decomposition methodology takes into account the sensitivity of inequality within occupational groups and also by gender. The proposed methodologies are applied to Thailand and Viet Nam.
Asian Development Bank6 ADB Avenue, Mandaluyong City1550 Metro Manila, Philippineswww.adb.org/economicsISSN: 1655-5252Publication Stock No.
about the asian development Bank
ADB aims to improve the welfare of the people in the Asia and Pacific region, particularly the nearly 1.9 billion who live on less than $2 a day. Despite many success stories, the region remains home to two thirds of the world’s poor. ADB is a multilateral development finance institution owned by 67 members, 48 from the region and 19 from other parts of the globe. ADB’s vision is a region free of poverty. Its mission is to help its developing member countries reduce poverty and improve their quality of life.
ADB’s main instruments for helping its developing member countries are policy dialogue, loans, equity investments, guarantees, grants, and technical assistance. ADB’s annual lending volume is typically about $6 billion, with technical assistance usually totaling about $180 million a year.
ADB’s headquarters is in Manila. It has 26 offices around the world and more than 2,000 employees from over 50 countries.
ERD WoRking PaPER SERiES no. 108