Occupational light vehicle (OLV) use The Drive To Policy Rwth Stuckey PhD Candidate OHS Adviser...
34
Occupational light vehicle (OLV) use The Drive To Policy Rwth Stuckey PhD Candidate OHS Adviser Transport Accident Commission Victoria, Australia Supervisors: A/P Anthony D. LaMontagne A/P Malcolm Sim Dr. Deborah Glass Statistical Assistance: Pam Simpson
-
Upload
emory-poole -
Category
Documents
-
view
220 -
download
0
Transcript of Occupational light vehicle (OLV) use The Drive To Policy Rwth Stuckey PhD Candidate OHS Adviser...
Occupational light vehicle (OLV) use The Drive To Policy
Rwth StuckeyPhD CandidateOHS Adviser Transport Accident CommissionVictoria, Australia
Supervisors:A/P Anthony D. LaMontagne A/P Malcolm SimDr. Deborah GlassStatistical Assistance: Pam Simpson

Rationale
• Road crashes are the most common cause of traumatic work-related death, injury and absence from work.
• Work driving research has related largely to heavy vehicles.
• There are no comprehensive descriptions of the light vehicles work group.
• Confusion between OH&S and road safety policy application.
• Complex mix of vehicle-control arrangements with varied work patterns of drivers and passengers.
• Occupational light vehicle (OLV) use is large and under-recognised issue lacking a clear policy framework

NOHSC all Vehicle related claims - 1994-2000
0
200
400
600
800
1000
1200
1400
1600
1800
1994-1995 1995-1996 1996-1997 1997-1998 1998-1999 1999-2000
Year
Trucks, semi-trailers,lorriesBuses & minibuses
Cars, stationwagons,vans, utesMotorcycles
Pushbikes
Other road transport
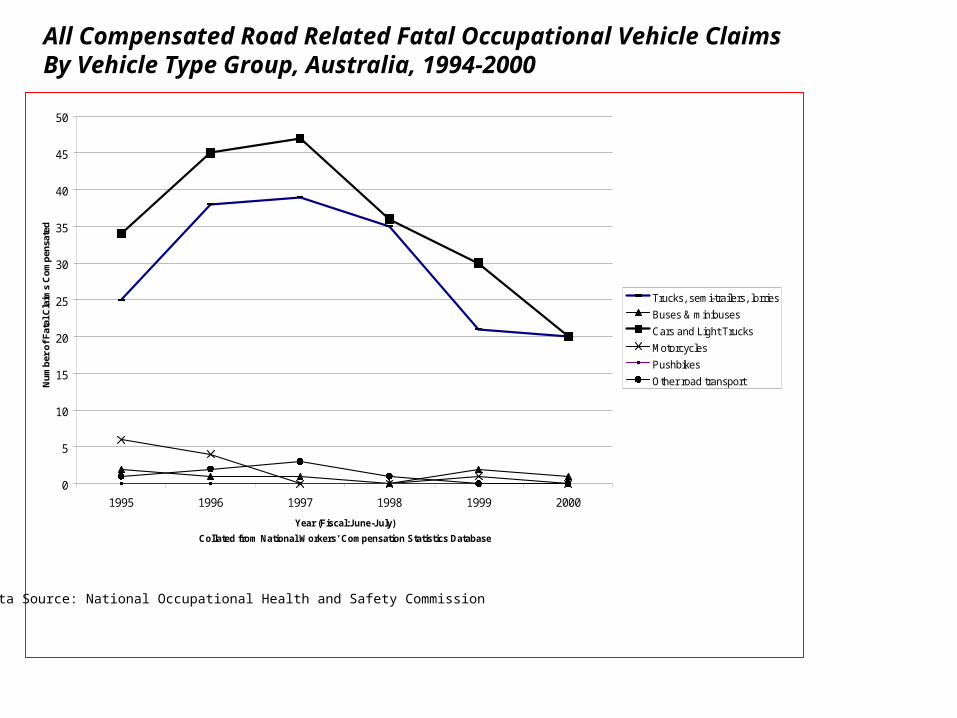
All Compensated Road Related Fatal Occupational Vehicle Claims By Vehicle Type Group, Australia, 1994-2000
0
5
10
15
20
25
30
35
40
45
50
1995 1996 1997 1998 1999 2000
Year (Fiscal:June-July)
Collated from National Workers’ Compensation Statistics Database
Nu
mb
er o
f F
atal
Cla
ims
Co
mp
ensa
ted
Trucks, semi-trailers, lorries
Buses & minibuses
Cars and Light Trucks
Motorcycles
Pushbikes
Other road transport
Data Source: National Occupational Health and Safety Commission

Occupational Light Vehicle Claims as a Percentage of all Road Vehicle Compensation Claims by Occupation, Australia, 1994-2000
Data Source: National Occupational Health and Safety Commission On-line Statistical database URL:http://NOHSC.info.au.comp/

Collated from Data source: ABS Australian Social Trends 2000 Work - Paid Work: Employment arrangements in the late 1990’s, Citing - Unpublished data, Forms of Employment Survey, August, 1998.
Occupation (Based on ASCO Categories)25% or more in non-traditional patterns & category 4&5, lowest skilled rank workers
Employment Arrangements 1998 by Occupation, Australia.
0
20
40
60
80
100
120
Man
ager
s & A
dmin
istra
tors
Profe
ssio
nals
Para-
profe
ssio
nals
Trades
perso
ns & re
late
d work
ers
Advance
d cle
rical
& s
ervi
ce w
orker
s
Inte
rmed
iate
cle
rical
, sal
es &
ser
vice
work
ers
Inte
rmed
iate
pro
ductio
n & tr
ansp
ort work
ers
Elem
enta
ry c
leric
al, s
ales
& s
ervi
ce w
orker
s
Laboure
rs &
rela
ted w
orker
s
Perc
en
t
Other Employment Arrangements
Traditional Jobs

Work Arrangements Vehicle Ownerships
Corporate Vehicles
Private Vehicles
Permanent Work Arrangements
Permanent full time employees
Permanent part-time employees
Precarious or Contingent Work Arrangements
Casuals -
Restricted tenure/Contractors
-
Labour hire -
Self Employed or Own Account Workers
--
Indicates the one sub-group who have been the focus of previous research.
The Varied Organisation Of Vehicles And Work Arrangements Across OLV Users.

Annual Work-Related Business And Private Use Of Road Vehicles In Australia Of Total Kilometres Travelled
Year
Journey to Work/Commuting Use
Business And Private Use Of Road Vehicles In Australia By Total Kilometres Travelled
0
50000
100000
150000
200000
250000
1998 1999 2000 2002
Kilometres Travelled (Millions)
Private Vehicle Use
Other Work Vehicle Use
Occupational Light Vehicle Use
Data Sources: *Australian Bureau of Statistics Survey of Motor Vehicle Use. Catalogue No.: 9208.0 ABS;and +Year Book Australia 2003 Transport; General transport activity - Road transport activity•(*1998, 1999 & 2002 data; +2000 data; no data was available for 2001.)

There are increasing numbers of OLV users due to work arrangement
changes in many occupations and industries including:
• permanent workers employed as drivers
• permanent workers using employer owned vehicles or driving private
vehicles while working incidentally to their primary occupation
• contingent workers using vehicles between workplaces.
• contingent workers using work specific vehicles such as tradesmen using
vans as a work base
• OLV-user is not a job title, and frequently the road-based work activity is
irregular and incidental to a designated occupation.

The Impact Of Burden Shifting
• Across all jurisdictions burden shifting leads to subsidisation for many injured OLV users by the driving public through registration levies.
• Employers’ levies should be bearing such costs.
• The costs of work related incidents are subsumed into Motor Accident and Social Security systems, and cannot be teased back out.
• With no evidence-base to guide policy and practice for intervention, problems are not characterised and the OHS system fails.
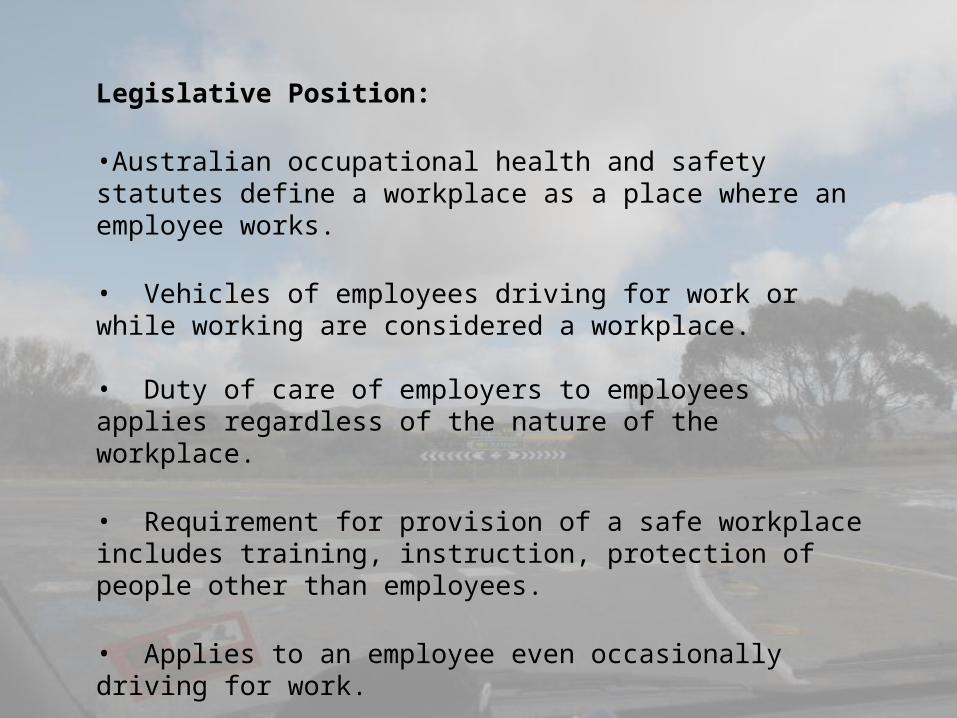
Legislative Position:
•Australian occupational health and safety statutes define a workplace as a place where an employee works.
• Vehicles of employees driving for work or while working are considered a workplace. • Duty of care of employers to employees applies regardless of the nature of the workplace.
• Requirement for provision of a safe workplace includes training, instruction, protection of people other than employees.
• Applies to an employee even occasionally driving for work.

Policy Environment: External Influences: Relevant Local, National & International Public Policy
Organisational Environment: Work Arrangements
External Physical Work Environment - Road Environment
Immediate Physical Work Environment - Vehicle
Locus of Injuries & Fatalities:
Drivers & Passengers
Figure Legend:
OLV Users
The OLV Use Systems ModelRef: Stuckey, R. LaMontagne A.D. Sim, M. “Working in light vehicles - a review and conceptual model for Occupational
Health & Safety” in press: Accident Analysis and Prevention.
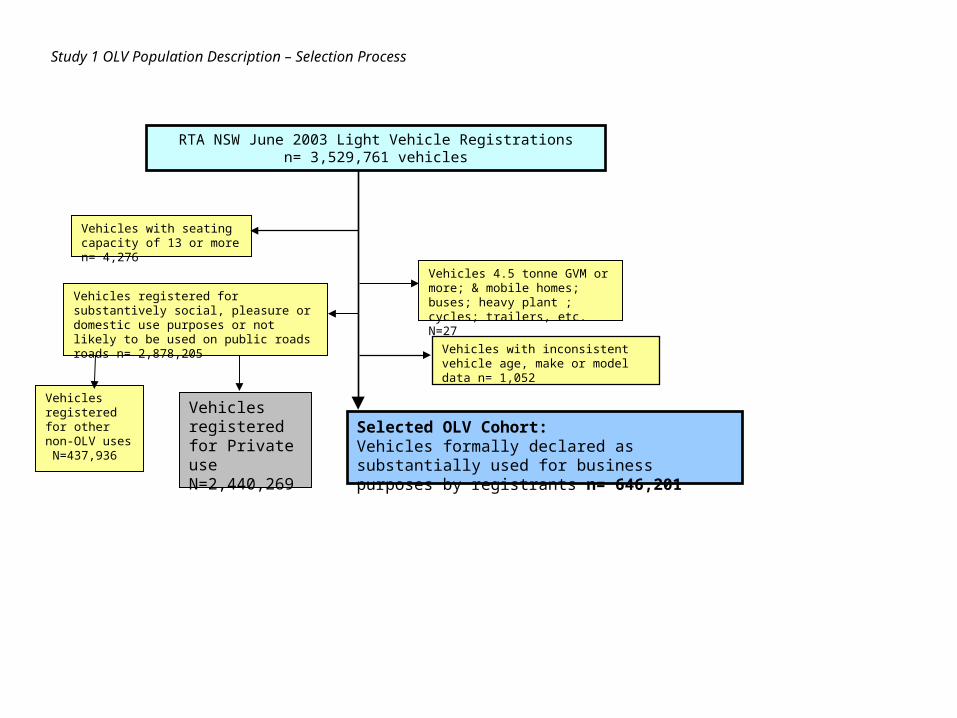
Vehicles with seating capacity of 13 or more n= 4,276
Vehicles registered for substantively social, pleasure or domestic use purposes or not likely to be used on public roadsroads n= 2,878,205
RTA NSW June 2003 Light Vehicle Registrationsn= 3,529,761 vehicles
Selected OLV Cohort: Vehicles formally declared as substantially used for business purposes by registrants n= 646,201
Study 1 OLV Population Description – Selection Process
Vehicles with inconsistent vehicle age, make or model data n= 1,052
Vehicles 4.5 tonne GVM or more; & mobile homes; buses; heavy plant ; cycles; trailers, etc. N=27
Vehicles registered for Private use N=2,440,269
Vehicles registered for other non-OLV uses N=437,936
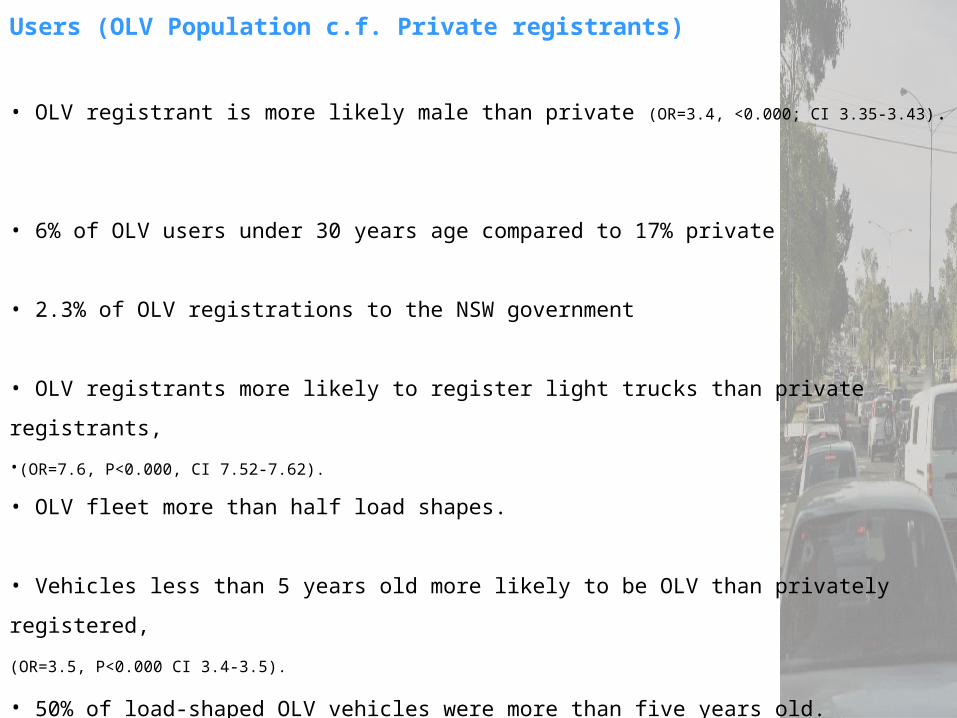
Users (OLV Population c.f. Private registrants)
• OLV registrant is more likely male than private (OR=3.4, <0.000; CI 3.35-3.43).
• 6% of OLV users under 30 years age compared to 17% private
• 2.3% of OLV registrations to the NSW government
• OLV registrants more likely to register light trucks than private registrants,
•(OR=7.6, P<0.000, CI 7.52-7.62).
• OLV fleet more than half load shapes.
• Vehicles less than 5 years old more likely to be OLV than privately registered,
(OR=3.5, P<0.000 CI 3.4-3.5).
• 50% of load-shaped OLV vehicles were more than five years old.

Vehicles
• Nearly 80% of primary-producer & 44% of general business OLV light trucks.
• OLV cars & 4-wheel-drives newer, while 50% of light trucks >5 years old.
• Light trucks more likely to be heavier (OR=58, P<0.000, CI 54-63) but less powerful than cars, with engines of four or less cylinder size, (OR=4.12, P<0.000, CI 4.1-4.2).
• 4-wheel-drives heavier & more powerful than all other vehicle types.
• half OLV fleet colored white, but private fleet less than third white vehicles
• nearly 80% of OLV load vehicles & 30% of cars and 4-wheel-drives white
• OLV made up of 149 makes and 1,015 models, Toyotas the largest market share of which 23% car shapes.

Environment
• Sydney city metropolitan region the registered location for
the majority of all light vehicles in New South Wales
• OLV were slightly more likely to be registered in the
Sydney area than privately registered vehicles, (OR=1.1, P<0.000, CI 1.60-
1.64).
• Rural or regional NSW registered OLV included around
95% of primary producers and half the load vehicles.
• More than 80% of taxis, 70% of general business and 65%
of government registrations were in the Sydney metropolitan
region.

Work Organization
• OLV registered for work-use either by an organization or a private-person/s – sole traders, unincorporated-organizations
• up to 38% of OLV were registered by a sole-trader not an organization.
• organizations more likely than sole-traders to register car shapes five or less years old in the Sydney area for general business use.
• around half regional vehicles registered by sole-traders for primary production.
•vehicles registered for farming or taxi use much more likely to belong to a sole trader than an organization. (OR=6.25, P<0.000, CI=6.1-6.4; OR=6.7, P<0.000, CI=6.3-7.1 respectively)
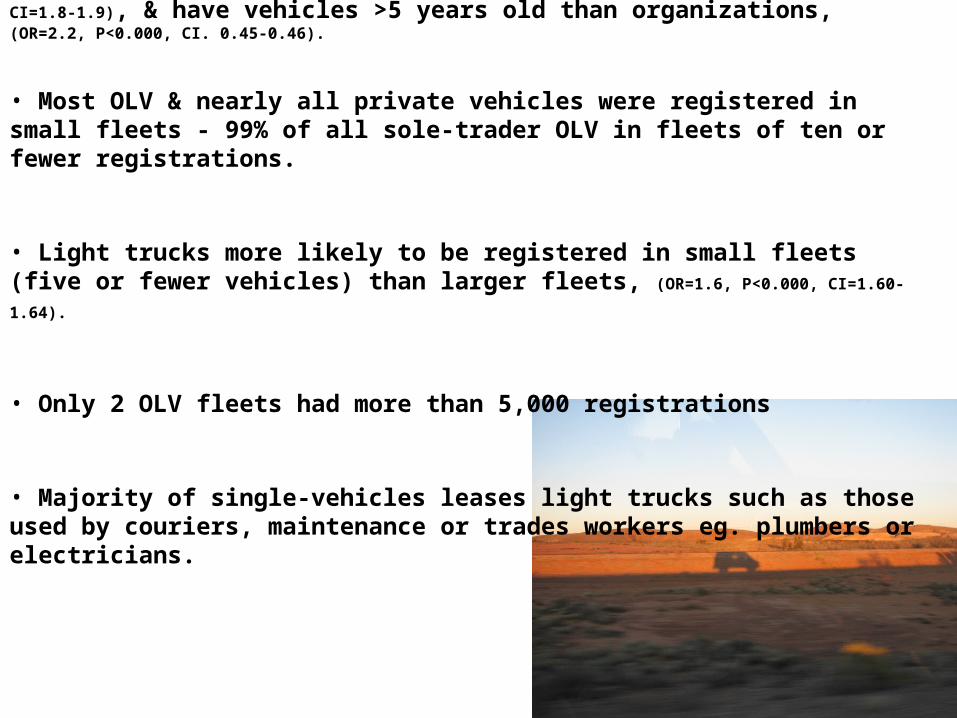
• Sole traders more likely to register light trucks (OR=1.9, P<0.000, CI=1.8-1.9), & have vehicles >5 years old than organizations, (OR=2.2, P<0.000, CI. 0.45-0.46).
• Most OLV & nearly all private vehicles were registered in small fleets - 99% of all sole-trader OLV in fleets of ten or fewer registrations.
• Light trucks more likely to be registered in small fleets (five or fewer vehicles) than larger fleets, (OR=1.6, P<0.000, CI=1.60-1.64).
• Only 2 OLV fleets had more than 5,000 registrations
• Majority of single-vehicles leases light trucks such as those used by couriers, maintenance or trades workers eg. plumbers or electricians.
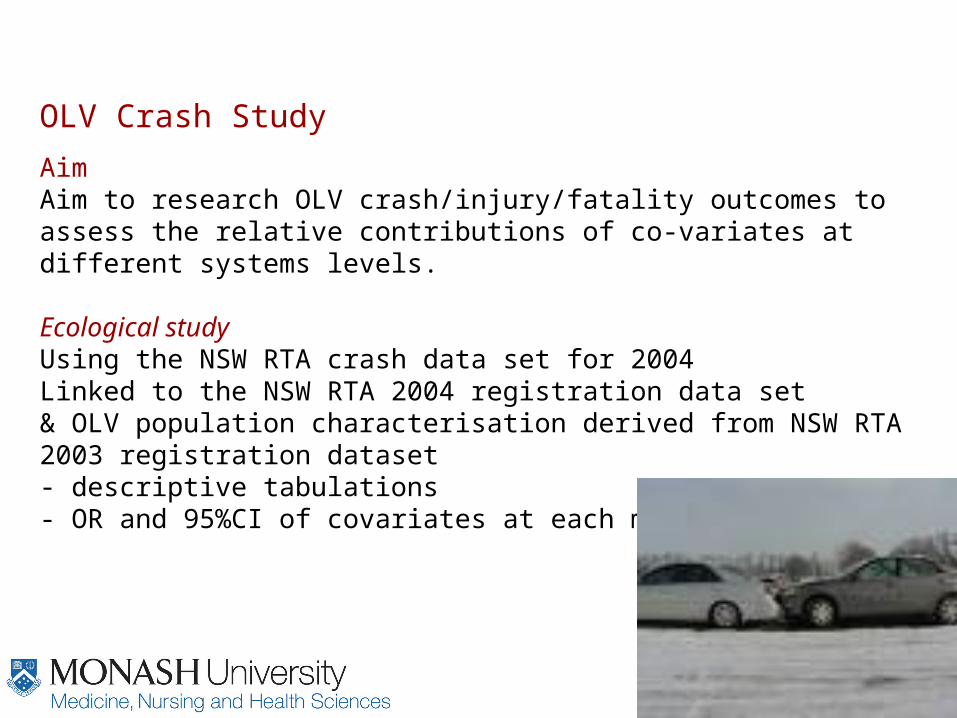
OLV Crash Study
AimAim to research OLV crash/injury/fatality outcomes to assess the relative contributions of co-variates at different systems levels.
Ecological study Using the NSW RTA crash data set for 2004Linked to the NSW RTA 2004 registration data set& OLV population characterisation derived from NSW RTA 2003 registration dataset - descriptive tabulations - OR and 95%CI of covariates at each model level
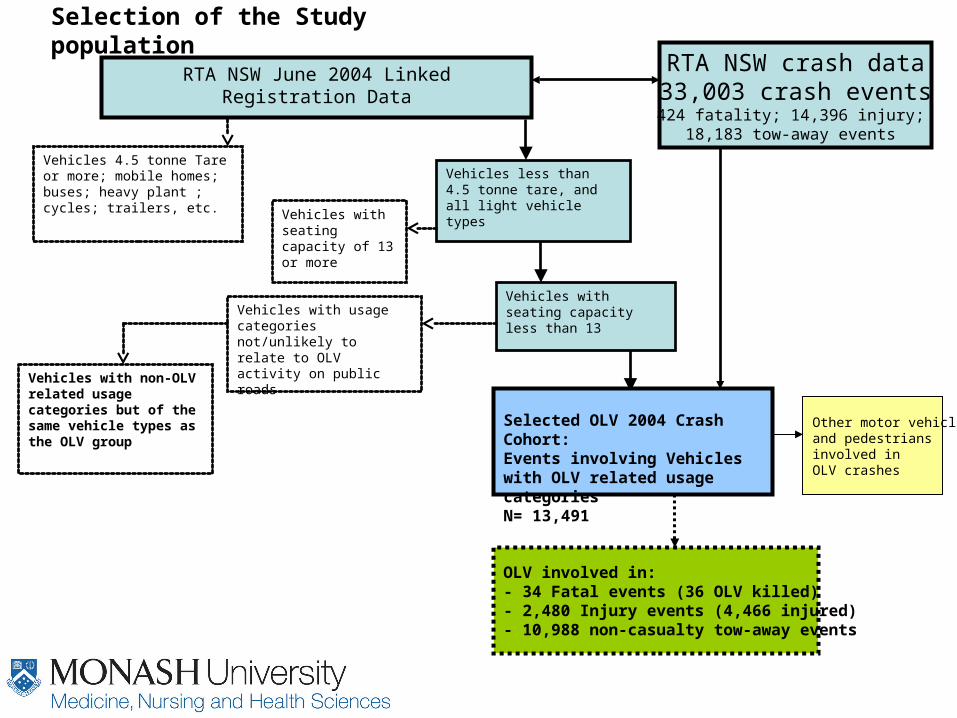
Vehicles less than 4.5 tonne tare, and all light vehicle types
Vehicles 4.5 tonne Tare or more; mobile homes; buses; heavy plant ; cycles; trailers, etc. Vehicles with
seating capacity of 13 or more
Vehicles with seating capacity less than 13Vehicles with usage
categories not/unlikely to relate to OLV activity on public roads
Vehicles with non-OLV related usage categories but of the same vehicle types as the OLV group Selected OLV 2004 Crash Cohort:
Events involving Vehicles with OLV related usage categoriesN= 13,491
RTA NSW June 2004 Linked Registration Data
Selection of the Study population
RTA NSW crash data33,003 crash events
424 fatality; 14,396 injury; 18,183 tow-away events
OLV involved in:- 34 Fatal events (36 OLV killed)- 2,480 Injury events (4,466 injured)- 10,988 non-casualty tow-away events
Other motor vehiclesand pedestrians involved in OLV crashes
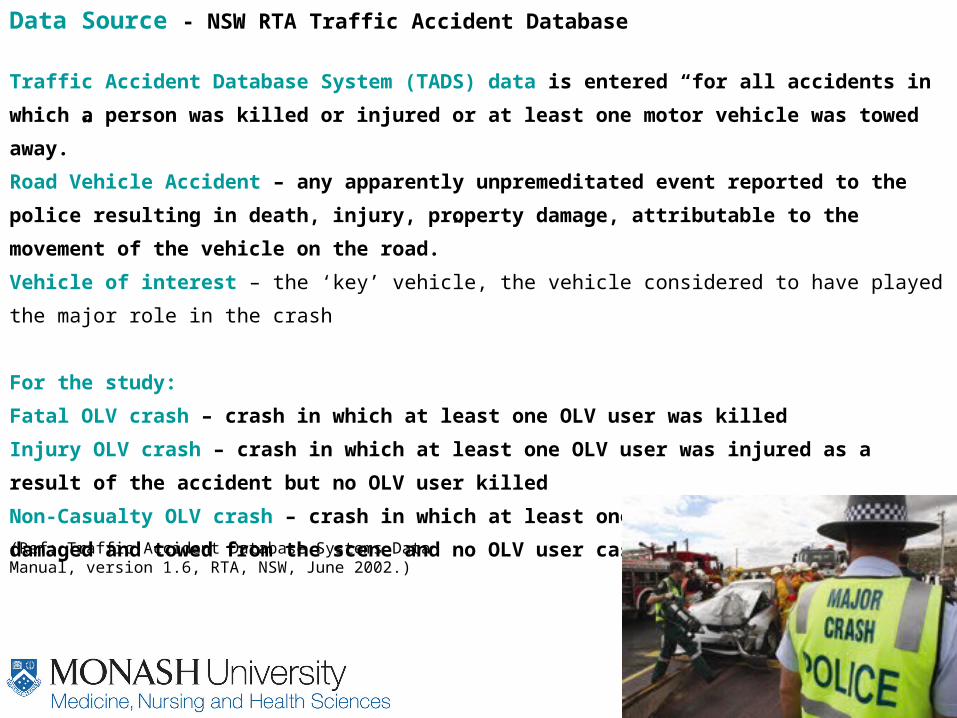
Data Source - NSW RTA Traffic Accident Database
Traffic Accident Database System (TADS) data is entered “for all accidents in which a person was
killed or injured or at least one motor vehicle was towed away.”
Road Vehicle Accident – any apparently unpremeditated event reported to the police resulting in
death, injury, property damage, attributable to the movement of the vehicle on the road.”
Vehicle of interest – the ‘key’ vehicle, the vehicle considered to have played the major role in the crash
For the study:
Fatal OLV crash – crash in which at least one OLV user was killed
Injury OLV crash – crash in which at least one OLV user was injured as a result of the accident but
no OLV user killed
Non-Casualty OLV crash – crash in which at least one OLV was involved and was damaged and
towed from the scene and no OLV user casualties resulted
(Ref: Traffic Accident Database Systems Data Manual, version 1.6, RTA, NSW, June 2002.)

• Females 1.8 times more likely to be casualty if in crash (P<0.000, CI 1.67-2.03)
• Males 2.5 times more likely to die if in casualty crash than females
(2.03; P<0.057, CI 0.15-1.02)
• Key vehicle user 16.4 times more likely to die if in casualty crash (P<0.000, CI 3.9-68.4)
• 13% of OLV population female registrants / 18% of fatalities & 37% injuries female OLV users
• 84% of OLV population male registrants / 82% of fatalities & 61% injuries male OLV users
• OLV user casualty mean age around 10 years younger than registrants
Users

(Users continued)
• Tired driver 3 times more likely to be casualty if in crash; and
• 9.1 times more likely to die if casualty in crash (P<0.000, CI 2.44-3.65; P0.000, CI 4.48-18.5)
• Tired farmer 6.1 times more likely to be casualty if in crash (P<0.000, CI 2.9-13.1)
• Tired sole-trader 3.8 times more likely to be casualty if in crash (P<0.000, CI 2.65-
5.448)
• Speeding drivers 2.4 times more likely to be a casualty if in crash, and
• 3.1 more likely to die if casualty (P<0.000, CI 1.5-3.9; P<0.086, CI 0.9-11.4)
• Non-seat belt user 1.6 times more likely to be casualty if crash; (P<0.000, CI 1.25-
1.97)
• if non-seat belt farmer 11.6 times more likely to be casualty; (P<0.002, CI 2.5-53.9)
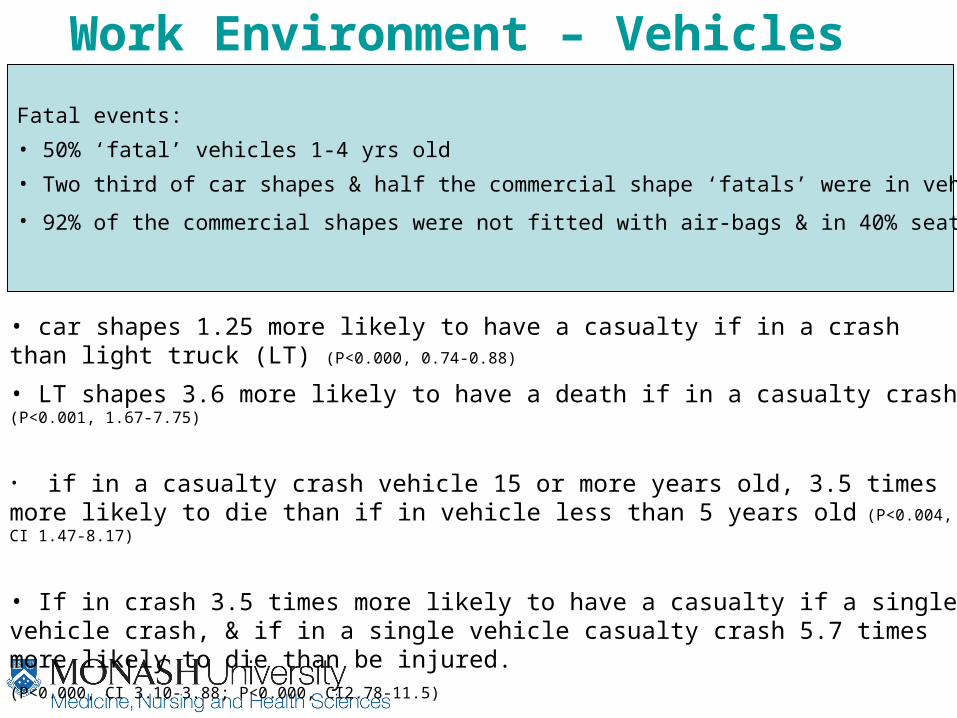
Work Environment – Vehicles
• car shapes 1.25 more likely to have a casualty if in a crash than light truck (LT) (P<0.000,
0.74-0.88)
• LT shapes 3.6 more likely to have a death if in a casualty crash (P<0.001, 1.67-7.75)
• if in a casualty crash vehicle 15 or more years old, 3.5 times more likely to die than if in vehicle less than 5 years old (P<0.004, CI 1.47-8.17)
• If in crash 3.5 times more likely to have a casualty if a single vehicle crash, & if in a single vehicle casualty crash 5.7 times more likely to die than be injured.
(P<0.000, CI 3.10-3.88; P<0.000, CI2.78-11.5)
Fatal events:
• 50% ‘fatal’ vehicles 1-4 yrs old
• Two third of car shapes & half the commercial shape ‘fatals’ were in vehicles 5 or more years old.
• 92% of the commercial shapes were not fitted with air-bags & in 40% seat belt not worn/fitted

Work Environment – Vehicles
OLV Users in Fatal events:
• 28% fatalities not wearing seat belt
• 6% ill or asleep at time of crash
• 42% assessed with error factors
• 39% assessed as ‘fatigued”
• 30% fatal crashes occurred after 10.00pm & before 5.00am
• 65% fatalities alone in vehicle
OLV Crash Outcome by Vehicle Shape
0
10
20
30
40
50
60
70
80
Fatality Injury Non-Casualty
%
Commercial Shapes
Car Shapes
Likelihood of death as an outcome if in a Hilux, Rodeo or Triton light truck compared to all other vehicle models = 7.12 P<0.000, CI 3.62-14.26
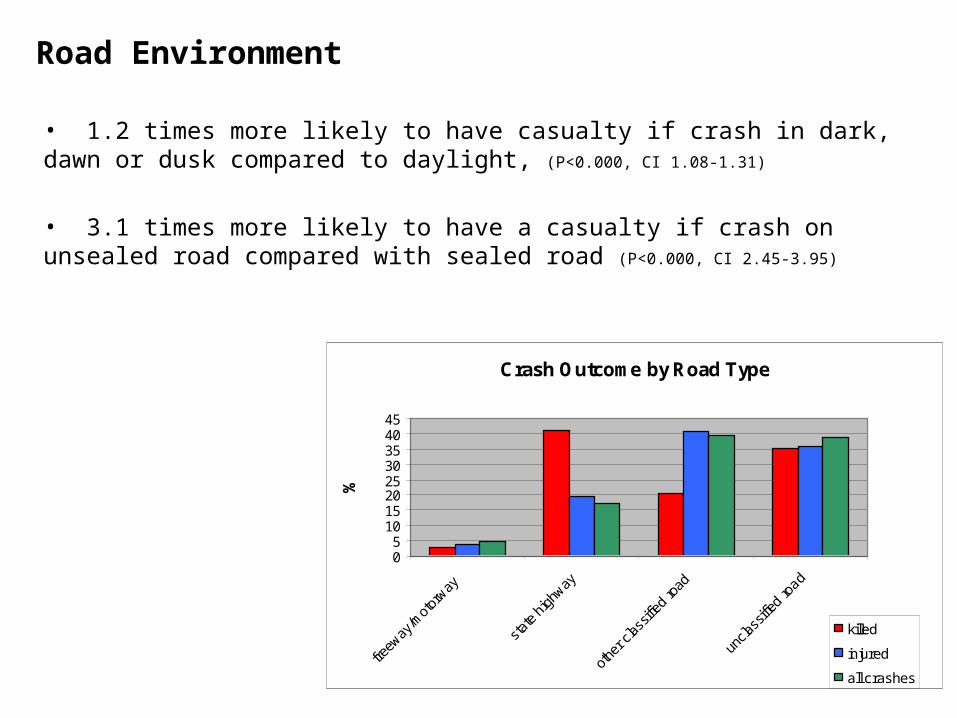
Road Environment
Crash Outcome by Road Type
05
1015202530354045
freew
ay/m
otor
way
stat
e hi
ghway
othe
r clas
sified
road
uncla
ssifie
d road
%
killed
injured
all crashes
• 1.2 times more likely to have casualty if crash in dark, dawn or dusk compared to daylight, (P<0.000, CI 1.08-1.31)
• 3.1 times more likely to have a casualty if crash on unsealed road compared with sealed road (P<0.000, CI 2.45-3.95)
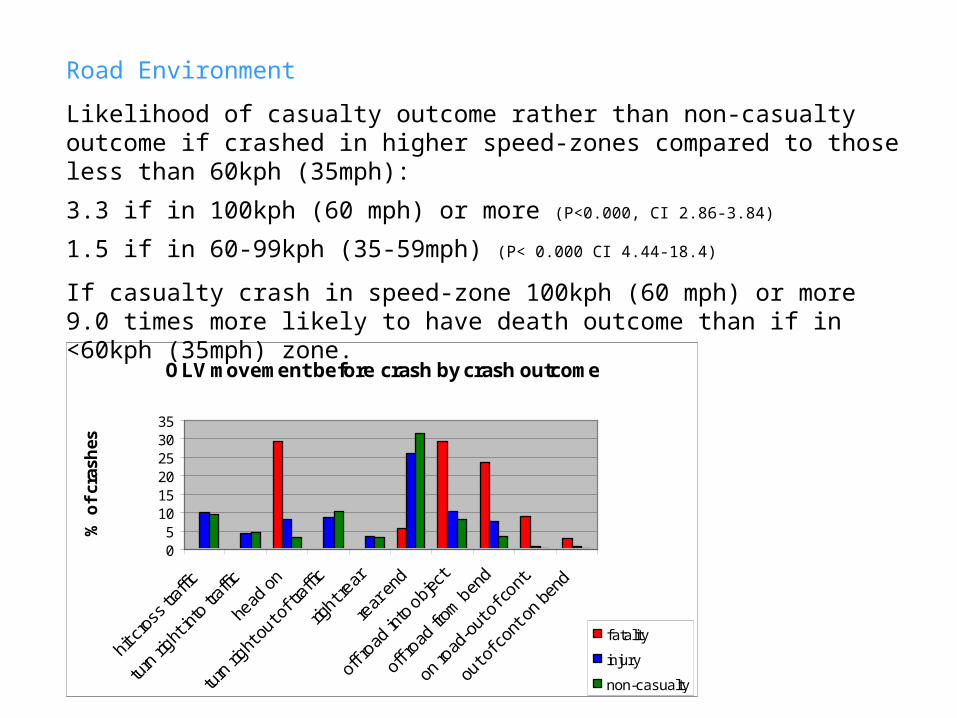
OLV movement before crash by crash outcome
05
101520253035
hit cr
oss t
raffic
turn
right
into
traffic
head
on
turn
right
out o
f tra
ffic
right r
ear
rear
end
off r
oad in
to o
bject
off r
oad fr
om b
end
on ro
ad-o
ut o
f cont.
out o
f con
t on
bend
% o
f cr
ash
es
fatality
injury
non-casualty
Road Environment
Likelihood of casualty outcome rather than non-casualty outcome if crashed in higher speed-zones compared to those less than 60kph (35mph):
3.3 if in 100kph (60 mph) or more (P<0.000, CI 2.86-3.84)
1.5 if in 60-99kph (35-59mph) (P< 0.000 CI 4.44-18.4)
If casualty crash in speed-zone 100kph (60 mph) or more 9.0 times more likely to have death outcome than if in <60kph (35mph) zone.
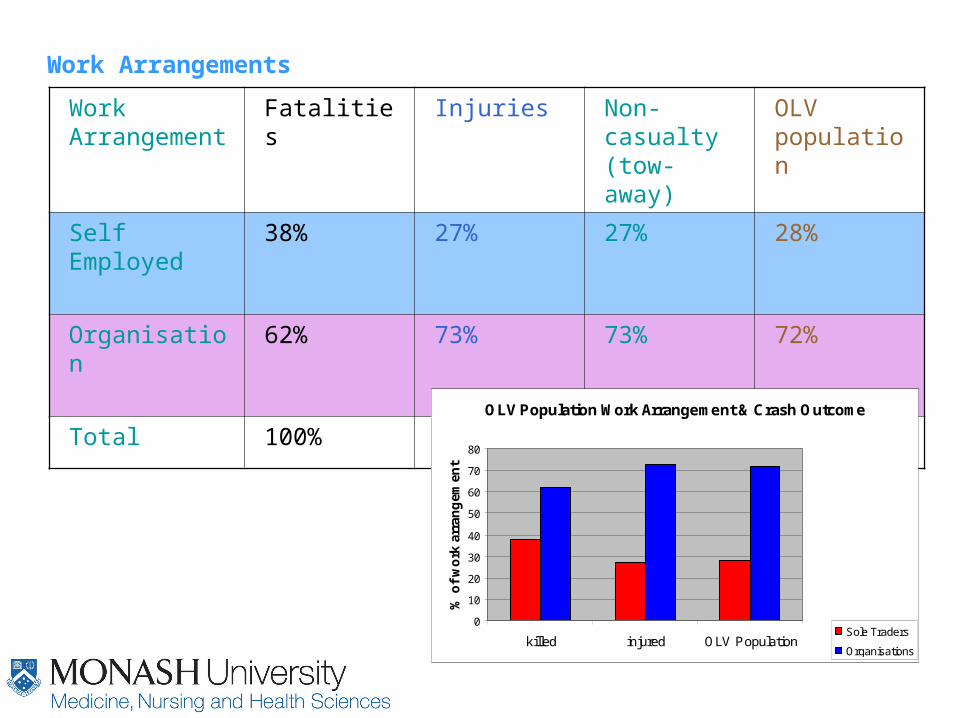
Work Arrangements
Work Arrangement
Fatalities Injuries Non-casualty (tow-away)
OLV population
Self Employed 38% 27% 27% 28%
Organisation 62% 73% 73% 72%
Total 100% 100% 100% 100%
OLV Population Work Arrangement & Crash Outcome
0
10
20
30
40
50
60
70
80
killed injured OLV Population
% o
f w
ork
arr
ang
emen
t
Sole Traders
Organisations
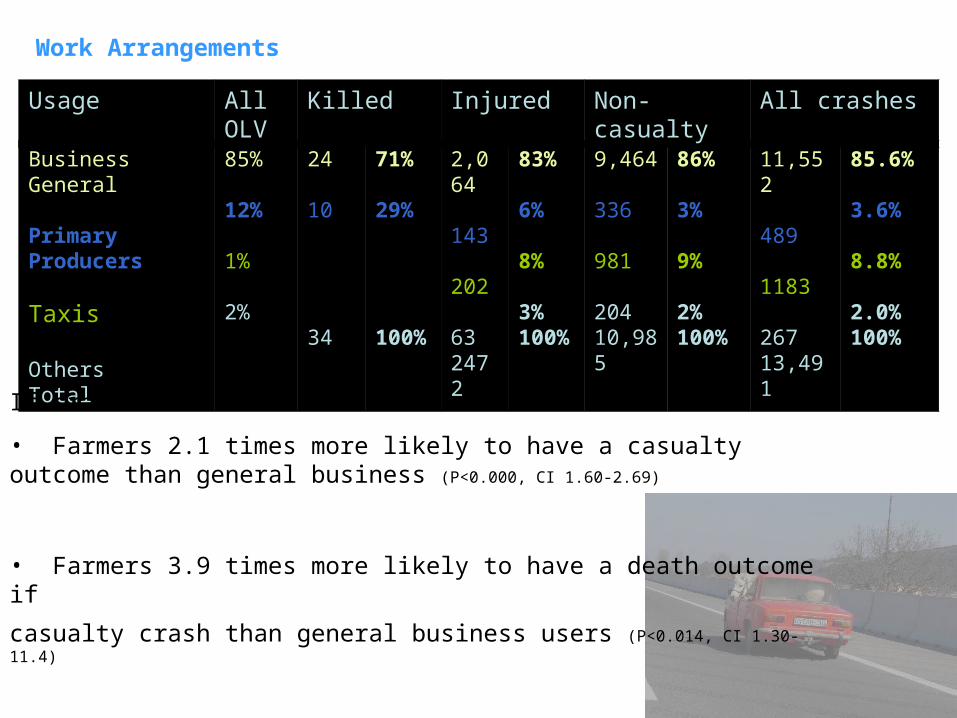
Business General Primary Producers Taxis Others Total
85%
12%
1%
2%
24
10
--
34
71%
29%
--
100%
2,064
143
202
632472
83%
6%
8%
3%100%
9,464
336
981
20410,985
86%
3%
9%
2%100%
11,552
489
1183
26713,491
85.6%
3.6%
8.8%
2.0%100%
Usage All OLV
Killed Injured Non-casualty All crashes
Work Arrangements
If crashed:
• Farmers 2.1 times more likely to have a casualty outcome than general business (P<0.000, CI 1.60-2.69)
• Farmers 3.9 times more likely to have a death outcome if
casualty crash than general business users (P<0.014, CI 1.30-11.4)

Crash Outcome by Fleet Size
05
1015202530354045
1 ve
hicle
2-5
vehic
les
6-10
veh
icles
11-1
00 v
ehicl
es
100
- 499
vehi
cles
500-
4999
vehi
cles
5000
+
No of Vehicles in Fleet
%
Fatality
Injury
Tow-away
• 69% of all OLV are in fleets of 2 or less vehicles
• Taxis travel up to 189,000km annually• 57% of casualty taxi events involved self employed registrations • 68% of self-employed registered OLV taxi casualties wore seatbelts compared to 48% of organisation registered taxis

Study Strengths & Limitations
Limitations:
• Data reliant on police reporting
• No accurate exposure data available
• No drug or alcohol or other potentially criminally related data available
• Conservative estimates
Strengths
• Census rather than a sample
• Lot of new OLV-use related information
• Strengthened by use of OLV population data to give access to work arrangement information

Data Source &Time Period Data cover Fatalities Reported
Fatality Incidence
OLV Population &OLV Crash data2004
Light vehicle types – NSW only – used substantively for work purposes
34 5.3/100,000 OLV registrations
NSW CSB -July 03-June 04.
All vehicle types – NSW only – road traffic injury - worker on duty claims
25 Not known
ASCC-NOSI 2-NDSJuly 03-June 04.
Light vehicle types – Australia wide all claims except commuting
28 0.3/100,000 workers
ASCC -NDS-July 03-June 04.
Australia wide all claims except commuting
74 Not known
NDS: July 03-June 04. Australia wide all claims except commuting
49 Not known
NF: July 03-June 04. Australia wide all claims except commuting
7 Not known
NCIS: July 03-June 04. Australia wide all claims except commuting
51 Not known
To underpin OLV related policy and further improve our understanding of OLV users, their injury burden and their risk factors we require identification of:
• the at-risk OLV-user population;
• OLV crashes distinct from those of other road vehicle users;
• OLV road-use activity as work-related at the time of the MVC; and
• the OLV crash risk factors.
This could be assisted by:
• the use of vehicle registration data as a proxy for the OLV-user population
• the addition of vehicle usage purpose categories to light vehicle registration
• the addition of questions by investigators of OLV crashes about vehicle type,
usage purpose and users-work arrangements