Iraq: the transatlantic debate Occasional Papers - European Union

Occasional Paper Series
No. 6 / September 2014
1 Banque Nationale de Belgique
2 European Securities and Markets Authority 3 Banca d’Italia 4 UK Prudential Regulation Authority
5 European Securities and Markets Authority
6 European Central Bank
7 Sveriges Riksbank
8 Banque Centrale du Luxembourg 9, 10 Secretariat of the European Systemic Risk Board
Securities financing transactions and
the (re)use of collateral in Europe
An analysis of the first data collection conducted by the ESRB from a sample of European banks and agent lenders
Joachim Keller (Chair)1
Antoine Bouveret2
Cristina Picillo3
Zijun Liu4
Julien Mazzacurati5
Philippe Molitor6
Jonas Söderberg7
John Theal8
Francesco de Rossi9
Romain Calleja10

Occasional Paper No. 6 September 2014 Securities financing transactions and the (re)use of collateral in Europe An analysis of the first data collection conducted by the ESRB from a sample of European banks and agent lenders
2
Contents
Executive Summary ................................................................................................................................ 3
A. Introduction and policy background .............................................................................................. 6
A.1. Financial stability risks of SFTs markets .................................................................................. 6 A.2. Policy background ................................................................................................................... 7 A.3. Scope of the ESRB data collection .......................................................................................... 8
B. Sources and uses of securities collateral ...................................................................................... 10
B.1. The set‐up of the data collection .......................................................................................... 10 B.2. Overall collateral market view .............................................................................................. 12 B.3. Interconnectedness and network structure ......................................................................... 21 B.4. Structural differences across banks ...................................................................................... 26
C. The re‐investment of cash collateral ............................................................................................ 37
C.1. The set‐up of the data collection .......................................................................................... 37 C.2. Market overview: Assets and securities lending .................................................................. 38 C.3. Market overview: Collateral received and cash reinvestment ............................................. 40 C.4. Redemption and liquidity risks ............................................................................................. 42 C.5. Currency mismatch ............................................................................................................... 49
D. Conclusion .................................................................................................................................... 51
Appendix A: Legal and accounting background on SFTs ...................................................................... 55
Appendix B: List of sample institutions and possible classifications .................................................... 57
Appendix C: List of team members ....................................................................................................... 58
E. References .................................................................................................................................... 59

Occasional Paper No. 6 September 2014 Securities financing transactions and the (re)use of collateral in Europe An analysis of the first data collection conducted by the ESRB from a sample of European banks and agent lenders
3
Executive Summary
Securities financing transaction (SFT) markets and the management and usage of collateral are
elements of the financial system which are of systemic relevance. As such, there is a clear need
for enhanced transparency and regulatory oversight. The European Systemic Risk board (ESRB)
mandated a task force to identify the potential risks related to SFTs in Europe and to develop
policy proposals to better monitor any vulnerabilities identified by the analysis. This report
presents the results of two data collection exercises that were conducted to gain some initial
insights into the structure of the SFT market and the correlated practices adopted by market
participants concerning the re‐investment or the re‐use of the collateral sourced through SFTs
or via equivalent transactions. A description of this landscape is, in fact, crucial as a first step in
assessing the risks emanating from the cash and securities collateral markets and their potential
implications for macro‐prudential policy in Europe.
By providing a description of the SFT landscape, the data collection exercises undertaken by the
ESRB have a macro‐prudential dimension in that they provide data at an aggregated level. The
first data collection exercise encompassed a sample of 38 EU banks, representing approximately
60% of the EU banking system’s total assets. The institutions covered by this sample are the
main players in the management of securities collateral. The second data collection targeted 13
agent lenders that are considered to be the largest re‐investors of cash collateral in Europe. The
sample period of the data is fixed at the end of February 2013.
The ESRB templates yielded a unique set of data on the sources and use of securities collateral
(non‐cash collateral) by banks, as well as on the re‐investment of cash collateral by agent
lenders. The data collections were intended to fit in the broader policy context initiated by the
Financial Stability Board (FSB) and the resulting analyses ultimately address a number of the
FSB’s recommendations. The first element of the analysis in this report is specifically related to
the FSB’s fourth recommendation (disclosure of collateral management activities) (FSB, 2013)
and, to a certain extent, to the first recommendation (authorities to collect granular information
on SFTs of large international financial institutions). The second element is similarly related to
the first of the FSB’s recommendations, but also the sixth, which requests better disclosure of
securities lending activities. The analysis contained thereafter is relevant for the European
Commission’s proposal on the reporting of SFTs to trade repositories (EC, 2014), which will
greatly enhance transparency and regulatory oversight of SFT activities in the European Union.
Finally, the report is in line with the ESRB’s outline of a monitoring framework (ESRB, 2013).
The main findings of the report can be summarised as follows:
i) Data collection on sources and use of securities collateral at EU credit institutions
Widespread reliance on SFTs by banks and non‐banks
‐ Collateral flows to and from banks amount to some 15% of their total balance sheet. In
terms of instruments, SFTs account for the largest part of securities collateralised

Occasional Paper No. 6 September 2014 Securities financing transactions and the (re)use of collateral in Europe An analysis of the first data collection conducted by the ESRB from a sample of European banks and agent lenders
4
transactions, namely 88% of collateral posted (€4.6 trillion). More specifically, collateral
from repos accounts for 70% of total collateral flows, while collateral from securities
lending amounts to 18%. Looking at the type of securities received as collateral, the banks
in the sample exhibit extensive reliance on government debt (61% of total collateral
received and posted). Equities (13%) and debt securities issued by financial institutions
(8%) are the second and third most used type of securities collateral.
Collateral re‐use
‐ Approximately 94% of securities collateral received by the banks is eligible for re‐use,
illustrating the fungible nature of collateral. A calculation method using collateral volumes
posted by asset owners and an estimate of the share of own versus collateral received of
collateral posted shows that the banks re‐use collateral once on average, i.e. the collateral
re‐use factor (multiplier) is 2. The inability of surveyed institutions to report on their re‐use
of collateral is one significant drawback. This inability seems to suggest that i) the
(generally fungible) collateral is pooled and, when re‐used, cannot be traced back to the
collateral received; ii) institutions’ risk management systems may, at the current moment,
not enable them to assess their own re‐use on a consolidated basis.
Cross‐institutional exposures and network structures (interconnectedness)
‐ In absolute terms, SFTs are mostly conducted between banks and, to a lesser extent,
through central counterparties (CCPs). Unsurprisingly, considering net collateral flows,
central banks and money market funds (MMFs) stand out as net receivers of collateral
(they help fund the banking sector) and hedge funds as net providers of collateral (to
banks, through their prime brokerage activities). The network structure of institutions in
the sample reveals only limited interconnectedness between the institutions. In addition,
there are relatively few institutions (i.e. three CCPs and six of the banks in the sample) that
are involved in 30% of the total volume of collateral exchanged, which is suggestive of a
certain degree of concentration. However, these institutions show well‐diversified
exposures to their counterparties.
Collateral and maturity transformation
‐ In relation to the assessment of liquidity and maturity mismatches and collateralisation
practice, evidence of repo use suggests that institutions build liquid asset buffers, as they
trade in higher amounts of liquid assets than they trade out. On average, the maturity
profile of banks’ repo trades seems prudent (they minimise the maturity of cash lent but
maximise that of cash borrowed). However, if there is no evidence of liquidity risk, on
aggregate, in the repo business, at micro level a significant proportion of institutions
incur in some liquidity risk, although with a limited maturity “mismatch” expressed in
number of days.

Occasional Paper No. 6 September 2014 Securities financing transactions and the (re)use of collateral in Europe An analysis of the first data collection conducted by the ESRB from a sample of European banks and agent lenders
5
ii) Data collection on re‐investment of cash collateral
Based on the data analysis, this report contends that there is some evidence of potential
systemic risks and vulnerabilities in the European Union, originating from securities lending
transactions and the reinvestment of cash collateral. In reference to the financial stability risks
in securities lending and repo markets identified by the FSB, in terms of “pure shadow banking
risks” there is the following evidence:
Facilitation of credit growth and build‐up of leverage
- EU securities lending markets contribute to and aid the facilitation of credit growth and
the build‐up of leverage in the financial system in two main ways. Firstly, they allow some
agent lenders to obtain funding easily against their own assets (the total value of cash
collateral received by agent lenders in our sample against securities on loan amounts to
€609.6 billion). Secondly, cash collateral obtained from securities lending transactions is
typically reinvested in reverse repos (65%), thereby contributing towards an increased
reliance on short‐term funding, or debt.
Maturity transformation
- Agent lenders engage in a significant amount of maturity transformation, which may give
rise to both redemption and liquidity risk.
Interconnectedness
- The significant exposures built across the different types of financial institutions (e.g.
custodians, asset managers, credit institutions and insurances) clearly contribute to the
formation of possible contagion channels and associated risks. For agent lenders who
typically lend securities on behalf of clients and who engage in a securities lending
transaction with another institution and reinvest the cash collateral in reverse repos with
yet another entity, the resulting risks from a high degree of interconnectedness could
become material.
Currency mismatch
- There seems to be a limited overall risk from currency mismatch related to securities
lending. The vast majority of securities loaned, cash collateral received and instruments in
which the collateral is reinvested is denominated in one of the major currencies (USD, EUR,
GBP, JPY, etc.). This suggests limited sensitivity to currency risk or foreign exchange
volatility. In addition, the share of each of these currencies in each of the three stages
identified above is broadly stable, suggesting that mismatch is limited. At the individual
institution level, however, there might be some degree of currency mismatch
concentration.

Occasional Paper No. 6 September 2014 Securities financing transactions and the (re)use of collateral in Europe An analysis of the first data collection conducted by the ESRB from a sample of European banks and agent lenders
6
A. Introduction and policy background
In view of the interconnected nature of the global financial system and the difficulty in
disentangling shadow banking from traditional banking activities, there is an increased need for
enhanced transparency and regulatory oversight of areas which may give rise to systemic risk.
One important area relates to securities financing transaction (SFT) markets and, more broadly,
the usage of cash and securities collateral.
The European System Risk Board (ESRB) mandated a task force to identify the potential risks
related to SFTs in Europe and to develop proposals for monitoring such risks. This report,
prepared by the task force, is a very first step towards a monitoring framework and sets out the
results of two data collections that were conducted with a view to testing reporting and
disclosure templates and gaining some initial insights into cash and securities collateral markets.
The two data collections focused on the sources and usage of securities collateral at larger EU
credit institutions and on the reinvestment of cash collateral by major EU agent lenders.
The remainder of the introduction (Section A) describes the background and illustrates the
broader policy context in which the data collections took place. Part B presents the results of
the data collection on the usage of securities collateral, while Part C concentrates on the results
of the data collection and on the re‐investment of cash collateral. Part D offers a summary of
the main conclusions.
A.1. Financial stability risks of SFT markets1
A wide range of market participants, including credit institutions, pension funds, insurance
companies, asset managers, broker dealers and investment firms, enter into SFTs (i.e. repo and
securities lending transactions) to obtain financing, invest cash or borrow specific securities,
underscoring the importance of these transactions from a macro‐prudential policy perspective.
The money‐like assets used in SFTs usually enhance liquidity in securities markets and money
markets by supporting price discovery and they may also contribute to reducing settlement
failures.
Despite their ability to enhance liquidity and their use as funding instruments, SFTs may also
give rise to financial stability risks. In assessing the causes of the financial crisis, the Financial
Stability Board (FSB) identified SFTs as a potential source of vulnerabilities that can lead to risks
to the normal operation and effective functioning of the international financial system. As
outlined in ESRB (2013), the financial stability risks that are relevant from a macro‐prudential
perspective are: (i) the facilitation of credit growth (both inside and outside the banking
1 For more discussion about SFTs and, in general, the financial stability risks of SFTs, see FSB (2013) and
ESRB (2013).

Occasional Paper No. 6 September 2014 Securities financing transactions and the (re)use of collateral in Europe An analysis of the first data collection conducted by the ESRB from a sample of European banks and agent lenders
7
system), (ii) the pro‐cyclicality of financial system leverage, (iii) maturity and liquidity
transformation (both inside and outside the banking system), (iv) interconnectedness and
contagion channels (v) collateral fire‐sale and concentration, and (vi) currency mismatches.
From a supervisory perspective, the lack of data on SFTs and the absence of comprehensive
prudential oversight compound the concerns about the financial stability risks. Indeed, the
source of these risks is related to the less stringent supervision of, and oversight requirements
for, those activities that are not captured under the umbrella of prudential regulation, which
was established to control for the risks of bank‐based credit intermediation. Moreover, the
complicated nature of shadow banking activities results in an ill‐defined boundary between
banking and shadow banking activities, which complicates policy responses and raises
methodological questions for disentangling such activities, particularly with respect to large
banks that engage in a wide range of activities, including traditional (i.e. deposit‐based) and
market‐based credit intermediation.
Thus, SFT activities remain relatively opaque from a prudential regulation perspective. In this
context, policy proposals need to be not only comprehensive but proportional to the level of
risk, addressing both the pure shadow banking risks and those related to shadow banking
activities conducted by financial institutions.2
A.2. Policy background
In August 2013 the FSB published a comprehensive set of thirteen policy recommendations for
addressing shadow banking risks in SFTs (FSB, 2013). The very first recommendation of the FSB,
which states that “SFT data gaps need to be filled by collecting more granular data on securities
lending and repo exposures amongst large and internationally active financial institutions”, aims
to improve authorities’ understanding of risks related to shadow banking through improved
transparency and data collection, specifically on SFTs.
Within the European Union, the ESRB has published a report that identifies the data needed to
enhance the assessment of financial stability risks arising from SFT markets and presents various
options by which authorities can collect such data for a comprehensive assessment of risks,
including trade repositories (ESRB, 2013).
2 The FSB decomposes the risks related to SFTs into two categories: (i) pure shadow banking risks (i.e.
maturity and liquidity transformation outside the banking sector, the build‐up of excessive leverage
outside the reach of prudential regulation and risks from securities lending cash collateral reinvestment)
and (ii) risks that span both banking and shadow banking activities (such as the pro‐cyclicality of system
leverage, collateral fire sales, asset re‐hypothecation, interconnectedness from the re‐use of collateral
and collateral valuation practices).

Occasional Paper No. 6 September 2014 Securities financing transactions and the (re)use of collateral in Europe An analysis of the first data collection conducted by the ESRB from a sample of European banks and agent lenders
8
In January 2014 the European Commission published a regulatory proposal designed to increase
the transparency of SFTs3. The Commission’s proposal builds on the approach adopted for OTC
derivatives (EMIR)4, envisaging the daily reporting of SFTs to a trade repository. The reported
data shall be made available to competent EU and national authorities (transparency towards
authorities) for monitoring risks originating in SFTs markets. The proposal also includes
provisions of transparency towards final investors. It stipulates that all undertakings for the
collective investment in transferable securities (UCITS) and alternative investment fund
managers should inform investors about the use they make of SFTs in their regular reporting
and in pre‐investment documents, and the disclosure of risks, as well as the explicit agreement
of collateral providers before their assets can be re‐hypothecated. Once passed into law, this
will constitute a major step forward in achieving enhanced transparency of SFTs in the European
Union and in bridging a number of the information gaps identified in this field having relevance
to macro‐prudential monitoring and policy.5
A.3. Scope of ESRB data collection
Against the backdrop of the importance of financial stability risks and the currently significant
gaps in SFT market data, this report constitutes a first but important step towards a better
understanding of the risks related to SFTs and collateral usage in Europe.
Indeed, the FSB has urgently recommended that authorities should collect more granular data
to enhance their monitoring capabilities and their assessment of vulnerabilities and systemic
risks related to the shadow banking system, in particular as regards SFTs. However, the effective
reporting of SFTs to trade repositories in the European Union would probably not start before
2017. Supervisory authorities may therefore be required to implement transitional measures to
collect granular data and to monitor the trends and developments in European SFT markets.
Such measures could also help to enhance supervisory authorities' expertise in assessing
financial stability risks in SFT markets, thereby contributing to the establishment of the EU
monitoring framework based on highly frequent and granular reporting to trade repositories.
Specifically, the ESRB has collected data on the sources and re‐use of securities collateral by
banks and the re‐investment of cash collateral by agent lenders. The first topic is directly related
3 European Commission proposal for a regulation of the European Parliament and of the Council on
reporting and transparency of securities financing transactions, COM(2014) 40 final, 29.1.2014.
4 Regulation (EU) No 648/2012 of the European Parliament and of the Council of 4 July 2012 on OTC
derivatives, central counterparties and trade repositories.
5 The EC proposal is in line with FSB recommendations 1, 2, 5 and 7 (highly granular and frequent
reporting of SFTs, enhanced disclosures to fund investors and disclosure of re‐hypothecation to
counterparties under contractual obligation).

Occasional Paper No. 6 September 2014 Securities financing transactions and the (re)use of collateral in Europe An analysis of the first data collection conducted by the ESRB from a sample of European banks and agent lenders
9
to the fourth recommendation of the FSB and gathers information on collateral flows at banks
not only associated with SFTs but also with other instruments (such as derivatives). The second
topic is related to the sixth of the FSB’s recommendations, which calls for better disclosure of
securities lending activities. The data collection of the ESRB takes a macro‐prudential
perspective in that it analyses the data at an aggregated level to provide some initial input to an
assessment of systemic risk‐relevant factors.
The data collection exercise was conducted between June and September 2013 on a sample of
38 EU banks (equivalent to 60% of the EU banking system’s total assets), which are the main
players in the management of securities collateral, and 13 agent lenders, which are considered
to be the largest EU re‐investors of cash collateral.6
The institutions were asked to provide data on their collateral flows at two specific points in
time (the end of November 2012 and the end of February 2013). The ESRB’s objective was to
obtain some broad information on trends while avoiding potential problems related to window
dressing or extraordinary conditions that could distort the information on one of the two
chosen reporting dates. However, the results do not exhibit significant differences between the
two points in time, so all data shown in this report are as at the end of February 2013.
6 The data collections focused only on credit institutions and agent lenders in the respective data
collection samples to capture the largest possible share of the market while keeping the administrative
burden low. In addition, the focus on agent lenders in the data collection is also warranted due to the
specific risk arising from the fact that agent lenders act on behalf of beneficial owners (see FSB, 2012).
Future data collections may comprise a wider set of addressees, such as a wider range of investment
funds or pension funds and insurance companies.

Occasional Paper No. 6 September 2014 Securities financing transactions and the (re)use of collateral in Europe An analysis of the first data collection conducted by the ESRB from a sample of European banks and agent lenders
10
B. Sources and uses of securities collateral
B.1. The data collection set-up
The ESRB collected the data on the sources and use of collateral through the use of a set of
templates addressed to a sample of relevant European credit institutions.
B.1.1. The template structure
The set of templates on the re‐use of securities collateral covers the topic from a two angles: (i)
the collateral that the reporting institution receives and (ii) the collateral that it posts. Chart 1
provides a schematic overview of the template structure.
Chart 1: Schematic template overview
Both collateral inflows and collateral outflows were collected by instrument type. The specific
instruments for which the data was requested included repo and securities lending, as well as
derivative transactions in which an institution either receives or posts (for central counterparty,
CCP, and non‐CCP cleared derivatives) collateral. The template also asked about client assets
that could be re‐used and for collateral posted to cover short sales. Other information
requested related to whether collateral received is eligible for re‐use and whether collateral
posted is effectively being re‐used.
The templates also requested information on the type of collateral received and posted, as well
as the type of counterparty for transactions involving the reception or posting of collateral. In
terms of counterparties, the templates required the reporting institutions to provide the
amount of collateral inflows and outflows by counterparty sector and information on collateral
flows with their 15 most important counterparties.
Collateral received
-by collateral type
-by type of counterparty
-largest counterparties & collateral issuers
Collateral posted
-by collateral type
-by type of counterparty
-largest counterparties & collateral issuers
Reverse Repos
Margin lending against client assets
Firm
Repos
CCPs
Securities lending
OTC derivatives
Securities borrowing
OTC derivatives
Short sales
Reverse Repos
Margin lending against client assets
Securities lending
OTC derivatives
Firm
Repos
CCPs
Securities borrowing
OTC derivatives
Short sales
Reverse Repos
Margin lending against client assets
Securities lending
OTC derivatives

Occasional Paper No. 6 September 2014 Securities financing transactions and the (re)use of collateral in Europe An analysis of the first data collection conducted by the ESRB from a sample of European banks and agent lenders
11
B.1.2. The sample
The 38 banking institutions to which the templates were addressed account for €28.2 trillion of
total assets and represent more than 60% of the total assets of the EU banking sector. The
analysis presented in this report has used both the aggregate sample data and different
classifications of the sample banks in an attempt to identify structural differences between
them. Given the information collected on the banks in the sample (size, geographic location,
business model,7 global systemically important banks (G‐SIB) buckets8), multiple permutations
of the data can be made. Table 1 shows the number of institutions and total assets for three
types of classification. Appendix B shows a further split using combinations of the different
dimensions. The report also uses for part of the analysis a further distinction between euro area
banks by distinguishing between banks from countries not exposed to sovereign tensions
(“Group A banks”) and those from countries exposed to sovereign debt strains (“Group B
banks”, see also Appendix B).
Table 1: Classification of sample banks Classification dimension Characteristic # Banks Total asset volume
(€ billions) Geographic Euro area 22 15,9
Scandinavia 3 1,4
UK 13 10,9
Business model Commercial 11 5,3
Diversified 19 19,0
Investment 8 3,9
G‐SIB Bucket 3 or 4 6 13,4
Bucket 1 or 2 14 8,1
Non G‐SIB 18 6,7
Total 38 28,2
7 The allocation by business model is based on both supervisory judgment and a quantitative analysis of
indicators of retail (loans to customers and the importance of customer deposits), wholesale (loans to
banks) and investment banking activities (derivative and trading activities). Banks with mainly retail
activities are classified as commercial banks; banks with retail and wholesale (and investment) banking
activities as diversified banks. Investment banks are banks that have low retail and wholesale but mainly
investment banking activities.
8 The allocation of G‐SIBs to buckets reflects their required level of additional loss absorbency
(http://www.financialstabilityboard.org/publications/r_121031ac.pdf).

Occasional Paper No. 6 September 2014 Securities financing transactions and the (re)use of collateral in Europe An analysis of the first data collection conducted by the ESRB from a sample of European banks and agent lenders
12
B.2. Overall collateral market view
This section summarises the information at the aggregated sample level. It provides information
on collateral flows, broken up by instrument and by type of collateral, and estimates on the
degree of re‐use and the “velocity” of collateral, and on the maturity “transformation” achieved
through SFTs and other collateralised instruments.
B.2.1. Overall levels and segmentation by instruments
Based on the data collected, the sample institutions received a total of roughly €4 trillion of
securities collateral and posted roughly €4.6 trillion in securities collateral across all types of
instrument. The amounts of collateral received and collateral posted amount to 14.1% and
16.2% of total assets respectively (see Chart 2).
Chart 2: Collateral inflows and outflows, total assets, sample aggregate (€ trillions)
External source of data: Bankscope for total assets.
Table 2 shows the volume of collateral received and posted through the various instruments.
SFTs (i.e. repos and securities lending) account for roughly 88% of all collateral received and
83% of all collateral posted, illustrating that the bulk of collateral flows are associated with SFTs.
The comparison of the repo volumes calculated from the data templates with those provided by
the ICMA repo survey shows that this data collection covers the European repo market to a very
large extent.9
9 To estimate the coverage of the repo market, we compared our data on repo transactions with numbers
reported in the ICMA Repo Survey. To estimate the size of the repo market in Europe, ICMA regularly asks
a sample of 61 financial institutions in Europe for the value of their outstanding repo contracts. ICMA
reported outstanding repo transactions (repo and reverse repo transactions) in Europe of €6.08 trillion in
June 2013 and €5.5 trillion in December 2012. The data set used for this report comprises outstanding
3.97 4.58
28.19
14.1%16.2%
0%
5%
10%
15%
20%
25%
30%
0
5
10
15
20
25
30
In Out Total assets
Total Amount (left-hand scale) % of total assets (right-hand scale)
Occasional Paper No. 6 September 2014 Securities financing transactions and the (re)use of collateral in Europe An analysis of the first data collection conducted by the ESRB from a sample of European banks and agent lenders
13
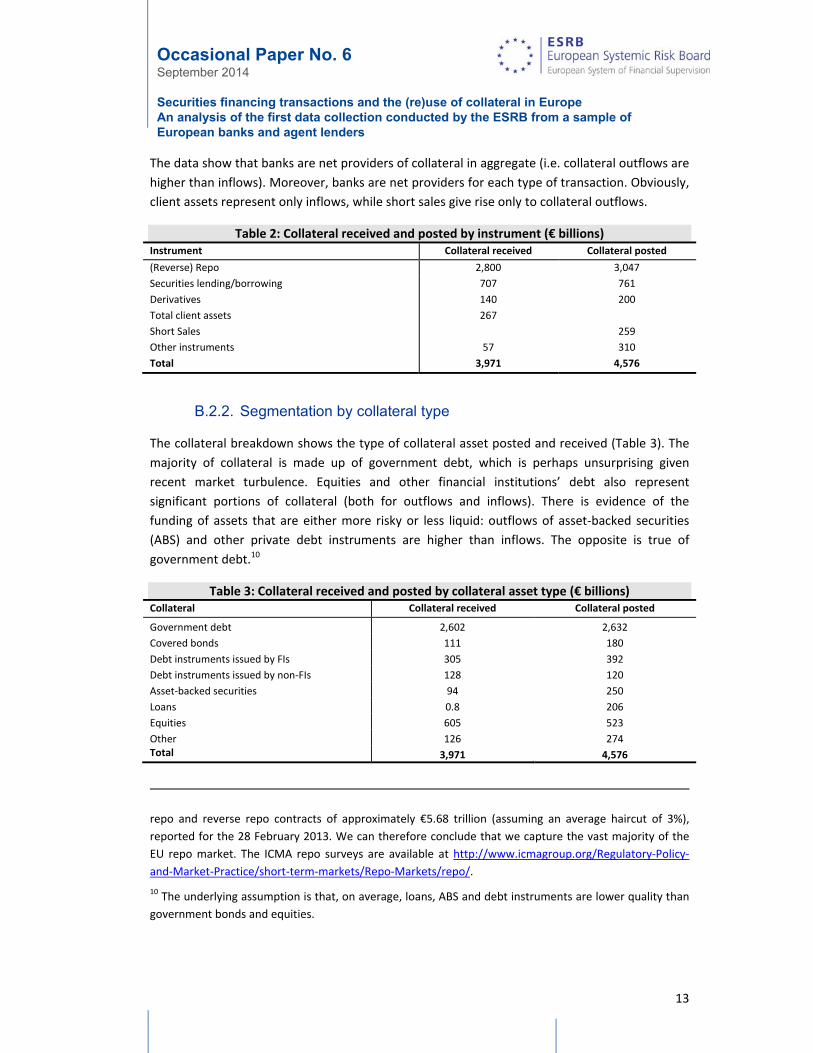
The data show that banks are net providers of collateral in aggregate (i.e. collateral outflows are
higher than inflows). Moreover, banks are net providers for each type of transaction. Obviously,
client assets represent only inflows, while short sales give rise only to collateral outflows.
Table 2: Collateral received and posted by instrument (€ billions) Instrument Collateral received Collateral posted
(Reverse) Repo 2,800 3,047
Securities lending/borrowing 707 761
Derivatives 140 200
Total client assets 267
Short Sales 259
Other instruments 57 310
Total 3,971 4,576
B.2.2. Segmentation by collateral type
The collateral breakdown shows the type of collateral asset posted and received (Table 3). The
majority of collateral is made up of government debt, which is perhaps unsurprising given
recent market turbulence. Equities and other financial institutions’ debt also represent
significant portions of collateral (both for outflows and inflows). There is evidence of the
funding of assets that are either more risky or less liquid: outflows of asset‐backed securities
(ABS) and other private debt instruments are higher than inflows. The opposite is true of
government debt.10
Table 3: Collateral received and posted by collateral asset type (€ billions) Collateral Collateral received Collateral posted
Government debt 2,602 2,632
Covered bonds 111 180
Debt instruments issued by FIs 305 392
Debt instruments issued by non‐FIs 128 120
Asset‐backed securities 94 250
Loans 0.8 206
Equities 605 523
Other 126 274 Total 3,971 4,576
repo and reverse repo contracts of approximately €5.68 trillion (assuming an average haircut of 3%),
reported for the 28 February 2013. We can therefore conclude that we capture the vast majority of the
EU repo market. The ICMA repo surveys are available at http://www.icmagroup.org/Regulatory‐Policy‐
and‐Market‐Practice/short‐term‐markets/Repo‐Markets/repo/.
10 The underlying assumption is that, on average, loans, ABS and debt instruments are lower quality than
government bonds and equities.

Occasional Paper No. 6 September 2014 Securities financing transactions and the (re)use of collateral in Europe An analysis of the first data collection conducted by the ESRB from a sample of European banks and agent lenders
14
Analysing the data collected on the most important issuers of collateral allows a more granular
look at the collateral composition. A total of 250 unique issuers of collateral were identified.
Around 55% of total collateral exchanged was issued by the largest 15 collateral issuers.
Governments (82%) and government sponsored enterprises (GSEs; the “mortgage” category,
7%, consist mainly of loans guaranteed by them) are the main issuers of collateral received and
posted by reporting entities (see Chart 3).11 US government debt accounts for 20% of all
government debt, while the UK (14%), Germany (14%) and France (9%) are other important
issuers of government debt. Note that these countries also enjoyed relatively low credit default
swap (CDS) spreads on their debt at the time of the data collection. Italy (8%), Japan (4%) and
Spain (4%) follow in the order of the most important issuers of government debt used as
collateral. Credit institutions are the third largest type of issuers of collateral (4%). Half of the
collateral issued by credit institutions is issued by those countries most affected by sovereign
risk tensions.
Chart 3: Collateral received from and posted to the top 15 counterparties
Collateral posted Collateral received
Excess of collateral
Posted ▼ ▼ Received
11 Note that the top 15 data may not exhibit the same proportion of collateral. For instance, equity is an
important collateral overall but does not appear much in the top 15 data. An explanation could be that
securities lending transactions, which mainly use equity (see below), are smaller in size or conducted with
different counterparties, hence they do not show up in the top 15 data.

Occasional Paper No. 6 September 2014 Securities financing transactions and the (re)use of collateral in Europe An analysis of the first data collection conducted by the ESRB from a sample of European banks and agent lenders
15
Collateral received exceeds collateral posted for securities issued by US, German and Japanese
governments. The opposite can be observed for government bonds issued by Italy and Spain.
This corroborates the notion of the funding of “risky” assets, as discussed above, for the banks
in the sample, while it indicates the opposite for the other credit institutions and the other
counterparty types.
Looking more closely at the collateral composition of repos and securities lending transactions,
the data show that securities lending transactions involve mainly equities and government debt.
The collateral composition of repos matches relatively closely that of the top 15 counterparties,
which is not surprising given the large volume of repos.12
In line with the observation of SFTs as a funding tool, the evidence on collateral transformation,
i.e. the institutions post collateral of lower quality and receive collateral of higher quality, shows
up also in these types of transaction.
B.2.3. Re-use of collateral
Collateral can be re‐used if provided under “title transfer collateral arrangements” or under
“security collateral arrangements” with a right of use (see Annex A). This part of the analysis
discusses the information on re‐use as provided by the banks and contains an estimate of a re‐
use factor of collateral.
Re‐use eligibility
Table 4 shows the ratio of collateral eligible for re‐use to total collateral received. Clearly, the
eligibility rate is very high for repos and securities lending transactions, which are typically
transfer‐of‐title agreements and thus give full right of use to the receiver. Client assets under a
fixed charge (i.e. security interest) are often less eligible to be re‐used, as this is subject to the
client's agreement, i.e. the client has to grant the right of use to the prime broker. Since SFTs
represent the largest part of collateralised transactions, banks can potentially freely re‐use most
of their collateral. Thus, there is limited scope for institutions to change or restrict the re‐use of
collateral.
12 The fact that equity does not show up in the top counterparty data may be an indication that securities
lending transactions are smaller in size and/or are conducted with a wider/less concentrated set of
counterparties.

Occasional Paper No. 6 September 2014 Securities financing transactions and the (re)use of collateral in Europe An analysis of the first data collection conducted by the ESRB from a sample of European banks and agent lenders
16
Table 4: Collateral received and posted by instrument (€ billions) Instrument Collateral received Collateral received
eligible for re‐use Eligibility (%)
(Reverse) Repo 2,800 2,754 98%
Securities lending/borrowing 709 699 99%
Derivatives 140 115 82%
Total client assets 267 124 46%
Other instruments 57 36 63%
Total 3,971 3,729 94%
Re‐use at the institution level
Overall, it appears that the institutions had difficulties in providing information on whether
banks posted their own assets as collateral or whether they re‐used collateral received from
elsewhere.13 This can be partly explained by the fungibility of collateral (see Appendix A), but a
reporting at the aggregate level must be possible, as banks need to make an allocation of their
collateral stock (e.g. based on underlying maturity). Note that, under the upcoming European
Financial Reporting guidelines on asset encumbrance, the reporting of re‐usage will be
mandatory.14 There is thus evidence that banks’ risk management systems are currently not yet
sufficiently developed to fulfil these guidelines.
A proxy for collateral re‐use is obtained by comparing the collateral received that is eligible for
re‐use with the own unencumbered assets of an institution.15 If the volume of collateral
received eligible for re‐use is very high compared with own unencumbered assets, it is very
likely that the institution will re‐use its collateral (provided that the institution has high net
collateral outflows). Chart 4 shows this information for the institutions that have provided the
information on own unencumbered assets.16 There is considerable variation: for example, on
average, the amount of collateral received is 145% of unencumbered assets.
13 Only one of 38 institutions in the sample reported how much of its collateral posted is actually re‐used.
14 See the European Banking Authority’s final draft technical standards on asset encumbrance, available at
http://www.eba.europa.eu/regulation‐and‐policy/supervisory‐reporting/draft‐implementing‐technical‐
standard‐on‐supervisory‐reporting‐asset‐encumbrance‐
15 Unencumbered assets are the own assets of an institution that can be freely used as collateral.
16 Only a subset of the reporting entities has provided their level of unencumbered assets.

Occasional Paper No. 6 September 2014 Securities financing transactions and the (re)use of collateral in Europe An analysis of the first data collection conducted by the ESRB from a sample of European banks and agent lenders
17
Chart 4: Collateral received eligible for re‐use vs. own unencumbered assets (€ billions)
Note: Collateral received and own unencumbered assets are shown on the right‐hand side, while the ratio
collateral/assets is shown on the left‐hand side.
Re‐use at the aggregate level
Another way to estimate the re‐use of collateral is to calculate a re‐use factor of collateral using
the aggregate flows of collateral in an out of the banking system as described by Singh (2011).
As shown in Box 1, based on this methodology, the collateral “velocity” (Singh’s terminology)
was determined to be 3.5. Such a figure implies that collateral is re‐used, on average, 2.5 times.
There are, however, various methods to calculate the re‐use of collateral at the aggregate level
and no robust standard has yet been established. As shown in the Box, the use of a different
calculation method yields a re‐use factor of 2, implying that collateral is re‐used only once.
Box 1: Estimate of collateral re‐use
Singh (2011) defines the velocity of collateral as total collateral received divided by primary
sources of collateral. The primary sources of collateral identified in Singh (2011) include hedge
funds and collateral received via securities lending from pension funds, insurance companies,
asset managers, etc. Singh (2011) estimated that the collateral re‐use factor (multiplier) was
around 3 at the end of 2007, and 2.4 at the end of 2010.
2013
where primary sources of collateral include collateral received from hedge funds and via
securities lending.
Note that only collateral received that is eligible for re‐use is included in the definition above. In
the rest of the section, we use collateral eligible for re‐use only unless otherwise specified.
Based on this methodology, we can calculate a collateral re‐use factor as follows. At the end of
February 2013, the total amount of collateral received by sample banks was €3.7 trillion. The
0%
50%
100%
150%
200%
250%
300%
350%
400%
450%
0
50
100
150
200
250
300
Bank 1 Bank 2 Bank 3 Bank 4 Bank 5 Bank 6 Bank 7 Bank 8 Bank 9 Bank 10 Bank 11 Bank 12
Collateral received eligible for re-use Own unencumbered assets Collateral /assets

Occasional Paper No. 6 September 2014 Securities financing transactions and the (re)use of collateral in Europe An analysis of the first data collection conducted by the ESRB from a sample of European banks and agent lenders
18
total amount of collateral received by sample banks from primary sources (as defined in Singh,
2011) was €1.1 trillion, of which €0.4 trillion was from hedge funds and €0.7 trillion was via
securities lending. The collateral re‐use factor is 3.5.17
However, it is worth noting that the collateral re‐use factors calculated in Singh (2011) and
using the ESRB data may not be directly comparable. For example, in Singh (2011), the total
amount of collateral received is based on a sample of 10‐14 large global banks, but the amount
of collateral received from hedge funds and via securities lending is based on industry‐wide
statistics, which may lead to the underestimation of the collateral re‐use factor.
In addition, given the granularity of the ESRB dataset, the collateral re‐use factor could be
calculated in a number of different ways:
a) Using a wider definition of primary sources of collateral. For example, this could include
collateral received not only from hedge funds but also other asset managers, insurance
companies, pension funds and non‐financial corporations.
b) Using total collateral posted (including collateral not eligible for re‐use but excluding short‐
sales), rather than received, in the numerator. This is because, conceptually, banks receive
collateral from primary sources and post collateral to meet various demands.
c) Taking own‐account assets into account. Since banks may post collateral using own‐account
assets, rather than by re‐using collateral received, the Singh (2011) definition may
overestimate the collateral multiplier. Based on the ESRB data, the average amount of
collateral received is 145% of unencumbered assets, suggesting that only 60% of collateral
posted is sourced by re‐using collateral received on average.
where primary sources of collateral include collateral received from counterparties other
than central banks, credit institutions and CCPs, and total collateral posted by re‐using
collateral received is defined as total collateral posted multiplied by the percentage of
collateral posted sourced by re‐using collateral received.
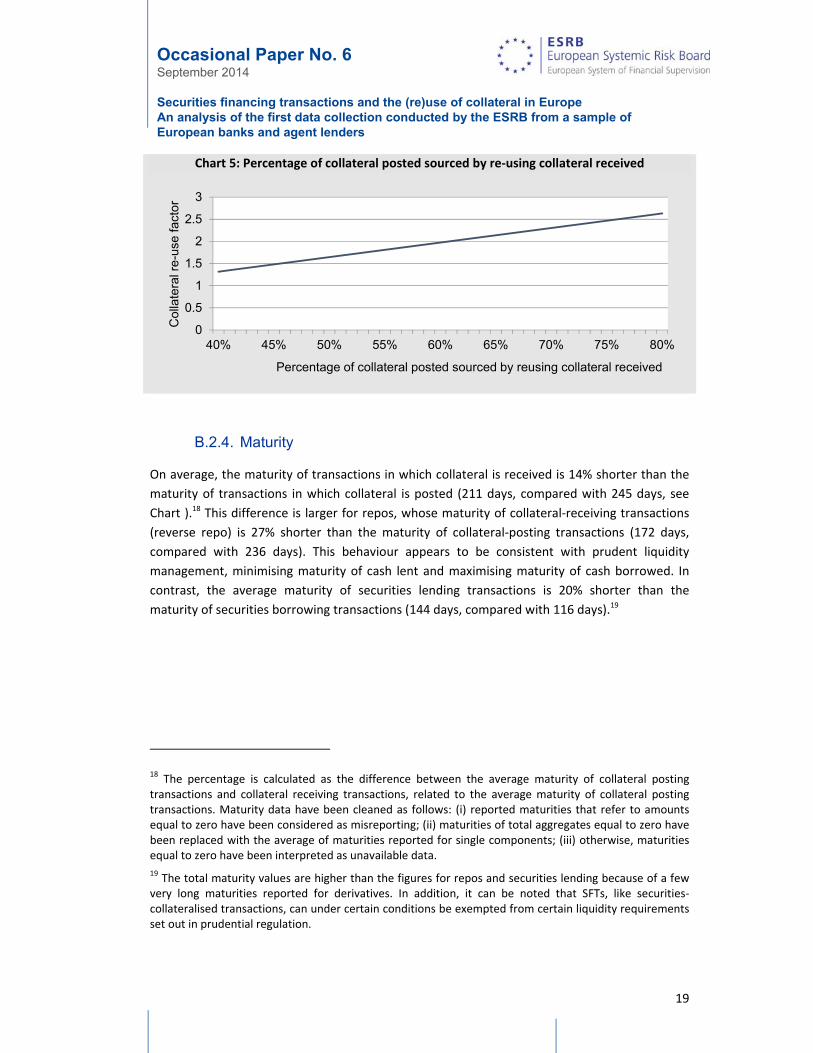
Based on the changes above, the estimated collateral re‐use factor is illustrated in the chart
below. We can see that, assuming 60% of collateral posted is sourced by re‐using collateral
received, the collateral re‐use factor is around 2.
17 The collateral multiplier is not exactly equal to the fraction calculated by using the numbers provided in
the text due to rounding.
Occasional Paper No. 6 September 2014 Securities financing transactions and the (re)use of collateral in Europe An analysis of the first data collection conducted by the ESRB from a sample of European banks and agent lenders
19
Chart 5: Percentage of collateral posted sourced by re‐using collateral received
B.2.4. Maturity
On average, the maturity of transactions in which collateral is received is 14% shorter than the
maturity of transactions in which collateral is posted (211 days, compared with 245 days, see
Chart ).18 This difference is larger for repos, whose maturity of collateral‐receiving transactions
(reverse repo) is 27% shorter than the maturity of collateral‐posting transactions (172 days,
compared with 236 days). This behaviour appears to be consistent with prudent liquidity
management, minimising maturity of cash lent and maximising maturity of cash borrowed. In
contrast, the average maturity of securities lending transactions is 20% shorter than the
maturity of securities borrowing transactions (144 days, compared with 116 days).19
18 The percentage is calculated as the difference between the average maturity of collateral posting transactions and collateral receiving transactions, related to the average maturity of collateral posting transactions. Maturity data have been cleaned as follows: (i) reported maturities that refer to amounts equal to zero have been considered as misreporting; (ii) maturities of total aggregates equal to zero have been replaced with the average of maturities reported for single components; (iii) otherwise, maturities equal to zero have been interpreted as unavailable data.
19 The total maturity values are higher than the figures for repos and securities lending because of a few very long maturities reported for derivatives. In addition, it can be noted that SFTs, like securities‐collateralised transactions, can under certain conditions be exempted from certain liquidity requirements set out in prudential regulation.
0
0.5
1
1.5
2
2.5
3
40% 45% 50% 55% 60% 65% 70% 75% 80%
Col
late
ral r
e-us
e fa
ctor
Percentage of collateral posted sourced by reusing collateral received

Occasional Paper No. 6 September 2014 Securities financing transactions and the (re)use of collateral in Europe An analysis of the first data collection conducted by the ESRB from a sample of European banks and agent lenders
20
Chart 6: Average maturity (totals, repo and securities lending)
Note: In the analysis, only those reporting entities that have reported maturities both for the lending and for the
borrowing side have been taken into account.
The dispersion by individual reporting entity shows that a relevant portion of banks engages in a
limited maturity mismatch, which appears consistent with prudent liquidity management
practices (see Chart ). In the case of repo transactions, 55% of the reporting entities report a
longer maturity of collateral receiving transactions (reverse repos and liquidity investment)
compared with the maturity of collateral posting transactions (repos and liquidity rising).
However, the average maturity mismatch is limited (approximately 25 days).
Chart 7: Dispersion of maturity mismatch across reporting entities (repo and securities lending, in days)
245 236
116
211
172
144
-
50
100
150
200
250
300
total repo securities lending
days
transactions in which collateral is posted
transactions in which collateral is received
number of 38 36 28 banks
0
50
100
150
200
250
300
‐ 50 100 150 200 250 300
average maturity of transactions (collateral is
posted
)
average maturity of transactions (collateral is received)
RepoSecurities…

Occasional Paper No. 6 September 2014 Securities financing transactions and the (re)use of collateral in Europe An analysis of the first data collection conducted by the ESRB from a sample of European banks and agent lenders
21
B.3. Interconnectedness and network structure
This section investigates the flow of collateral between the sample institutions and their
counterparties. The data provide an overview of counterparties aggregated at sector level
(covering the entire sample) and of direct counterparties (the “top 15”), with the result that
both cross‐sector linkages and direct inter‐institution exposure can be analysed.
B.3.1. Cross-sector linkages
Chart shows the collateral flows between the aggregate sample of banks and counterparty
sectors. Clearly, a large part of collateralised transactions take place between banks. CCPs also
play an important role. In terms of net collateral flows, central banks, money market funds and
hedge funds are most important. Central banks and MMFs provide funding to the banking
sector and take collateral, while hedge funds are large net providers of collateral to banks.20
Chart 8: Collateral inflows and outflows of sample institutions by counterparty sector (€ billions)
The picture looks similar if the focus is only on SFTs and client assets, as they account for the
largest part of collateral flows. Basically, the results in terms of net providers and takers hold
(see Chart ).
20 It should be noted that the level of collateral posted to central banks is likely to be understated; for example, the amount of collateral posted by euro area banks to the ECB amounted to more than €2,180 billion domestically (http://www.ecb.europa.eu/stats/payments/securities/html/coll1.en.html).
‐500
‐400
‐300
‐200
‐100
0
100
200
300
400
500
‐1500
‐1000
‐500
0
500
1000
1500
Centralbanks
Creditinstitutions
MMFs Non‐MMFIFs andother Fis
Hedgefunds
ETFs CCPs Insurance& pension
NFCs Other
In (LHS) Out (LHS) Net In (RHS)

Occasional Paper No. 6 September 2014 Securities financing transactions and the (re)use of collateral in Europe An analysis of the first data collection conducted by the ESRB from a sample of European banks and agent lenders
22
Chart 9: Collateral received and posted by counterparty sector (SFTs and client assets, € billions)
Note: Positive flows denote collateral received, negative flows denote collateral posted.
The results confirm the observations made through a number of studies on SFTs. Bilateral repos
between banks represent the largest share of the repo market, although CCP‐cleared repos also
account for a significant share.
Investment funds other than MMFs are quite active in SFT/collateral markets, while exchange‐
traded funds (ETFs) are surprisingly inactive.21 Pension funds and insurance companies, as well
as non‐financial corporations, are relatively small players in SFT markets. The two boxes below
shed additional light on the flows between banks and CCPs and between banks and hedge
funds, respectively.
Box 2: Securities flows to and from CCPs
One of the difficulties in assessing the securities collateral flows is to understand the nature of
the CCP flows in our data sample. From the data received we cannot easily differentiate
between those flows that represent pure margin calls to a CCP (either initial or variation
21 This may be due to a reporting inconsistency. Specifically, addressees may have reported data for the subcategory ETFs in the investment fund category. For reasons of robustness, one may thus consider all non‐ MMF investment funds together (with the exception of hedge funds data, which seem to be reported in a more reliable way).
‐1500
‐1000
‐500
0
500
1000
1500
CBs CIs MMFs IFs HFs ETFs CCPs IC&PF NFC Other
(Reverse) Repo (Reverse) Repo SL SL Derivatives Derivatives
Total Client assets Total Client assets Short Sales Short Sales Other instruments Other instruments

Occasional Paper No. 6 September 2014 Securities financing transactions and the (re)use of collateral in Europe An analysis of the first data collection conducted by the ESRB from a sample of European banks and agent lenders
23
margins) and those flows that represent a transaction leg (i.e. the securities leg of a repo
transaction). This picture is even less clear when CCPs invest their cash margin in reverse repos,
thus receiving securities collateral in return.
At the aggregate level, flows from and to CCPs as counterparties are roughly even – with a very
slightly higher securities collateral outflow. From discussions with industry representatives, it is
known that initial margin is still partially posted in cash given that CCPs are largely seen as safe
havens (variation margin is posted purely in cash and would thus not feature in this data
collection). This could explain the relatively slim margin between securities collateral outflows
of banks to CCPs (for margin calls, reverse repo transactions with the CCP and cleared repos via
the CCP) and securities collateral inflows of banks from CCPs (receiving the securities leg from a
cleared repo transaction).
More importantly, it would appear that, in our sample, the pure size of the repo clearing
business is such that the reverse repo business conducted with CCPs and the margin calls posted
in securities to CCPs pale in comparison. The latter issue is further exemplified by looking at the
absolute figures obtained from the data sample that breaks counterparty data down into
transaction types. The most interesting data shows the following magnitudes:
Table 5: Collateral flows between banks and CCPs (€ billions) Received from CCPs Posted to CCPs
(Reverse) Repo 829.2 867.6 Securities lending/borrowing 40.5 31.9
Derivatives 1.5 27.6 Other instruments (incl. short sales) 1.5
The CCP assumes an effectively flat position in cleared repo transactions, excluding the margin it
would charge – the difference in inflows and outflows for cleared repo transactions (from the
bank’s, i.e. clearing member’s, perspective) would thus constitute either the securities margin
received on the repo transactions (unless this is accounted for elsewhere) or the securities leg
of a repo transaction with the CCP itself (i.e. a reverse repo from the perspective of the CCP).
The differences in volume thus become apparent: the margin on derivative transactions (€27.6
billion) represents a mere 2.9% of total outflows towards a CCP. The difference between inflows
and outflows, i.e. the share representing outflows for margin on repo transactions or repo flows
with the CCP as a counterparty, which stands at €29.8 billion (net outflows towards a CCP –
derivative margin outflows) represents only 3.2% of total outflows. These data clearly show the
systemic relevance of the cleared repo business to the financial markets, in that it represents a
vast amount of the total collateral flows in the financial system.
The data on the top 15 counterparties engaged in both providing and receiving collateral give
some additional insights into the character of the cross‐sector linkages in terms of institution‐
level concentration. In total, around 450 unique counterparties have been identified among the

Occasional Paper No. 6 September 2014 Securities financing transactions and the (re)use of collateral in Europe An analysis of the first data collection conducted by the ESRB from a sample of European banks and agent lenders
24
top 15 counterparties of each reporting bank, suggesting a vast network. Transactions with the
top 15 counterparties of each reporting bank account for about 50% of the total exchange of
collateral captured by the exercise.
The breakdown of all counterparties reported in the top 15 list by sample institutions shows
that CCPs (35%) and credit institutions (34%) are the main counterparties. While exposure to
CCPs is concentrated on three entities, exposure to credit institutions is much less concentrated
(224 entities). Non‐MMFs (12%) and central banks (9%) are respectively the third and fourth
largest counterparties.
On an aggregate level, the 15 most important counterparties across the sample account for
more than 30% of total collateral volume exchanged. Consequently, those top 15 entities are
good candidates for being the hubs of the collateral network.
Chart 10: Counterparty breakdown of top 15 counterparties
Box 3: Network analysis
This box analyses the structure of the network based on total net exposures. To facilitate the
analysis, the datasets on collateral posted and collateral received have been merged. All
exposures have been netted bilaterally and therefore do not differentiate between different
types of collateral.
We analyse both the aggregate network, i.e. total exposures, as well as the network of the most
important firms. First, we plot the network for the aggregated network (see Chart a). We then
apply Duffie’s (2011) proposal to measure systemic risk exposures in a 10by10by10 approach. In
short the first “ten” refers to the ten biggest market participants, the second “ten” to their
biggest exposures and the third “ten” to a set of key risk factors, which could also capture
behavioural responses such as fire sales. For methodological reasons we focus on the first two
tens, i.e. core firms and their counterparties.

Occasional Paper No. 6 September 2014 Securities financing transactions and the (re)use of collateral in Europe An analysis of the first data collection conducted by the ESRB from a sample of European banks and agent lenders
25
The methodology is as follows. The nodes represent the participants in the market for securities
lending, while the edges represent their netted exposures. The size of the nodes is proportional
to the square root of the sum of all netted bilateral exposures (net collateral received + net
collateral posted) within the network depicted. The width of the link represents the size of the
bilateral net exposure.
Chart 11: Network analysis
Overall, the (preliminary) analysis indicates a comparatively low degree of interconnectedness
in the network. First, in comparison with what is observed for OTC derivatives,22 the credit
institutions in the network have a smaller number of bilateral links. Second, several of the
counterparties that exchange the larger amount of collateral, as either recipients or providers,
seem not to have links with one another (see Chart b). This is in stark contrast to the CDS
market, where the “G14” dealers are very closely connected. Third, the network is also clearly
populated with non‐bank entities (e.g. CCPs and central banks) that appear among the ten more
active counterparties.
22 See Peltonen et al. (2013) for evidence on CDS exposures.
Occasional Paper No. 6 September 2014 Securities financing transactions and the (re)use of collateral in Europe An analysis of the first data collection conducted by the ESRB from a sample of European banks and agent lenders
26
B.3.2. Counterparty concentration
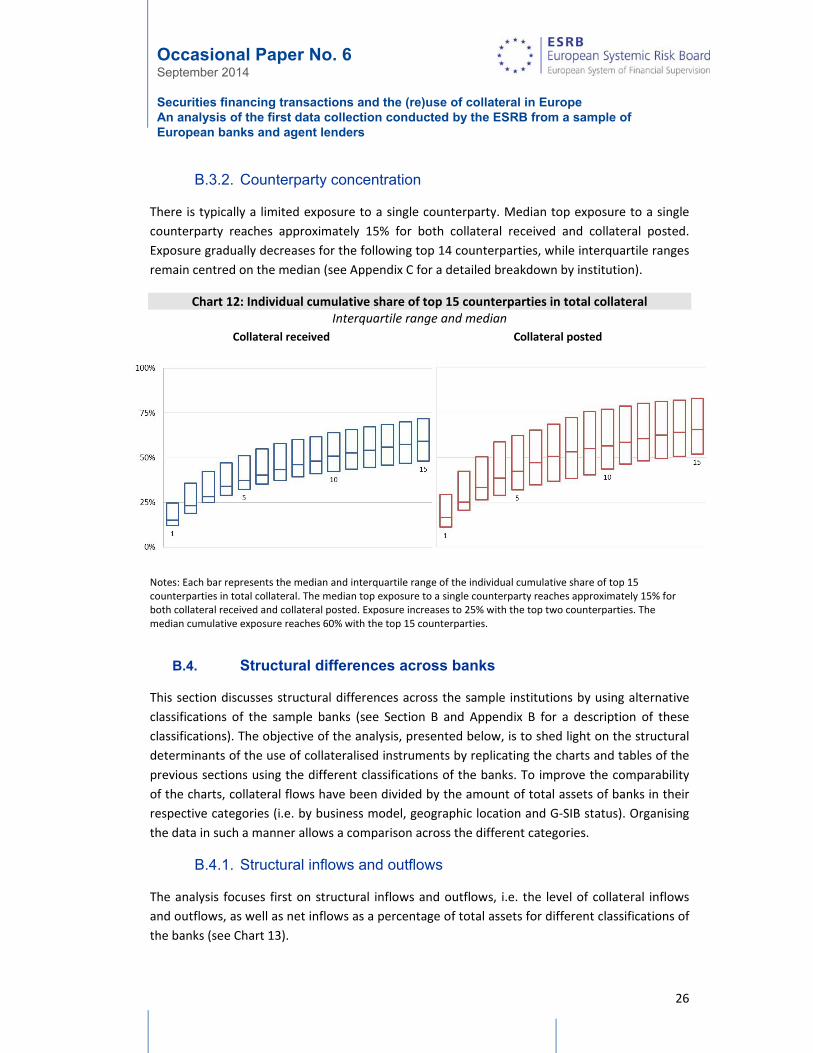
There is typically a limited exposure to a single counterparty. Median top exposure to a single
counterparty reaches approximately 15% for both collateral received and collateral posted.
Exposure gradually decreases for the following top 14 counterparties, while interquartile ranges
remain centred on the median (see Appendix C for a detailed breakdown by institution).
Chart 12: Individual cumulative share of top 15 counterparties in total collateral Interquartile range and median
Collateral received Collateral posted
Notes: Each bar represents the median and interquartile range of the individual cumulative share of top 15 counterparties in total collateral. The median top exposure to a single counterparty reaches approximately 15% for both collateral received and collateral posted. Exposure increases to 25% with the top two counterparties. The median cumulative exposure reaches 60% with the top 15 counterparties.
B.4. Structural differences across banks
This section discusses structural differences across the sample institutions by using alternative
classifications of the sample banks (see Section B and Appendix B for a description of these
classifications). The objective of the analysis, presented below, is to shed light on the structural
determinants of the use of collateralised instruments by replicating the charts and tables of the
previous sections using the different classifications of the banks. To improve the comparability
of the charts, collateral flows have been divided by the amount of total assets of banks in their
respective categories (i.e. by business model, geographic location and G‐SIB status). Organising
the data in such a manner allows a comparison across the different categories.
B.4.1. Structural inflows and outflows
The analysis focuses first on structural inflows and outflows, i.e. the level of collateral inflows
and outflows, as well as net inflows as a percentage of total assets for different classifications of
the banks (see Chart 13).

Occasional Paper No. 6 September 2014 Securities financing transactions and the (re)use of collateral in Europe An analysis of the first data collection conducted by the ESRB from a sample of European banks and agent lenders
27
Chart 13: Collateral received and posted by bank classifications (percentage of total assets)
Note: Alternative classifications by business model (commercial banks – CBs, diversified banks – DBs, and investment
banks – IBs), by geography (euro area –EA, Norway, Denmark and Sweden –Scan, and the UK), and by G‐SIB buckets.
The first grouping (the left group of bar charts, by business model) shows that the investment
banks (all from the UK) are net collateral takers and hence providers of funding, while
commercial and diversified banks are net collateral providers. This is consistent with the
observation that euro area banks rely on secured funding from non‐euro area investment
banks. In addition, the investment banks have the greatest use of collateral relative to the size
of their balance sheet.
The second grouping (by geographic area) shows a somewhat attenuated pattern, which can be
explained by the UK being the home of both investment and diversified banks and the euro area
hosting both diversified and commercial banks. Scandinavian (diversified) banks turn out to
have neutral funding.
The third grouping (by globally systemic importance of banks) also proves to be relevant. Banks
of the category bucket 1 or 2, which contains most investment banks, have a higher share of
collateralised transactions to total assets. Non‐GSIBs have larger net collateral outflows than G‐
SIBs, which is consistent with the observation made in the first grouping, as all investment banks
are in the G‐SIB category.
Chart 44 shows a further distinction of banks within the euro area. The set of bars on the left of
the chart regroups euro area banks by size. Large banks nearly balanced collateral flows, while
medium‐sized and smaller banks have significantly higher outflows than inflows.
The set of bars on the right regroups euro area banks by business model and their location in
euro area countries not exposed to sovereign risk tensions (A) and higher sovereign debt strains
(B). Group B commercial banks have large net outflows, while group A commercial banks are net
collateral takers. Diversified banks in area A and area B exhibit similar patterns.
-10%
-8%
-6%
-4%
-2%
0%
2%
4%
6%
8%
10%
0%
5%
10%
15%
20%
25%
CBs DBs IBs EA Scan UK B 1-2 B 3-4 non G-SIB
Businessmodel Geographic G-SIB
In (% TA)
Out (% TA)
Net In (% TA)

Occasional Paper No. 6 September 2014 Securities financing transactions and the (re)use of collateral in Europe An analysis of the first data collection conducted by the ESRB from a sample of European banks and agent lenders
28
Chart 4: Collateral received and posted by euro area bank classification (percentage of total assets)
The data analysis reveals remarkable differences in the structural use of collateralised funding
between investment banks and the other banks in the sample, both in terms of the level of
flows relative to total assets and in terms of net flows. Differences between the non‐investment
banks are less systematic, although there seems to be a higher degree of reliance on
collateralised funding by euro area banks that are smaller or established in EU Member States
that experienced sovereign debt tensions.
B.4.2. Instruments
Next, we consider the usage of securities collateral broken down by instruments and collateral
using the same classifications.
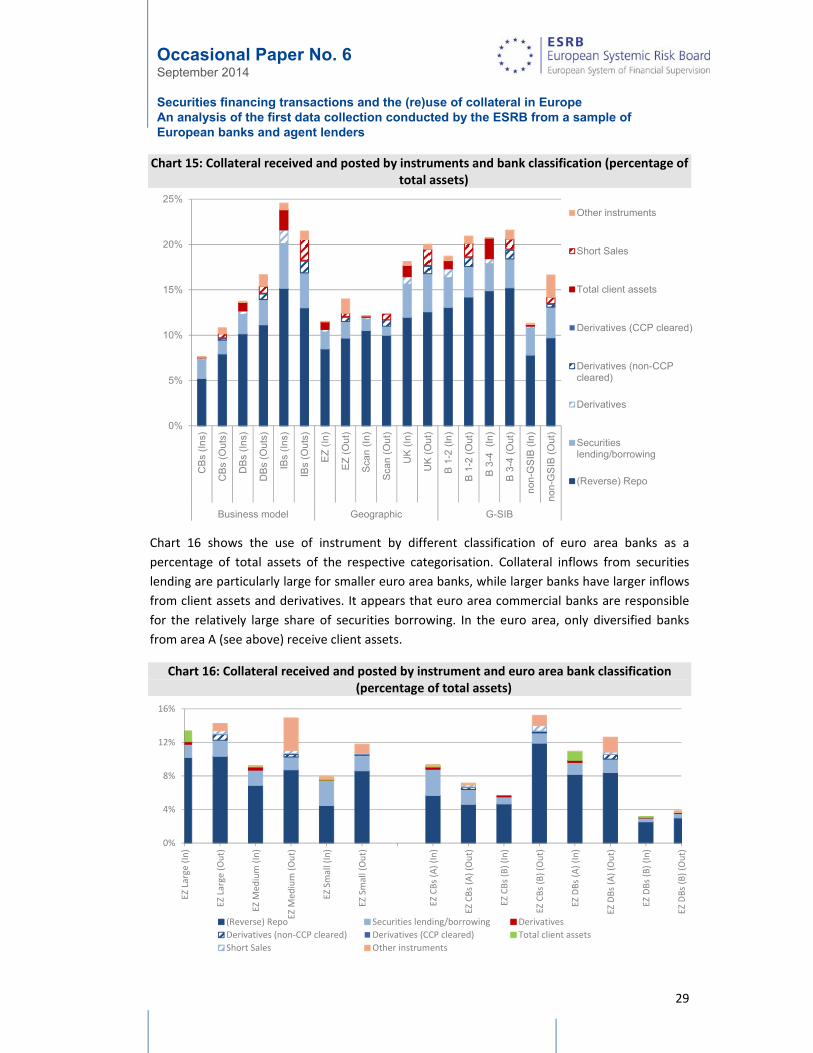
Chart 15 shows the first set of classifications. Clearly, the use of instruments differs across
business models: investment and diversified banks have a higher share of total client assets
than commercial banks; derivatives use is also more pronounced at investment banks and they
clearly act as intermediaries, with derivatives accounting for both large inflows and outflows.
The use of short sales is higher at investment and diversified banks than at commercial banks,
which is consistent with what could be expected.
Again, the geographic classification shows a mixed picture due to the fact that the UK comprises
both diversified and investment banks while the euro area comprises both commercial and
diversified banks. Scandinavian banks have a larger proportion of securities collateral through
“other instruments”. Similarly, the classification by G‐SIB status shows the concentration of
smaller, commercial and diversified banks in the non‐G‐SIB bucket that rely on net funding
through collateralised transactions by using mainly SFTs and “other instruments”.
‐15%
‐10%
‐5%
0%
5%
10%
15%
0%
2%
4%
6%
8%
10%
12%
14%
16%
18%
20%
EZ Large EZ Medium EZ Small EZ CBs (A) EZ CBs (B) EZ DBs (A) EZ DBs (B)
In (% TA) Out (% TA) Net In (% TA)
Occasional Paper No. 6 September 2014 Securities financing transactions and the (re)use of collateral in Europe An analysis of the first data collection conducted by the ESRB from a sample of European banks and agent lenders
29
Chart 15: Collateral received and posted by instruments and bank classification (percentage of total assets)
Chart 16 shows the use of instrument by different classification of euro area banks as a
percentage of total assets of the respective categorisation. Collateral inflows from securities
lending are particularly large for smaller euro area banks, while larger banks have larger inflows
from client assets and derivatives. It appears that euro area commercial banks are responsible
for the relatively large share of securities borrowing. In the euro area, only diversified banks
from area A (see above) receive client assets.
Chart 16: Collateral received and posted by instrument and euro area bank classification (percentage of total assets)
0%
5%
10%
15%
20%
25%C
Bs
(In
s)
CB
s (O
uts)
DB
s (I
ns)
DB
s (O
uts)
IBs
(In
s)
IBs
(Ou
ts)
EZ
(In
)
EZ
(O
ut)
Sca
n (
In)
Sca
n (O
ut)
UK
(In
)
UK
(O
ut)
B 1
-2 (
In)
B 1
-2 (
Out
)
B 3
-4
(In
)
B 3
-4 (
Out
)
non
-GS
IB (
In)
no
n-G
SIB
(O
ut)
Business model Geographic G-SIB
Other instruments
Short Sales
Total client assets
Derivatives (CCP cleared)
Derivatives (non-CCPcleared)
Derivatives
Securitieslending/borrowing
(Reverse) Repo
0%
4%
8%
12%
16%
EZ Large (In)
EZ Large (Out)
EZ M
edium (In)
EZ M
edium (Out)
EZ Small (In)
EZ Small (Out)
EZ CBs (A) (In)
EZ CBs (A) (Out)
EZ CBs (B) (In)
EZ CBs (B) (Out)
EZ DBs (A) (In)
EZ DBs (A) (Out)
EZ DBs (B) (In)
EZ DBs (B) (Out)
(Reverse) Repo Securities lending/borrowing Derivatives
Derivatives (non‐CCP cleared) Derivatives (CCP cleared) Total client assets
Short Sales Other instruments

Occasional Paper No. 6 September 2014 Securities financing transactions and the (re)use of collateral in Europe An analysis of the first data collection conducted by the ESRB from a sample of European banks and agent lenders
30
Concentrating on SFTs, the data again shows their role as a funding tool for banks. The same
funding pattern as observed for all collateralised transactions also applies to the use of SFTs:
credit institutions posted more collateral than they received. This is particularly true in the case
of small and medium‐sized banks. The distinction between area A and B banks also reveals that
commercial banks in the latter area exhibit larger net outflows of collateral, pointing to the use
of repo as a funding tool.
B.4.3. Collateral
The next step is to show the type of collateral used based on the different classifications (see
Chart 57). The data shows that commercial and diversified banks post a higher share of “risky”
assets, such as covered bonds, loans and ABS, than investment banks. These banks, in turn, post
high amounts of equity collateral.
The geographic categorisation shows a concentration of covered bond collateral at Scandinavian
banks (which can be explained by the high volume of covered bond issuance in some of these
countries), while euro area banks post much more loans than banks in the other regions. The
difference between euro area institutions and their UK counterparts is less pronounced,
however a slightly greater use of loan outflows and covered bonds inflows is observed in the
case of the euro area.
The categorisation of institutions by their systemic importance shows that non‐G‐SIB entities
mainly post loans. Moreover, a noticeable difference is that Scandinavian diversified banks tend
to receive and post greater amounts of “other” instruments while receiving and posting fewer
equities as collateral.
Chart 57: Collateral received and posted by collateral type and bank classification (percentage of total assets)
0%
5%
10%
15%
20%
25%
CBs (In)
CBs (Out)
DBs (In)
DBs (Out)
IBs (In)
IBs (Out)
EZ (In)
EZ (Out)
Scan
(In)
Scan
(Out)
UK (In)
UK (Out)
Bucket 1 or 2
Bucket 1 or 2
Bucket 3 or 4
Bucket 3 or 4
non‐GSIB
non‐GSIB
Business model Geographic G‐SIB
Gov.D. Cov.B. D.I (FI) D.I (non‐FI) ABS Loans Equities Other

Occasional Paper No. 6 September 2014 Securities financing transactions and the (re)use of collateral in Europe An analysis of the first data collection conducted by the ESRB from a sample of European banks and agent lenders
31
Chart 18, which shows alternative euro area bank categories, illustrates that the use of loans is
not confined to banks of a specific business model or from a specific part of the region – both
diversified and commercial banks, as well as banks from region A and region B, post loans. The
overview of the various euro area bank categories also allows the identification of funding
patterns of private debt: The net posting of private debt collateral (ABS, covered bonds and
other debt instruments) is more pronounced at medium‐sized and smaller banks, as well as at
commercial banks from area B.
Chart 18: Collateral received and posted by collateral type and euro area bank classification (percentage of total assets)
B.4.4. Maturity
Chart 19 shows that, on average, maturities of collateral posting and receiving transactions
(liquidity raising and financing) in repo markets are longer than the average maturity in the
securities lending market for all business models.
0%
2%
4%
6%
8%
10%
12%
14%
16%
EZ Large(In)
EZ Large(Out)
EZMedium
(In)
EZMedium(Out)
EZ Small(In)
EZ Small(Out)
EZ CBs(A) (In)
EZ CBs(A)(Out)
EZ CBs(B) (In)
EZ CBs(B)(Out)
EZ DBs(A) (In)
EZ DBs(A)(Out)
EZ DBs(B) (In)
EZ DBs(B)(Out)
Gov.D. Cov.B. D.I (FI) D.I (non‐FI) ABS Loans Equities Other

Occasional Paper No. 6 September 2014 Securities financing transactions and the (re)use of collateral in Europe An analysis of the first data collection conducted by the ESRB from a sample of European banks and agent lenders
32
Chart 19: Average maturity – totals and major transaction types by business model
Note: In the analysis, only reporting entities that have reported maturities both for the lending and for the borrowing
sides have been included.
In both types of market, investment banks exhibit the shortest maturities. In the repo market,
investment banks have the shortest funding (90 days). The maturity of their securities loans is
even shorter (43 days).
With respect to the overall matching of funding and financing, in all business models banks
exhibit characteristics that seem to be consistent with a prudent liquidity management profile in
their repo transactions, with the most prudent ones being commercial banks (the maturity of
cash lent is 188 days and the maturity of cash borrowed is 80 days). For securities lending
transactions, investment banks have almost a matched maturity profile, while diversified banks
on average show a shorter maturity for collateral‐posting transactions (169 days) than for
collateral‐receiving transactions (245 days).
Nevertheless, it is difficult to infer liquidity risk based on this observed maturity mismatch given
the existence of securities collateralised securities lending transactions (non‐cash collateralised
securities lending).
350
261
64
188
322
90 84
169
43
134
324
48
80
273
5772
245
42
0
50
100
150
200
250
300
350
400
days
transactions in which collateral is posted transactions in which collateral is received
number 11 19 8 11 18 7 7 14 7
observations
Total Repo Sec Lending

Occasional Paper No. 6 September 2014 Securities financing transactions and the (re)use of collateral in Europe An analysis of the first data collection conducted by the ESRB from a sample of European banks and agent lenders
33
B.4.5. Cross-sector linkages
This section analyses differences across banks with respect to their cross‐sector linkages. The
linkages, in analogy to Chart 8, are shown by business model, G‐SIB status and for a distinct
classification of euro area banks.23
Chart 20 shows the cross‐sector linkages by business model. Commercial banks tend to borrow
more from central banks and less from other financial institutions. Diversified banks are roughly
in line with the overall sample pattern (see Chart 8). For investment banks, the business with
investment funds other than MMFs is much more important than for the other business models.
Investment banks also do relatively more business with credit institutions than with CCPs. As
expected, investment banks’ reliance on central bank financing is low.
Again, the data clearly shows the funding role that investment banks play across counterparties:
they provide funding to credit institutions, through CCPs, and to investment funds. The
distribution of funding across such a broad range of counterparties is suggestive of a
considerable degree of interconnectedness.
Chart 20: Cross‐sector flow by business model
The breakdown by G‐SIB classification shows that banks of high systemic importance (bucket 1‐
4) rely less on central bank refinancing than non‐systemically important banks.
Banks in bucket 3 or 4 conduct proportionately more business with other banks, CCPs and
investment funds than banks in the other buckets, which can be explained by the larger
presence of investment banks in the category “bucket 1 or 2”.
23 The collateral flows are shown here as a percentage of total assets of the respective category to allow a
better comparison in terms of relative importance of the different counterparties.
0%
1%
1%
2%
2%
3%
3%
4%
4%
CBs
CIs
MMFs IFs
HFs
ETFs
CCPs
IC&PF
NFC
Other
CBs (In) CBs (Out)
0%
1%
2%
3%
4%
5%
6%
CBs
CIs
MMFs IFs
HFs
ETFs
CCPs
IC&PF
NFC
Other
DBs (In) DBs (Out)
0%
1%
2%
3%
4%
5%
6%
7%
8%
9%
CBs
CIs
MMFs IFs
HFs
ETFs
CCPs
IC&PF
NFC
Other
IBs (In) IBs (Out)
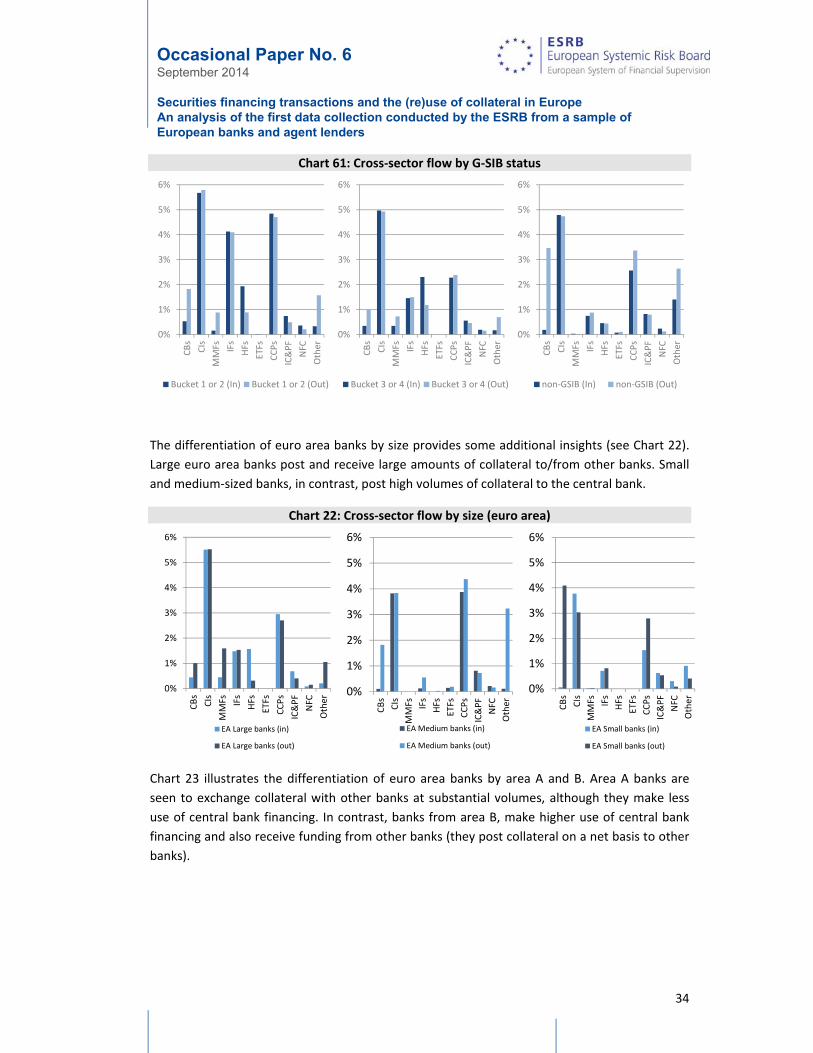
Occasional Paper No. 6 September 2014 Securities financing transactions and the (re)use of collateral in Europe An analysis of the first data collection conducted by the ESRB from a sample of European banks and agent lenders
34
Chart 61: Cross‐sector flow by G‐SIB status
The differentiation of euro area banks by size provides some additional insights (see Chart 22).
Large euro area banks post and receive large amounts of collateral to/from other banks. Small
and medium‐sized banks, in contrast, post high volumes of collateral to the central bank.
Chart 22: Cross‐sector flow by size (euro area)
Chart 23 illustrates the differentiation of euro area banks by area A and B. Area A banks are
seen to exchange collateral with other banks at substantial volumes, although they make less
use of central bank financing. In contrast, banks from area B, make higher use of central bank
financing and also receive funding from other banks (they post collateral on a net basis to other
banks).
0%
1%
2%
3%
4%
5%
6%CBs
CIs
MMFs IFs
HFs
ETFs
CCPs
IC&PF
NFC
Other
Bucket 1 or 2 (In) Bucket 1 or 2 (Out)
0%
1%
2%
3%
4%
5%
6%
CBs
CIs
MMFs IFs
HFs
ETFs
CCPs
IC&PF
NFC
Other
Bucket 3 or 4 (In) Bucket 3 or 4 (Out)
0%
1%
2%
3%
4%
5%
6%
CBs
CIs
MMFs IFs
HFs
ETFs
CCPs
IC&PF
NFC
Other
non‐GSIB (In) non‐GSIB (Out)
0%
1%
2%
3%
4%
5%
6%
CBs
CIs
MMFs IFs
HFs
ETFs
CCPs
IC&PF
NFC
Other
EA Large banks (in)
EA Large banks (out)
0%
1%
2%
3%
4%
5%
6%
CBs
CIs
MMFs IFs
HFs
ETFs
CCPs
IC&PF
NFC
Other
EA Medium banks (in)
EA Medium banks (out)
0%
1%
2%
3%
4%
5%
6%
CBs
CIs
MMFs IFs
HFs
ETFs
CCPs
IC&PF
NFC
Other
EA Small banks (in)
EA Small banks (out)

Occasional Paper No. 6 September 2014 Securities financing transactions and the (re)use of collateral in Europe An analysis of the first data collection conducted by the ESRB from a sample of European banks and agent lenders
35
Chart 23: Cross‐sector flow by bank area (euro area)
The data on the top 15 counterparties provides more granular information along the geographic
and business model dimension. Specifically, central banks are the main counterparties of banks
from group B. These banks are mostly commercial and diversified banks. For those banks, the
largest share of collateral posted is issued by the reporting institution itself,24 while collateral
exchanged with central banks and banks in other countries is predominantly in the form of
sovereign bonds.
The information on the main types of collateral exchanged by the reporting banks with their
major counterparties (see Chart 24) provides additional insights, although an important caveat
needs to be made on the heterogeneity of the data used for this analysis. Banks in group A
appeared to provide funding to other credit institutions in exchange for collateral comprised
mainly of securities issued by sovereign or supranational entities (such as the European
Financial Stability Facility and the European Stability Mechanism), which is typically highly rated.
In contrast, group B banks appeared to have posted mainly other assets to other credit
institutions. This relationship is reversed for other counterparties encompassing MMFs, CCPs,
other investment funds, insurance companies and pension funds. To those other
counterparties, in fact, group A banks (excluding again investment banks) seemed to have
provided collateral of various types; while credit institutions in group B may have posted mainly
sovereign (and supranational) bonds. Finally, the data seem to confirm a pattern where banks in
both groups have pledged various types of assets to central banks in addition to sovereign
bonds.
24 The type of instrument involved here cannot be clearly identified by the one‐off data collection.
0%
1%
2%
3%
4%
5%
6%
EA banks (A) (in) EA banks (A) (out)
0%
1%
2%
3%
4%
5%
6%
EA banks (B) (in) EA banks (B) (out)

Occasional Paper No. 6 September 2014 Securities financing transactions and the (re)use of collateral in Europe An analysis of the first data collection conducted by the ESRB from a sample of European banks and agent lenders
36
Chart 24: Main type of collateral exchanged with major counterparties
B.4.6. Counterparty concentration
In terms of concentration, the transactions with main counterparties (top 15 for each reporting
entity) account for about 50% of the total exchange of collateral. However, some relevant
differences can be noted depending on the size and business model of the reporting institution
(Chart 75). In particular, small and commercial banks have fewer counterparties, as suggested
by the large share (a median around the 75% mark) of total collateral exchanged with the major
15 counterparties. Overall, the reporting banks seem to have posted collateral towards a
smaller number of counterparties than those from which those have received collateral.
Chart 75: Share of top 15 counterparties in total collateral A: Interquartile range and median by size B: Interquartile range and median by business
model
▬ Collateral received ▬ Collateral posted

Occasional Paper No. 6 September 2014 Securities financing transactions and the (re)use of collateral in Europe An analysis of the first data collection conducted by the ESRB from a sample of European banks and agent lenders
37
C. The re-investment of cash collateral
C.1. The set-up of the data collection
The second ESRB data collection targeted the re‐investment of cash collateral by agent lenders.
The agent lenders were required to provide information (see Chart 86) on the amount of their
total assets (own and clients’ assets), as well as on the proportion of those assets available for
securities lending.
Chart 86: Overview of ESRB cash collateral templates
More precisely, the data collected on securities lending, cash collateral and cash collateral
reinvestment permitted an analysis of:25
the assets and collateral posted to institutions, broken down by client type. The
templates also included the portion of the securities lending portfolio that is guaranteed
by the reporting institution, the type of collateral received from securities lending and
the cash collateral split between segregated and commingled accounts;
the maturity breakdown of the cash collateral received, including information on
earliest possible termination of the contract;
the cash collateral re‐investment portfolio, with a breakdown by type of product or
investment, e.g. cash and bank deposits, reverse repos, securities or loans and a further
breakdown of the securities received through reverse repos. For the products and
transactions the expected liquidation period was also reported, allowing an initial
25 For a description of agent lenders’ practice of re‐investing cash collateral,l see also FSB (2012) and
Keane (2013).
Assets
Total assets Cash-
collateral
Agent lender
Assets available/ used forsecuritieslending
Non-cash collateral
Re-investment portfolio
Re-investment portfolio Cash collateral

Occasional Paper No. 6 September 2014 Securities financing transactions and the (re)use of collateral in Europe An analysis of the first data collection conducted by the ESRB from a sample of European banks and agent lenders
38
assessment of liquidity and maturity transformation, as well as of the ability of reporting
institutions to quickly raise cash in “normal” times;
the potential currency mismatches between the securities loans, the cash collateral
received and product or investment in which it is re‐invested.
C.2. Market overview: assets and securities lending
The data collection gathered information from 13 financial institutions acting as agent lenders
(henceforth referred to as agent lenders) reporting €4.8 trillion in total assets managed as at 28
February 2013 (see Table 6).26 The volume of securities on loan (€817.3 billion) illustrates the
significant size of EU securities lending markets and the relevance of this data collection
exercise. A large share of securities lending transactions also included guarantees, usually in the
form of indemnifications to be provided to clients in case of losses (e.g. counterparty default).
The greater volume of collateral received (€938.4 billion, including €328.8 billion in securities
and €609.6 billion in cash) reflects the over‐collateralisation of securities lending transactions.
Table 6: Summary statistics for the data collection (€ billions)
Assets Total Available for SL Used for SL Utilisation rate (%) o/w guaranteed by AL
Own assets 1,605.0 277.2 126.1 45.5 ‐‐
EU clients’ assets
1,140.9 1,305.7 161.0 12.3 114.4
Non‐EU clients’ assets
2,081.2 4,831.4 530.2 11.0 489.4
Total 4,827.0 6,414.2 817.3 12.7 603.9
Notes: Three respondents did not provide "total assets" data. The last column denotes the asset volumes that are
guaranteed by the agent lender through indemnifications.
Collateral received from securities lending against
Securities collateral
Percentage of total Cash collateral Percentage of total
Own assets 27.7 12.4 195.4 87.6
EU clients’ assets 102.0 60.6 66.4 39.4
Non‐EU clients’ assets 199.1 36.4 347.8 63.6
Total 328.8 35.0 609.6 65.0
26 However, the actual coverage is likely to be greater than this, as three respondents did not indicate
total assets for their clients. However, these respondents reported a combined €3.2 trillion in securities
available for securities lending, implying that the templates likely cover a total asset universe of €8 trillion
(4.8 + 3.2) or greater.

Occasional Paper No. 6 September 2014 Securities financing transactions and the (re)use of collateral in Europe An analysis of the first data collection conducted by the ESRB from a sample of European banks and agent lenders
39
Cash collateral received against
In segregated accounts
Percentage of cash collateral
In commingled accounts
Percentage of cash collateral
Managed by beneficial owner or third party
Own assets ‐‐ ‐‐ 195.4 100.0 ‐‐
EU clients’ assets 18.6 28.7 46.1 71.3 1.7
Non‐EU clients’ assets 223.5 68.9 101.0 31.1 23.3
Total 242.1 41.4 342.6 58.6 25.0
Looking into the breakdown of securities available for lending (€6.4 trillion)27, the first key
observation is the high degree of interconnectedness between the EU financial institutions
surveyed and non‐EU clients, with €4.8 trillion (75% of all securities available for lending) in non‐
EU client assets managed by EU agent lenders. This shows that there are significant cross‐border
linkages between EU and non‐EU jurisdictions. Conversations with agent lenders revealed that
EU securities lending markets seem indeed to serve as a hub for clients based in the Middle East
and North Africa, as well as the Asia‐Pacific region. This non‐EU client base is fairly static and is
essentially composed of sovereigns (central banks or sovereign wealth funds), institutional
investors (insurance corporations and pension funds) and asset managers, i.e. long‐term
investors.
Chart 97: Securities available for lending
As regards EU clients’ assets available for lending (€1.31 trillion of securities), only a small share
is owned by credit institutions (5%). The majority comes from insurance corporations and
27 Excluding the institutions that did not report total assets (i.e. out of the agent lenders reporting €4.8
trillion in total assets), this number drops to €3.2 trillion. The percentage of total assets available for
securities lending seems very high and should be interpreted with caution, as it is possible the reporting
agent lenders may not have full information regarding those client assets that are not part of the
securities lending programme.
Own assets277.2 4%
EU client assets1,305.7 21%
Non-EU client assets4,831.4 75%
Securities available for lending
Note: Securities available for lending, split between own securities and securities lent on behalf of EU and non-EU beneficial owners.
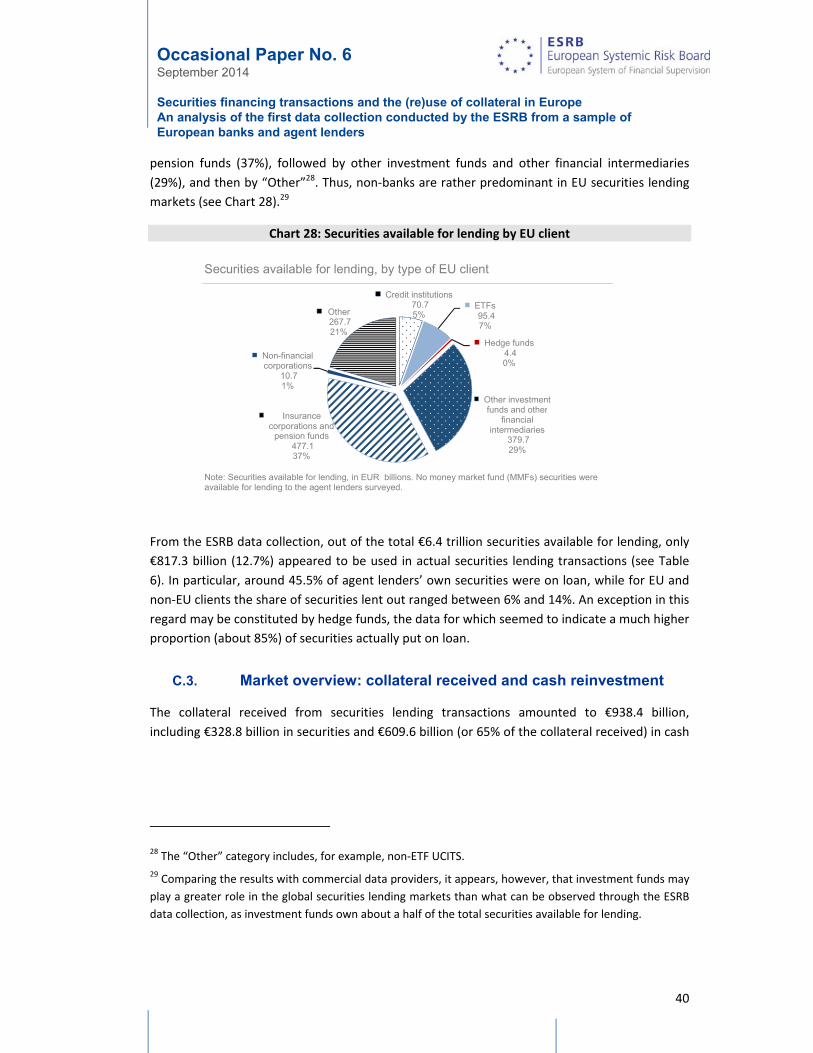
Occasional Paper No. 6 September 2014 Securities financing transactions and the (re)use of collateral in Europe An analysis of the first data collection conducted by the ESRB from a sample of European banks and agent lenders
40
pension funds (37%), followed by other investment funds and other financial intermediaries
(29%), and then by “Other”28. Thus, non‐banks are rather predominant in EU securities lending
markets (see Chart 28).29
Chart 28: Securities available for lending by EU client
From the ESRB data collection, out of the total €6.4 trillion securities available for lending, only
€817.3 billion (12.7%) appeared to be used in actual securities lending transactions (see Table
6). In particular, around 45.5% of agent lenders’ own securities were on loan, while for EU and
non‐EU clients the share of securities lent out ranged between 6% and 14%. An exception in this
regard may be constituted by hedge funds, the data for which seemed to indicate a much higher
proportion (about 85%) of securities actually put on loan.
C.3. Market overview: collateral received and cash reinvestment
The collateral received from securities lending transactions amounted to €938.4 billion,
including €328.8 billion in securities and €609.6 billion (or 65% of the collateral received) in cash
28 The “Other” category includes, for example, non‐ETF UCITS.
29 Comparing the results with commercial data providers, it appears, however, that investment funds may
play a greater role in the global securities lending markets than what can be observed through the ESRB
data collection, as investment funds own about a half of the total securities available for lending.
Credit institutions70.7 5%
ETFs95.4 7%
Hedge funds4.40%
Other investment funds and other
financial intermediaries
379.7 29%
Insurance corporations and
pension funds477.1 37%
Non-financial corporations
10.7 1%
Other267.7 21%
Securities available for lending, by type of EU client
Note: Securities available for lending, in EUR billions. No money market fund (MMFs) securities were available for lending to the agent lenders surveyed.

Occasional Paper No. 6 September 2014 Securities financing transactions and the (re)use of collateral in Europe An analysis of the first data collection conducted by the ESRB from a sample of European banks and agent lenders
41
(see Chart 99).30 Cash collateral dominated, especially in the case of agent lenders’ own
securities on loan (87.6%) and, to a lesser extent, for non‐EU clients (63.6%).
Chart 29: Type of collateral received by asset ownership
The relatively greater importance of cash collateral that emerged from the ESRB data collection
seems to differ from data provided by industry sources. This may suggest that non‐EU securities
captured in the data collection sample (whether belonging to the agent lender or beneficially
owned by EU or non‐EU clients) were largely collateralised with cash.
For EU client assets, the data collected show that agent lenders received on average 39.4% of
collateral in cash. Cash dominates in the case of assets owned by credit institutions, other
investment funds, hedge funds and non‐financial corporations. In contrast, assets from
insurance corporations and pension funds, ETFs and other institutions tend to be collateralised
with securities (see Chart 30).
30 Some respondents indicated that they do not accept cash as collateral for securities lending
transactions.
0
50
100
150
200
250
300
350
400
450
500
Own assets EU Non-EU
Cash Non-cash
Collateral received from securities lending transactions
Note: Cash and non-cash collateral received for securities lending transactions, in EUR bn.

Occasional Paper No. 6 September 2014 Securities financing transactions and the (re)use of collateral in Europe An analysis of the first data collection conducted by the ESRB from a sample of European banks and agent lenders
42
Chart 30: Type of collateral received against EU clients’ assets
A sizeable portion of the cash collateral received was placed into segregated accounts (€242.1
billion, or 41.4% of the total cash collateral received). This share was particularly large for non‐
EU client assets (68.9% of the cash collateral received). This allocation of collateral potentially
reduces contagion risk, as agent lenders cannot use these segregated funds to back investments
or face losses outside of the account. Such segregated accounts, which allow for greater
investment control, are typically reserved for larger clients. Smaller clients tend to use
commingled accounts (including UCITS), as a lower volume of assets can prove challenging in
terms of liquidity management or relatively costly, making it difficult to achieve attractive yield
targets. Different investment profiles (e.g. conservative/aggressive) exist in both types of
account from which clients are typically free to choose based on their risk appetite. UCITS in
which cash collateral may be reinvested are subject to strict investment guidelines, which would
contribute to the mitigation of maturity and liquidity risk.
A very significant portion of the cash collateral was reinvested (€573.0 billion), equivalent to
around 95% of the cash collateral received.31
C.4. Redemption and liquidity risks
We have identified two potential risks related to maturity transformation when reinvesting cash
collateral, namely redemption and liquidity risk. These risks arise from two different features:
the term structure of the transactions (redemption risk) and their actual maturity (liquidity risk).
31 Here, we subtracted the amount of cash collateral managed by beneficial owners or third parties (€25
billion) from the total overall amount of cash collateral received (€584.6 billion).
0
10
20
30
40
50
60
70
Creditinstitutions
ETFs Hedge funds Otherinvestmentfunds / fin.
intermediaries
Insurance /pension funds
NFC Other EU
Cash Non-cash
Collateral received from securities lending transactions: EU clients
Note: Cash and non-cash collateral received for securities lending transactions, in EUR bn.
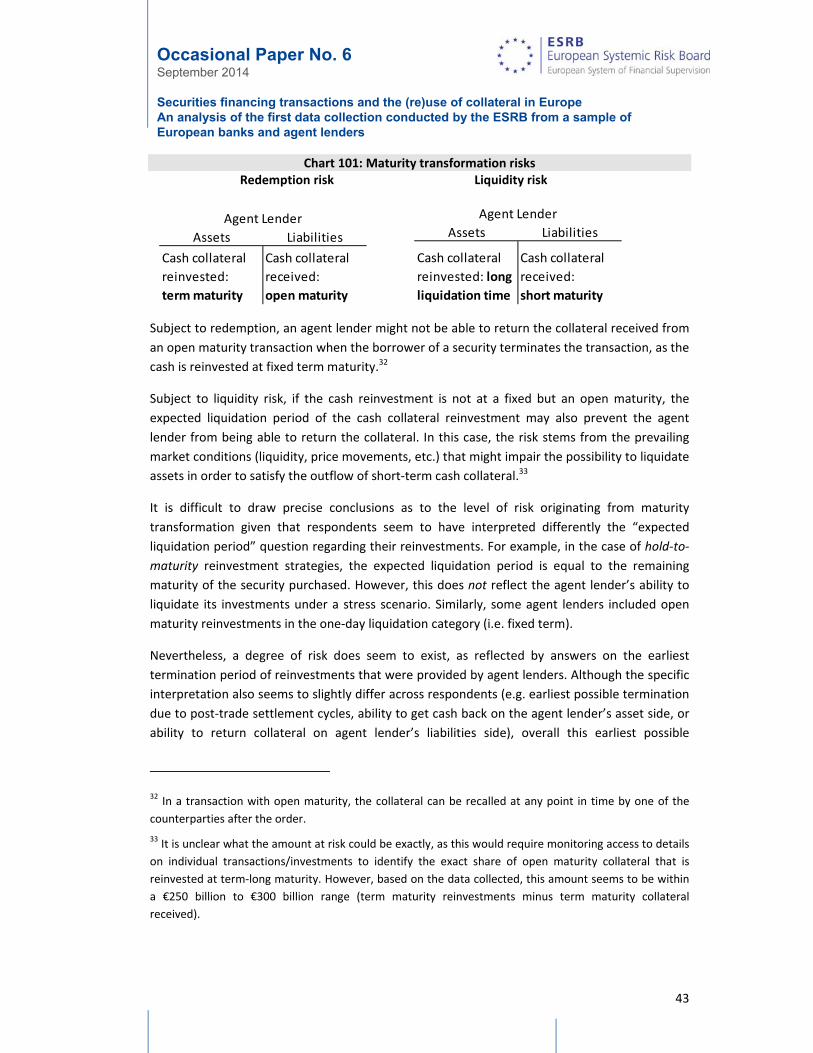
Occasional Paper No. 6 September 2014 Securities financing transactions and the (re)use of collateral in Europe An analysis of the first data collection conducted by the ESRB from a sample of European banks and agent lenders
43
Chart 101: Maturity transformation risks Redemption risk Liquidity risk
Subject to redemption, an agent lender might not be able to return the collateral received from
an open maturity transaction when the borrower of a security terminates the transaction, as the
cash is reinvested at fixed term maturity.32
Subject to liquidity risk, if the cash reinvestment is not at a fixed but an open maturity, the
expected liquidation period of the cash collateral reinvestment may also prevent the agent
lender from being able to return the collateral. In this case, the risk stems from the prevailing
market conditions (liquidity, price movements, etc.) that might impair the possibility to liquidate
assets in order to satisfy the outflow of short‐term cash collateral.33
It is difficult to draw precise conclusions as to the level of risk originating from maturity
transformation given that respondents seem to have interpreted differently the “expected
liquidation period” question regarding their reinvestments. For example, in the case of hold‐to‐
maturity reinvestment strategies, the expected liquidation period is equal to the remaining
maturity of the security purchased. However, this does not reflect the agent lender’s ability to
liquidate its investments under a stress scenario. Similarly, some agent lenders included open
maturity reinvestments in the one‐day liquidation category (i.e. fixed term).
Nevertheless, a degree of risk does seem to exist, as reflected by answers on the earliest
termination period of reinvestments that were provided by agent lenders. Although the specific
interpretation also seems to slightly differ across respondents (e.g. earliest possible termination
due to post‐trade settlement cycles, ability to get cash back on the agent lender’s asset side, or
ability to return collateral on agent lender’s liabilities side), overall this earliest possible
32 In a transaction with open maturity, the collateral can be recalled at any point in time by one of the
counterparties after the order.
33 It is unclear what the amount at risk could be exactly, as this would require monitoring access to details
on individual transactions/investments to identify the exact share of open maturity collateral that is
reinvested at term‐long maturity. However, based on the data collected, this amount seems to be within
a €250 billion to €300 billion range (term maturity reinvestments minus term maturity collateral
received).
Assets Liabilities
Cash collateral
reinvested:
term maturity
Cash collateral
received:
open maturity
Agent LenderAssets Liabilities
Cash collateral
reinvested: long
liquidation time
Cash collateral
received:
short maturity
Agent Lender

Occasional Paper No. 6 September 2014 Securities financing transactions and the (re)use of collateral in Europe An analysis of the first data collection conducted by the ESRB from a sample of European banks and agent lenders
44
termination does reflect limitations to agent lenders’ ability to quickly close out securities
lending transactions.
Redemption risk:
The majority of cash collateral received was at open maturity (€331.4 billion). This implies that
securities lending may not be a stable source of funding for financial institutions, as evidenced
by the problems AIG experienced during the financial crisis (see Keane, 2013).
On the other hand, in our sample the cash collateral was largely reinvested at term maturity
(€525.7 billion, Chart 112), i.e. into assets from which a disinvestment might not be done at any
point in time after the order but for which a liquidation period equal to or greater than one day
would be necessary (see Chart 34 and Chart 125 for breakdowns of expected liquidation periods
of reinvestments). Disinvestment at an earlier point in time may possibly result in sales at a
discount price. Redemption risk would likely become problematic in a situation of market stress
with collateral fire sales weighing on asset prices.
Chart 112: Type of maturity of cash collateral and re‐investment portfolio
Liquidity risk:
The second major risk, which differs slightly from redemption risk, stems from the length of the
expected liquidation period of cash collateral reinvestments. A certain amount of the cash
collateral reinvested (€189.8 billion) has a liquidation period greater than one month, i.e.
potentially significantly longer than the original maturity of the term securities lending
transaction (and the cash collateral received) or than the earliest possible termination (see
Chart 33). It is worth highlighting that a sizeable share of the cash collateral (20‐30%) is typically
reinvested at open maturity or at very short‐term maturity (one day), in order to allow for
flexible liquidity management by agent lenders.
0%
10%
20%
30%
40%
50%
60%
70%
80%
90%
100%
Original maturity type of cashcollateral received
Maturity type of cash collateral re‐investment portfolio
Open maturity Term maturity

Occasional Paper No. 6 September 2014 Securities financing transactions and the (re)use of collateral in Europe An analysis of the first data collection conducted by the ESRB from a sample of European banks and agent lenders
45
Chart 33: Original maturity and earliest termination provision of securities lending transactions, and expected liquidation period of reinvestments
While the majority of investments go into reverse repos (see Facilitation of credit growth
below), it appears that potential liquidity risk is especially concentrated in non‐repo
instruments.
For reverse repos, €47.3 billion (12.9% of the total) is invested at open maturity. For term
maturity reverse repos, the largest portion has an expected liquidation period of one day
(€144.7 billion or 39%), followed by a liquidation period extending from two to 30 days (€99.3
billion), while reinvestments with a liquidation period longer than 30 days account for €75.9
billion.
In comparison, the majority of non‐repo instruments have an expected liquidation of 30 days or
more (€133.8 billion, or 55.3% of the total term maturity reinvestments excluding reverse
repos), and only half of that amount has a one‐day maturity (€46.6 billion or 22.6%; see Chart
34).
Chart 34: Liquidation period of cash collateral reinvestments
100.6
5.327.1
57.3 70.7
384.5
23.6 30.4 50.065.1
191.27
6.68
63.92 74.12
189.75
0
50
100
150
200
250
300
350
400
1 day 1-3 days 3-7 days 7-30 days 30+ days
Original maturity Earliest termination Expected liquidation period
Cash collateral: Maturity transformation
Note: In EUR bn.
020406080
100120140160180200
1 day 1-3 days 3-7 days 7-30 days 30+ days
Reverse repos Other investments
Cash collateral reinvestment liquidation period
Note: in EUR bn.

Occasional Paper No. 6 September 2014 Securities financing transactions and the (re)use of collateral in Europe An analysis of the first data collection conducted by the ESRB from a sample of European banks and agent lenders
46
Specifically, the majority of cash collateral reinvested in debt issued by credit institutions, debt
issued by non‐financial corporations, ABS and cash or deposits34 has an expected liquidation
period longer than 30 days (see Chart 12).
Chart 12: Liquidation period of cash collateral reinvestments in non‐repo instruments
Facilitation of credit growth and exposure to (credit) risks
Of the €573 billion reinvested, a large majority goes into reverse repos (64%), followed by debt
(credit institutions 11.4%, governments 7.2% and non‐financial issuers 2.6%), ABS (5.1%) and
cash and bank deposits (4.4%). This suggests that the reinvestment of cash increases
interconnectedness between financial institutions through increased exposure to other market
participants (see Chart 12). In addition, the amount of reverse repos undertaken implies that a
sizeable part of the financial system relies on very short‐term funding, which is likely to
reinforce run risks. Nevertheless, in this case redemptions risks may be overcome as there is not
a maturity mismatch between funding and cash reinvestment.
34 This likely refers to term deposits.
0
20
40
60
80
100
120
1 day 1-3 days 3-7 days 7-30 days 30+ days
ETFsDebt instruments issued by other fin. IntermediariesMBSMMFsDebt instruments issued by other non-fin. IssuersCash and bank depositsABSDebt instruments issued by governmentsDebt instruments issued by credit institutions
Cash collateral reinvestment liquidation period for non-repos
Note: in EUR bn.

Occasional Paper No. 6 September 2014 Securities financing transactions and the (re)use of collateral in Europe An analysis of the first data collection conducted by the ESRB from a sample of European banks and agent lenders
47
Chart 13: Cash collateral reinvestments by instrument
These findings show much higher reinvestment in reverse repos than indicated in the Risk
Management Association’s (RMA) quarterly surveys, which shows that reverse repos amount to
40% of the US dollar cash and 50% of the euro cash collateral received as at the end of the first
quarter of 2013. However, data available in the RMA survey are not as detailed in terms of
granularity (e.g. asset classes) and coverage (EU agent lenders) as would be required for
monitoring purposes.35
- Reverse repos
It is important to analyse which assets are used as collateral in reverse repos, as around 65% of
the securities lending cash collateral received is reinvested in these types of transaction, which
also serve to facilitate credit growth and increase overall leverage. Around half of the collateral
received in reverse repos is investment grade government bonds and treasuries (see Chart 14).
The rest comprises mainly equities (17%), non‐government bonds (12%) and mortgage backed
securities (13%).
35 The RMA survey focuses on the 15 largest US investment banks only.
Reverse repos (64.7%)
Debt instruments issued by credit institutions (11.4%)
Debt instruments issued by governments (7.2%)
ABS (5.1%)
Cash and bank deposits (4.4%)
Debt instruments issued by other non-fin. issuers (2.6%)
MMFs (1.7%)
MBS (0.8%)
Other financial products (0.7%)
Debt instruments issued by other fin. intermediaries (0.7%)
Covered bonds (0.6%)
ETFs
Cash collateral reinvestment by asset type
Note: In % of total.
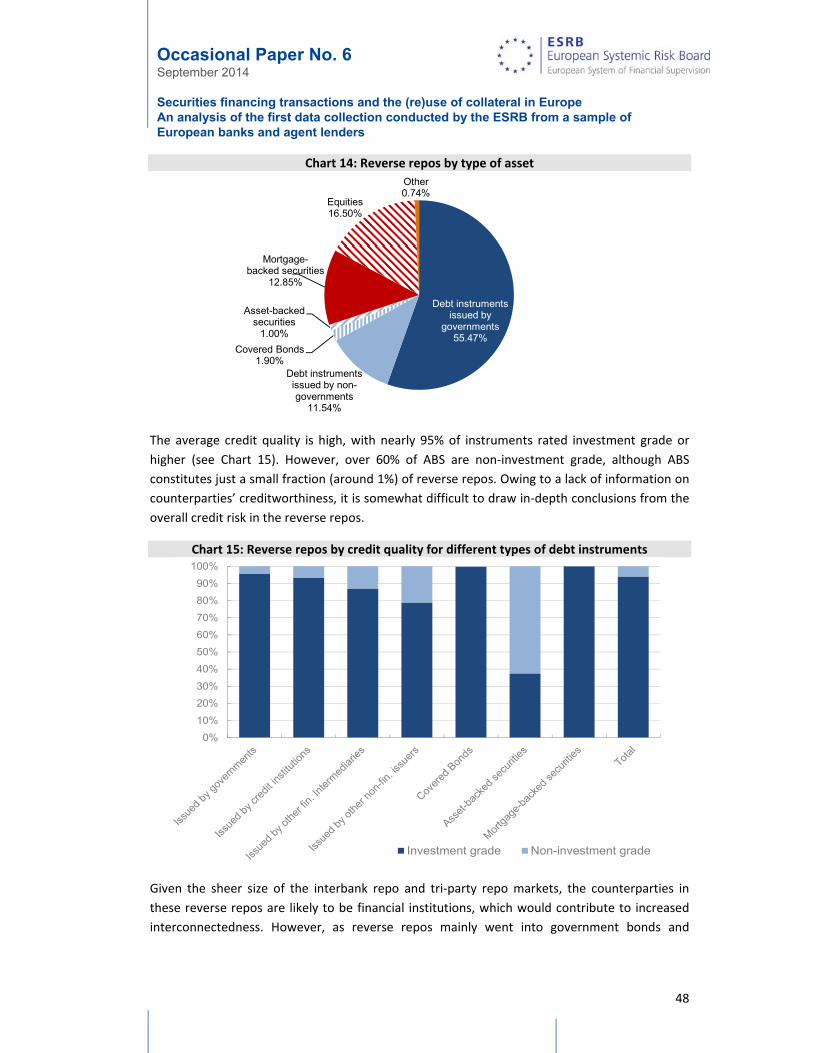
Occasional Paper No. 6 September 2014 Securities financing transactions and the (re)use of collateral in Europe An analysis of the first data collection conducted by the ESRB from a sample of European banks and agent lenders
48
Chart 14: Reverse repos by type of asset
The average credit quality is high, with nearly 95% of instruments rated investment grade or
higher (see Chart 15). However, over 60% of ABS are non‐investment grade, although ABS
constitutes just a small fraction (around 1%) of reverse repos. Owing to a lack of information on
counterparties’ creditworthiness, it is somewhat difficult to draw in‐depth conclusions from the
overall credit risk in the reverse repos.
Chart 15: Reverse repos by credit quality for different types of debt instruments
Given the sheer size of the interbank repo and tri‐party repo markets, the counterparties in
these reverse repos are likely to be financial institutions, which would contribute to increased
interconnectedness. However, as reverse repos mainly went into government bonds and
Debt instruments issued by
governments55.47%
Debt instruments issued by non-governments
11.54%
Covered Bonds1.90%
Asset-backed securities
1.00%
Mortgage-backed securities
12.85%
Equities16.50%
Other0.74%
0%
10%
20%
30%
40%
50%
60%
70%
80%
90%
100%
Investment grade Non-investment grade

Occasional Paper No. 6 September 2014 Securities financing transactions and the (re)use of collateral in Europe An analysis of the first data collection conducted by the ESRB from a sample of European banks and agent lenders
49
treasuries and the equities and non‐government debt instruments issued by non‐financial
issuers, this risk is somewhat limited (see Chart 39).
Chart 39: Issuers of non‐government debt instruments and equities in reverse repos
C.5. Currency mismatch
A potential source of vulnerabilities for SFTs is currency mismatch, which occurs when the two
legs of a transaction are denominated in different currencies. In the context of the re‐
investment of cash collateral, there are thus two potential sources of currency mismatch. First,
a mismatch between the currency of the asset lent and the cash collateral received and, second,
between the cash collateral received and the asset in which the cash collateral is re‐invested.
The magnitude of the risk arising from a mismatch therefore depends on the volatility of the
relevant currencies, which is reflected in the exchange rate between them. Consider for
instance, an agent lender who re‐invests euro denominated cash collateral in assets in a foreign
currency. If that currency falls sharply and the lender has to return the cash collateral to the
borrower of the underlying security, the agent lender can liquidate the asset only by incurring a
loss on the cash re‐investment.
Chart 16 shows the currency breakdown of the different legs of a securities lending/cash
reinvestment chain. The allocation of securities on loan by currency denomination shows that
the vast majority of the securities/assets and cash are denominated in either US dollars or euro,
which are considered to be relatively stable currencies. They account for more than 80% of the
total securities on loan (approximately 90% of the cash collateral received) and 87% of the asset
in which cash collateral is re‐invested.
0%
10%
20%
30%
40%
50%
60%
70%
80%
90%
100%
Debt instruments Equities
Credit institutions Other financial intermediaries Non-financial issuers

Occasional Paper No. 6 September 2014 Securities financing transactions and the (re)use of collateral in Europe An analysis of the first data collection conducted by the ESRB from a sample of European banks and agent lenders
50
Chart 16: Currency distribution
Given the relative low volatility between the US dollar and the euro, one may conclude that, at
an aggregate level, the risk arising from currency mismatch is quite low.36 Nevertheless,
vigilance is warranted for three reasons. First, the data collection revealed that two agent
lenders exhibited quite significant changes in their degree of currency mismatch across the two
reporting dates (November 2012 and February 2013). Second, the data collection did not specify
“other currency”, which may imply that some localised concentration of currency mismatch
went undetected. Third, owing to the nature of the data collected, it is not possible to perform a
direct mapping from the securities on loan to the cash collateral received. Some risk could thus
be concentrated at a specific institution, especially if it has a large amount of internationally less
important currencies.
36 Irrespective of the stability of the currency, the high degree of investment in US dollars may result in a
heightened sensitivity to developments in the United States. In addition, sensitivity may be exacerbated if
a given institution has strongly invested in US dollars and if that reinvestment is concentrated in a single
or small group of institutions.
34.0% 36.9% 33.8%
4.3% 3.2% 3.5%
47.0% 52.4% 53.4%
0%
10%
20%
30%
40%
50%
60%
70%
80%
90%
100%
Securities on loan by currency Cash collateral received bycurrency
Cash collateral reinvested bycurrency
EUR GBP JPY CHF USD Other

Occasional Paper No. 6 September 2014 Securities financing transactions and the (re)use of collateral in Europe An analysis of the first data collection conducted by the ESRB from a sample of European banks and agent lenders
51
D. Conclusion
The data collection exercise conducted by the ESRB constitutes a first step towards enhancing
transparency in SFT and collateral markets in the European Union. It allows some initial insights
into the structure of European SFT markets and some first steps in assessing risk‐relevant
factors in these markets. In addition to providing a description of the SFT landscape in Europe,
the data collection should also contribute to the policy efforts to build a comprehensive macro‐
prudential monitoring framework that, eventually, will allow the ESRB to conduct exhaustive
assessments of systemic risks arising from SFT markets. Looking ahead, this may imply
establishing a properly targeted regular form of data collection, reflecting improvements based
on the results of this first exercise.
This report summarises the results obtained from the data collection exercise by highlighting
some of the key characteristics of cash and securities collateral usage by EU agent lenders and
credit institutions. It therefore provides some first elements of transparency into such hitherto
opaque markets. The main findings from the ESRB data collection can be summarised as follows:
Widespread reliance on SFTs by banks and non‐banks
- The data have shown that collateral flows to and from banks amount to some 15% of their
total balance sheet (commercial banks are in the 8%‐11% range; investment banks in the
22%‐25% range). As for the collateral uses, SFTs account for the largest part of securities
collateralised transactions, namely 88% of collateral posted (€4.6 trillion). In more granular
terms, repos account for 70%, and securities lending for 18%, of this collateral. As for the
type of collateral, banks rely extensively on government debt as collateral (61 % of the total
collateral received and posted). Equities (13%) and debt securities issued by financial
institutions (8%) are the second and third most used type of collateral.
Re‐use factor suggests that collateral is re‐used once; opacity on exact level of reuse at micro
level
- 94% of securities collateral received by the banks is eligible for re‐use, illustrating the
fungible nature of collateral. Collateral re‐use metrics take an aggregate view of collateral
re‐use. They focus on the re‐use by financial intermediaries (banks and broker‐dealers) of
securities pledged by “structural asset owners“.37 Such a re‐use factor (multiplier) comes at
2.0, suggesting that collateral is re‐used once on average.
Thus, the inability of surveyed institutions to provide data on their exact level of re‐use of
collateral represents a still existing area of opacity and limits the level of detail to which the
analysis in this report can be conducted. In addition, this inability of surveyed institutions to
provide the data seems to suggest that (i) the (generally fungible) collateral is pooled and,
37 Typically institutional investors such as pension funds, insurers, collective investment funds, etc.

Occasional Paper No. 6 September 2014 Securities financing transactions and the (re)use of collateral in Europe An analysis of the first data collection conducted by the ESRB from a sample of European banks and agent lenders
52
when re‐used, not traced back to the collateral received; and (ii) more importantly,
institutions’ risk management systems do not seem to permit them to assess their own
degree of re‐use on a consolidated basis.
Cross‐institutional exposures and network structures reveal limited interconnectedness
- In absolute terms, SFTs occur mostly between banks and, to a lesser extent, through CCPs.
Unsurprisingly, considering net collateral flows, central banks and MMFs stand out as net
receivers of collateral (they fund the banking sector) and hedge funds as net providers of
collateral (to banks). Here, the data collected would be usefully completed by “who‐to‐
whom” information, e.g. explicit data on which type of collateral is held by which type of
institution.
- The network structure seems, on the whole, to reveal limited interconnectedness. There
are a relatively low number of institutions (i.e. three CCPs and six of the banks in the
sample) that are involved in more than 30% of the total volume of collateral exchanged,
which is a sign of a certain degree of concentration. However, they show well‐diversified
exposures to their counterparties according to the data collected for the purposes of the
present report. The loose network structure is also reflected in several additional findings.
First, institutions have a smaller number of bilateral links. Second, among the core firms,
many have only few links with the other core institutions. Third, in the analysis focusing on
the ten key firms, we can clearly distinguish the different types of institutions, i.e. central
banks, CCP and credit institutions, indicating that also non‐bank institutions (CCPs) are of
systemic importance in this network.
Evidence of liquid asset buffers and limited maturity mismatch in repos, at aggregate and
idiosyncratic level
- With reference to asset liquidity, evidence of repo use suggests that institutions build
liquid asset buffers, as they trade in higher amounts of liquid assets than they trade out. If
liquidity funding transactions are relatively short‐term, institutions may not be able to
maintain the buffer if counterparties do not renew their funding. With reference to
maturity mismatch, on average the maturity profile of banks’ repo trades appears to be
prudent (they minimise the maturity of cash lent but maximise that of borrowed cash).
However, if there is no evidence of liquidity risk on aggregate in the repo business, at the
micro level a significant proportion of institutions incur some liquidity risk. Nevertheless,
they exhibit a limited maturity “mismatch” expressed in number of days.
Shadow banking risks from securities lending and the reinvestment of cash collateral:
Facilitation of securities lending appears to facilitate credit growth and a build‐up of leverage
in the financial system
- EU securities lending markets contribute to facilitating credit growth and a build‐up of
leverage in the financial system: SFTs allow some agent lenders to obtain funding against
their own assets with ease (the total value of cash collateral received against securities on

Occasional Paper No. 6 September 2014 Securities financing transactions and the (re)use of collateral in Europe An analysis of the first data collection conducted by the ESRB from a sample of European banks and agent lenders
53
loan amounts to €609.6 billion and the cash collateral obtained from securities lending is
typically reinvested into reverse repos (65%). Such a funding chain involving short‐term debt
may add to systemic vulnerability and contribute to increasing the overall degree of pro‐
cyclicality in the financial system.
Maturity transformation
- Agent lenders engage in a significant amount of maturity transformation, which gives rise to
both redemption risks and liquidity risks. A large amount of cash collateral received from
securities loans with an open maturity is reinvested at fixed maturity, which creates
potential redemption risks in case of a run under stressed market conditions. In addition,
some cash collateral received either at open or short maturity is reinvested in instruments
at long maturity (i.e. with an expected long liquidation period).
Liquidity transformation
- The degree of liquidity transformation done through securities lending transactions appears
to be limited, as a high proportion of assets in which cash collateral is reinvested are of high
quality, mainly investment‐grade debt securities.
Collateral fire sales and procyclicality
- Data on SFT margins and haircuts were not collected in this first data collection exercise.
Any future repetition of this exercise will therefore have to include such refinements. Fire
sales are less of a direct risk for securities transactions collateralised with cash. However,
reverse repo financing owing to the reinvestment of cash collateral implies that
counterparties of agent lenders might bear the risk of losses.
Interconnectedness via securities lending
- The build‐up of significant exposures across financial institutions of different types
(custodians, asset managers, credit institutions and insurance companies) can contribute to
the risk of contagion if an institution in the network becomes distressed. The data collection
exercise seemed to confirm that the reinvestment of cash collateral in conjunction with
securities lending can become a source of systemic risk and contagion in the light of the
complex nexus of transactions conducted by agent lenders on behalf of other client
institutions.
Currency mismatch
- There seems to be a limited overall risk from currency mismatch related to securities
lending. The securities loaned, cash collateral received and instruments in which the
collateral is reinvested are largely denominated in one of the major currencies (USD, EUR,
GBP, JPY, etc.). This suggests limited sensitivity to currency risk or foreign exchange
volatility. In addition, the share of each of these currencies in each of the three stages

Occasional Paper No. 6 September 2014 Securities financing transactions and the (re)use of collateral in Europe An analysis of the first data collection conducted by the ESRB from a sample of European banks and agent lenders
54
identified above is broadly stable, suggesting that mismatch is limited. At the individual
institution level, however, there might be some degree of currency mismatch
concentration.

Occasional Paper No. 6 September 2014 Securities financing transactions and the (re)use of collateral in Europe An analysis of the first data collection conducted by the ESRB from a sample of European banks and agent lenders
55
Appendix A: Legal and accounting background on SFTs
Legal structure
Collateral received in financial transactions may not be eligible for re‐use depending on the legal
structure of the specific transaction. Securities transferred in securities lending and repo
transactions are typically eligible for re‐use, while a material percentage of securities collateral
received in derivative transactions is not eligible for re‐use. In addition, many hedge funds have
restrictions on the ability of their prime brokers to re‐hypothecate their assets.
In a typical repo transaction, the legal ownership of the collateral is transferred from the cash
borrower to the cash lender and the economic benefits associated with ownership, such as
dividends and coupons, are paid back to the original owner of the collateral. This means that the
cash lender, who is the legal owner of the collateral securities during the life of the repo
transaction, is entitled to sell the securities or post them as collateral in another transaction, as
if he owned the securities outright. The borrower's proprietary interest in the assets posted as
collateral is replaced with a contractual claim to redelivery of equivalent securities. If the lender
becomes insolvent before the securities are returned, the borrower must claim in the lender's
insolvency as an unsecured creditor for the difference between the cash received and the value
of the assets posted as collateral. Similarly, in a typical securities lending transaction, the legal
ownership of the securities lent and the collateral is transferred between the beneficial owner
and the securities borrower. This means that collateral received in the vast majority of securities
lending and repo transactions can be re‐used (except in the rare situation where collateral is
received in the form of a pledge/security interest rather than title transfer).
Similarly, in derivatives transactions, collateral can be received in the form of title transfer or
security interest. All collateral received under title transfer is eligible for re‐use, because the
ownership of the asset has been transferred. Collateral received under security interest may be
eligible for re‐use subject to the consent of the delivering party; ISDA CSAs generally include this
right of re‐use unless the parties specifically remove it. According to ISDA Margin Survey 2013,
only 57.8% of securities collateral received by large firms in over‐the‐counter derivatives can be
re‐used (92.7% for cash collateral).
Re‐hypothecation is often defined as the practice where a prime broker re‐uses collateral
posted by their clients. When borrowing from a prime broker, the client almost always needs to
post margin or collateral to protect the prime broker from counterparty risk. The assets held on
behalf of the client may be re‐used by the prime broker for its own purposes, if allowed in the
prime brokerage agreement. Typically, prime brokers are required by regulations to hold client
assets on segregated accounts. However, the rules would not apply when the full ownership of
the asset is transferred to the prime broker for the purposes of securing the client’s obligations,
according to the Markets in Financial Instruments Directive. Therefore, once the prime broker
exercises its right to re‐hypothecate these assets, the title to the asset transfers to the prime
broker and the rules no longer apply.

Occasional Paper No. 6 September 2014 Securities financing transactions and the (re)use of collateral in Europe An analysis of the first data collection conducted by the ESRB from a sample of European banks and agent lenders
56
Upon re‐hypothecation, the client’s assets are removed from the prime broker’s client account
and the client’s proprietary interest in the assets is replaced with a contractual claim to
redelivery of equivalent securities. If the prime broker becomes insolvent before the securities
are returned, the client must enter a claim as an unsecured creditor for an amount equal to the
value of the re‐hypothecated securities. When Lehman Brothers collapsed, clients of Lehman’s
prime brokerage business, which had allowed Lehman to re‐hypothecate securities positions to
obtain funding, were deemed unsecured creditors and found themselves without access to their
positions after Lehman declared bankruptcy. After the crisis, many hedge funds have placed
contractual limits, , usually 140% of their net borrowing, on the extent to which prime brokers
can re‐hypothecate their assets.
Accounting treatment
Under the International Financial Reporting Standards, accounting rules for securities collateral
received in financial transactions reflect the underlying arrangements that the party delivering
the collateral retains the risks and rewards associated with owning the securities posted as
collateral, which would remain on the balance sheet of the collateral poster irrespective of
whether or not the collateral is eligible for re‐use. However, when the transaction involves a
cash leg (whether as cash lent in a repo transaction or cash collateral in a securities lending or
derivative transaction), it will be reported as a liability on the balance sheet of the party
receiving the cash, together with a corresponding asset depending on how the cash collateral is
reinvested. If a transaction lacks a cash leg, it will not appear on the balance sheet at all.
Collateral fungibility
In most securities financing and derivative transactions where collateral is delivered via title
transfer, the collateral receiver is only obliged to return “equivalent securities” when the
transaction expires. “Equivalent securities” are typically defined as securities issued by the same
entity in the same issue.38 This, and the fact that the legal ownership of the securities is
transferred to the collateral receiver, means that collateral is fungible, e.g. securities received as
collateral are no different to equivalent securities held outright on the balance sheet. The
fungible nature of collateral means that many firms struggle to identify how much collateral
they have re‐used. This is because securities received as collateral are managed together with
securities held outright on the balance sheet in a large pool of assets and they cannot be
distinguished from one another. Nonetheless, it remains possible to broadly estimate the
reliance of firms on collateral re‐use by comparing the amount of unencumbered assets held on
balance sheet to the collateral received and eligible for re‐use.
38 In the tri‐party repo market, the definition of “equivalent securities” can be much broader and include a basket of different securities.

Occasional Paper No. 6 September 2014 Securities financing transactions and the (re)use of collateral in Europe An analysis of the first data collection conducted by the ESRB from a sample of European banks and agent lenders
57
Appendix B: List of sample institutions and possible classifications
The following tables show the classification of all banks by geography, business model and G‐SIB
status. A further breakdown of euro area banks is also provided according to countries that
experienced relatively higher and lower CDS spread levels.
Table 7: Classification by geography and business model Geographic Business model # banks Total assets
UK Investment 8 3,888
Diversified 5 6,981
Commercial 0 0
Euro area banks Investment 0 0
Diversified 11 10,628
Commercial 11 5,266
Scandinavian Investment 0 0
Diversified 3 1,408
Commercial 0 0
Total 38 28,192
Table 8: Classification by G‐SIB status and business model G‐SIB bucket Business model # banks Total asset volume
3 or 4 Investment 2 307
Diversified 4 7,742
Commercial 1* 194
1 or 2 Investment 5 3,384
Diversified 6 6,915
Commercial 3 3,076
non G‐SIB Investment 1 315
Diversified 7 4,381
Commercial 9 1,996
Total 38 28,192
Notes: * A G‐SIB bank in bucket 3 or 4 has provided information on a subsidiary classified as commercial bank. It has
been assigned the same bucket as the mother bank.
Table 9: Classification of euro area banks by area and size39 # Euro area banks Total asset volume
Countries not exposed to
sovereign debt tensions
Diversified 9 9,028 Commercial 6 2,869
Countries exposed to
sovereign debt strains (B)
Diversified 2 1,600 Commercial 5 2,397
Large 6 9,617 Medium 5 3,626
Small 11 2,651
39 The classification as group A and group B banks has been based on CDS spreads. Area B comprises
banks from Italy, Spain and Ireland. All other euro area banks are in area A.

Occasional Paper No. 6 September 2014 Securities financing transactions and the (re)use of collateral in Europe An analysis of the first data collection conducted by the ESRB from a sample of European banks and agent lenders
58
Appendix C: List of SFT Team Members
The authors of this report are all part of a team that works on topics related to shadow banking
and that is formed by members of the Joint ATC‐ASC Expert Group on Shadow Banking (JEGS) of
the ESRB and experts from ESRB member institutions and the ESRB Secretariat. This report has
benefitted from the input of the entire team, which is listed below.
Joachim Keller (Chair) Banque Nationale de Belgique
Antoine Bouveret European Securities and Markets
Authority/International Monetary Fund
Romain Calleja European Systemic Risk Board
Francesco de Rossi European Systemic Risk Board
Leonor Dormido (former member) European Systemic Risk Board
Cristina Picillo Banca d’Italia
Michael Grill (former member) Deutsche Bundesbank
Zijun Liu UK Prudential Regulation Authority
Julien Mazzacurati European Securities and Markets Authority
Martin Mitov European Commission
Philippe Molitor European Central Bank
Steffen Meusel Bundesanstalt für Finanzdienstleistungsaufsicht
Ben Pott European Banking Authority (until May 2014)
Victor Corneliu Savin European Commission
Claudia Schwarz (former member) Deutsche Bundesbank
Jonas Söderberg Sveriges Riksbank
John Theal Banque Centrale du Luxembourg
Marco Fattore (former member) Banca d’Italia

Occasional Paper No. 6 September 2014 Securities financing transactions and the (re)use of collateral in Europe An analysis of the first data collection conducted by the ESRB from a sample of European banks and agent lenders
59
E. References
Duffie, D. (2011), “Systemic Risk Exposures: A 10‐by‐10‐by‐10 Approach”, Working Paper Series,
No 17281, National Bureau of Economic Research.
European Systemic Risk Board (2013), “Towards a monitoring framework for securities financing
transactions,” Occasional Paper No 2, March.
European Commission (2014), Proposal for a regulation of the European Parliament and of the
Council on reporting and transparency of securities financing transactions,” COM (2014) 40
final, 29.1.2014.
Financial Stability Board (2011), “Shadow Banking: Scoping the Issues,” April.
Financial Stability Board (2012), “Securities Lending and Repos: Market Overview and Financial
Stability Issues,” April.
Financial Stability Board (2013), “Strengthening oversight and regulation of shadow banking:
Policy framework for addressing shadow banking risks in securities lending and repos,” August
(http://www.financialstabilityboard.org/publications/r_130829b.pdf).
Keane, Frank M. (2013), “Securities Loans Collateralized by Cash: Reinvestment Risk, Run Risk,
and Incentive Issues,” Current Issues in Economics and Finance, Vol. 19, No 3.
Peltonen, T., Scheicher, M. and Vuillemey, G. (2013), “The network structure of the CDS market
and its determinants”, European Central Bank Working Paper 1583,
Singh, Manmohan (2011), "Velocity of Pledged Collateral: Analysis and Implications," IMF
Working Paper 11/256.
Financial Stability Board (2013), “An Overview of Policy Recommendations for Shadow Banking”,
August (http://www.financialstabilityboard.org/publications/r_130829a.pdf).