OC Real Estate Report_03_2010
5
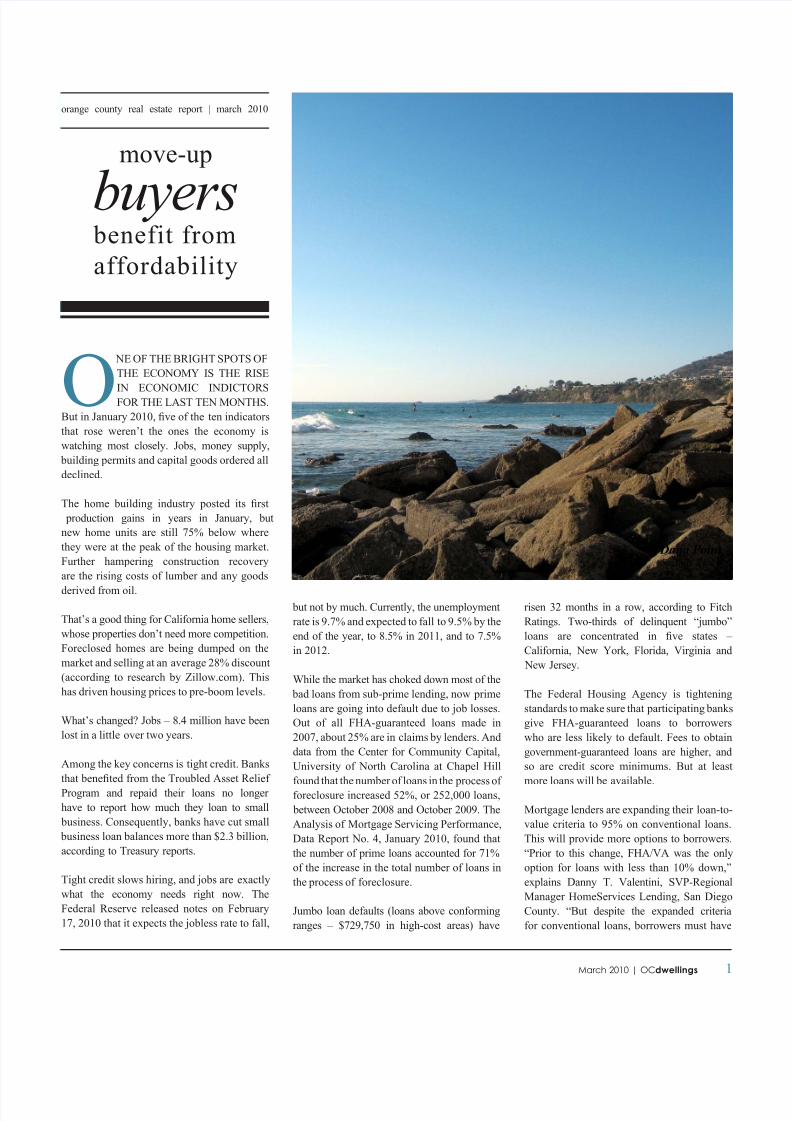
1 March 2010 | OCdwellings move-up buyers benefit from affordability O NE OF THE BRIGHT SPOTS OF THE ECONOMY IS THE RISE IN ECONOMIC INDICTORS FOR THE LAST TEN MONTHS. But in January 2010, ve of the ten indicators that rose weren’t the ones the economy is watching most closely. Jobs, money supply, building permits and capital goods ordered all declined. The home building industry posted its rst production gains in years in January, but new home units are still 75% below where they were at the peak of the housing market. Further hampering construction recovery are the rising costs of lumber and any goods derived from oil. That’s a good thing for California home sellers, whose properties don’t need more competition. Foreclosed homes are being dumped on the market and selling at an average 28% discount (according to research by Zillow.com). This has driven housing prices to pre-boom levels. What’s changed? Jobs – 8.4 million have been lost in a little over two years. Among the key concerns is tight credit. Banks that beneted from the Troubled Asset Relief Program and repaid their loans no longer have to report how much they loan to small business. Consequently, banks have cut small business loan balances more than $2.3 billion, according to Treasury reports. Tight credit slows hiring, and jobs are exactly what the economy needs right now. The Federal Reserve released notes on February 17, 2010 that it expects the jobless rate to fall, but not by much. Currently, the unemployment rate is 9.7% and expected to fall to 9.5% by the end of the year, to 8.5% in 2011, and to 7.5% in 2012. While the market has choked down most of the bad loans from sub-prime lending, now prime loans are going into default due to job losses. Out of all FHA-guaranteed loans made in 2007, about 25% are in claims by lenders. And data from the Center for Community Capital, University of North Carolina at Chapel Hill found that the number of loans in the process of foreclosure increased 52%, or 252,000 loans, between October 2008 and October 2009. The Analysis of Mortgage Servicing Performance, Data Report No. 4, January 2010, found that the number of prime loans accounted for 71% of the increase in the total number of loans in the process of foreclosure. Jumbo loan defaults (loans above conforming ranges – $729,750 in high-cost areas) have risen 32 months in a row, according to Fitch Ratings. Two-thirds of delinquent “jumbo” loans are concentrated in ve states – California, New York, Florida, Virginia and New Jersey. The Federal Housing Agency is tightening standards to make sure that participating banks give FHA-guaranteed loans to borrowers who are less likely to default. Fees to obtain government-guaranteed loans are higher, and so are credit score minimums. But at least more loans will be available. Mortgage lenders are expanding their loan-to- value criteria to 95% on conventional loans. This will provide more options to borrowers. “Prior to this change, FHA/VA was the only option for loans with less than 10% down,” explains Danny T. Valentini, SVP-Regional Manager HomeServices Lending, San Diego County. “But despite the expanded criteria for conventional loans, borrowers must have orange county real estate report | march 2010 Dana Point Strands Beach
-
Upload
kendra-stevens -
Category
Documents
-
view
216 -
download
0
Transcript of OC Real Estate Report_03_2010
8/9/2019 OC Real Estate Report_03_2010
http://slidepdf.com/reader/full/oc-real-estate-report032010 1/4
1March 2010 | OCdwellings
move-up
buyers benefit from
affordability
O NE OF THE BRIGHT SPOTS OF
THE ECONOMY IS THE RISE
IN ECONOMIC INDICTORS
FOR THE LAST TEN MONTHS.
But in January 2010, ve of the ten indicators
that rose weren’t the ones the economy is
watching most closely. Jobs, money supply,
building permits and capital goods ordered all
declined.
The home building industry posted its rst
production gains in years in January, but
new home units are still 75% below where
they were at the peak of the housing market.
Further hampering construction recovery
are the rising costs of lumber and any goods
derived from oil.
That’s a good thing for California home sellers,
whose properties don’t need more competition.
Foreclosed homes are being dumped on the
market and selling at an average 28% discount
(according to research by Zillow.com). This
has driven housing prices to pre-boom levels.
What’s changed? Jobs – 8.4 million have been
lost in a little over two years.
Among the key concerns is tight credit. Banks
that beneted from the Troubled Asset Relief
Program and repaid their loans no longer
have to report how much they loan to small
business. Consequently, banks have cut small
business loan balances more than $2.3 billion,
according to Treasury reports.
Tight credit slows hiring, and jobs are exactly
what the economy needs right now. The
Federal Reserve released notes on February
17, 2010 that it expects the jobless rate to fall,
but not by much. Currently, the unemployment
rate is 9.7% and expected to fall to 9.5% by the
end of the year, to 8.5% in 2011, and to 7.5%
in 2012.
While the market has choked down most of the
bad loans from sub-prime lending, now prime
loans are going into default due to job losses.
Out of all FHA-guaranteed loans made in
2007, about 25% are in claims by lenders. And
data from the Center for Community Capital,
University of North Carolina at Chapel Hill
found that the number of loans in the process of
foreclosure increased 52%, or 252,000 loans,
between October 2008 and October 2009. The
Analysis of Mortgage Servicing Performance,
Data Report No. 4, January 2010, found that
the number of prime loans accounted for 71%
of the increase in the total number of loans in
the process of foreclosure.
Jumbo loan defaults (loans above conforming
ranges – $729,750 in high-cost areas) have
risen 32 months in a row, according to Fitch
Ratings. Two-thirds of delinquent “jumbo”
loans are concentrated in ve states –
California, New York, Florida, Virginia and
New Jersey.
The Federal Housing Agency is tightening
standards to make sure that participating banks
give FHA-guaranteed loans to borrowers
who are less likely to default. Fees to obtain
government-guaranteed loans are higher, and
so are credit score minimums. But at least
more loans will be available.
Mortgage lenders are expanding their loan-to-
value criteria to 95% on conventional loans.
This will provide more options to borrowers.
“Prior to this change, FHA/VA was the only
option for loans with less than 10% down,”
explains Danny T. Valentini, SVP-Regional
Manager HomeServices Lending, San Diego
County. “But despite the expanded criteria
for conventional loans, borrowers must have
orange county real estate report | march 2010
Dana Point Strands Beach

8/9/2019 OC Real Estate Report_03_2010
http://slidepdf.com/reader/full/oc-real-estate-report032010 2/4
2March 2010 | OCdwellings
Orange CountyOrange County Is enjoying a *seller’s market in homes priced under $1 million, but the
market is still sensitive after the snubbing it received for the last few years. As prices hit
bottom in Q1 2009, sales volume returned, but both sales volume and price strength
ebbed when they surpassed the numbers in late 2008. Buyers and sellers should pay close
attention to inventory levels as they list their homes and make offers to purchase.
*A balanced market is widely accepted as having six months of inventory on hand with market conditions favorableto both buyers and sellers. A buyer’s market is characterized by conditions such as high inventories, falling prices,concessions by sellers, and incentives among other indicators. A seller’s market has low inventories of homes for sale,escalating prices, and keen competition between buyers, including multiple offers.
FICO scores of 720 for single-family homes
and 740 for condominiums to qualify.”
In addition, the FHA has suspended the 90-
day anti-ipping rule, allowing borrowers
to resell homes they’ve bought at a discount
(such as foreclosures) and improving them to
command more on the market.
While these changes will clearly help home
buyers with good credit, the question may still
remain: what does housing have going for it?
The answer is unprecedented affordability.
After four years of falling prices, the typical
American family making the national median
income of $64,000 can buy any of 70.8%
of homes being sold on the market today,
according to the National Association of
Home Builders and Wells Fargo. That’s a little
off the high of 72.5% reached in Q1 2009, but
far better than the 55% affordability seen in
Q2 2008.
Another indication of affordability: the
percentage of households able to buy an entry-
level home in California reached 64% in Q2
2009, according to the California Association
of REALTORS®.
Affordability is even more appealing for
move-up buyers.
Here is an example, provided by DavidDeisinger, a REALTOR® with Prudential
California Realty in Carlsbad, California.
*The sellers of a 1,600 square-foot, 2-bedroom,
2-bath condominium want to move up. They
have $200,000 in equity and an outstanding
loan amount of $200,000 at 6%. The move-
up seller’s monthly payment is $1935.77
including principal and interest, $1,199 .10;
property tax, $366.67; and homeowners fee,
$370.
For only a few hundred dollars more a month,
these move-up sellers can purchase a newer 2,200-square-foot, 4-bedroom, 3-bath home
for $550,000.
Here’s how. Putting the $200,000 in equity
from the condo down, the move-up buyers
borrow $350,000 at 6%. With a principal/
interest payment of $1878.88, plus taxes,
$504.17, and $130 a month in homeowner
association fees, the move-up sellers can have
a larger home with more bedrooms and baths
for $2,513.05 – a difference of $577.28 per
month.
They’ll also get a tax refund of up to $6,500,
in essence reducing the cost of buying the new
home another .01%.
The example works well even without the
large down payment – because the prices of
homes in the entry-level ranges are rising faster
than those of higher-range homes. Move-up
inventory is more attractive by comparison,
because the less expensive inventory is priced
as high as the move-up inventory in terms of
square footage.
At a sales price of $400,000 and 1,600 squarefeet, the condo in the example above costs
$250 per square foot. The move-up home
at $550,000 and 2,200 square feet – single-
family, updated with granite, and lower in
HOA fees for similar amenities – is also $250
per square foot.
Advice for BuyersDo the math with your real estate agent and
loan ofcer. Be prepared with income and asset
documentation before you shop for a home,
so you can make a solid offer the seller will
accept. Time is of the essence – shop early!
Tax incentives end April 30, 2010, and the
last-minute crush will cause lender pipelines
to clog, slowing closings. You must have an
accepted contract by the April deadline, and
occupy your new home by June 30, 2010.
Advice for SellersWith FHA rules minimizing seller incentives to
buyers, it’s more important than ever to make
your home stand out from the competition in
terms of both price and features. Make sure
your home is immaculate and move-in ready,
with no repairs or critical work left undone.
*Loan and purchase terms are examples onlyand any seller and buyer’s particular costs
will be dependent on their credit scores,
income information, and loan programs
available at the time of their sale or purchase.
Prudential California Realty makes no
promise or guarantee regarding the costs of
any particular purchase or loan. See your
local Prudential agent for examples in your
area. Prudential strongly recommends that
all buyers and sellers consult with their tax
and loan professionals regarding real estate
transactions.
kendra stevens REALTOR ® License #01845227
independently owned and
operated
8/9/2019 OC Real Estate Report_03_2010
http://slidepdf.com/reader/full/oc-real-estate-report032010 3/4
3March 2010 | OCdwellings
10.8
9.1
6.8
4.9
4.0
2.8
2.4
2.5
0.0 2.0 4.0 6.0 8.0 10.0 12.0
$900K and over
$800K - $899K
$700K - $799K
$600K - $699K
$500K - $599K
$400K - $499K
$300K - $399K
Under $300K
7.9
3.4
3.0
3.1
2.4
2.3
2.0
1.6
0.0 2.0 4.0 6.0 8.0 10.0
$900K and over
$800K - $899K
$700K - $799K
$600K - $699K
$500K - $599K
$400K - $499K
$300K - $399K
Under $300K
$292
$304
$328
$319
$511
$0 $100 $200 $300 $400 $500 $600
PENDING SALE
HOLD DO NOT SHOW
CLOSED SALE
BACKUP OFFERS
ACTIVE
Sellers should carefully consider current buyer
demand when pricing their home for sale.
When list prices per square foot of Backup
and Pending status properties are below that
of Active properties, sellers should ask for
pricing counsel from their Agent.
Detached homes are enjoying a heated
seller’s market. Only homes priced $900K
and above have sluggish inventory levels.
Attached homes are also selling briskly
under $1 million, but attached homes
priced $900K and above are in danger of
languishing.
The disparity between active listings’
price per square foot and that of sold
underscores the heated seller’s market in
affordable homes.
Detached Properties - Inventory in Months
Attached Properties - Inventory in Months
Detached Properties - Pricing Realty for Sellers, per square foot

8/9/2019 OC Real Estate Report_03_2010
http://slidepdf.com/reader/full/oc-real-estate-report032010 4/4
4March 2010 | OCdwellings
927
1,426
1,009
1,155
1,081
1,019
1,074
1,002983
967
1,087
920
0
400
800
1,200
1,600
0
300
600
900
1,200
1,500
New Listings Listings Absorbed
New Listings 920 1087 983 967 1002 1074 1019 1081 1155 1009 927 1426
Listings Absorbed 757 982 978 925 1096 1075 1051 1060 1068 906 943 1320
2009/02 2009/03 2009/04 2009/05 2009/06 2009/07 2009/08 2009/09 2009/10 2009/11 2009/12 2010/01
1,542
1,339
2,250
1,783
1,6561,6341,7061,664
1,533 1,5861,5671,442
0
500
1,000
1,500
2,000
2,500
0
500
1,000
1,500
2,000
New Listings Listings Absorbed
New Listings 1442 1567 1533 1586 1664 1706 1634 1656 1783 1542 1339 2250
Listings Absorbed 1217 1470 1573 1537 1648 1575 1657 1619 1491 1466 1336 1687
2009/02 2009/03 2009/04 2009/05 2009/06 2009/07 2009/08 2009/09 2009/10 2009/11 2009/12 2010/01
$232
$247
$260
$254
$327
$0 $100 $200 $300 $400
PENDING SALE
HOLD DO NOT SHOW
CLOSED SALE
BACKUP OFFERS
ACTIVE
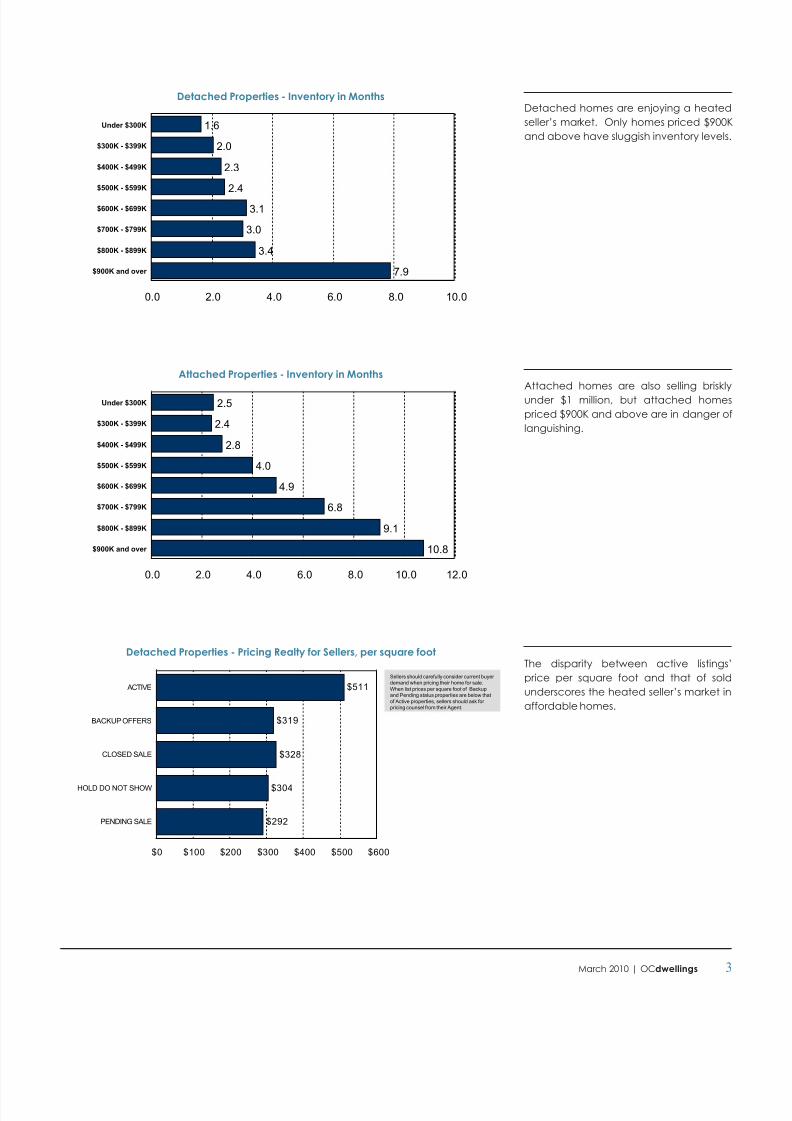
Sellers should carefully consider current buyer
demand when pricing their home for sale.
When list prices per square foot of Backup
and Pending status properties are below that
of Active properties, sellers should ask for
pricing counsel from their Agent.
Like detached homes, attached
properties are selling much faster in the
affordable ranges, but lower pending
prices per square foot than solds suggests
that attached home buyers have more
leverage.
As inventories depleted toward the end
of 2009, sellers decided to test the market
in January, increasing new listings by 31%.
Absorption rates also rose in January, but
only by 14%. If sellers ood the market,
prices could be impacted.
Optimistic attached home sellers also
increased new listings on the market in
January 2010 (+38%) over December
2009, to the highest inventory levels in two
years. Absorption rates increased only by
5% month-over-month, so sellers should
beware of ooding the market with new
inventory if absorption rates don’t pick up.
Attached Properties - Pricing Realty for Sellers, per square foot
Detached Properties - Monthly Listings Taken and Absorbed
12 Months through January 2010
Attached Properties - Monthly Listings Taken and Absorbed
12 Months through January 2010
independently owned and
operated