
OBSERVER - aat.anu.edu.au
36
Celebrating 40 Years of AAT Science Huntsman Eye Sees Deep | SAMI unveils galaxy relation | AAO Shaw Visitor Scheme OBSERVER THE AUSTRALIAN ASTRONOMICAL OBSERVATORY NEWSLETTER NUMBER 126 FEBRUARY 2015
Transcript of OBSERVER - aat.anu.edu.au

Celebrating 40 Years of AAT Science
Huntsman Eye Sees Deep | SAMI unveils galaxy relation | AAO Shaw Visitor Scheme
OBSERVERTHE AUSTRALIAN ASTRONOMICAL OBSERVATORY NEWSLETTER NUMBER 126 FEBRUARY 2015
Director’s messageWarrick Couch
ContentsSCIENCE HIGHLIGHTSReflecting on 40 Years of AAT Operations 4
Distant ‘cannibal twin’ shows how galaxies grow 9
SAMI unveils a unified relation for all galaxies 10
Testing HERMES radial velocity precision 12
News from OzDES 14
Huntsman Eye Sees Deep 19
The FunnelWeb Survey: Building the HD Catalog of the 21st Century 21
Adaptive Optics Experiments on the AAT 23
OBSERVATORY NEWSThe AAO Shaw Visitor Scheme 25
Hidden GeMS: observing with the Gemini multi-conjugate adaptive optics system 26
LOCAL NEWSStarFest 2014 28
Planning Day 2014 – Old and New 30
ITSO Corner 32
News from North Ryde 34
Letter from Coonabarabran 35
As we move into 2015 and put 2014 behind us, it is a time when we are very mindful of the AAO’s past and its rich and distinguished track record of scientific discovery and technological innovation, but also one when we need to keep a keen eye on its future.
The year that was, 2014, marked two highly significant anniversaries for the AAO: 40 years since ‘first light’ was achieved on the AAT on 27 April 1974, and 40 years since the official inauguration (by HRH Prince Charles) of the AAT on 16 October 1974. These two events and, more generally, 2014 being the AAT’s 40th birthday year, were celebrated in a number of different ways both in Sydney and at Siding Spring
Observatory. Here, the highlights were undoubtedly the extraordinarily successful “Starfest” Open Day held at Siding Spring on the long Labor Day weekend in early October – at which the AAT dome was adorned in a stunning red ribbon, and a massive birthday cake featuring the AAT dome was cut and distributed to the huge crowd in attendance – as well as a public lecture on the AAO’s history and future directions held in Sydney on the 16 October. But as often the case, it is also the unexpected things that we remember about significant events, and for me there were two things in this category. Firstly, to have so many colleagues from our neighbouring National Measurement Institute at North
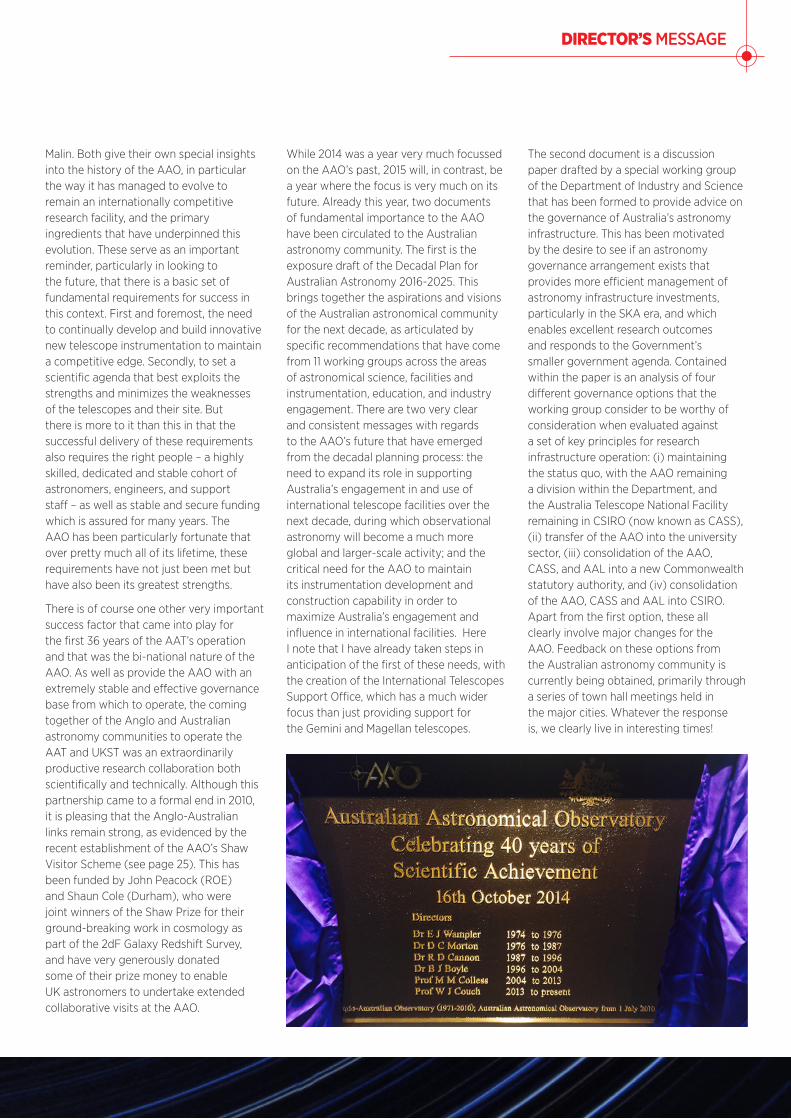
Ryde attend the celebratory morning tea we had on the 16 October, and the great interest they showed in the AAT’s history and the significance of that particular day. Secondly, the special plaque commemorating the AAO’s 40 years of scientific achievement that, unbeknownst to me, was made for the visitors’ gallery in the AAT dome, and which I had the privilege of unveiling at our staff planning day held in early November (see photo below).
As promised in the last issue of the AAO Observer, the 40th birthday theme continues in this one with articles from two very distinguished former AAO staff members – Russell Cannon and David
Front cover photo Credit: J. GaBany (Blackbird Observatory) Caption: The Umbrella Galaxy takes its name from a mysterious feature seen on the left here, that is now found to be debris from a tiny galaxy, only a 50th its size, that has been shredded apart by gravity. The image is a combination of data from the 0.5-metre BlackBird Remote Observatory Telescope and Suprime-Cam on the 8-metre Subaru Telescope. (See Article on Page 9 of this Issue).
DIRECTOR’S MESSAGE
DIRECTOR’S MESSAGE
Malin. Both give their own special insights into the history of the AAO, in particular the way it has managed to evolve to remain an internationally competitive research facility, and the primary ingredients that have underpinned this evolution. These serve as an important reminder, particularly in looking to the future, that there is a basic set of fundamental requirements for success in this context. First and foremost, the need to continually develop and build innovative new telescope instrumentation to maintain a competitive edge. Secondly, to set a scientific agenda that best exploits the strengths and minimizes the weaknesses of the telescopes and their site. But there is more to it than this in that the successful delivery of these requirements also requires the right people – a highly skilled, dedicated and stable cohort of astronomers, engineers, and support staff – as well as stable and secure funding which is assured for many years. The AAO has been particularly fortunate that over pretty much all of its lifetime, these requirements have not just been met but have also been its greatest strengths.
There is of course one other very important success factor that came into play for the first 36 years of the AAT’s operation and that was the bi-national nature of the AAO. As well as provide the AAO with an extremely stable and effective governance base from which to operate, the coming together of the Anglo and Australian astronomy communities to operate the AAT and UKST was an extraordinarily productive research collaboration both scientifically and technically. Although this partnership came to a formal end in 2010, it is pleasing that the Anglo-Australian links remain strong, as evidenced by the recent establishment of the AAO’s Shaw Visitor Scheme (see page 25). This has been funded by John Peacock (ROE) and Shaun Cole (Durham), who were joint winners of the Shaw Prize for their ground-breaking work in cosmology as part of the 2dF Galaxy Redshift Survey, and have very generously donated some of their prize money to enable UK astronomers to undertake extended collaborative visits at the AAO.
While 2014 was a year very much focussed on the AAO’s past, 2015 will, in contrast, be a year where the focus is very much on its future. Already this year, two documents of fundamental importance to the AAO have been circulated to the Australian astronomy community. The first is the exposure draft of the Decadal Plan for Australian Astronomy 2016-2025. This brings together the aspirations and visions of the Australian astronomical community for the next decade, as articulated by specific recommendations that have come from 11 working groups across the areas of astronomical science, facilities and instrumentation, education, and industry engagement. There are two very clear and consistent messages with regards to the AAO’s future that have emerged from the decadal planning process: the need to expand its role in supporting Australia’s engagement in and use of international telescope facilities over the next decade, during which observational astronomy will become a much more global and larger-scale activity; and the critical need for the AAO to maintain its instrumentation development and construction capability in order to maximize Australia’s engagement and influence in international facilities. Here I note that I have already taken steps in anticipation of the first of these needs, with the creation of the International Telescopes Support Office, which has a much wider focus than just providing support for the Gemini and Magellan telescopes.
The second document is a discussion paper drafted by a special working group of the Department of Industry and Science that has been formed to provide advice on the governance of Australia’s astronomy infrastructure. This has been motivated by the desire to see if an astronomy governance arrangement exists that provides more efficient management of astronomy infrastructure investments, particularly in the SKA era, and which enables excellent research outcomes and responds to the Government’s smaller government agenda. Contained within the paper is an analysis of four different governance options that the working group consider to be worthy of consideration when evaluated against a set of key principles for research infrastructure operation: (i) maintaining the status quo, with the AAO remaining a division within the Department, and the Australia Telescope National Facility remaining in CSIRO (now known as CASS), (ii) transfer of the AAO into the university sector, (iii) consolidation of the AAO, CASS, and AAL into a new Commonwealth statutory authority, and (iv) consolidation of the AAO, CASS and AAL into CSIRO. Apart from the first option, these all clearly involve major changes for the AAO. Feedback on these options from the Australian astronomy community is currently being obtained, primarily through a series of town hall meetings held in the major cities. Whatever the response is, we clearly live in interesting times!
Australian Astronomical Observatory Newsletter - FEBRUARY 20154
SCIENCE HIGHLIGHTS
Reflecting on 40 Years of AAT OperationsDavid Malin and Russell Cannon
2014 was a year filled with celebrating the 40th Anniversary of Australia’s biggest optical telescope, the 4-metre Anglo-Australian Telescope, and all the spectacular observations and technology developments astronomers and engineers have achieved using it. The following are two personal accounts of the evolution of both the AAT and the AAO over the years, from two AAO associates.
First, we hear from David Malin (AAO, 1976 - 2001) whose work with AAO revolutionized the way humans view the cosmos. Next we hear from Russell Cannon (AAO, 1986 - 2002), who was based at the Royal Observatory, Edinburgh with responsibility for the UKST and its Sky Surveys (1973-1986), then became AAO Director (1986-1996), and continues working on the cutting-edge GALAH Survey with the new HERMES instrument.
The beginnings of the AATby David Malin
Fifty years ago research facilities for southern hemisphere optical astronomy were far behind those under northern skies. Despite its richness and its access to unique objects such the Galactic centre, the Magellanic Clouds and the finest globular clusters, the southern sky was relatively unexplored by modern astronomers. This disparity became even more obvious when radio astronomy began to flourish in Australia, resulting in the Parkes radio telescope, which was commissioned in the early 1960s.
After much discussion, controversy and many alternative proposals from the astronomical communities in both Britain and Australia, it was decided to build a 4-metre-class telescope at Siding Spring, the facilities to be shared equally between astronomers from both countries. As readers might imagine, the sentence above is a bland outline of a long and complex process and not a little controversy, much of which is set out in Gascoigne, Proust and Robins
(1990). The Anglo-Australian Telescope Agreement that made a bi-national telescope possible was signed in 1969, but its final form was hammered out in 1972 during a visit to Canberra by the then UK Minister of Science, Margaret Thatcher and her Australian counterpart at the time,
Malcolm Fraser, both formidable figures. The final agreement was a unique Act of Parliament that made the AAT Board essentially autonomous and largely free from political interference. This agreement formed an excellent basis for a joint Anglo-Australian facility that endured until 2010.
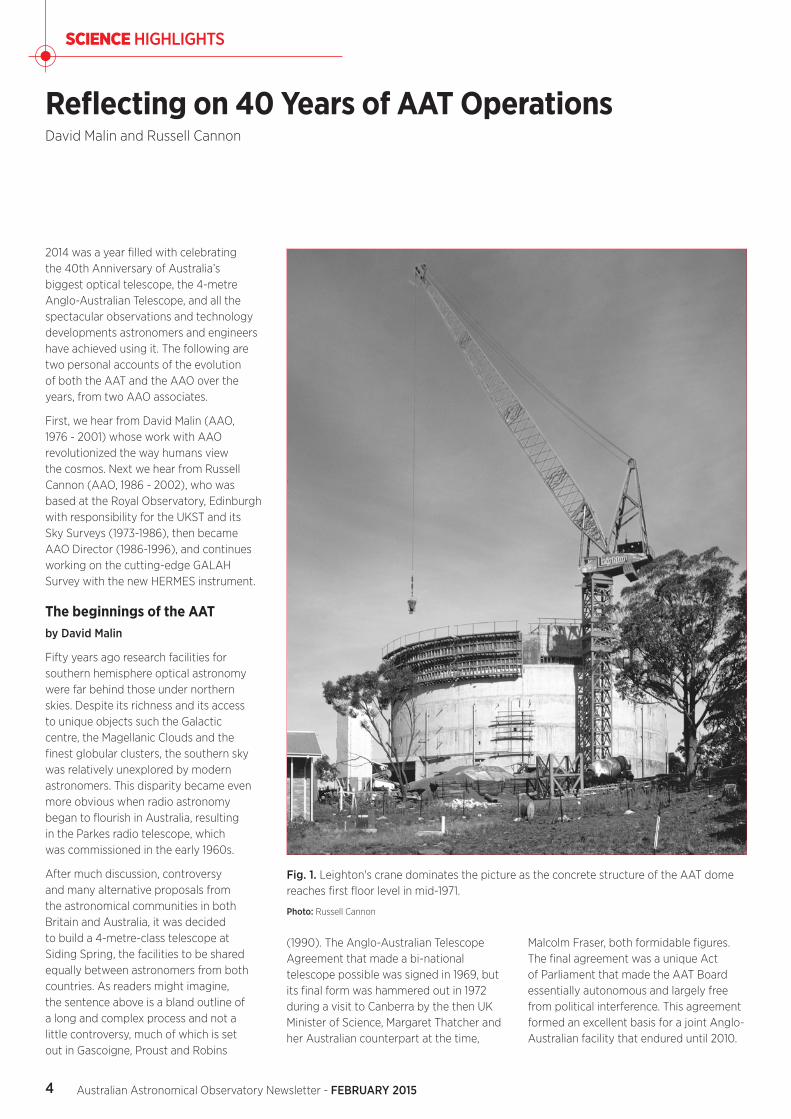
Fig. 1. Leighton's crane dominates the picture as the concrete structure of the AAT dome reaches first floor level in mid-1971.
Photo: Russell Cannon
Australian Astronomical Observatory Newsletter - FEBRUARY 2015 5
SCIENCE HIGHLIGHTS
Construction of the AAT building began in late 1970 and was ready for its telescope in early 1973. The design chosen for the AAT was based on the Kitt Peak 4-m Mayall Telescope, extensively modified to stiffen the horseshoe, and importantly, to use a somewhat slower focal ratio for the primary mirror, F/3.3 compared to F/2.7 for the KPNO instrument. With a triplet corrector, this provided a one-degree field with a 16 arc second per mm plate-scale at the prime focus for photography. Years later the slower focal ratio allowed this to be expanded to a two-degree field for the two-degree field (2dF) instrument. The design of both the building and telescope also allowed for the construction of two coudé foci. Both of these decisions were to have a profound influence on the subsequent evolution of the AAT.
After four years of building construction, telescope assembly and testing, the lengthy commissioning process began in late April 1974, led by Ben Gascoigne, who was also responsible for much of the optical design. Using the newly-installed (but unsilvered) 3.9 m mirror and the telescope's only 'instrument' and detector,
the prime focus camera and photographic plates, the first 'good' image (of the globular cluster Omega Cen) was taken in June 1974, by Ben's co-commissioner, Roderick Willstrop. However, according to Ben, the first usable astronomical plate with a coated mirror was made on the 4-5th of December, and it was of the SMC globular cluster Kron 3, one of his favourite objects. Also recorded in the plate log as in attendance on that memorable night were John Rock, Peter Gillingham and Patrick Wallace. Such was the excitement in these early days that some of these early plates appear to have been fixed in a solution of household cleaner!
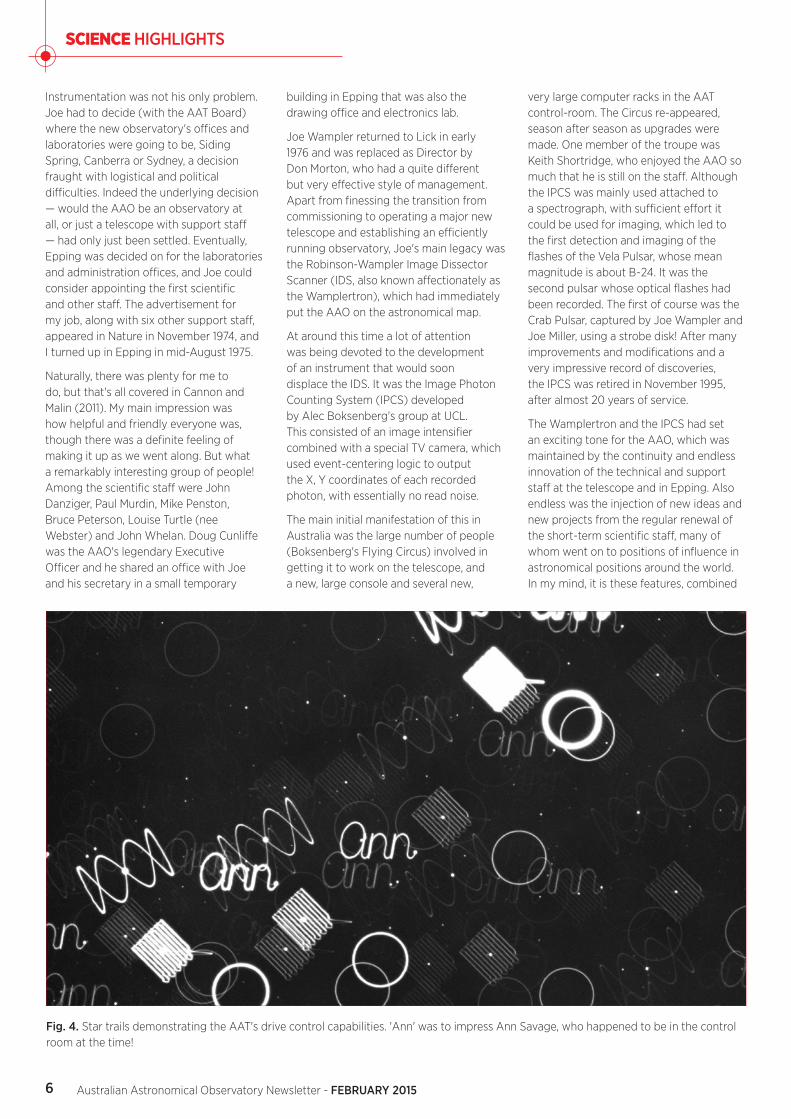
Three weeks later the famous 'Ann plate' was taken, and the computer-driven Lissajou figures and raster scans traced by the stars immediately convinced doubters that the AAT's then-novel and largely untried computer control system—and its mechanical tolerances —were the best in the world.
Six months after the primary mirror had been installed, and before it was aluminised, the telescope was officially
inaugurated by Prince Charles in October 1974. However, apart from prime focus photography the telescope was woefully under-instrumented. This was the situation faced the AAO's first Director, Joe Wampler, who arrived from the Lick Observatory in September 1974.
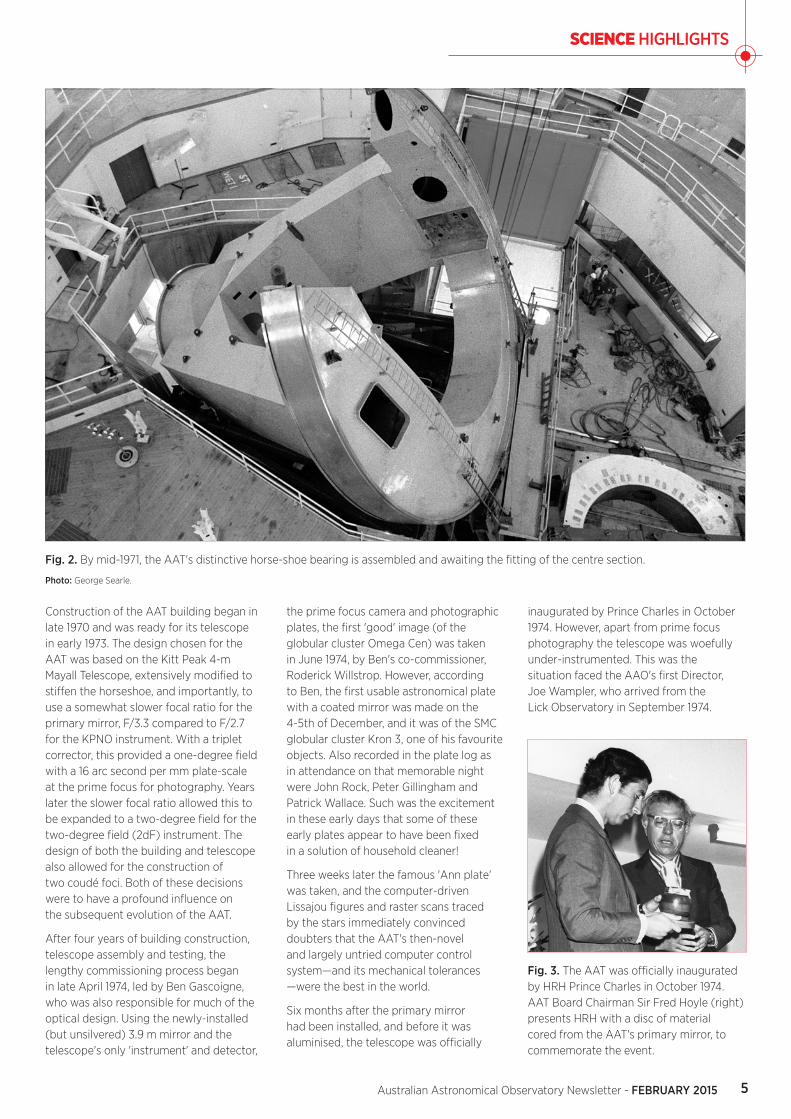
Fig. 2. By mid-1971, the AAT's distinctive horse-shoe bearing is assembled and awaiting the fitting of the centre section.
Photo: George Searle.
Fig. 3. The AAT was officially inaugurated by HRH Prince Charles in October 1974. AAT Board Chairman Sir Fred Hoyle (right) presents HRH with a disc of material cored from the AAT's primary mirror, to commemorate the event.
Australian Astronomical Observatory Newsletter - FEBRUARY 20156
SCIENCE HIGHLIGHTS
Instrumentation was not his only problem. Joe had to decide (with the AAT Board) where the new observatory's offices and laboratories were going to be, Siding Spring, Canberra or Sydney, a decision fraught with logistical and political difficulties. Indeed the underlying decision — would the AAO be an observatory at all, or just a telescope with support staff — had only just been settled. Eventually, Epping was decided on for the laboratories and administration offices, and Joe could consider appointing the first scientific and other staff. The advertisement for my job, along with six other support staff, appeared in Nature in November 1974, and I turned up in Epping in mid-August 1975.
Naturally, there was plenty for me to do, but that's all covered in Cannon and Malin (2011). My main impression was how helpful and friendly everyone was, though there was a definite feeling of making it up as we went along. But what a remarkably interesting group of people! Among the scientific staff were John Danziger, Paul Murdin, Mike Penston, Bruce Peterson, Louise Turtle (nee Webster) and John Whelan. Doug Cunliffe was the AAO's legendary Executive Officer and he shared an office with Joe and his secretary in a small temporary
building in Epping that was also the drawing office and electronics lab.
Joe Wampler returned to Lick in early 1976 and was replaced as Director by Don Morton, who had a quite different but very effective style of management. Apart from finessing the transition from commissioning to operating a major new telescope and establishing an efficiently running observatory, Joe's main legacy was the Robinson-Wampler Image Dissector Scanner (IDS, also known affectionately as the Wamplertron), which had immediately put the AAO on the astronomical map.
At around this time a lot of attention was being devoted to the development of an instrument that would soon displace the IDS. It was the Image Photon Counting System (IPCS) developed by Alec Boksenberg's group at UCL. This consisted of an image intensifier combined with a special TV camera, which used event-centering logic to output the X, Y coordinates of each recorded photon, with essentially no read noise.
The main initial manifestation of this in Australia was the large number of people (Boksenberg's Flying Circus) involved in getting it to work on the telescope, and a new, large console and several new,
very large computer racks in the AAT control-room. The Circus re-appeared, season after season as upgrades were made. One member of the troupe was Keith Shortridge, who enjoyed the AAO so much that he is still on the staff. Although the IPCS was mainly used attached to a spectrograph, with sufficient effort it could be used for imaging, which led to the first detection and imaging of the flashes of the Vela Pulsar, whose mean magnitude is about B~24. It was the second pulsar whose optical flashes had been recorded. The first of course was the Crab Pulsar, captured by Joe Wampler and Joe Miller, using a strobe disk! After many improvements and modifications and a very impressive record of discoveries, the IPCS was retired in November 1995, after almost 20 years of service.
The Wamplertron and the IPCS had set an exciting tone for the AAO, which was maintained by the continuity and endless innovation of the technical and support staff at the telescope and in Epping. Also endless was the injection of new ideas and new projects from the regular renewal of the short-term scientific staff, many of whom went on to positions of influence in astronomical positions around the world. In my mind, it is these features, combined
Fig. 4. Star trails demonstrating the AAT's drive control capabilities. 'Ann' was to impress Ann Savage, who happened to be in the control room at the time!
Australian Astronomical Observatory Newsletter - FEBRUARY 2015 7
SCIENCE HIGHLIGHTS
with the fairly stable and predictable funding environment provided by the AAT Agreement, that have made the AAO such an enduring success. And such a wonderful place to spend 26 years.
In the next contribution, Russell Cannon takes a broader view of the evolution of the AAO and provides a brief account of the scientific highlights.
Reference.
Gascoigne, S.C.B., Proust, K.M. & Robins, M.O. The Creation Of The Anglo-Australian Observatory, Cambridge University Press, 1990.
Cannon, R.D., Malin, D.F. (eds), Celebrating AAO Past, Present Future, Commonwealth Of Australia, 2011.
The Evolution of the AAOBy Russell Cannon
How does one summarise the evolution of a major international facility over 40 years? Describing a few astronomical discoveries and technical innovations would be one way, but how do you rank the most significant topics? And how do you balance one-off spectacular events against the impact of long-term survey projects?
Sometimes a totally unexpected event has led to major discoveries and the rapid development of new ideas and even instruments: Supernova 1987A is an obvious example of what McCrea (1972) described as "Astronomers' Luck."
At the other extreme, the mapping of the large scale structure of the Universe done by the 2dF Galaxy Redshift Survey (2dFGRS: e.g. Colless 2002, AAO Newsletter 100) was carefully planned for nearly a decade while the new 2dF instrument was designed and built, and it took almost as long to complete the survey and analyse all the data.
What external factors are most significant in determining success? The quality of the telescope is clearly fundamental: the AAT was one of the biggest and best telescopes in the world 40 years ago. However, by some measures the power of the AAT has increased by three orders of magnitude since 1975 without any major change to the basic telescope: instrumentation, detectors and data processing have given much larger gains than could have been achieved by simply building a bigger telescope. Since the 1990s, a new wave of 8-10m class telescopes has relegated the AAT to the second rank and now the next generation of ~30m telescopes is taking shape.
How important is site quality? Being able to observe at Siding Spring for up to two-thirds of the time was heavenly for British astronomers accustomed to something closer to ten percent from the foggy Sussex marshes or cloudy Edinburgh, but it soon became
apparent that some other new sites had spectacularly better transparency and 'seeing'. Nevertheless, the AAT was able to stay fully competitive by evolving its suite of instruments and selecting scientific objectives that exploited its strengths and minimised its weaknesses.
One curious corollary of having a relatively poor climate for optical astronomy compared with the 'best' sites on earth, was that Siding Spring Mountain provided a much more comfortable working environment for technical staff, many of whom lived close to the observatory. Thus the AAO was able to develop and maintain complicated or equipment, and to provide a high level of technical support around the clock. This factor at least partially compensated for the lower percentage of good observing conditions.
What about the management, funding and staffing of an observatory? For most of its life, the AAO was a bilateral international facility, with the Australian and British Governments each providing half the funds, appointing half the scientific staff and with two independent time assignment panels each allocating half of the nights. A Board of three individuals from each side, including one representative from each national funding agency, who collectively owned the AAT. This proved to be a remarkably simple, stable and robust arrangement for more than 30 years, leaving the staff largely free to concentrate on keeping the telescope working and doing cutting-edge astronomy. The bilateral AAT Agreement not only provided funding for the AAO, it resulted in a mutually beneficial cross-fertilisation of astronomical ideas and instrumentation expertise. In a similar way, the co-location of the AAO base in Sydney with the CSIRO Division of Radiophysics resulted in many successful collaborations between optical and radio astronomers.
In addition to those mentioned above, various other factors have interacted in complex ways to determine the overall success of the AAO: the rise of observational cosmology, the launch of the Hubble Space Telescope in 1990, and searches for extra-solar planets have drastically altered the overall balance of our field.
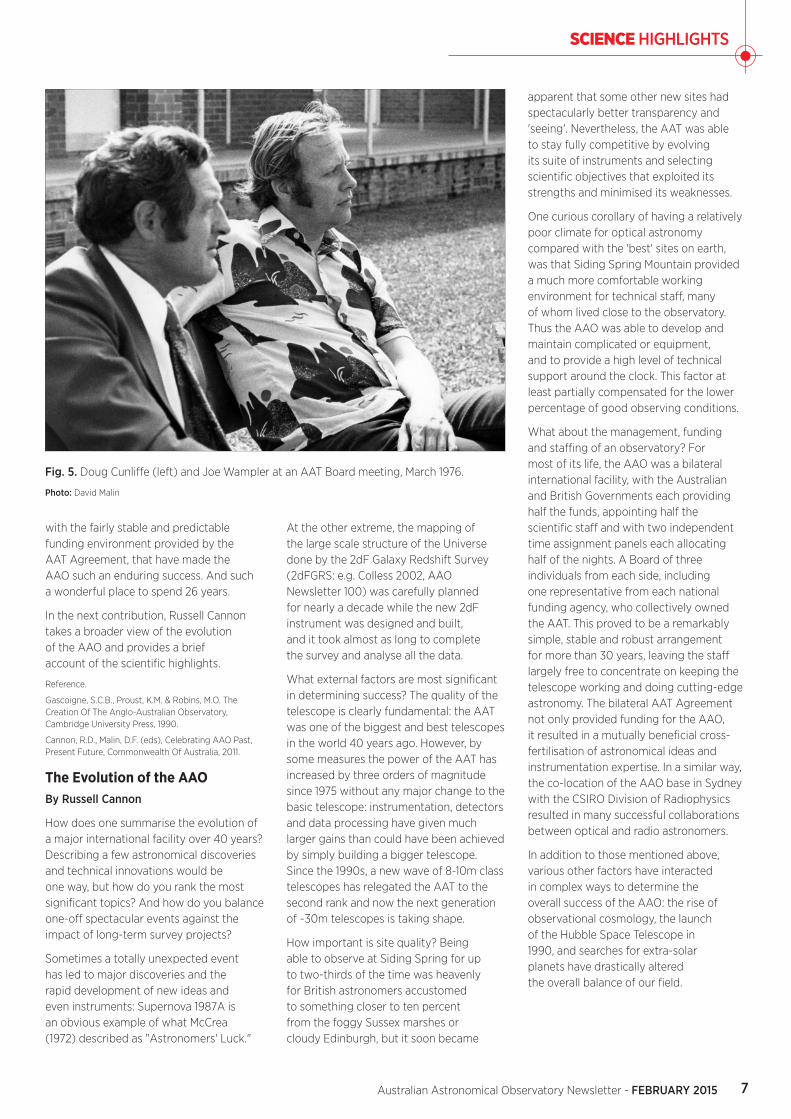
Fig. 5. Doug Cunliffe (left) and Joe Wampler at an AAT Board meeting, March 1976.
Photo: David Malin
Australian Astronomical Observatory Newsletter - FEBRUARY 20158
SCIENCE HIGHLIGHTS
One major change came in 1988 when the UK Schmidt Telescope became part of the AAO, but this was effectively a simplification: the two telescopes had always been planned as a complementary pair, based on the historic success of the Palomar 200-inch Hale and 48-inch Oschin Schmidt telescopes. The symbiosis has continued, with both AAO telescopes now fitted with multi- object fibre-fed spectrographs complete the survey and analyse all the data.
A much more significant development followed the orderly withdrawal of UK support from the AAO from 2005 onwards. A viable long-term future for the AAO only became clear when the Australian Government agreed to take on full funding, from mid-2010, which led to the move of the AAO base to new premises in North Ryde in 2012.
A brief account of some scientific highlights may illustrate the story. The AAT was designed with the expectation that photography would continue to be the primary detector, but (as David has explained) much more efficient electronic detectors were already appearing and the early successes of the AAO were largely based on spectroscopy using the devices invented by Wampler and Boksenberg. Quasars were initially somewhat controversially described as "a major new constituent of the Universe" by Alan Sandage (1965): from 1975 onwards the AAT regularly captured the record for the highest known redshift (ably supported by UK Schmidt and Parkes telescopes, which provided lists of candidate objects).
Quasars were just one component of an explosion of data on 'observational cosmology' that started while the AAT was being built. Other strange objects included the X-ray emitting binary star SS433 and the very few optically detectable pulsars. Optical spectroscopy became feasible for large samples of faint galaxies identified as radio sources. This was an ideal field for the AAT, since its mediocre seeing was no disadvantage for intrinsically faint fuzzy objects, and poor transparency did not spoil the spectra (thin clouds only meant you might have to give longer exposures to get a redshift). These considerations led to the development of fibre spectroscopy at the AAT. The relatively wide field of view at the Cassegrain focus was never used for scientific photography but it
provided an ideal location for a succession of multi- object fibre systems (FOCAP and Autofib), which led ultimately to the new Two-degree Field (2dF) system at the prime focus, while the original 1-degree photographic field is now used by the SAMI system, with 13 independently deployable Integral Field Units (IFUs) for imaging spectroscopy of relatively nearby galaxies.
From the start, it was recognised that the AAT could not be one of the best sites for infrared astronomy. It is at too low an altitude (less than 1200m) and the ambient temperatures are too high for much of the time. Nevertheless, the AAO managed to build several very successful infrared instruments that made important discoveries, mainly thanks to the expertise and interest of staff and visiting astronomers.
Something similar occurred in the relatively esoteric field of polarimetry. The AAT pioneered a broad range of polarimetric observations, from high signal-to-noise ratio spectropolarimetry of bright stars to unexpectedly high levels of polarisation in faint BL Lac objects and X-ray sources, and including imaging polarimetry of extended objects. Although the AAT could never usefully take part in the development of adaptive optics, the very stable coudé foci provided ideal test beds for many experimental techniques, where visiting astronomers could set up equipment but only occasionally collect starlight by simply altering the angle of the final mirror in the coudé train, in a process analogous to the beam lines in a particle accelerator.
The best examples of the versatility of the AAT came when SN1987A burst on the scene in February of that year. This was the first real naked-eye supernova for almost 400 years and a challenging opportunity for the AAT, being situated in the Large Magellanic Cloud in the far southern sky. Fortunately it turned out to be an atypical Type II supernova, with a slow rise to maximum brightness over weeks instead of days and a decline over many months. This gave astronomers time to modify equipment and to think of new types of observations that were uniquely possible. Perhaps most striking was the rapid construction of Peter Gillingham's very high-resolution "wooden spectrograph," utilising an echelle grating from the UCL echelle spectrograph UCLES, then under construction in London; a field
lens figured from scratch by Steve Lee; and with an objective prism borrowed from the Uppsala Schmidt Telescope as a cross-disperser. This successful experiment later led to the fully-engineered Ultra-High Resolution Facility (UHRF).
UCLES itself was completed in 1988 and took the AAT into a new field: high-resolution stellar spectroscopy and the study of chemical abundances. With UCLES, cosmologists took precision spectroscopy to new levels in faint quasars, looking for variability in fundamental physical constants. Somewhat surprisingly, as new 8-10m telescopes began to dominate that research, UCLES developed into one of the world leaders in the new field of planet searching via radial velocity variations.
Within the last year the GALAH survey has begun, using the new HERMES high–resolution spectrograph fed by the original 2dF robot but with a new set of fibre feeds. This project plans to do for the Milky Way what the 2dFGRS did for the Universe: take spectra of up to a million stars, to determine their chemical compositions and kinematics, and deduce the formation history of our Milky Way Galaxy. Perhaps finally we will close the loop, to give a more complete understanding of stars, galaxies and cosmology than is apparent today.
References:
McCrea, W. H., 1972 QJRAS 13 506
Sandage, A. R., 1965 ApJ 141 1560
9
SCIENCE HIGHLIGHTS
Australian Astronomical Observatory Newsletter – FEBRUARY 2015
Distant ‘cannibal twin’ shows how galaxies growHelen Sim
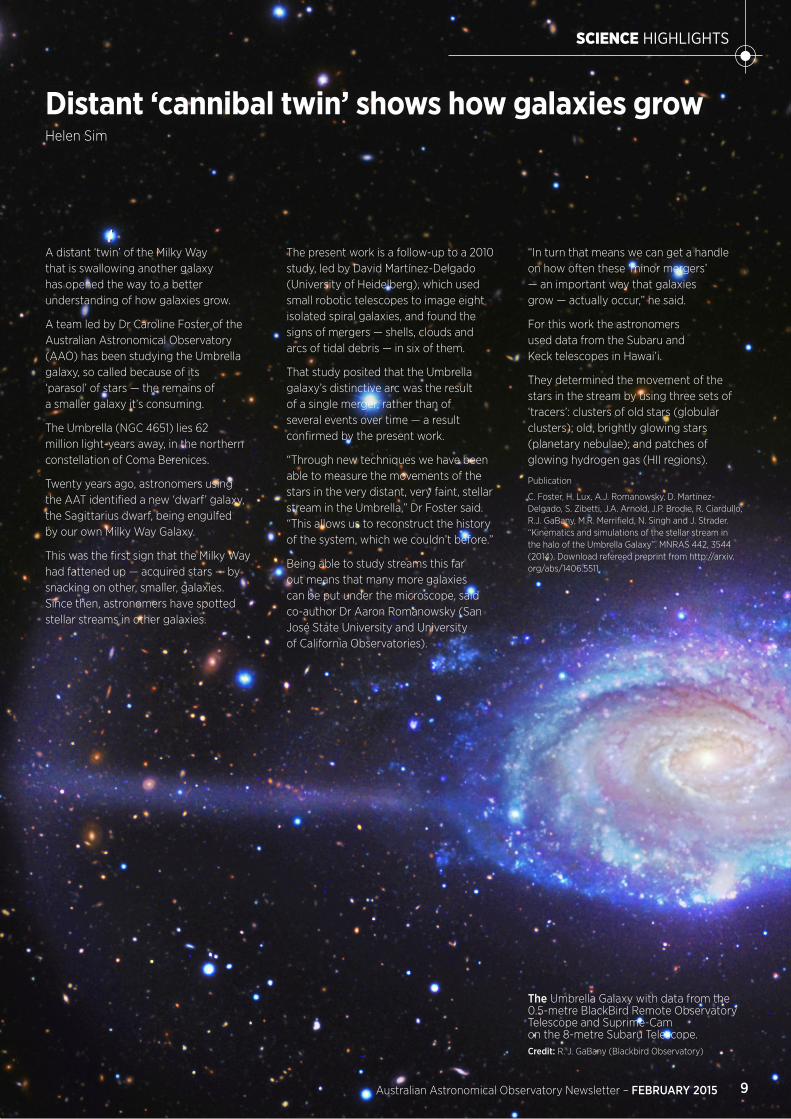
A distant ‘twin’ of the Milky Way that is swallowing another galaxy has opened the way to a better understanding of how galaxies grow.
A team led by Dr Caroline Foster of the Australian Astronomical Observatory (AAO) has been studying the Umbrella galaxy, so called because of its ‘parasol’ of stars — the remains of a smaller galaxy it’s consuming.
The Umbrella (NGC 4651) lies 62 million light-years away, in the northern constellation of Coma Berenices.
Twenty years ago, astronomers using the AAT identified a new ‘dwarf’ galaxy, the Sagittarius dwarf, being engulfed by our own Milky Way Galaxy.
This was the first sign that the Milky Way had fattened up — acquired stars — by snacking on other, smaller, galaxies. Since then, astronomers have spotted stellar streams in other galaxies.
The present work is a follow-up to a 2010 study, led by David Martínez-Delgado (University of Heidelberg), which used small robotic telescopes to image eight isolated spiral galaxies, and found the signs of mergers — shells, clouds and arcs of tidal debris — in six of them.
That study posited that the Umbrella galaxy’s distinctive arc was the result of a single merger, rather than of several events over time — a result confirmed by the present work.
“Through new techniques we have been able to measure the movements of the stars in the very distant, very faint, stellar stream in the Umbrella,” Dr Foster said. “This allows us to reconstruct the history of the system, which we couldn’t before.”
Being able to study streams this far out means that many more galaxies can be put under the microscope, said co-author Dr Aaron Romanowsky (San José State University and University of California Observatories).
“In turn that means we can get a handle on how often these ‘minor mergers’ — an important way that galaxies grow — actually occur,” he said.
For this work the astronomers used data from the Subaru and Keck telescopes in Hawai’i.
They determined the movement of the stars in the stream by using three sets of ‘tracers’: clusters of old stars (globular clusters); old, brightly glowing stars (planetary nebulae); and patches of glowing hydrogen gas (HII regions).
Publication
C. Foster, H. Lux, A.J. Romanowsky, D. Martínez-Delgado, S. Zibetti, J.A. Arnold, J.P. Brodie, R. Ciardullo, R.J. GaBany, M.R. Merrifield, N. Singh and J. Strader. “Kinematics and simulations of the stellar stream in the halo of the Umbrella Galaxy”. MNRAS 442, 3544 (2014). Download refereed preprint from http://arxiv.org/abs/1406.5511
The Umbrella Galaxy with data from the 0.5-metre BlackBird Remote Observatory Telescope and Suprime-Cam on the 8-metre Subaru Telescope.Credit: R. J. GaBany (Blackbird Observatory)
Australian Astronomical Observatory Newsletter - FEBRUARY 201510
SCIENCE HIGHLIGHTS
SAMI unveils a unified relation for all galaxiesLuca Cortese (Centre for Astrophysics and Supercomputing, Swinburne University) and the SAMI Galaxy Survey Team.
Galaxies in the Universe show an impressive variety of shapes and sizes: from massive, quiescent elliptical galaxies in the centre of clusters, to tiny star-bursting dwarf irregular systems in isolation. In order to develop a proper understanding of such heterogeneous population, astronomers have been looking for scaling relations able to link all galaxies despite their visual differences.
Particularly powerful are the correlations between dynamics and luminosity/stellar mass, such as the Tully-Fisher (Tully & Fisher 1977) and the Faber-Jackson (Faber & Jackson 1976) relations, as they link the visible mass of a galaxy to its rotational or dispersion velocity, respectively, providing unique insights into the interplay between baryonic and dark matter content.
Unfortunately, both relations hold only for accurately pre-selected classes of objects (i.e., inclined disks and bulge-dominated systems, respectively), and their scatters and slopes vary when wider ranges of morphologies are considered. This is mainly because, as the typical galaxy has both a bulge and a disk component, the use of just the rotational or the dispersion velocity does not provide a proper estimate of the total gravitational potential.
Thus, recent studies have investigated the possibility of bringing galaxies of all morphologies onto the same dynamical scaling relation, by combining the contribution of both ordered and disordered motions to the dynamical support, with promising results (Kassin et al. 2007, Zaritsky et al. 2008, Catinella et al. 2012). However, no work has yet been able to perform such analysis for both quiescent and star-forming galaxies at the same time, as this requires resolved kinematics maps of both stars and gas for large samples of galaxies: something unthinkable before the dawn of integral field spectroscopic surveys.
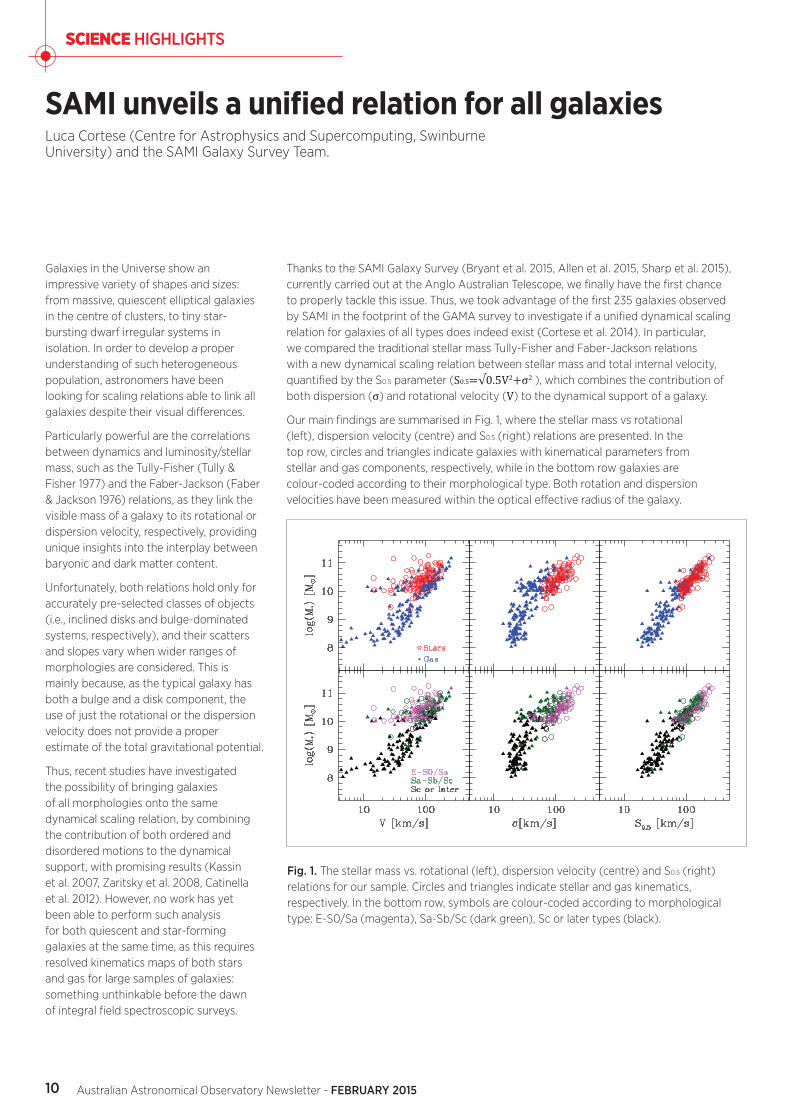
Thanks to the SAMI Galaxy Survey (Bryant et al. 2015, Allen et al. 2015, Sharp et al. 2015), currently carried out at the Anglo Australian Telescope, we finally have the first chance to properly tackle this issue. Thus, we took advantage of the first 235 galaxies observed by SAMI in the footprint of the GAMA survey to investigate if a unified dynamical scaling relation for galaxies of all types does indeed exist (Cortese et al. 2014). In particular, we compared the traditional stellar mass Tully-Fisher and Faber-Jackson relations with a new dynamical scaling relation between stellar mass and total internal velocity, quantified by the S0.5 parameter (S0.5=√0.5V2+σ2 ), which combines the contribution of both dispersion (σ) and rotational velocity (V) to the dynamical support of a galaxy.
Our main findings are summarised in Fig. 1, where the stellar mass vs rotational (left), dispersion velocity (centre) and S0.5 (right) relations are presented. In the top row, circles and triangles indicate galaxies with kinematical parameters from stellar and gas components, respectively, while in the bottom row galaxies are colour-coded according to their morphological type. Both rotation and dispersion velocities have been measured within the optical effective radius of the galaxy.
Fig. 1. The stellar mass vs. rotational (left), dispersion velocity (centre) and S0.5 (right) relations for our sample. Circles and triangles indicate stellar and gas kinematics, respectively. In the bottom row, symbols are colour-coded according to morphological type: E-S0/Sa (magenta), Sa-Sb/Sc (dark green), Sc or later types (black).
Australian Astronomical Observatory Newsletter - FEBRUARY 2015 11
SCIENCE HIGHLIGHTS
It appears that, while the Tully-Fisher and Faber-Jackson relations show a significant scatter (mainly driven by those galaxy types that are generally excluded a priori), the S0.5 relation holds for galaxies of all types. Intriguingly, the scatter in this relation (0.1 dex in velocity) is comparable to the scatter of the pruned Tully-Fisher and Faber-Jackson relations.
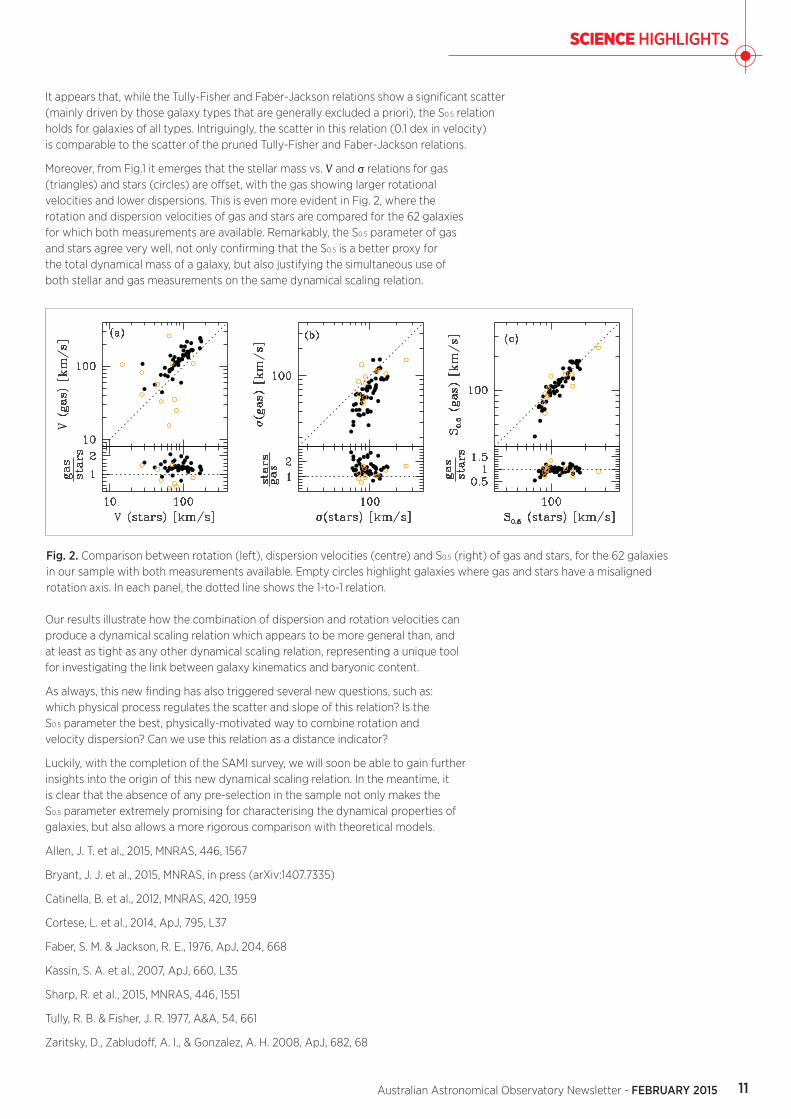
Moreover, from Fig.1 it emerges that the stellar mass vs. V and σ relations for gas (triangles) and stars (circles) are offset, with the gas showing larger rotational velocities and lower dispersions. This is even more evident in Fig. 2, where the rotation and dispersion velocities of gas and stars are compared for the 62 galaxies for which both measurements are available. Remarkably, the S0.5 parameter of gas and stars agree very well, not only confirming that the S0.5 is a better proxy for the total dynamical mass of a galaxy, but also justifying the simultaneous use of both stellar and gas measurements on the same dynamical scaling relation.
Our results illustrate how the combination of dispersion and rotation velocities can produce a dynamical scaling relation which appears to be more general than, and at least as tight as any other dynamical scaling relation, representing a unique tool for investigating the link between galaxy kinematics and baryonic content.
As always, this new finding has also triggered several new questions, such as: which physical process regulates the scatter and slope of this relation? Is the S0.5 parameter the best, physically-motivated way to combine rotation and velocity dispersion? Can we use this relation as a distance indicator?
Luckily, with the completion of the SAMI survey, we will soon be able to gain further insights into the origin of this new dynamical scaling relation. In the meantime, it is clear that the absence of any pre-selection in the sample not only makes the S0.5 parameter extremely promising for characterising the dynamical properties of galaxies, but also allows a more rigorous comparison with theoretical models.
Allen, J. T. et al., 2015, MNRAS, 446, 1567
Bryant, J. J. et al., 2015, MNRAS, in press (arXiv:1407.7335)
Catinella, B. et al., 2012, MNRAS, 420, 1959
Cortese, L. et al., 2014, ApJ, 795, L37
Faber, S. M. & Jackson, R. E., 1976, ApJ, 204, 668
Kassin, S. A. et al., 2007, ApJ, 660, L35
Sharp, R. et al., 2015, MNRAS, 446, 1551
Tully, R. B. & Fisher, J. R. 1977, A&A, 54, 661
Zaritsky, D., Zabludoff, A. I., & Gonzalez, A. H. 2008, ApJ, 682, 68
Fig. 2. Comparison between rotation (left), dispersion velocities (centre) and S0.5 (right) of gas and stars, for the 62 galaxies in our sample with both measurements available. Empty circles highlight galaxies where gas and stars have a misaligned rotation axis. In each panel, the dotted line shows the 1-to-1 relation.
Australian Astronomical Observatory Newsletter - FEBRUARY 201512
SCIENCE HIGHLIGHTS
Testing HERMES radial velocity precisionCarlos Bacigalupo (MQ), Gayandhi De Silva (AAO), Michael Ireland (ANU), Daniel Zucker (MQ)
The High Efficiency and Resolution Multi-Element Spectrograph (HERMES) was formally launched by the Minister for Industry in April 2014 (see AAO Observer, August 2014, 126, 20). The primary science driver for HERMES is the GALAH survey aiming to measure individual elemental abundances for ~1 million stars. However, HERMES is not limited to elemental abundance studies. In this article we explore the radial velocity (RV) precision possible with HERMES.
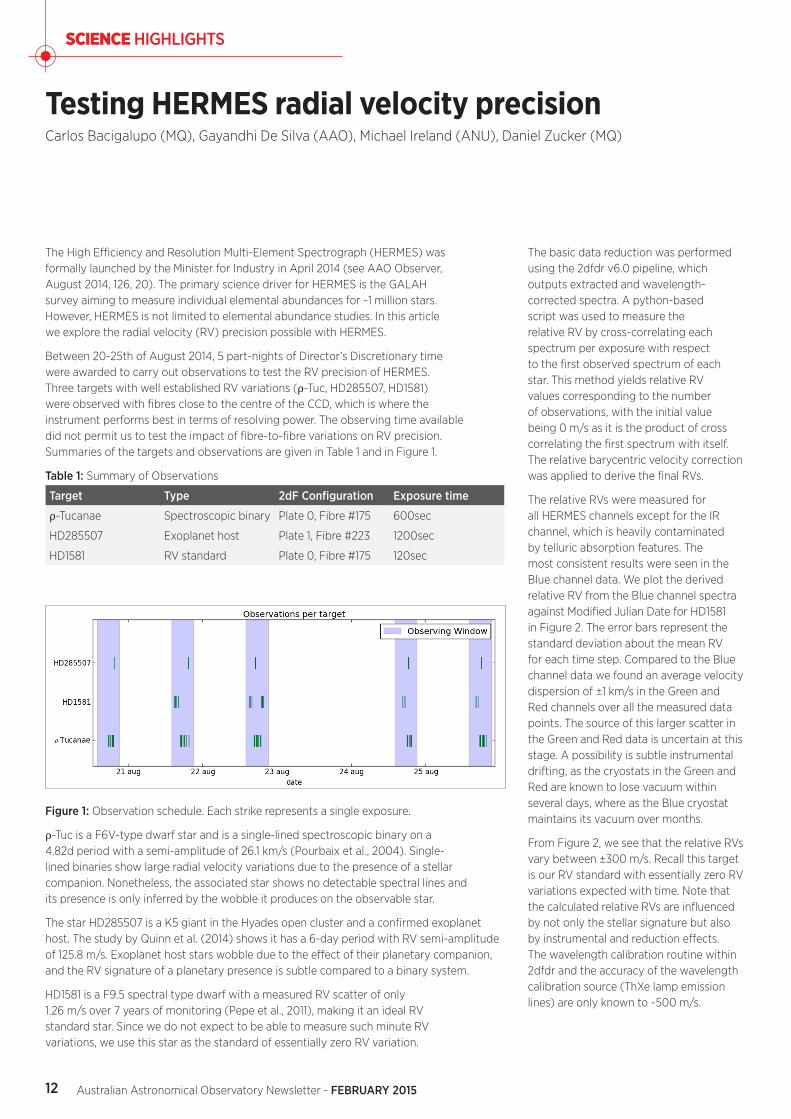
Between 20-25th of August 2014, 5 part-nights of Director’s Discretionary time were awarded to carry out observations to test the RV precision of HERMES. Three targets with well established RV variations (ρ-Tuc, HD285507, HD1581) were observed with fibres close to the centre of the CCD, which is where the instrument performs best in terms of resolving power. The observing time available did not permit us to test the impact of fibre-to-fibre variations on RV precision. Summaries of the targets and observations are given in Table 1 and in Figure 1.
Table 1: Summary of Observations
Target Type 2dF Configuration Exposure time
ρ-Tucanae Spectroscopic binary Plate 0, Fibre #175 600sec
HD285507 Exoplanet host Plate 1, Fibre #223 1200sec
HD1581 RV standard Plate 0, Fibre #175 120sec
Figure 1: Observation schedule. Each strike represents a single exposure.
ρ-Tuc is a F6V-type dwarf star and is a single-lined spectroscopic binary on a 4.82d period with a semi-amplitude of 26.1 km/s (Pourbaix et al., 2004). Single-lined binaries show large radial velocity variations due to the presence of a stellar companion. Nonetheless, the associated star shows no detectable spectral lines and its presence is only inferred by the wobble it produces on the observable star.
The star HD285507 is a K5 giant in the Hyades open cluster and a confirmed exoplanet host. The study by Quinn et al. (2014) shows it has a 6-day period with RV semi-amplitude of 125.8 m/s. Exoplanet host stars wobble due to the effect of their planetary companion, and the RV signature of a planetary presence is subtle compared to a binary system.
HD1581 is a F9.5 spectral type dwarf with a measured RV scatter of only 1.26 m/s over 7 years of monitoring (Pepe et al., 2011), making it an ideal RV standard star. Since we do not expect to be able to measure such minute RV variations, we use this star as the standard of essentially zero RV variation.
The basic data reduction was performed using the 2dfdr v6.0 pipeline, which outputs extracted and wavelength-corrected spectra. A python-based script was used to measure the relative RV by cross-correlating each spectrum per exposure with respect to the first observed spectrum of each star. This method yields relative RV values corresponding to the number of observations, with the initial value being 0 m/s as it is the product of cross correlating the first spectrum with itself. The relative barycentric velocity correction was applied to derive the final RVs.
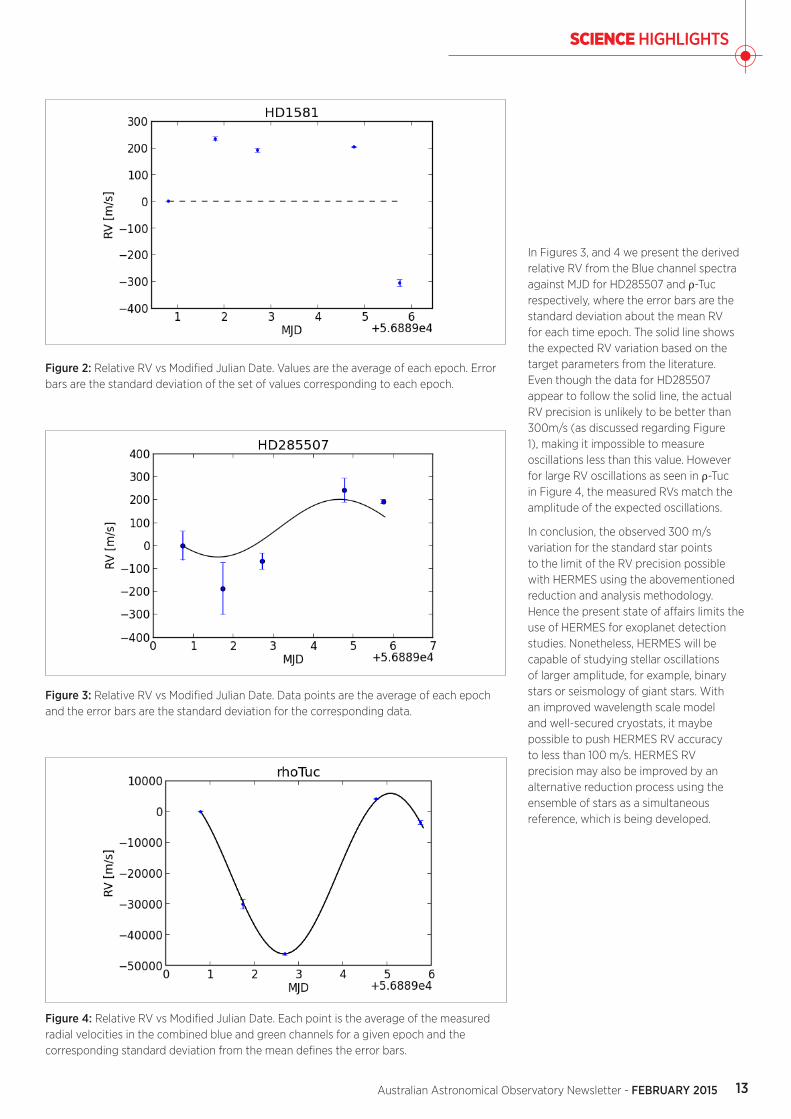
The relative RVs were measured for all HERMES channels except for the IR channel, which is heavily contaminated by telluric absorption features. The most consistent results were seen in the Blue channel data. We plot the derived relative RV from the Blue channel spectra against Modified Julian Date for HD1581 in Figure 2. The error bars represent the standard deviation about the mean RV for each time step. Compared to the Blue channel data we found an average velocity dispersion of ±1 km/s in the Green and Red channels over all the measured data points. The source of this larger scatter in the Green and Red data is uncertain at this stage. A possibility is subtle instrumental drifting, as the cryostats in the Green and Red are known to lose vacuum within several days, where as the Blue cryostat maintains its vacuum over months.
From Figure 2, we see that the relative RVs vary between ±300 m/s. Recall this target is our RV standard with essentially zero RV variations expected with time. Note that the calculated relative RVs are influenced by not only the stellar signature but also by instrumental and reduction effects. The wavelength calibration routine within 2dfdr and the accuracy of the wavelength calibration source (ThXe lamp emission lines) are only known to ~500 m/s.
Australian Astronomical Observatory Newsletter - FEBRUARY 2015 13
SCIENCE HIGHLIGHTS
In Figures 3, and 4 we present the derived relative RV from the Blue channel spectra against MJD for HD285507 and ρ-Tuc respectively, where the error bars are the standard deviation about the mean RV for each time epoch. The solid line shows the expected RV variation based on the target parameters from the literature. Even though the data for HD285507 appear to follow the solid line, the actual RV precision is unlikely to be better than 300m/s (as discussed regarding Figure 1), making it impossible to measure oscillations less than this value. However for large RV oscillations as seen in ρ-Tuc in Figure 4, the measured RVs match the amplitude of the expected oscillations.
In conclusion, the observed 300 m/s variation for the standard star points to the limit of the RV precision possible with HERMES using the abovementioned reduction and analysis methodology. Hence the present state of affairs limits the use of HERMES for exoplanet detection studies. Nonetheless, HERMES will be capable of studying stellar oscillations of larger amplitude, for example, binary stars or seismology of giant stars. With an improved wavelength scale model and well-secured cryostats, it maybe possible to push HERMES RV accuracy to less than 100 m/s. HERMES RV precision may also be improved by an alternative reduction process using the ensemble of stars as a simultaneous reference, which is being developed.
Figure 2: Relative RV vs Modified Julian Date. Values are the average of each epoch. Error bars are the standard deviation of the set of values corresponding to each epoch.
Figure 3: Relative RV vs Modified Julian Date. Data points are the average of each epoch and the error bars are the standard deviation for the corresponding data.
Figure 4: Relative RV vs Modified Julian Date. Each point is the average of the measured radial velocities in the combined blue and green channels for a given epoch and the corresponding standard deviation from the mean defines the error bars.
Australian Astronomical Observatory Newsletter - FEBRUARY 201514
SCIENCE HIGHLIGHTS
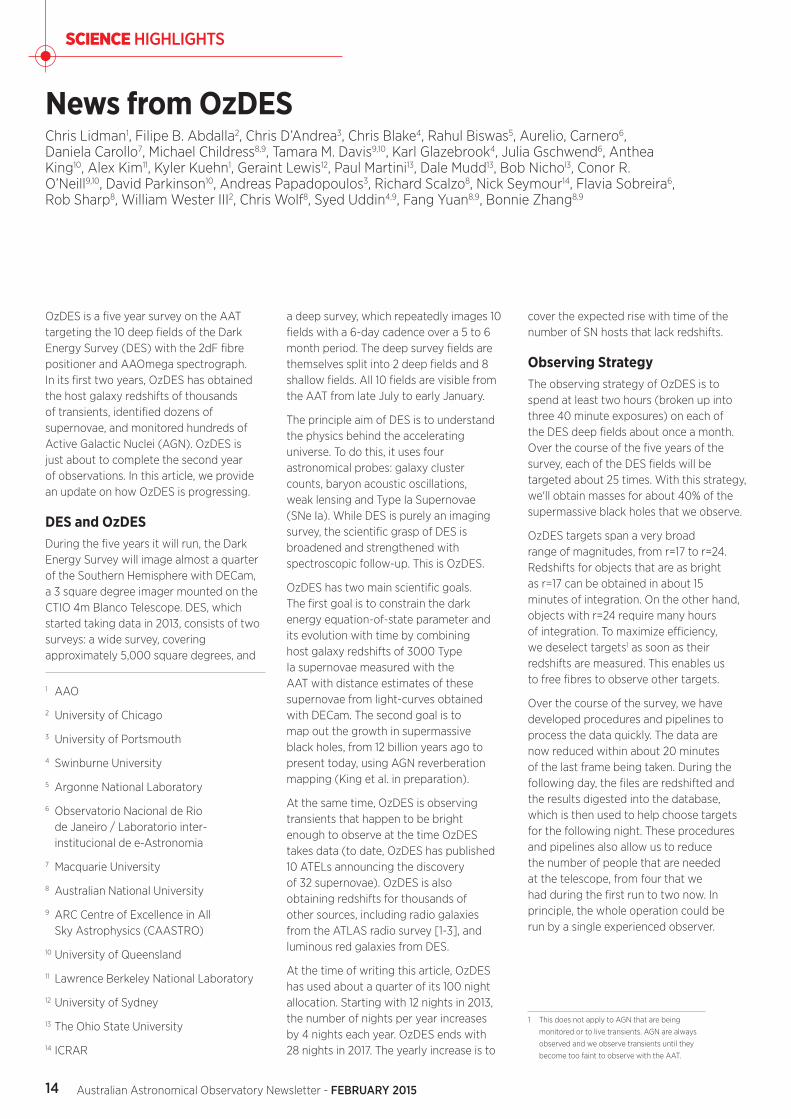
News from OzDESChris Lidman1, Filipe B. Abdalla2, Chris D’Andrea3, Chris Blake4, Rahul Biswas5, Aurelio, Carnero6, Daniela Carollo7, Michael Childress8,9, Tamara M. Davis9,10, Karl Glazebrook4, Julia Gschwend6, Anthea King10, Alex Kim11, Kyler Kuehn1, Geraint Lewis12, Paul Martini13, Dale Mudd13, Bob Nichol3, Conor R. O’Neill9,10, David Parkinson10, Andreas Papadopoulos3, Richard Scalzo8, Nick Seymour14, Flavia Sobreira6, Rob Sharp8, William Wester III2, Chris Wolf8, Syed Uddin4,9, Fang Yuan8,9, Bonnie Zhang8,9
OzDES is a five year survey on the AAT targeting the 10 deep fields of the Dark Energy Survey (DES) with the 2dF fibre positioner and AAOmega spectrograph. In its first two years, OzDES has obtained the host galaxy redshifts of thousands of transients, identified dozens of supernovae, and monitored hundreds of Active Galactic Nuclei (AGN). OzDES is just about to complete the second year of observations. In this article, we provide an update on how OzDES is progressing.
DES and OzDESDuring the five years it will run, the Dark Energy Survey will image almost a quarter of the Southern Hemisphere with DECam, a 3 square degree imager mounted on the CTIO 4m Blanco Telescope. DES, which started taking data in 2013, consists of two surveys: a wide survey, covering approximately 5,000 square degrees, and
a deep survey, which repeatedly images 10 fields with a 6-day cadence over a 5 to 6 month period. The deep survey fields are themselves split into 2 deep fields and 8 shallow fields. All 10 fields are visible from the AAT from late July to early January.
The principle aim of DES is to understand the physics behind the accelerating universe. To do this, it uses four astronomical probes: galaxy cluster counts, baryon acoustic oscillations, weak lensing and Type Ia Supernovae (SNe Ia). While DES is purely an imaging survey, the scientific grasp of DES is broadened and strengthened with spectroscopic follow-up. This is OzDES.
OzDES has two main scientific goals. The first goal is to constrain the dark energy equation-of-state parameter and its evolution with time by combining host galaxy redshifts of 3000 Type Ia supernovae measured with the AAT with distance estimates of these supernovae from light-curves obtained with DECam. The second goal is to map out the growth in supermassive black holes, from 12 billion years ago to present today, using AGN reverberation mapping (King et al. in preparation).
At the same time, OzDES is observing transients that happen to be bright enough to observe at the time OzDES takes data (to date, OzDES has published 10 ATELs announcing the discovery of 32 supernovae). OzDES is also obtaining redshifts for thousands of other sources, including radio galaxies from the ATLAS radio survey [1-3], and luminous red galaxies from DES.
At the time of writing this article, OzDES has used about a quarter of its 100 night allocation. Starting with 12 nights in 2013, the number of nights per year increases by 4 nights each year. OzDES ends with 28 nights in 2017. The yearly increase is to
cover the expected rise with time of the number of SN hosts that lack redshifts.
Observing StrategyThe observing strategy of OzDES is to spend at least two hours (broken up into three 40 minute exposures) on each of the DES deep fields about once a month. Over the course of the five years of the survey, each of the DES fields will be targeted about 25 times. With this strategy, we'll obtain masses for about 40% of the supermassive black holes that we observe.
OzDES targets span a very broad range of magnitudes, from r=17 to r=24. Redshifts for objects that are as bright as r=17 can be obtained in about 15 minutes of integration. On the other hand, objects with r=24 require many hours of integration. To maximize efficiency, we deselect targets1 as soon as their redshifts are measured. This enables us to free fibres to observe other targets.
Over the course of the survey, we have developed procedures and pipelines to process the data quickly. The data are now reduced within about 20 minutes of the last frame being taken. During the following day, the files are redshifted and the results digested into the database, which is then used to help choose targets for the following night. These procedures and pipelines also allow us to reduce the number of people that are needed at the telescope, from four that we had during the first run to two now. In principle, the whole operation could be run by a single experienced observer.
1 This does not apply to AGN that are being
monitored or to live transients. AGN are always
observed and we observe transients until they
become too faint to observe with the AAT.
1 AAO
2 University of Chicago
3 University of Portsmouth
4 Swinburne University
5 Argonne National Laboratory
6 Observatorio Nacional de Rio de Janeiro / Laboratorio inter-institucional de e-Astronomia
7 Macquarie University
8 Australian National University
9 ARC Centre of Excellence in All Sky Astrophysics (CAASTRO)
10 University of Queensland
11 Lawrence Berkeley National Laboratory
12 University of Sydney
13 The Ohio State University
14 ICRAR
Australian Astronomical Observatory Newsletter - FEBRUARY 2015 15
SCIENCE HIGHLIGHTS
We've also implemented a number of changes that are designed to improve the quality of the data that comes from the survey. Since the end of the first season (Y1), we started to observe around 10 F-stars per field. With an r-band magnitude between 17 and 18, these stars are bright enough to result in spectra with high signal-to-noise ratios, yet are not too bright to contaminate the spectra of neighbouring objects, which may be up to 1,000 times fainter.
We use F stars to measure the throughput. Since the g and i-bands nicely fit into the area covered by the blue and red arms of AAOmega, respectively, we get a measure of the throughput for both the red and blue arms separately. The throughput measurements, which are automatically determined by the pipeline, give us a quantitative indication of when we should switch to our backup program. The configuration time of AAOmega is now less than 40 minutes, so these decisions can be made almost in real time. The backup program consists of obtaining spectra of the brightest galaxies in each of the DES fields. AGN and transients are still targeted in the backup program.
Co-adding data from multiple runsMost of the galaxies in OzDES are considerably fainter than galaxies that are normally observed with AAOmega at the AAT. For example, the median magnitude of the SN hosts is r=22.5. For objects this faint, the signal-to-noise ratio in a two hour exposure2 is usually too low for one to measure a redshift. Instead, these objects need to be observed over several observing runs before a redshift can be obtained.
The signal-to-noise ratio is very sensitive to the observing conditions, such as seeing and transparency. It is not unusual for the end-to-end throughput of the system to vary by a factor of five or more. Coadding data, without taking this variability into account, may degrade the data, i.e. one may end up with fewer redshifts not more. Currently, we simply do not include data that were taken in poor conditions. We then equally weight the rest. In future
2 Two hours is about the maximum length-of-time one
can observe without needing to reconfigure. Exposures
that last longer than this become increasingly less
efficient, because atmospheric refraction causes objects
to become displaced with respect to the fibres.
runs, we'll apply a more optimal weighting scheme that will be based on the throughputs that are derived from F stars that are observed contemporaneously.
Many targets have already accumulated more that a day of integration. The current record holder in OzDES is an AGN, which has 115,000 seconds. This is probably the longest exposure on a single object with AAOmega. With such deep observations, it is interesting to explore how the noise changes with exposure time. Ideally, the noise should decrease with the square root of time, if one is averaging the individual exposures. This is what we and others find [4]. At the same time, the signal-to-noise ratio should increase with square root of time. For small spectral windows, this appears to hold, even in the regions where there are bright night sky lines. However, over broader regions, one sees features in the data, such as large scale modulations in the continuum and spectral discontinuities, that are artifacts from the data processing.
Over the past 12 months, considerable work has gone into upgrading 2dfdr, the software that processes data from AAOmega, and this had led to significant improvement in the quality of the reduced data. This work is ongoing and we expect that there will be further substantial improvements over the next twelve months.
It is also essential to understand how the the redshift success evolves with exposure time. We use this information to predict how many sources we will observe by survey end, as shown in Figs. 1 and 2, and to ensure that we reach our goals.
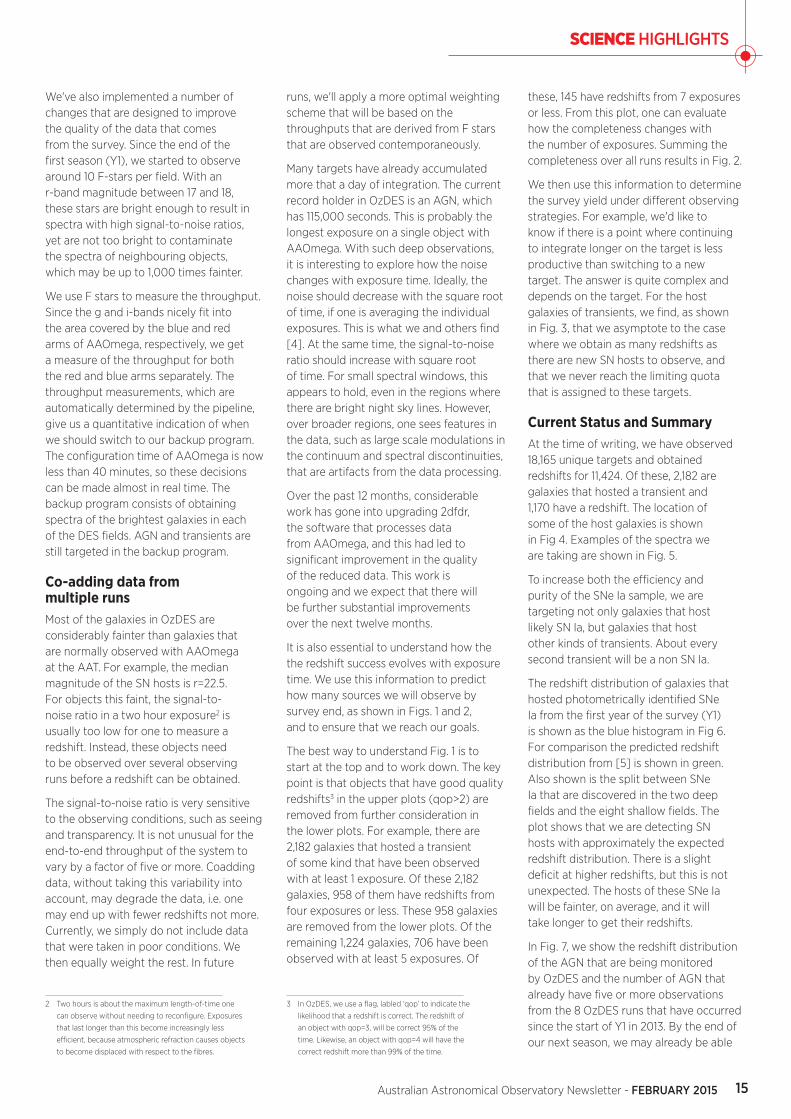
The best way to understand Fig. 1 is to start at the top and to work down. The key point is that objects that have good quality redshifts3 in the upper plots (qop>2) are removed from further consideration in the lower plots. For example, there are 2,182 galaxies that hosted a transient of some kind that have been observed with at least 1 exposure. Of these 2,182 galaxies, 958 of them have redshifts from four exposures or less. These 958 galaxies are removed from the lower plots. Of the remaining 1,224 galaxies, 706 have been observed with at least 5 exposures. Of
3 In OzDES, we use a flag, labled ‘qop’ to indicate the
likelihood that a redshift is correct. The redshift of
an object with qop=3, will be correct 95% of the
time. Likewise, an object with qop=4 will have the
correct redshift more than 99% of the time.
these, 145 have redshifts from 7 exposures or less. From this plot, one can evaluate how the completeness changes with the number of exposures. Summing the completeness over all runs results in Fig. 2.
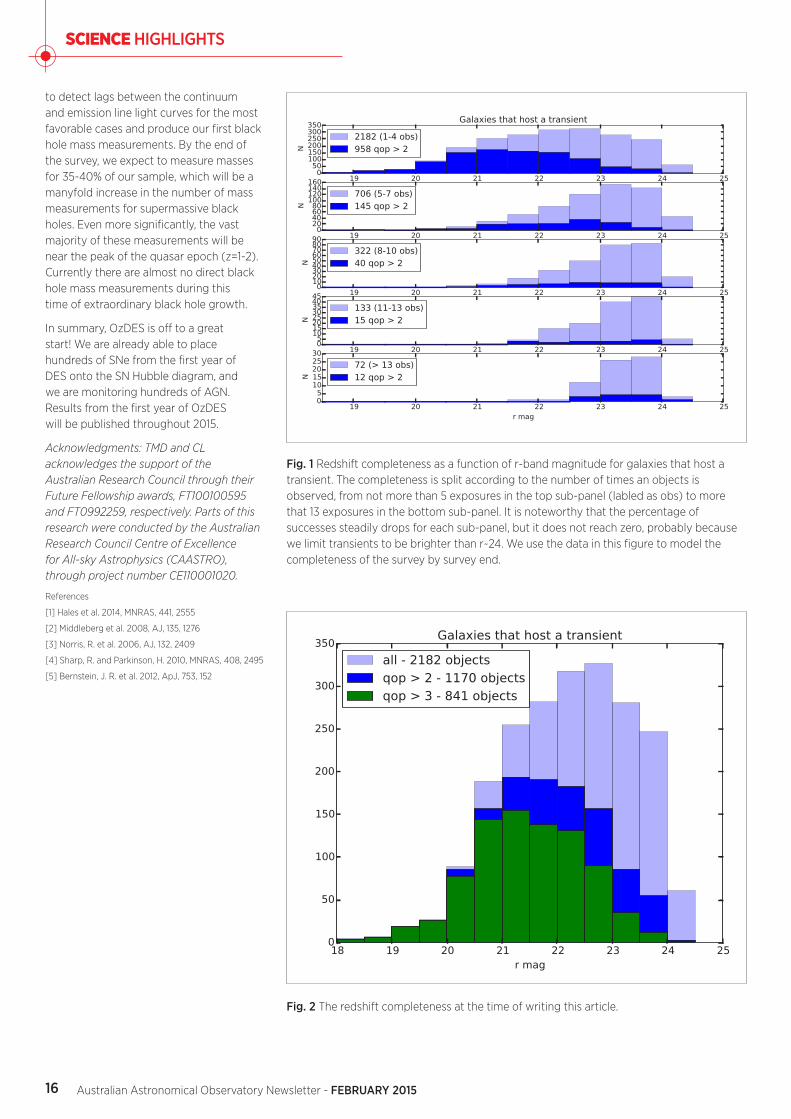
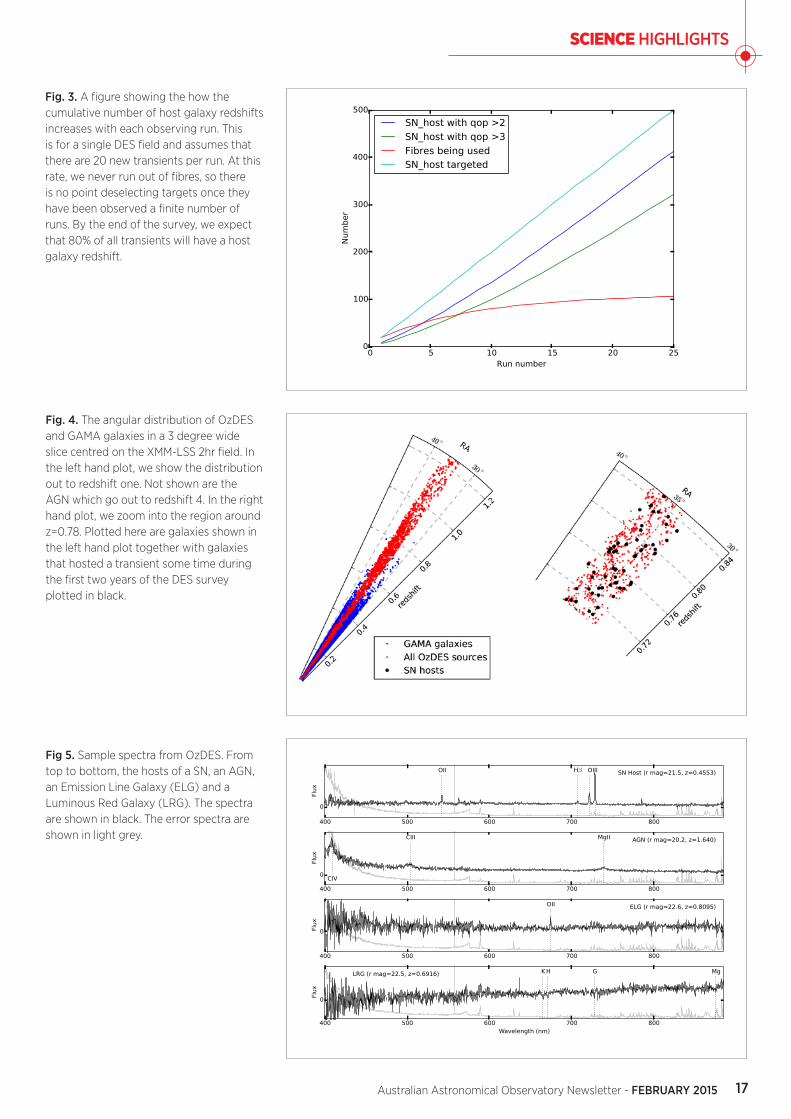
We then use this information to determine the survey yield under different observing strategies. For example, we'd like to know if there is a point where continuing to integrate longer on the target is less productive than switching to a new target. The answer is quite complex and depends on the target. For the host galaxies of transients, we find, as shown in Fig. 3, that we asymptote to the case where we obtain as many redshifts as there are new SN hosts to observe, and that we never reach the limiting quota that is assigned to these targets.
Current Status and SummaryAt the time of writing, we have observed 18,165 unique targets and obtained redshifts for 11,424. Of these, 2,182 are galaxies that hosted a transient and 1,170 have a redshift. The location of some of the host galaxies is shown in Fig 4. Examples of the spectra we are taking are shown in Fig. 5.
To increase both the efficiency and purity of the SNe Ia sample, we are targeting not only galaxies that host likely SN Ia, but galaxies that host other kinds of transients. About every second transient will be a non SN Ia.
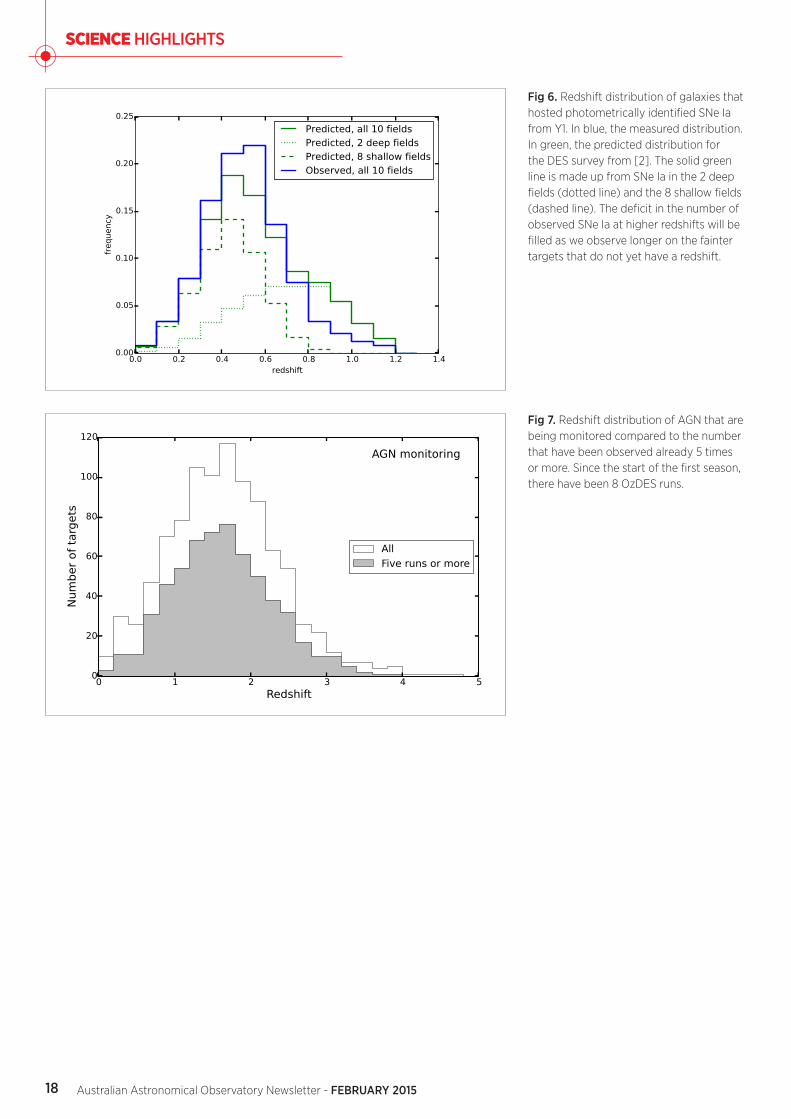
The redshift distribution of galaxies that hosted photometrically identified SNe Ia from the first year of the survey (Y1) is shown as the blue histogram in Fig 6. For comparison the predicted redshift distribution from [5] is shown in green. Also shown is the split between SNe Ia that are discovered in the two deep fields and the eight shallow fields. The plot shows that we are detecting SN hosts with approximately the expected redshift distribution. There is a slight deficit at higher redshifts, but this is not unexpected. The hosts of these SNe Ia will be fainter, on average, and it will take longer to get their redshifts.
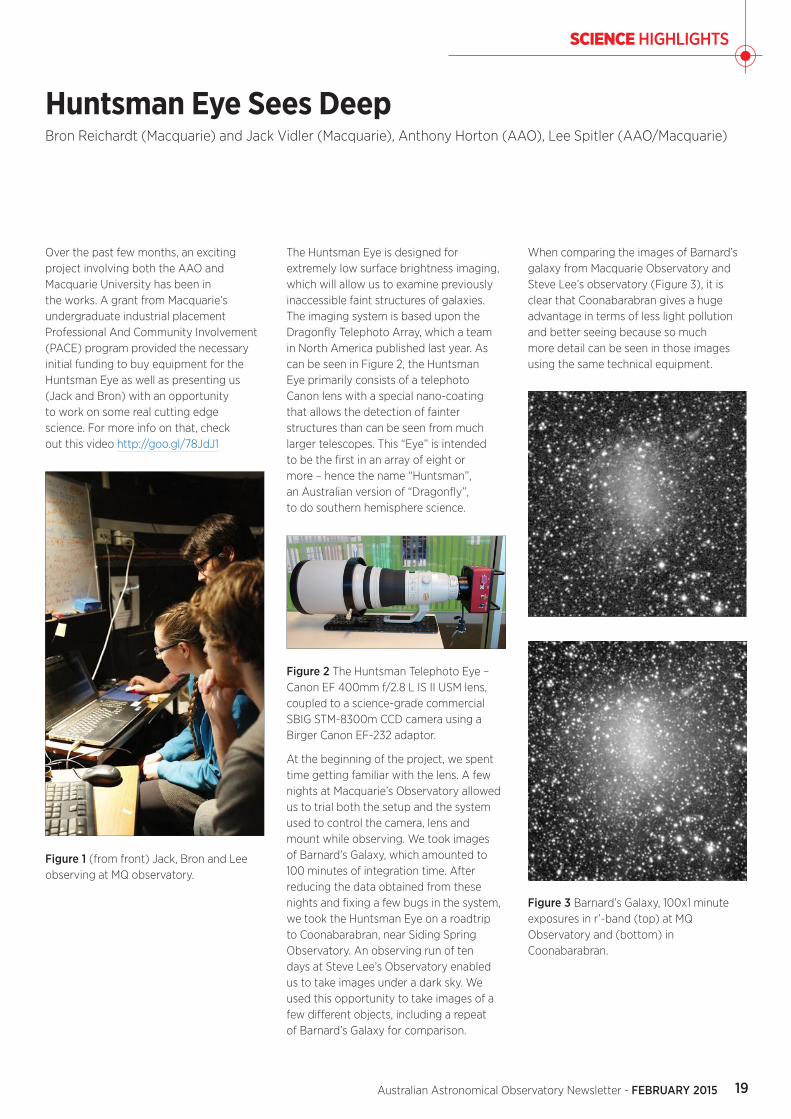
In Fig. 7, we show the redshift distribution of the AGN that are being monitored by OzDES and the number of AGN that already have five or more observations from the 8 OzDES runs that have occurred since the start of Y1 in 2013. By the end of our next season, we may already be able
Australian Astronomical Observatory Newsletter - FEBRUARY 201516
SCIENCE HIGHLIGHTS
to detect lags between the continuum and emission line light curves for the most favorable cases and produce our first black hole mass measurements. By the end of the survey, we expect to measure masses for 35-40% of our sample, which will be a manyfold increase in the number of mass measurements for supermassive black holes. Even more significantly, the vast majority of these measurements will be near the peak of the quasar epoch (z=1-2). Currently there are almost no direct black hole mass measurements during this time of extraordinary black hole growth.
In summary, OzDES is off to a great start! We are already able to place hundreds of SNe from the first year of DES onto the SN Hubble diagram, and we are monitoring hundreds of AGN. Results from the first year of OzDES will be published throughout 2015.
Acknowledgments: TMD and CL acknowledges the support of the Australian Research Council through their Future Fellowship awards, FT100100595 and FT0992259, respectively. Parts of this research were conducted by the Australian Research Council Centre of Excellence for All-sky Astrophysics (CAASTRO), through project number CE110001020.
References
[1] Hales et al. 2014, MNRAS, 441, 2555
[2] Middleberg et al. 2008, AJ, 135, 1276
[3] Norris, R. et al. 2006, AJ, 132, 2409
[4] Sharp, R. and Parkinson, H. 2010, MNRAS, 408, 2495
[5] Bernstein, J. R. et al. 2012, ApJ, 753, 152
Fig. 1 Redshift completeness as a function of r-band magnitude for galaxies that host a transient. The completeness is split according to the number of times an objects is observed, from not more than 5 exposures in the top sub-panel (labled as obs) to more that 13 exposures in the bottom sub-panel. It is noteworthy that the percentage of successes steadily drops for each sub-panel, but it does not reach zero, probably because we limit transients to be brighter than r~24. We use the data in this figure to model the completeness of the survey by survey end.
Fig. 2 The redshift completeness at the time of writing this article.
Australian Astronomical Observatory Newsletter - FEBRUARY 2015 17
SCIENCE HIGHLIGHTS
Fig. 3. A figure showing the how the cumulative number of host galaxy redshifts increases with each observing run. This is for a single DES field and assumes that there are 20 new transients per run. At this rate, we never run out of fibres, so there is no point deselecting targets once they have been observed a finite number of runs. By the end of the survey, we expect that 80% of all transients will have a host galaxy redshift.
Fig. 4. The angular distribution of OzDES and GAMA galaxies in a 3 degree wide slice centred on the XMM-LSS 2hr field. In the left hand plot, we show the distribution out to redshift one. Not shown are the AGN which go out to redshift 4. In the right hand plot, we zoom into the region around z=0.78. Plotted here are galaxies shown in the left hand plot together with galaxies that hosted a transient some time during the first two years of the DES survey plotted in black.
Fig 5. Sample spectra from OzDES. From top to bottom, the hosts of a SN, an AGN, an Emission Line Galaxy (ELG) and a Luminous Red Galaxy (LRG). The spectra are shown in black. The error spectra are shown in light grey.
Australian Astronomical Observatory Newsletter - FEBRUARY 201518
SCIENCE HIGHLIGHTS
Fig 6. Redshift distribution of galaxies that hosted photometrically identified SNe Ia from Y1. In blue, the measured distribution. In green, the predicted distribution for the DES survey from [2]. The solid green line is made up from SNe Ia in the 2 deep fields (dotted line) and the 8 shallow fields (dashed line). The deficit in the number of observed SNe Ia at higher redshifts will be filled as we observe longer on the fainter targets that do not yet have a redshift.
Fig 7. Redshift distribution of AGN that are being monitored compared to the number that have been observed already 5 times or more. Since the start of the first season, there have been 8 OzDES runs.
Australian Astronomical Observatory Newsletter - FEBRUARY 2015 19
SCIENCE HIGHLIGHTS
Huntsman Eye Sees DeepBron Reichardt (Macquarie) and Jack Vidler (Macquarie), Anthony Horton (AAO), Lee Spitler (AAO/Macquarie)
Over the past few months, an exciting project involving both the AAO and Macquarie University has been in the works. A grant from Macquarie’s undergraduate industrial placement Professional And Community Involvement (PACE) program provided the necessary initial funding to buy equipment for the Huntsman Eye as well as presenting us (Jack and Bron) with an opportunity to work on some real cutting edge science. For more info on that, check out this video http://goo.gl/78JdJ1
Figure 1 (from front) Jack, Bron and Lee observing at MQ observatory.
The Huntsman Eye is designed for extremely low surface brightness imaging, which will allow us to examine previously inaccessible faint structures of galaxies. The imaging system is based upon the Dragonfly Telephoto Array, which a team in North America published last year. As can be seen in Figure 2, the Huntsman Eye primarily consists of a telephoto Canon lens with a special nano-coating that allows the detection of fainter structures than can be seen from much larger telescopes. This “Eye” is intended to be the first in an array of eight or more – hence the name “Huntsman”, an Australian version of “Dragonfly”, to do southern hemisphere science.
Figure 2 The Huntsman Telephoto Eye – Canon EF 400mm f/2.8 L IS II USM lens, coupled to a science-grade commercial SBIG STM-8300m CCD camera using a Birger Canon EF-232 adaptor.
At the beginning of the project, we spent time getting familiar with the lens. A few nights at Macquarie’s Observatory allowed us to trial both the setup and the system used to control the camera, lens and mount while observing. We took images of Barnard’s Galaxy, which amounted to 100 minutes of integration time. After reducing the data obtained from these nights and fixing a few bugs in the system, we took the Huntsman Eye on a roadtrip to Coonabarabran, near Siding Spring Observatory. An observing run of ten days at Steve Lee’s Observatory enabled us to take images under a dark sky. We used this opportunity to take images of a few different objects, including a repeat of Barnard’s Galaxy for comparison.
When comparing the images of Barnard’s galaxy from Macquarie Observatory and Steve Lee’s observatory (Figure 3), it is clear that Coonabarabran gives a huge advantage in terms of less light pollution and better seeing because so much more detail can be seen in those images using the same technical equipment.
Figure 3 Barnard’s Galaxy, 100x1 minute exposures in r’-band (top) at MQ Observatory and (bottom) in Coonabarabran.
Australian Astronomical Observatory Newsletter - FEBRUARY 201520
SCIENCE HIGHLIGHTS
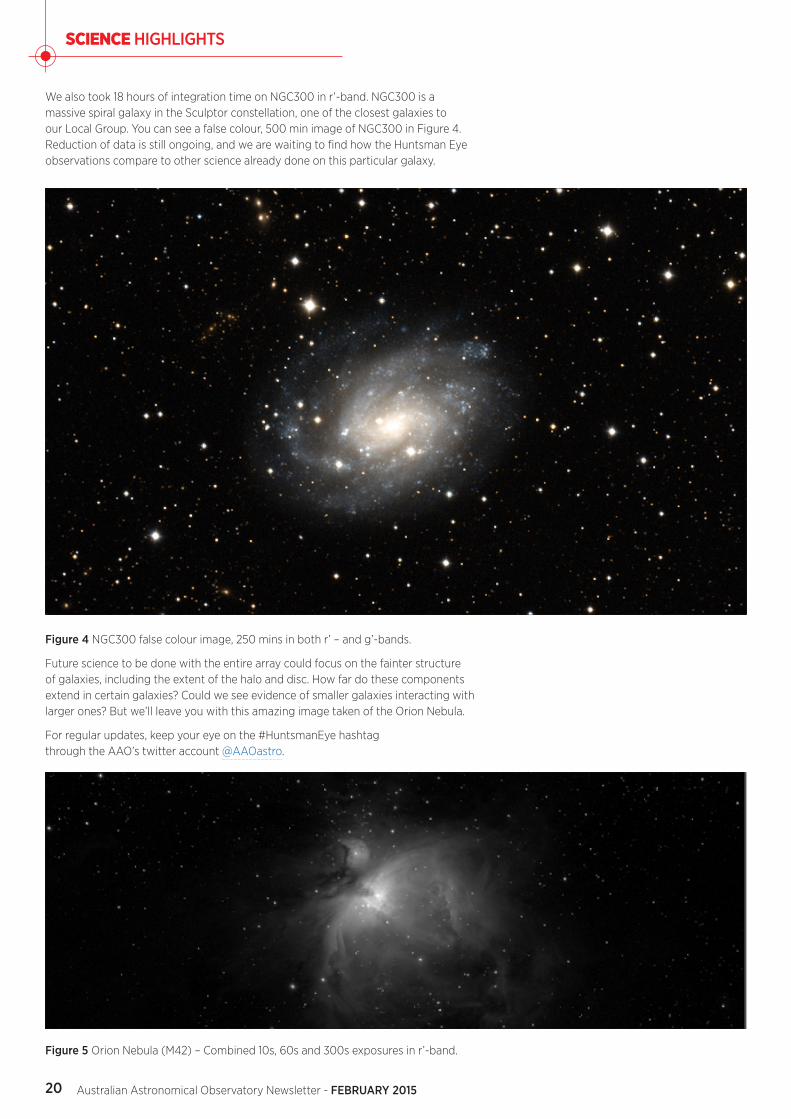
We also took 18 hours of integration time on NGC300 in r’-band. NGC300 is a massive spiral galaxy in the Sculptor constellation, one of the closest galaxies to our Local Group. You can see a false colour, 500 min image of NGC300 in Figure 4. Reduction of data is still ongoing, and we are waiting to find how the Huntsman Eye observations compare to other science already done on this particular galaxy.
Figure 4 NGC300 false colour image, 250 mins in both r’ – and g’-bands.
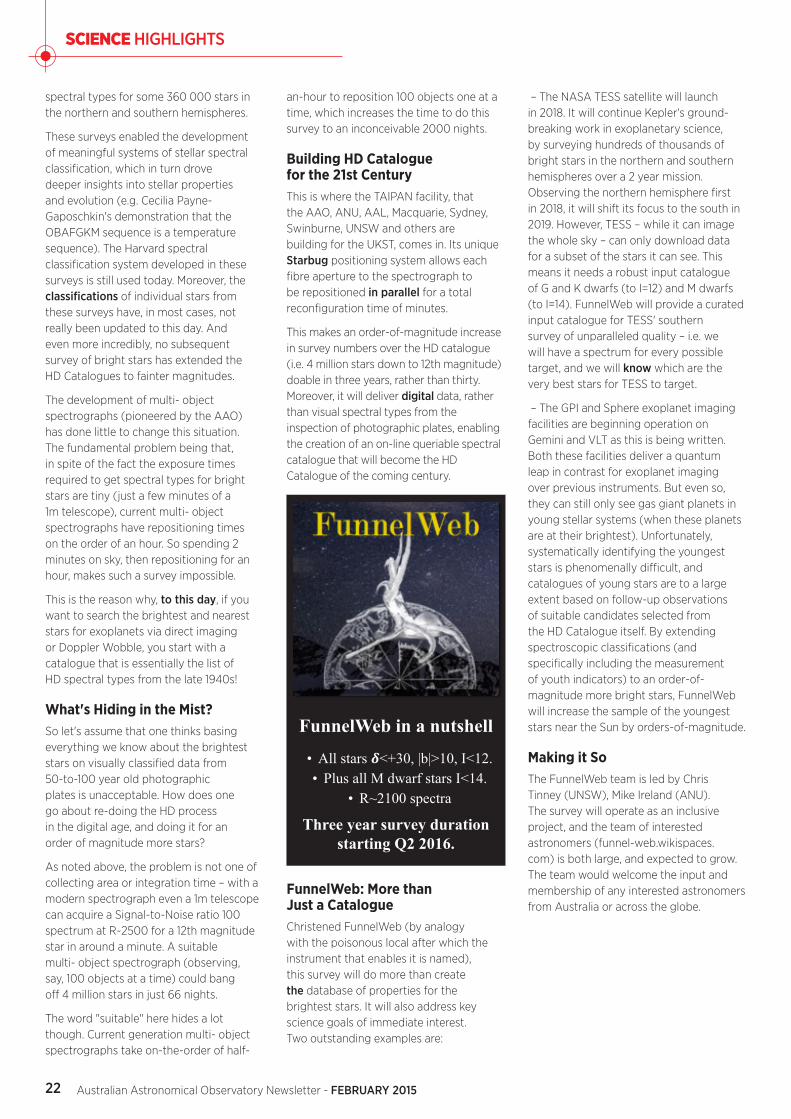
Future science to be done with the entire array could focus on the fainter structure of galaxies, including the extent of the halo and disc. How far do these components extend in certain galaxies? Could we see evidence of smaller galaxies interacting with larger ones? But we’ll leave you with this amazing image taken of the Orion Nebula.
For regular updates, keep your eye on the #HuntsmanEye hashtag through the AAO’s twitter account @AAOastro.
Figure 5 Orion Nebula (M42) – Combined 10s, 60s and 300s exposures in r’-band.

Australian Astronomical Observatory Newsletter - FEBRUARY 2015 21
SCIENCE HIGHLIGHTS
The FunnelWeb Survey: Building the HD Catalog of the 21st CenturyChris Tinney (UNSW) & Michael Ireland (ANU)
To all intents and purposes, the development of all-sky spectroscopic catalogues for bright stars stopped in the middle of the 20th century with the completion of the Henry Draper (HD) catalogue by Jump-Cannon and colleagues at the Harvard College Observatory. With 359083 stars observed and spectrally catalogued one at a time, the available technology had reached its limits. To this day, if you want to search the brightest, and nearest stars for exoplanets via direct imaging or Doppler Wobble, you start with a catalogue that is essentially the list of HD spectral types from the late 1940s.
Figure 1: Astronomers Annie Jump Cannon and Henrietta Swan Leavitt in 1913.
The TAIPAN facility on the UKST is set to change all that. Its unique ability to reposition in just minutes, makes it the first spectrograph capable of taking the next step in the spectral mapping of the brightest stars. In just under 3 years, it can observe around four million bright stars and extend the HD catalogue from its current 8-9th magnitude limits to 12-14th magnitude.
In the process it can enable breakthrough science on multiple fronts by providing a superbly robust input catalogue to the NASA TESS transiting exoplanet
satellite, extending the list of young (<100 Myr old) stars near the Sun by factors of more than ten, and proving a critical linkage with both GALAH and Gaia in the study of thick-disk giants.
The Mists of TimeThe history of mankind's endeavours to map the sky extend back to the mists of pre-history. Whether dividing the sky into constellations or mapping creation myths on to them came came first is a matter for the cultural anthropologists to argue over. In either case, for a pre-writing society the stories associated with the constellations provide a reliable way to pass information on the stars of the sky from generation to generation.
Almost every ancient society with writing developed mechanisms for recording the positions, brightnesses and colours of the brightest stars – the example best known to the cultures of the West being the catalogue in Ptolemy's Almagest (based on an earlier catalogue by Hipparchus), which described 1022 of the brightest stars in magnitudes ranging from 1 to 6.
Fast-forwarding to the Enlightenment, Lalande's catalogue (constructed from the Paris Observatory) listed the positions and magnitudes of some 47,390 stars to 9th magnitude. The development of astronomical photography took the process of mapping the sky one step further, enabling even larger catalogues of positions and magnitudes to be constructed by the early 20th century.
Real breakthroughs in the understanding of how stars worked, however, came with the development of massive spectroscopic surveys such as those carried out by Harvard College Observatory between 1872 and 1949. Initiated by Henry Draper himself, and subsequently led by Henry Pickering and then Annie Jump-Cannon, the HD Catalogue (and subsequent extensions) eventually led to the publication of
Australian Astronomical Observatory Newsletter - FEBRUARY 201522
SCIENCE HIGHLIGHTS
spectral types for some 360 000 stars in the northern and southern hemispheres.
These surveys enabled the development of meaningful systems of stellar spectral classification, which in turn drove deeper insights into stellar properties and evolution (e.g. Cecilia Payne-Gaposchkin's demonstration that the OBAFGKM sequence is a temperature sequence). The Harvard spectral classification system developed in these surveys is still used today. Moreover, the classifications of individual stars from these surveys have, in most cases, not really been updated to this day. And even more incredibly, no subsequent survey of bright stars has extended the HD Catalogues to fainter magnitudes.
The development of multi- object spectrographs (pioneered by the AAO) has done little to change this situation. The fundamental problem being that, in spite of the fact the exposure times required to get spectral types for bright stars are tiny (just a few minutes of a 1m telescope), current multi- object spectrographs have repositioning times on the order of an hour. So spending 2 minutes on sky, then repositioning for an hour, makes such a survey impossible.
This is the reason why, to this day, if you want to search the brightest and nearest stars for exoplanets via direct imaging or Doppler Wobble, you start with a catalogue that is essentially the list of HD spectral types from the late 1940s!
What's Hiding in the Mist?So let's assume that one thinks basing everything we know about the brightest stars on visually classified data from 50-to-100 year old photographic plates is unacceptable. How does one go about re-doing the HD process in the digital age, and doing it for an order of magnitude more stars?
As noted above, the problem is not one of collecting area or integration time – with a modern spectrograph even a 1m telescope can acquire a Signal-to-Noise ratio 100 spectrum at R~2500 for a 12th magnitude star in around a minute. A suitable multi- object spectrograph (observing, say, 100 objects at a time) could bang off 4 million stars in just 66 nights.
The word "suitable" here hides a lot though. Current generation multi- object spectrographs take on-the-order of half-
an-hour to reposition 100 objects one at a time, which increases the time to do this survey to an inconceivable 2000 nights.
Building HD Catalogue for the 21st CenturyThis is where the TAIPAN facility, that the AAO, ANU, AAL, Macquarie, Sydney, Swinburne, UNSW and others are building for the UKST, comes in. Its unique Starbug positioning system allows each fibre aperture to the spectrograph to be repositioned in parallel for a total reconfiguration time of minutes.
This makes an order-of-magnitude increase in survey numbers over the HD catalogue (i.e. 4 million stars down to 12th magnitude) doable in three years, rather than thirty. Moreover, it will deliver digital data, rather than visual spectral types from the inspection of photographic plates, enabling the creation of an on-line queriable spectral catalogue that will become the HD Catalogue of the coming century.
FunnelWeb in a nutshell
• All stars 𝜹<+30, |b|>10, I<12.• Plus all M dwarf stars I<14.
• R~2100 spectra
Three year survey duration starting Q2 2016.
FunnelWeb: More than Just a CatalogueChristened FunnelWeb (by analogy with the poisonous local after which the instrument that enables it is named), this survey will do more than create the database of properties for the brightest stars. It will also address key science goals of immediate interest. Two outstanding examples are:
– The NASA TESS satellite will launch in 2018. It will continue Kepler's ground-breaking work in exoplanetary science, by surveying hundreds of thousands of bright stars in the northern and southern hemispheres over a 2 year mission. Observing the northern hemisphere first in 2018, it will shift its focus to the south in 2019. However, TESS – while it can image the whole sky – can only download data for a subset of the stars it can see. This means it needs a robust input catalogue of G and K dwarfs (to I=12) and M dwarfs (to I=14). FunnelWeb will provide a curated input catalogue for TESS' southern survey of unparalleled quality – i.e. we will have a spectrum for every possible target, and we will know which are the very best stars for TESS to target.
– The GPI and Sphere exoplanet imaging facilities are beginning operation on Gemini and VLT as this is being written. Both these facilities deliver a quantum leap in contrast for exoplanet imaging over previous instruments. But even so, they can still only see gas giant planets in young stellar systems (when these planets are at their brightest). Unfortunately, systematically identifying the youngest stars is phenomenally difficult, and catalogues of young stars are to a large extent based on follow-up observations of suitable candidates selected from the HD Catalogue itself. By extending spectroscopic classifications (and specifically including the measurement of youth indicators) to an order-of-magnitude more bright stars, FunnelWeb will increase the sample of the youngest stars near the Sun by orders-of-magnitude.
Making it SoThe FunnelWeb team is led by Chris Tinney (UNSW), Mike Ireland (ANU). The survey will operate as an inclusive project, and the team of interested astronomers (funnel-web.wikispaces.com) is both large, and expected to grow. The team would welcome the input and membership of any interested astronomers from Australia or across the globe.

Australian Astronomical Observatory Newsletter - FEBRUARY 2015 23
SCIENCE HIGHLIGHTS
Adaptive Optics Experiments on the AATBy Michael Goodwin, Jessica Zheng, Sam Richards, Jon Lawrence
Over the last year, the Instrument Science Group at the AAO has embarked on a small research and development project to investigate the use of Adaptive Optics technologies on the 4 metre AAT at Siding Spring Observatory.
Adaptive Optics (AO) is a technique to improve the sharpness of astronomical images taken from the surface of Earth. Light from distant stars gets bent many times as it passes through the Earth's atmosphere because natural pockets of atmospheric turbulence act like lenses and prisms. This causes stars to "twinkle" to our eyes. The more turbulent the atmosphere, the more bending of the light and the bigger and "fuzzier" objects appear in our telescopic images.
AO provides a way to determine and correct for atmospheric turbulence by measuring how much the light received by the telescope changes (called the “wavefront distortion”) very rapidly (200 times per second). When successful, the efficiency of a telescope implementing AO is maximized, such that the optical quality is only limited by the diffraction limit of the telescope. AO greatly improves the performance of spectrographs and interferometers as well as imaging detectors, which makes the technology very beneficial for large ground based telescopes.
A project milestone was achieved on the nights of 9-10 December 2014, as the AO demonstrator was tested on the AAT for the first time. Figure 1 shows the AO demonstrator test-bed mounted to the Cassegrain focus of the AAT, with associated equipment attached to the cage perimeter. The Cassegrain focus allows the possibility of future experiments to test multi- object AO system over its 20 arcminutes wide field of view.
The key components and layout of the AO system are shown in Figure 2. The light from the telescope is first collimated and directed onto the deformable mirror, then it passes to the wavefront sensor, and
finally imaged onto the science detectors. A Shack Hartmann wavefront sensor is used, which consists of a 26x26 microlens array and an Andor SCMOS Zyla camera. If there was no atmospheric turbulence, the wavefront sensor would measure a flat optical wavefront, but it does not, and the distorted optical wavefront is measured with a sampling frequency of 200Hz to keep up with the changing turbulence.
The conjugated wavefront is reconstructed in real-time with control software and sent to the 97-actuator deformable mirror (Alpao DM97-15). With closed-loop operation, the perturbed optical wavefront is iteratively flattened by
choosing the proper loop gain to improve the image quality as seen on the science camera (Xenics for J-, H-band and Thorlabs for V-band).
The adaptive optics demonstrator is configured in the simplest mode, where the science target is used as the wavefront source. A calibration source in the visible and near-infrared is also used to calibrate (interaction matrix) the deformable mirror and wavefront sensor. It is a laser source with a fibre collimator. The acquisition camera provides feedback to the telescope operator to precisely point the telescope at the target.
Figure 1: Photo of the adaptive optics test-bed mounted on the Cassegrain focus on the AAT.

Australian Astronomical Observatory Newsletter - FEBRUARY 201524
SCIENCE HIGHLIGHTS
As with testing any new technology, the AO demonstrator’s first two nights on the telescope taught us a lot about the system. The control software was not configured to close the loop with the low light levels encountered at Cassegrain focus so software modifications were implemented and system realignment was made for the second night of observations. Unfortunately, the second night was mostly cloudy.
However, a break in the clouds during the final part of the night allowed a few minutes of observing. During this short window, the adaptive optics system was sufficiently stable with closed-loop operation and good data were collected. The results from the visible camera are shown in Figure 3, where an improvement to the image quality is evident, which is very encouraging.
With modifications to our set-up, it should be possible to measure the near-infrared correction soon. Future work will focus on novel technology developments including miniaturised wavefront sensors that can be distributed over focal planes for multi- object adaptive optics. The miniature wavefront sensors are compact enough and lightweight to be positioned by Starbugs. The project team based in Sydney is appreciative of the efforts of the site technical staff to get the adaptive optics demonstrator on-sky.
(a) Star image displacement (centroid) per frame without correction (red circles) and with correction (blue dots).
(b) Averaged star image in the visible without correction approx. 1.8” (left) and with correction 1.5” (right).
Figure 3: Results showing a slight improvement (partial correction) in the visible (camera response 0.4 to 0.8 microns) for data taken 10 seconds immediately before and after correction by adaptive optics. Data taken from the bright star Sirius approximately 2:44 am on the 11 December 2014.
Figure 2: Photo of the adaptive optics test-bed in the laboratory with key components labelled.
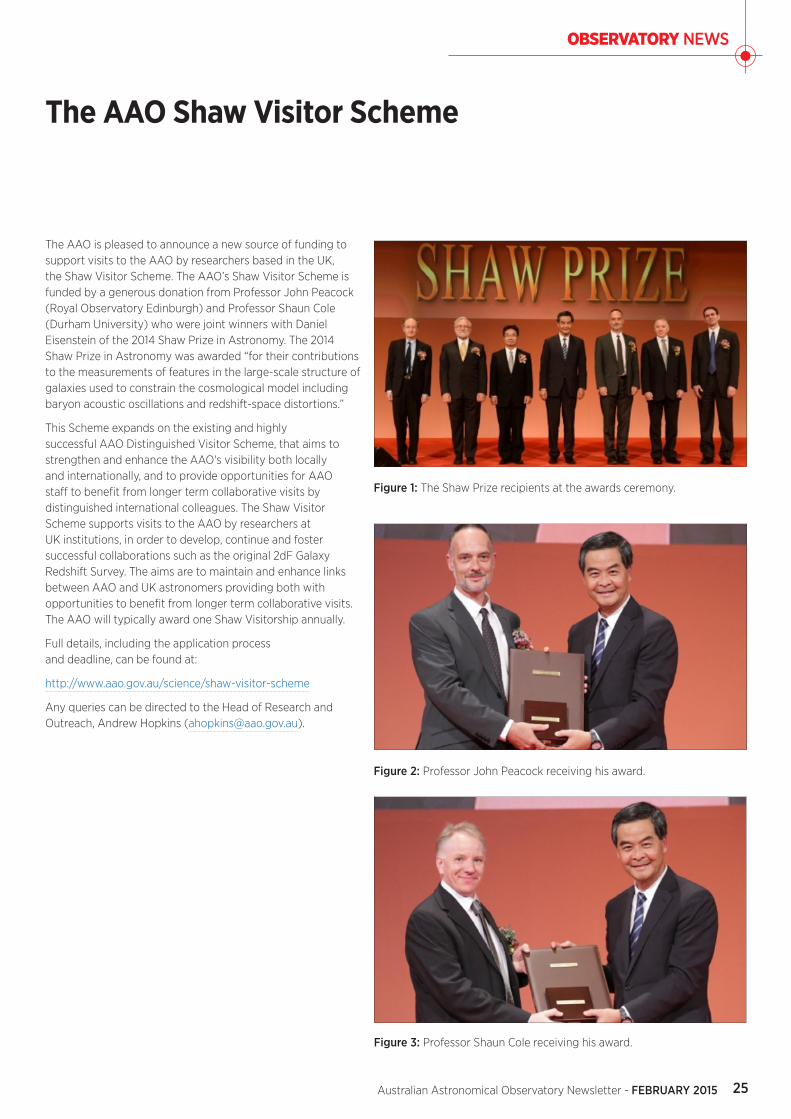
25Australian Astronomical Observatory Newsletter - FEBRUARY 2015
OBSERVATORY NEWS
The AAO Shaw Visitor Scheme
The AAO is pleased to announce a new source of funding to support visits to the AAO by researchers based in the UK, the Shaw Visitor Scheme. The AAO’s Shaw Visitor Scheme is funded by a generous donation from Professor John Peacock (Royal Observatory Edinburgh) and Professor Shaun Cole (Durham University) who were joint winners with Daniel Eisenstein of the 2014 Shaw Prize in Astronomy. The 2014 Shaw Prize in Astronomy was awarded “for their contributions to the measurements of features in the large-scale structure of galaxies used to constrain the cosmological model including baryon acoustic oscillations and redshift-space distortions.”
This Scheme expands on the existing and highly successful AAO Distinguished Visitor Scheme, that aims to strengthen and enhance the AAO's visibility both locally and internationally, and to provide opportunities for AAO staff to benefit from longer term collaborative visits by distinguished international colleagues. The Shaw Visitor Scheme supports visits to the AAO by researchers at UK institutions, in order to develop, continue and foster successful collaborations such as the original 2dF Galaxy Redshift Survey. The aims are to maintain and enhance links between AAO and UK astronomers providing both with opportunities to benefit from longer term collaborative visits. The AAO will typically award one Shaw Visitorship annually.
Full details, including the application process and deadline, can be found at:
http://www.aao.gov.au/science/shaw-visitor-scheme
Any queries can be directed to the Head of Research and Outreach, Andrew Hopkins ([email protected]).
Figure 1: The Shaw Prize recipients at the awards ceremony.
Figure 2: Professor John Peacock receiving his award.
Figure 3: Professor Shaun Cole receiving his award.
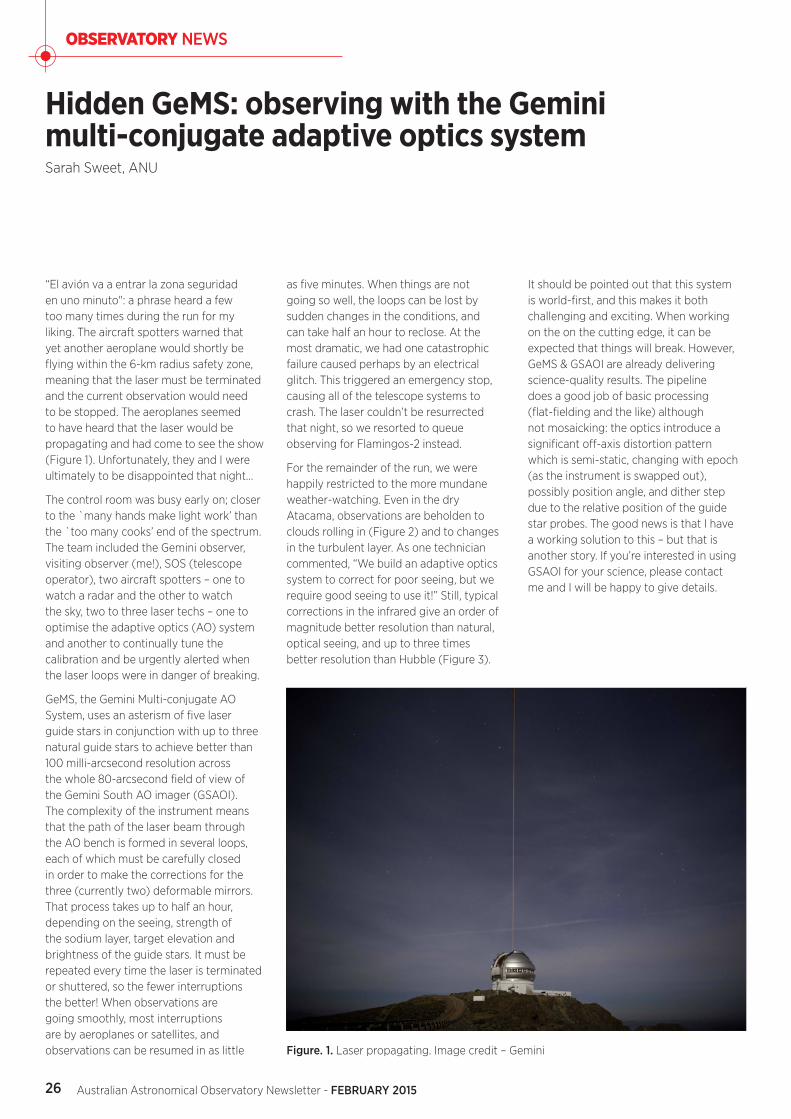
26
OBSERVATORY NEWS
Australian Astronomical Observatory Newsletter - FEBRUARY 2015
Hidden GeMS: observing with the Gemini multi-conjugate adaptive optics systemSarah Sweet, ANU
“El avión va a entrar la zona seguridad en uno minuto": a phrase heard a few too many times during the run for my liking. The aircraft spotters warned that yet another aeroplane would shortly be flying within the 6-km radius safety zone, meaning that the laser must be terminated and the current observation would need to be stopped. The aeroplanes seemed to have heard that the laser would be propagating and had come to see the show (Figure 1). Unfortunately, they and I were ultimately to be disappointed that night…
The control room was busy early on; closer to the `many hands make light work’ than the `too many cooks’ end of the spectrum. The team included the Gemini observer, visiting observer (me!), SOS (telescope operator), two aircraft spotters – one to watch a radar and the other to watch the sky, two to three laser techs – one to optimise the adaptive optics (AO) system and another to continually tune the calibration and be urgently alerted when the laser loops were in danger of breaking.
GeMS, the Gemini Multi-conjugate AO System, uses an asterism of five laser guide stars in conjunction with up to three natural guide stars to achieve better than 100 milli-arcsecond resolution across the whole 80-arcsecond field of view of the Gemini South AO imager (GSAOI). The complexity of the instrument means that the path of the laser beam through the AO bench is formed in several loops, each of which must be carefully closed in order to make the corrections for the three (currently two) deformable mirrors. That process takes up to half an hour, depending on the seeing, strength of the sodium layer, target elevation and brightness of the guide stars. It must be repeated every time the laser is terminated or shuttered, so the fewer interruptions the better! When observations are going smoothly, most interruptions are by aeroplanes or satellites, and observations can be resumed in as little
as five minutes. When things are not going so well, the loops can be lost by sudden changes in the conditions, and can take half an hour to reclose. At the most dramatic, we had one catastrophic failure caused perhaps by an electrical glitch. This triggered an emergency stop, causing all of the telescope systems to crash. The laser couldn’t be resurrected that night, so we resorted to queue observing for Flamingos-2 instead.
For the remainder of the run, we were happily restricted to the more mundane weather-watching. Even in the dry Atacama, observations are beholden to clouds rolling in (Figure 2) and to changes in the turbulent layer. As one technician commented, “We build an adaptive optics system to correct for poor seeing, but we require good seeing to use it!” Still, typical corrections in the infrared give an order of magnitude better resolution than natural, optical seeing, and up to three times better resolution than Hubble (Figure 3).
It should be pointed out that this system is world-first, and this makes it both challenging and exciting. When working on the on the cutting edge, it can be expected that things will break. However, GeMS & GSAOI are already delivering science-quality results. The pipeline does a good job of basic processing (flat-fielding and the like) although not mosaicking: the optics introduce a significant off-axis distortion pattern which is semi-static, changing with epoch (as the instrument is swapped out), possibly position angle, and dither step due to the relative position of the guide star probes. The good news is that I have a working solution to this – but that is another story. If you’re interested in using GSAOI for your science, please contact me and I will be happy to give details.
Figure. 1. Laser propagating. Image credit – Gemini
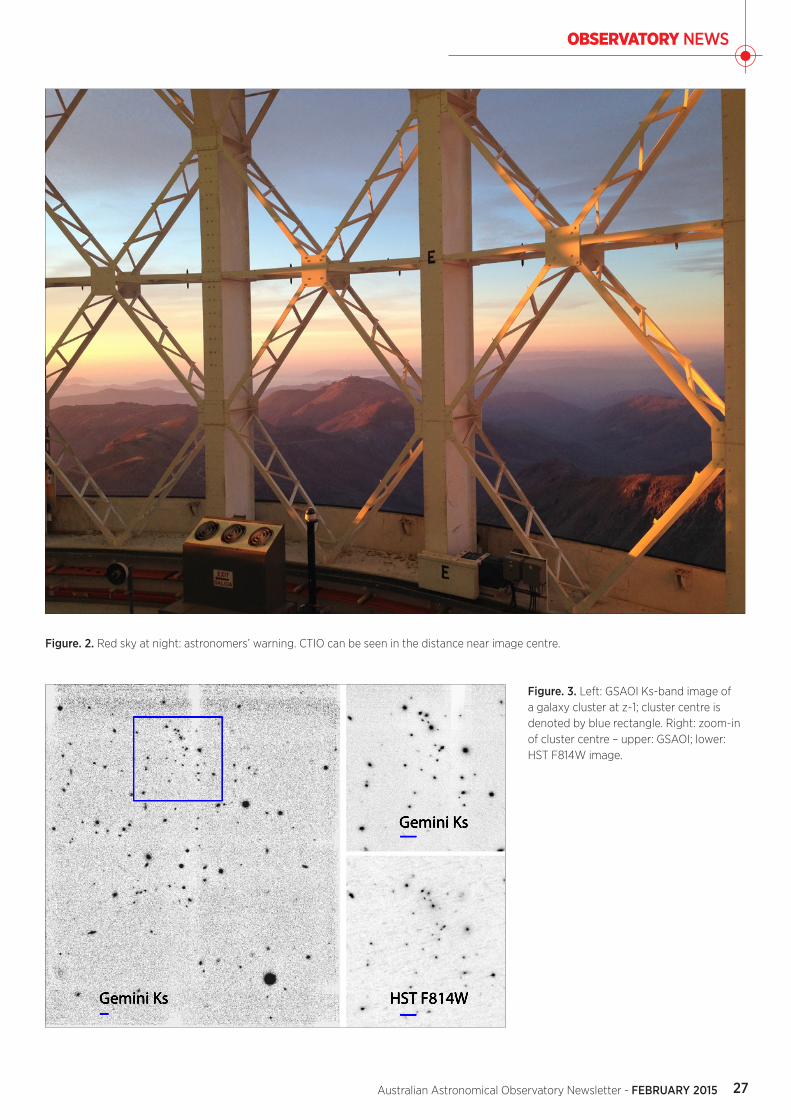
27
OBSERVATORY NEWS
Australian Astronomical Observatory Newsletter - FEBRUARY 2015
Figure. 2. Red sky at night: astronomers’ warning. CTIO can be seen in the distance near image centre.
Figure. 3. Left: GSAOI Ks-band image of a galaxy cluster at z~1; cluster centre is denoted by blue rectangle. Right: zoom-in of cluster centre – upper: GSAOI; lower: HST F814W image.
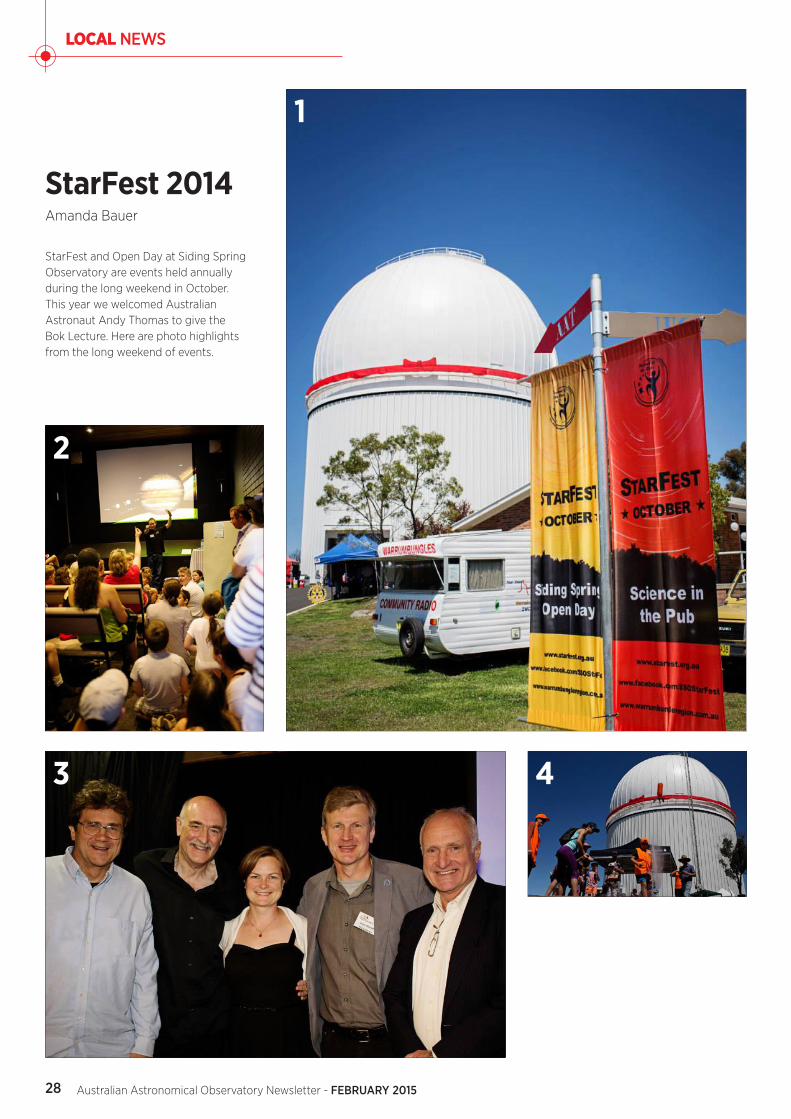
28 Australian Astronomical Observatory Newsletter - FEBRUARY 2015
LOCAL NEWS
StarFest 2014Amanda Bauer
StarFest and Open Day at Siding Spring Observatory are events held annually during the long weekend in October. This year we welcomed Australian Astronaut Andy Thomas to give the Bok Lecture. Here are photo highlights from the long weekend of events.

29Australian Astronomical Observatory Newsletter - FEBRUARY 2015
LOCAL NEWS
1: Siding Spring Observatory during Open DayCredit: Anna Tenne
2: Andy Green talks to families about Jupiter.Credit: Anna Tenne
3: Science in the Pub Panelists (L-R) Assoc. Prof Charles Lineweaver, Prof. Fred Watson, Dr Amanda Bauer, Prof Joss Bland-Hawthorn and moderator Robyn Williams.Credit: Anna Tenne
4: Blasting off water rockets!Credit: Anna Tenne
5 a: Amanda Bauer cuts the ribbon to open a new telescope in the iTelescope network. b: The plaque dedicating the new iTelescope.Credit: Eran Segev
6: AAO Director Warrick Couch describes the mysteries of Dark Matter in the Bullet Cluster of galaxies.Credit: Anna Tenne
7: Visitors at the entrance of the AAT, ready for cake.Credit: Pete Poulos
8: Director Warrick Couch cuts the big birthday cake!Credit: Amanda Bauer
9: Guests enjoyed dressing up like astronauts on the AAT dome floor.Credit: Amanda Bauer
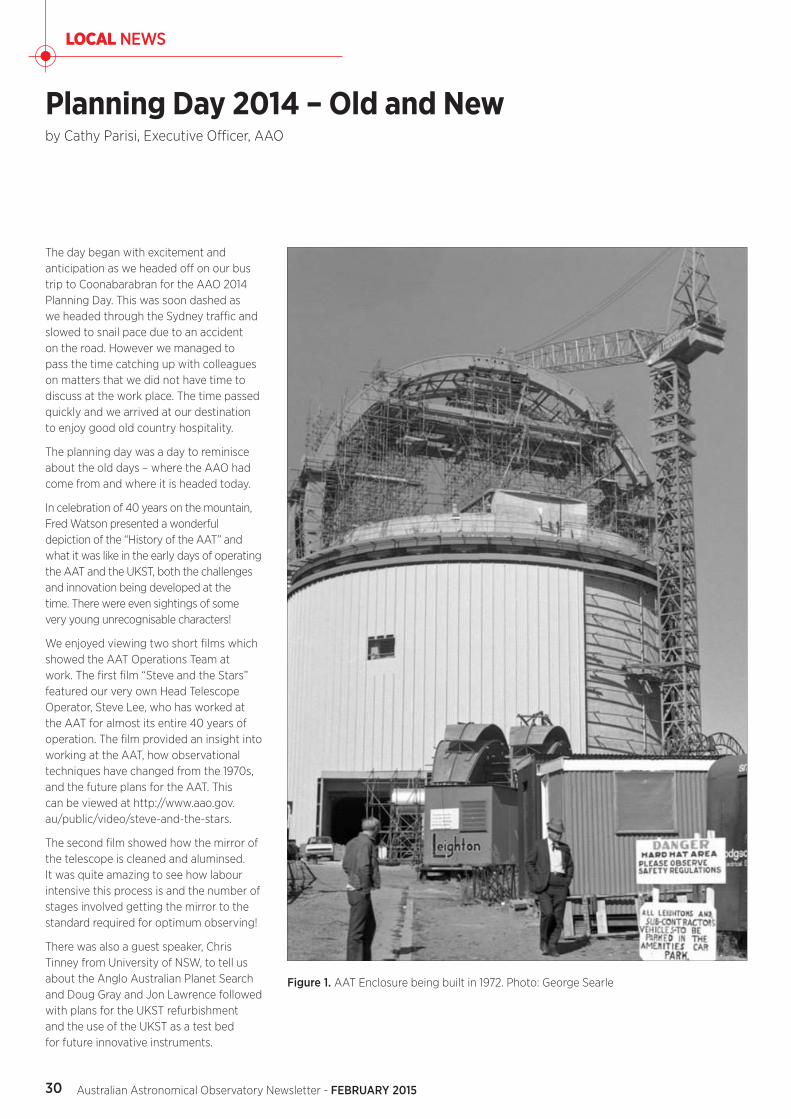
30 Australian Astronomical Observatory Newsletter - FEBRUARY 2015
LOCAL NEWS
Planning Day 2014 – Old and Newby Cathy Parisi, Executive Officer, AAO
The day began with excitement and anticipation as we headed off on our bus trip to Coonabarabran for the AAO 2014 Planning Day. This was soon dashed as we headed through the Sydney traffic and slowed to snail pace due to an accident on the road. However we managed to pass the time catching up with colleagues on matters that we did not have time to discuss at the work place. The time passed quickly and we arrived at our destination to enjoy good old country hospitality.
The planning day was a day to reminisce about the old days – where the AAO had come from and where it is headed today.
In celebration of 40 years on the mountain, Fred Watson presented a wonderful depiction of the “History of the AAT” and what it was like in the early days of operating the AAT and the UKST, both the challenges and innovation being developed at the time. There were even sightings of some very young unrecognisable characters!
We enjoyed viewing two short films which showed the AAT Operations Team at work. The first film “Steve and the Stars” featured our very own Head Telescope Operator, Steve Lee, who has worked at the AAT for almost its entire 40 years of operation. The film provided an insight into working at the AAT, how observational techniques have changed from the 1970s, and the future plans for the AAT. This can be viewed at http://www.aao.gov.au/public/video/steve-and-the-stars.
The second film showed how the mirror of the telescope is cleaned and aluminsed. It was quite amazing to see how labour intensive this process is and the number of stages involved getting the mirror to the standard required for optimum observing!
There was also a guest speaker, Chris Tinney from University of NSW, to tell us about the Anglo Australian Planet Search and Doug Gray and Jon Lawrence followed with plans for the UKST refurbishment and the use of the UKST as a test bed for future innovative instruments.
Figure 1. AAT Enclosure being built in 1972. Photo: George Searle
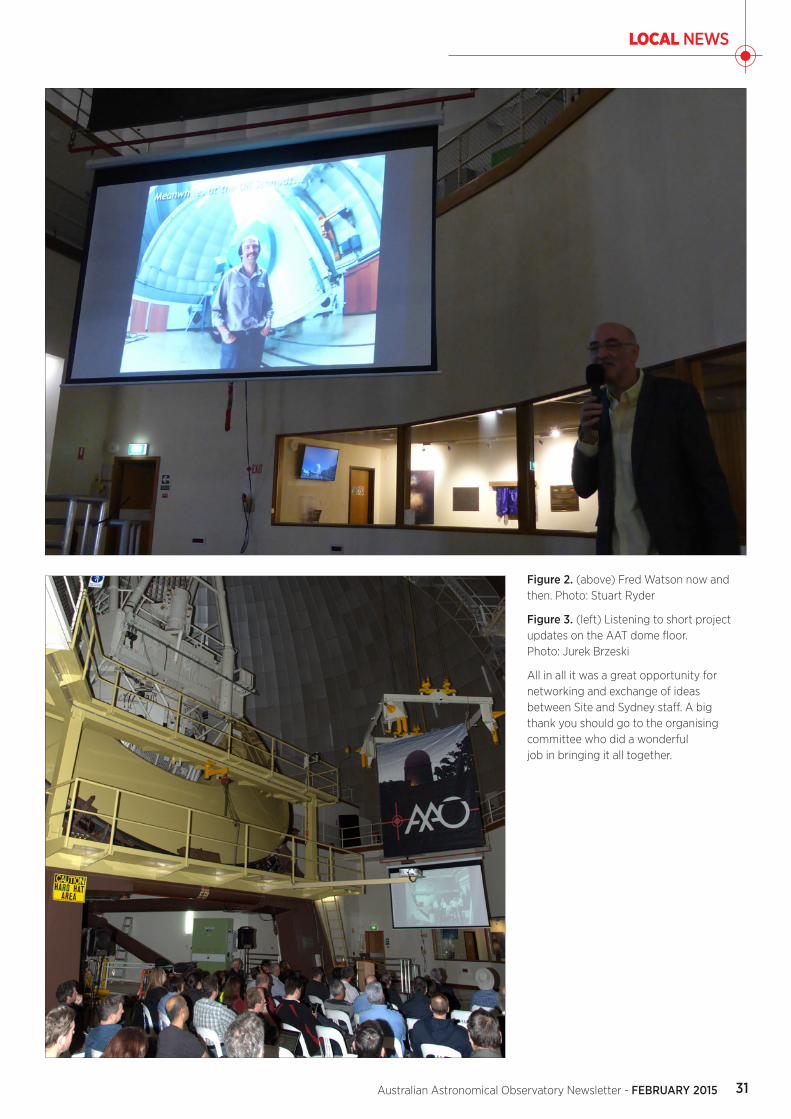
31Australian Astronomical Observatory Newsletter - FEBRUARY 2015
LOCAL NEWS
Figure 2. (above) Fred Watson now and then. Photo: Stuart Ryder
Figure 3. (left) Listening to short project updates on the AAT dome floor. Photo: Jurek Brzeski
All in all it was a great opportunity for networking and exchange of ideas between Site and Sydney staff. A big thank you should go to the organising committee who did a wonderful job in bringing it all together.
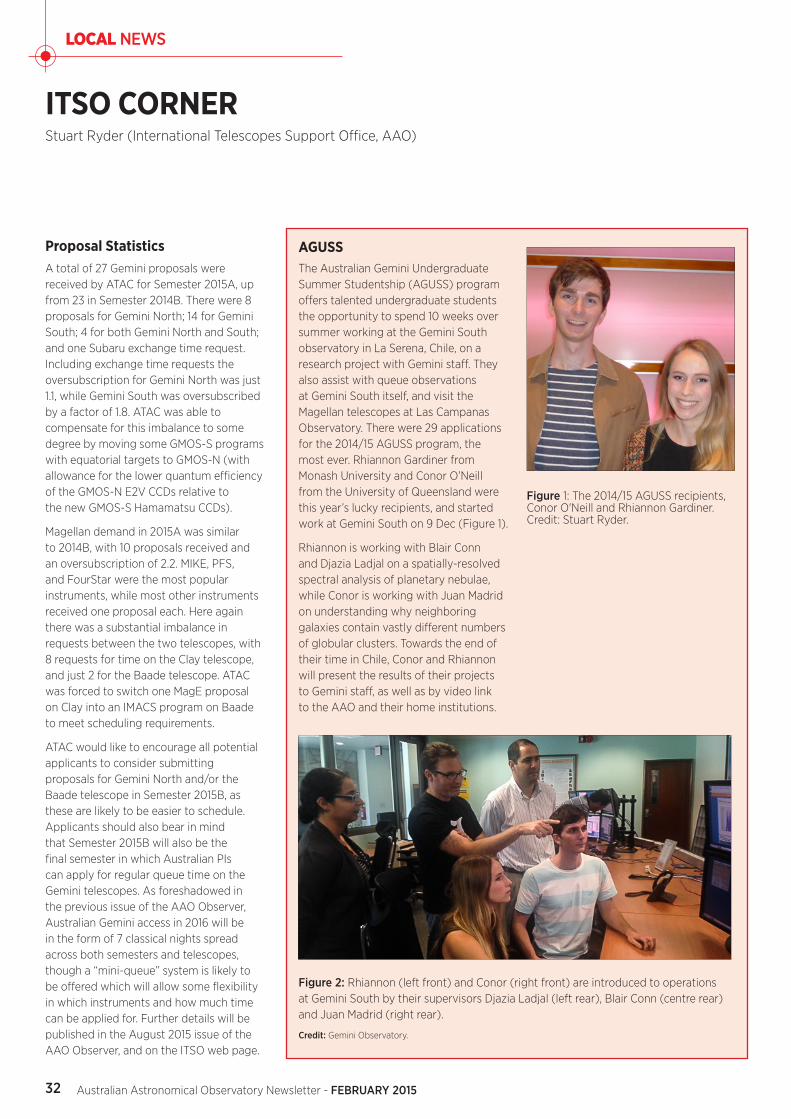
32 Australian Astronomical Observatory Newsletter - FEBRUARY 2015
LOCAL NEWS
ITSO CORNERStuart Ryder (International Telescopes Support Office, AAO)
Proposal StatisticsA total of 27 Gemini proposals were received by ATAC for Semester 2015A, up from 23 in Semester 2014B. There were 8 proposals for Gemini North; 14 for Gemini South; 4 for both Gemini North and South; and one Subaru exchange time request. Including exchange time requests the oversubscription for Gemini North was just 1.1, while Gemini South was oversubscribed by a factor of 1.8. ATAC was able to compensate for this imbalance to some degree by moving some GMOS-S programs with equatorial targets to GMOS-N (with allowance for the lower quantum efficiency of the GMOS-N E2V CCDs relative to the new GMOS-S Hamamatsu CCDs).
Magellan demand in 2015A was similar to 2014B, with 10 proposals received and an oversubscription of 2.2. MIKE, PFS, and FourStar were the most popular instruments, while most other instruments received one proposal each. Here again there was a substantial imbalance in requests between the two telescopes, with 8 requests for time on the Clay telescope, and just 2 for the Baade telescope. ATAC was forced to switch one MagE proposal on Clay into an IMACS program on Baade to meet scheduling requirements.
ATAC would like to encourage all potential applicants to consider submitting proposals for Gemini North and/or the Baade telescope in Semester 2015B, as these are likely to be easier to schedule. Applicants should also bear in mind that Semester 2015B will also be the final semester in which Australian PIs can apply for regular queue time on the Gemini telescopes. As foreshadowed in the previous issue of the AAO Observer, Australian Gemini access in 2016 will be in the form of 7 classical nights spread across both semesters and telescopes, though a “mini-queue” system is likely to be offered which will allow some flexibility in which instruments and how much time can be applied for. Further details will be published in the August 2015 issue of the AAO Observer, and on the ITSO web page.
AGUSSThe Australian Gemini Undergraduate Summer Studentship (AGUSS) program offers talented undergraduate students the opportunity to spend 10 weeks over summer working at the Gemini South observatory in La Serena, Chile, on a research project with Gemini staff. They also assist with queue observations at Gemini South itself, and visit the Magellan telescopes at Las Campanas Observatory. There were 29 applications for the 2014/15 AGUSS program, the most ever. Rhiannon Gardiner from Monash University and Conor O’Neill from the University of Queensland were this year’s lucky recipients, and started work at Gemini South on 9 Dec (Figure 1).
Rhiannon is working with Blair Conn and Djazia Ladjal on a spatially-resolved spectral analysis of planetary nebulae, while Conor is working with Juan Madrid on understanding why neighboring galaxies contain vastly different numbers of globular clusters. Towards the end of their time in Chile, Conor and Rhiannon will present the results of their projects to Gemini staff, as well as by video link to the AAO and their home institutions.
Figure 2: Rhiannon (left front) and Conor (right front) are introduced to operations at Gemini South by their supervisors Djazia Ladjal (left rear), Blair Conn (centre rear) and Juan Madrid (right rear).
Credit: Gemini Observatory.
Figure 1: The 2014/15 AGUSS recipients, Conor O'Neill and Rhiannon Gardiner. Credit: Stuart Ryder.
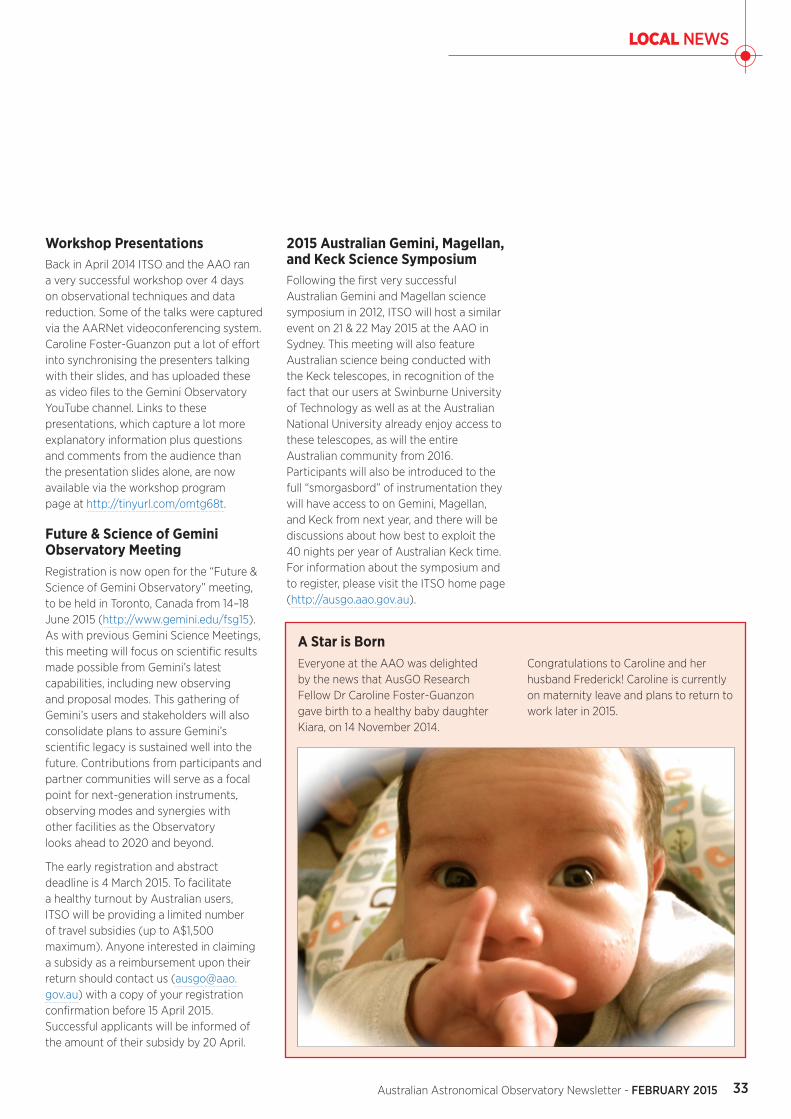
33Australian Astronomical Observatory Newsletter - FEBRUARY 2015
LOCAL NEWS
Workshop PresentationsBack in April 2014 ITSO and the AAO ran a very successful workshop over 4 days on observational techniques and data reduction. Some of the talks were captured via the AARNet videoconferencing system. Caroline Foster-Guanzon put a lot of effort into synchronising the presenters talking with their slides, and has uploaded these as video files to the Gemini Observatory YouTube channel. Links to these presentations, which capture a lot more explanatory information plus questions and comments from the audience than the presentation slides alone, are now available via the workshop program page at http://tinyurl.com/omtg68t.
Future & Science of Gemini Observatory MeetingRegistration is now open for the “Future & Science of Gemini Observatory” meeting, to be held in Toronto, Canada from 14–18 June 2015 (http://www.gemini.edu/fsg15). As with previous Gemini Science Meetings, this meeting will focus on scientific results made possible from Gemini’s latest capabilities, including new observing and proposal modes. This gathering of Gemini’s users and stakeholders will also consolidate plans to assure Gemini’s scientific legacy is sustained well into the future. Contributions from participants and partner communities will serve as a focal point for next-generation instruments, observing modes and synergies with other facilities as the Observatory looks ahead to 2020 and beyond.
The early registration and abstract deadline is 4 March 2015. To facilitate a healthy turnout by Australian users, ITSO will be providing a limited number of travel subsidies (up to A$1,500 maximum). Anyone interested in claiming a subsidy as a reimbursement upon their return should contact us ([email protected]) with a copy of your registration confirmation before 15 April 2015. Successful applicants will be informed of the amount of their subsidy by 20 April.
2015 Australian Gemini, Magellan, and Keck Science SymposiumFollowing the first very successful Australian Gemini and Magellan science symposium in 2012, ITSO will host a similar event on 21 & 22 May 2015 at the AAO in Sydney. This meeting will also feature Australian science being conducted with the Keck telescopes, in recognition of the fact that our users at Swinburne University of Technology as well as at the Australian National University already enjoy access to these telescopes, as will the entire Australian community from 2016. Participants will also be introduced to the full “smorgasbord” of instrumentation they will have access to on Gemini, Magellan, and Keck from next year, and there will be discussions about how best to exploit the 40 nights per year of Australian Keck time. For information about the symposium and to register, please visit the ITSO home page (http://ausgo.aao.gov.au).
A Star is BornEveryone at the AAO was delighted by the news that AusGO Research Fellow Dr Caroline Foster-Guanzon gave birth to a healthy baby daughter Kiara, on 14 November 2014.
Congratulations to Caroline and her husband Frederick! Caroline is currently on maternity leave and plans to return to work later in 2015.
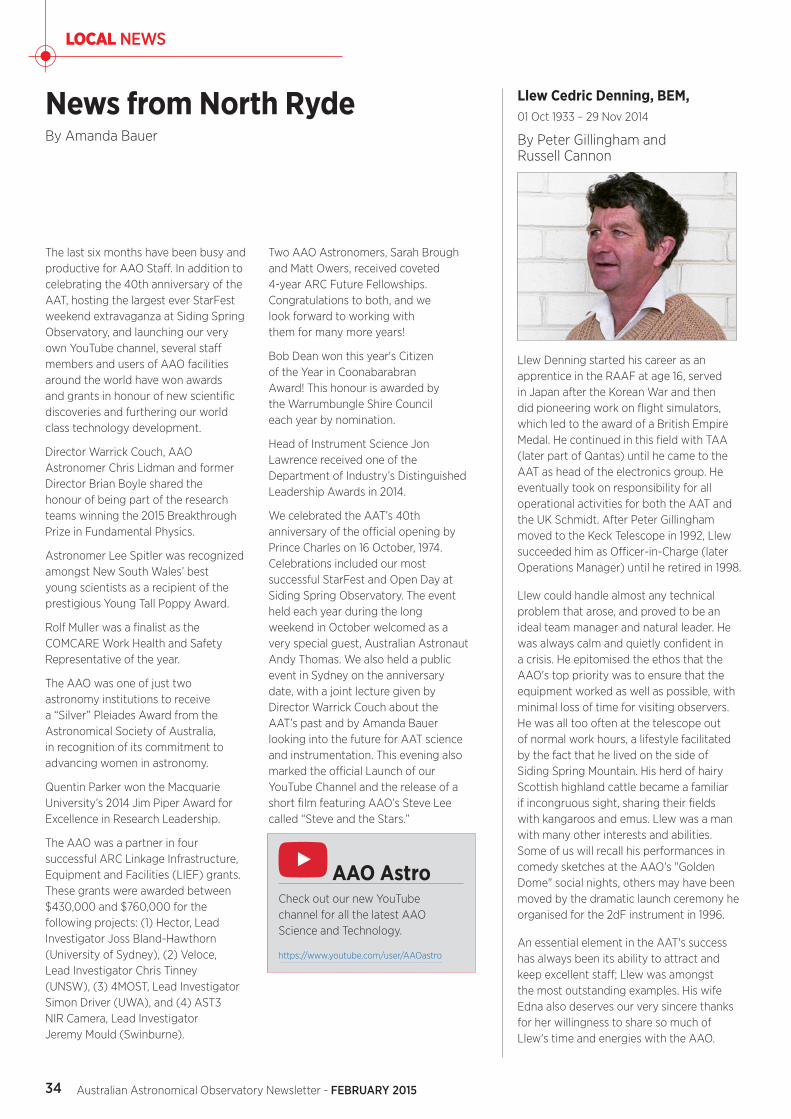
34 Australian Astronomical Observatory Newsletter - FEBRUARY 2015
LOCAL NEWS
News from North RydeBy Amanda Bauer
The last six months have been busy and productive for AAO Staff. In addition to celebrating the 40th anniversary of the AAT, hosting the largest ever StarFest weekend extravaganza at Siding Spring Observatory, and launching our very own YouTube channel, several staff members and users of AAO facilities around the world have won awards and grants in honour of new scientific discoveries and furthering our world class technology development.
Director Warrick Couch, AAO Astronomer Chris Lidman and former Director Brian Boyle shared the honour of being part of the research teams winning the 2015 Breakthrough Prize in Fundamental Physics.
Astronomer Lee Spitler was recognized amongst New South Wales’ best young scientists as a recipient of the prestigious Young Tall Poppy Award.
Rolf Muller was a finalist as the COMCARE Work Health and Safety Representative of the year.
The AAO was one of just two astronomy institutions to receive a “Silver” Pleiades Award from the Astronomical Society of Australia, in recognition of its commitment to advancing women in astronomy.
Quentin Parker won the Macquarie University’s 2014 Jim Piper Award for Excellence in Research Leadership.
The AAO was a partner in four successful ARC Linkage Infrastructure, Equipment and Facilities (LIEF) grants. These grants were awarded between $430,000 and $760,000 for the following projects: (1) Hector, Lead Investigator Joss Bland-Hawthorn (University of Sydney), (2) Veloce, Lead Investigator Chris Tinney (UNSW), (3) 4MOST, Lead Investigator Simon Driver (UWA), and (4) AST3 NIR Camera, Lead Investigator Jeremy Mould (Swinburne).
Two AAO Astronomers, Sarah Brough and Matt Owers, received coveted 4-year ARC Future Fellowships. Congratulations to both, and we look forward to working with them for many more years!
Bob Dean won this year's Citizen of the Year in Coonabarabran Award! This honour is awarded by the Warrumbungle Shire Council each year by nomination.
Head of Instrument Science Jon Lawrence received one of the Department of Industry’s Distinguished Leadership Awards in 2014.
We celebrated the AAT’s 40th anniversary of the official opening by Prince Charles on 16 October, 1974. Celebrations included our most successful StarFest and Open Day at Siding Spring Observatory. The event held each year during the long weekend in October welcomed as a very special guest, Australian Astronaut Andy Thomas. We also held a public event in Sydney on the anniversary date, with a joint lecture given by Director Warrick Couch about the AAT’s past and by Amanda Bauer looking into the future for AAT science and instrumentation. This evening also marked the official Launch of our YouTube Channel and the release of a short film featuring AAO’s Steve Lee called “Steve and the Stars.”
AAO AstroCheck out our new YouTube channel for all the latest AAO Science and Technology.
https://www.youtube.com/user/AAOastro
Llew Cedric Denning, BEM,01 Oct 1933 – 29 Nov 2014
By Peter Gillingham and Russell Cannon
Llew Denning started his career as an apprentice in the RAAF at age 16, served in Japan after the Korean War and then did pioneering work on flight simulators, which led to the award of a British Empire Medal. He continued in this field with TAA (later part of Qantas) until he came to the AAT as head of the electronics group. He eventually took on responsibility for all operational activities for both the AAT and the UK Schmidt. After Peter Gillingham moved to the Keck Telescope in 1992, Llew succeeded him as Officer-in-Charge (later Operations Manager) until he retired in 1998.
Llew could handle almost any technical problem that arose, and proved to be an ideal team manager and natural leader. He was always calm and quietly confident in a crisis. He epitomised the ethos that the AAO's top priority was to ensure that the equipment worked as well as possible, with minimal loss of time for visiting observers. He was all too often at the telescope out of normal work hours, a lifestyle facilitated by the fact that he lived on the side of Siding Spring Mountain. His herd of hairy Scottish highland cattle became a familiar if incongruous sight, sharing their fields with kangaroos and emus. Llew was a man with many other interests and abilities. Some of us will recall his performances in comedy sketches at the AAO's "Golden Dome" social nights, others may have been moved by the dramatic launch ceremony he organised for the 2dF instrument in 1996.
An essential element in the AAT's success has always been its ability to attract and keep excellent staff; Llew was amongst the most outstanding examples. His wife Edna also deserves our very sincere thanks for her willingness to share so much of Llew's time and energies with the AAO.
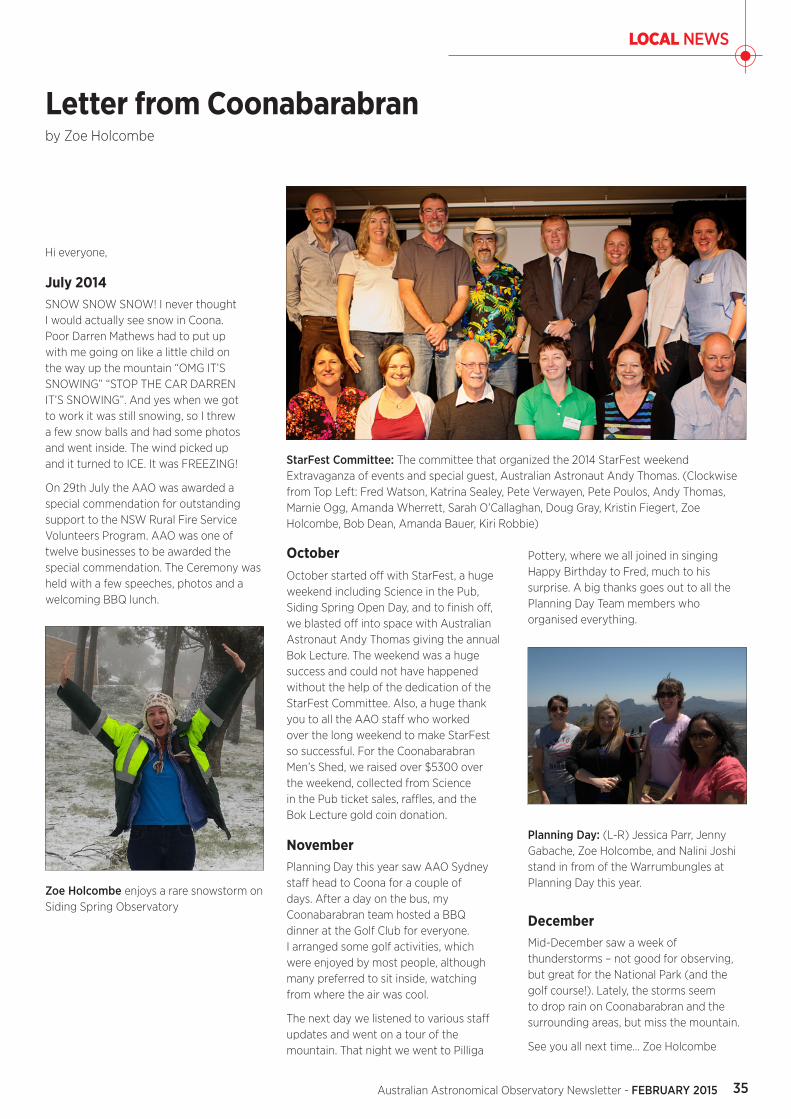
35Australian Astronomical Observatory Newsletter - FEBRUARY 2015
LOCAL NEWS
Letter from Coonabarabranby Zoe Holcombe
Hi everyone,
July 2014SNOW SNOW SNOW! I never thought I would actually see snow in Coona. Poor Darren Mathews had to put up with me going on like a little child on the way up the mountain “OMG IT’S SNOWING” “STOP THE CAR DARREN IT’S SNOWING”. And yes when we got to work it was still snowing, so I threw a few snow balls and had some photos and went inside. The wind picked up and it turned to ICE. It was FREEZING!
On 29th July the AAO was awarded a special commendation for outstanding support to the NSW Rural Fire Service Volunteers Program. AAO was one of twelve businesses to be awarded the special commendation. The Ceremony was held with a few speeches, photos and a welcoming BBQ lunch.
OctoberOctober started off with StarFest, a huge weekend including Science in the Pub, Siding Spring Open Day, and to finish off, we blasted off into space with Australian Astronaut Andy Thomas giving the annual Bok Lecture. The weekend was a huge success and could not have happened without the help of the dedication of the StarFest Committee. Also, a huge thank you to all the AAO staff who worked over the long weekend to make StarFest so successful. For the Coonabarabran Men’s Shed, we raised over $5300 over the weekend, collected from Science in the Pub ticket sales, raffles, and the Bok Lecture gold coin donation.
NovemberPlanning Day this year saw AAO Sydney staff head to Coona for a couple of days. After a day on the bus, my Coonabarabran team hosted a BBQ dinner at the Golf Club for everyone. I arranged some golf activities, which were enjoyed by most people, although many preferred to sit inside, watching from where the air was cool.
The next day we listened to various staff updates and went on a tour of the mountain. That night we went to Pilliga
Pottery, where we all joined in singing Happy Birthday to Fred, much to his surprise. A big thanks goes out to all the Planning Day Team members who organised everything.
DecemberMid-December saw a week of thunderstorms – not good for observing, but great for the National Park (and the golf course!). Lately, the storms seem to drop rain on Coonabarabran and the surrounding areas, but miss the mountain.
See you all next time… Zoe Holcombe
Zoe Holcombe enjoys a rare snowstorm on Siding Spring Observatory
StarFest Committee: The committee that organized the 2014 StarFest weekend Extravaganza of events and special guest, Australian Astronaut Andy Thomas. (Clockwise from Top Left: Fred Watson, Katrina Sealey, Pete Verwayen, Pete Poulos, Andy Thomas, Marnie Ogg, Amanda Wherrett, Sarah O’Callaghan, Doug Gray, Kristin Fiegert, Zoe Holcombe, Bob Dean, Amanda Bauer, Kiri Robbie)
Planning Day: (L-R) Jessica Parr, Jenny Gabache, Zoe Holcombe, and Nalini Joshi stand in from of the Warrumbungles at Planning Day this year.
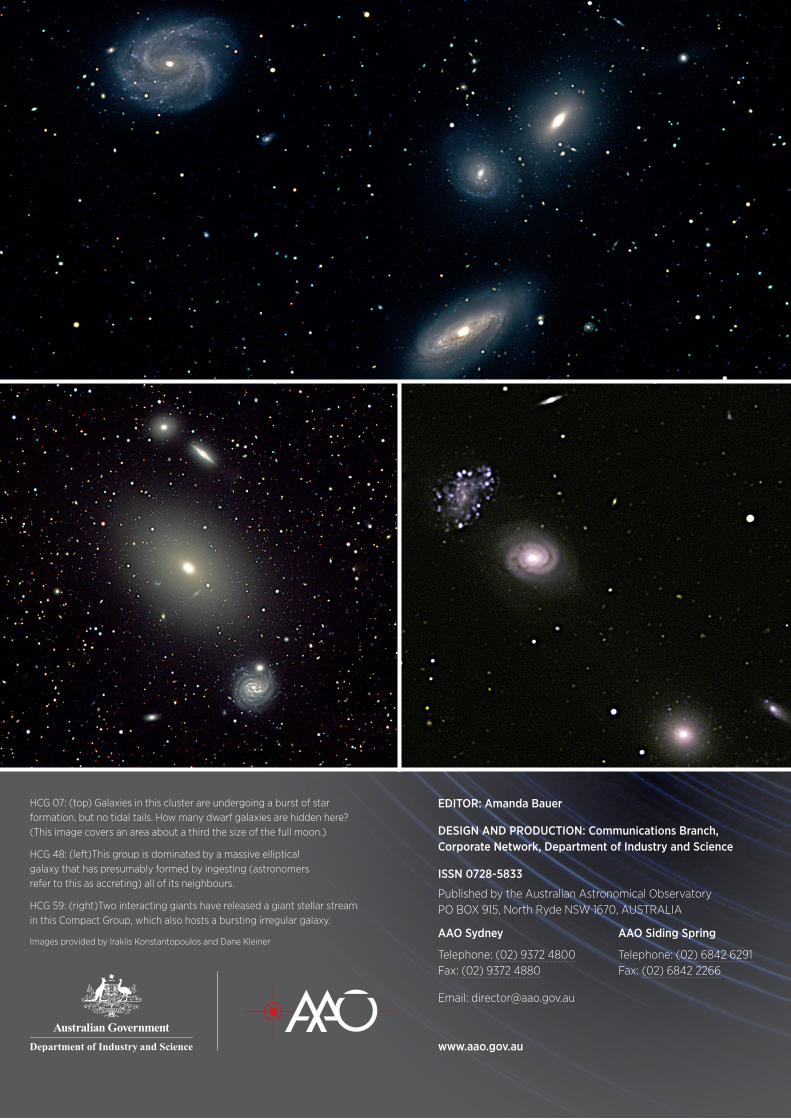
HCG 07: (top) Galaxies in this cluster are undergoing a burst of star formation, but no tidal tails. How many dwarf galaxies are hidden here? (This image covers an area about a third the size of the full moon.)
HCG 48: (left)This group is dominated by a massive elliptical galaxy that has presumably formed by ingesting (astronomers refer to this as accreting) all of its neighbours.
HCG 59: (right)Two interacting giants have released a giant stellar stream in this Compact Group, which also hosts a bursting irregular galaxy.
Images provided by Iraklis Konstantopoulos and Dane Kleiner
EDITOR: Amanda Bauer
DESIGN AND PRODUCTION: Communications Branch, Corporate Network, Department of Industry and Science
ISSN 0728-5833
Published by the Australian Astronomical Observatory PO BOX 915, North Ryde NSW 1670, AUSTRALIA
AAO Sydney
Telephone: (02) 9372 4800 Fax: (02) 9372 4880
Email: [email protected]
www.aao.gov.au
AAO Siding Spring
Telephone: (02) 6842 6291 Fax: (02) 6842 2266


![[Exercise Name] Observer / VIP Briefing [Date] Observer / VIP Briefing [Date]](https://static.fdocuments.us/doc/165x107/56649f4d5503460f94c6d2ea/exercise-name-observer-vip-briefing-date-observer-vip-briefing-date.jpg)

