Observations Drawn from the NCHEMS Feasibility and Demand Study Presented to the AZ AIR Prescott,...
39
Observations Drawn from the NCHEMS Feasibility and Demand Study Presented to the AZ AIR Prescott, Arizona April 4, 2008 National Center for Higher Education National Center for Higher Education Management Systems Management Systems 3035 Center Green Drive, Suite 150 Boulder, Colorado 80301-2251
-
Upload
helena-barber -
Category
Documents
-
view
213 -
download
0
Transcript of Observations Drawn from the NCHEMS Feasibility and Demand Study Presented to the AZ AIR Prescott,...

Observations Drawn from the NCHEMS Feasibility and Demand Study
Presented to the
AZ AIRPrescott, Arizona
April 4, 2008
National Center for Higher Education Management SystemsNational Center for Higher Education Management Systems3035 Center Green Drive, Suite 150 Boulder, Colorado 80301-2251

2
Activities of the Project
► Data Analysis
► Regional Forums
► Simulation Models
3
Arizona Is Behind the U.S. in the
Education Attainment Levels of
Its Young Adult Population
And It Is Losing Ground Rapidly.
4
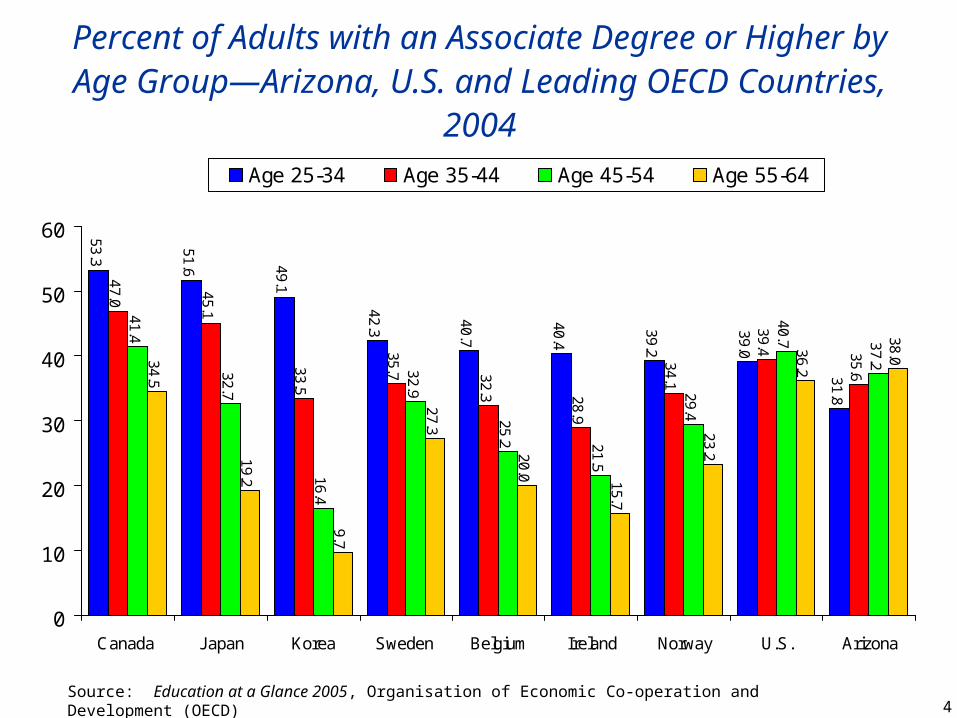
Percent of Adults with an Associate Degree or Higher by Age Group—Arizona, U.S. and Leading OECD Countries, 2004
Source: Education at a Glance 2005, Organisation of Economic Co-operation and Development (OECD)
53.3
51.6 49.1
42.3
40.7
40.4
39.2
39.0
31.8
47.0 45.1
33.5
35.7 32.3 28.9
34.1
39.4 35.6
41.4
32.7
16.4
32.9
25.2 21.5
29.4
40.7 37.234.5
19.2
9.7
27.3
20.0 15.7
23.2
36.2
38.0
0
10
20
30
40
50
60
Canada Japan Korea Sweden Belgium Ireland Norway U.S. Arizona
Age 25-34 Age 35-44 Age 45-54 Age 55-64

5
Percent of Adults with a Bachelor’s Degree or Higher by Age Group—Arizona, U.S. and Leading OECD Countries, 2004
Source: Education at a Glance 2005, OECD
37.0
31.8
30.8
30.2 28.2
27.5
23.5
31.8
27.0
26.3
29.5 26.7
22.7
26.3
26.4
26.2
14.0
30.6
20.6
20.0
27.5
21.1
21.8
8.7
28.3
15.6
17.8
29.2
0
5
10
15
20
25
30
35
40
Norway Netherlands Korea United States Iceland Canada Arizona
Age 25-34 Age 35-44 Age 45-54 Age 55-64

6
Difference in College Attainment (Associate and Higher) Between Younger and Older Adults—United States, 2005
Source: U.S. Census Bureau, 2005 American Community Survey (ACS) and ACS Public Use Microdata Sample (PUMS) File
15
25
35
45
55
Massachusetts
Minnesota
New
York
North D
akotaN
ew Jersey
New
Ham
pshireC
onnecticutN
ebraskaC
oloradoM
arylandV
irginiaS
outh Dakota
Iowa
Verm
ontR
hode IslandP
ennsylvaniaIllinoisW
isconsinW
ashingtonK
ansasU
tahU
nited States
Delaw
areM
ontanaH
awaii
Michigan
Georgia
North C
arolinaM
aineO
hioC
aliforniaF
loridaO
regonM
issouriIndianaM
ississippiS
outh Carolina
Wyom
ingA
labama
Arizona
Alaska
Tennessee
Kentucky
Oklahom
aT
exasIdahoW
est Virginia
LouisianaN
ew M
exicoA
rkansasN
evada
Age 25-34
Age 45-54

7
Percentage Differences Between Younger (Age 25-34) and Older (Age 45-54) Populations with College Degrees,
Associate and Higher, 2005
9.4
7.5
6.7 6
.36
.24
.9 4.6
4.5
4.4 4.2
4.2 3.9 3.6
3.5 3
.0 2.4 1
.81
.8 1.6
1.5 1.2
1.1 0.9 0.6
0.6 0
.3 0.1
-0.5
-0.8
-0.8 -1
.5-1
.7-1
.8-1
.9-3
.6-3
.7-3
.8 -4.2
-4.5 -5
.4-5
.5-6
.6
3.8
-1.3
1.3
0.4
1.2
-6.8
0.1
10
.0
6.9
-8
-4
0
4
8
12
So
uth
Da
kota
Iow
aM
inn
eso
taN
eb
raska
Ne
w Y
ork
Pe
nn
sylvan
iaW
iscon
sinM
ississipp
iN
ew
Ha
mp
shire
Ind
ian
aO
hio
No
rth D
ako
taM
assa
chu
setts
We
st Virg
inia
Illino
isL
ou
isian
aK
en
tucky
Rh
od
e Isla
nd
Misso
uri
Ka
nsa
sT
en
ne
ssee
Ne
w Je
rsey
Mich
iga
nA
rkan
sas
Ala
ba
ma
Ge
org
iaM
aryla
nd
Un
ited
Sta
tes
Uta
hN
orth
Ca
rolin
aD
ela
wa
reM
on
tan
aW
yom
ing
Virg
inia
Wa
shin
gto
nO
klah
om
aF
lorid
aS
ou
th C
aro
lina
Ore
go
nM
ain
eC
on
ne
cticut
Co
lora
do
Te
xas
Ca
liforn
iaN
eva
da
Ida
ho
Ala
skaA
rizon
aV
erm
on
tH
aw
aii
Ne
w M
exico
Source: U.S. Census Bureau, 2005 ACS

8
Educational Attainment and Rank Among States—Arizona, 2005 (Percent)
42nd
41st
19th
35th
24th
01020304050
Age 25-64 withGraduate/Prof. Degree
Age 25-64 withBachelor's or Higher
Age 25-64 withAssociate Degree
Age 25-64 withHigh School Diploma
Age 18-24 withHigh School Diploma 77.7%
9.2%
84.2%
9.0%
26.3%
Source: U.S. Census Bureau, 2005 ACS

9
The Gap in
Education Attainment Is
Reflected in Per Capita Incomes

10
Per Capita Personal Income, 20052
4,6
64
30
,01
9
34
,47
1
47
,38
8
$0
$10,000
$20,000
$30,000
$40,000
$50,000
Connecticut
New
JerseyM
assachusettsM
arylandN
ew Y
orkN
ew H
ampshire
Colorado
Virginia
Wyom
ingM
innesotaD
elaware
California
IllinoisN
evadaA
laskaW
ashingtonR
hode IslandP
ennsylvaniaH
awaii
United S
tatesF
loridaW
isconsinN
ebraskaK
ansasM
ichiganV
ermont
South D
akotaT
exasO
regonO
hioIow
aN
orth Dakota
Missouri
IndianaN
orth Carolina
Tennessee
Georgia
Maine
Arizona
Oklahom
aA
labama
Montana
IdahoS
outh Carolina
Kentucky
New
Mexico
Utah
Arkansas
West V
irginiaM
ississippiLouisiana
Source: U.S. Bureau of Economic Analysis

11
Per Capita Personal Income as a Percent of U.S. Average—Arizona, 1960-2005
Source: Regional Economic Information System, Bureau of Economic Analysis, U.S. Dept. of Commerce
93.3
87.386.4 86.0
87.4
84.5
93.9
89.891.0
94.2
70
80
90
100
110
1960 1965 1970 1975 1980 1985 1990 1995 2000 2005
U.S. Average

12
Becoming Internationally Competitive
Would Require a Large Increase in
Annual Degree Production.
Part of This Increase Would Have to
Come from “Re-Entry” Students.

13
The “Gap”—Difference in Annual Degrees Currently Produced and Annual Degrees Needed to Meet Benchmark
Source: U.S. Census Bureau, PUMS and Population Projections, IPEDS Completions Survey 2004-05
Accounting for MigrationN
orth
Da
kota
Ne
bra
skaIo
wa
Rh
od
e Isla
nd
Uta
hN
ew
Yo
rkC
olo
rad
oM
assa
chu
setts
131,749
94,162
140,533
29,19028,84628,582
25,22724,87224,37423,77723,424
21,467 16,21415,34314,47714,45514,43414,14414,09013,67512,82612,07311,943
10,78810,410
9,4658,811
6,9486,9416,054
4,2624,2323,7263,639
2,392
1,551959950411290
-719-2,122
-3,195-3,372-4,028 -8,768
-11,369
7698
-18,389
1,944
-20,000
-10,000
0
10,000
20,000
30,000
40,000
Texas
Ca
liforniaF
loridaA
rizona
Georgia
No
rth Carolina
Tenn
esseeO
hioN
evada
Louisiana
Ne
w Jerse
yM
ichiganK
entucky
Arkansas
Sou
th Carolina
Alabam
aIndian
aW
ashington
Virg
iniaP
ennsylvania
Oreg
onW
isconsin
Maryland
IllinoisM
ississippiO
klahoma
Missouri
Ne
w M
exicoW
est Virginia
IdahoA
laskaC
onnecticut
Maine
Ha
waii
Monta
naW
yoming
Kan
sasD
elaw
areN
ew
Ham
pshireM
innesota
Sou
th Dako
taV
ermont
Arizona’s 29,290 = 101% Increase (Assuming All Growth in Public Sector)
14
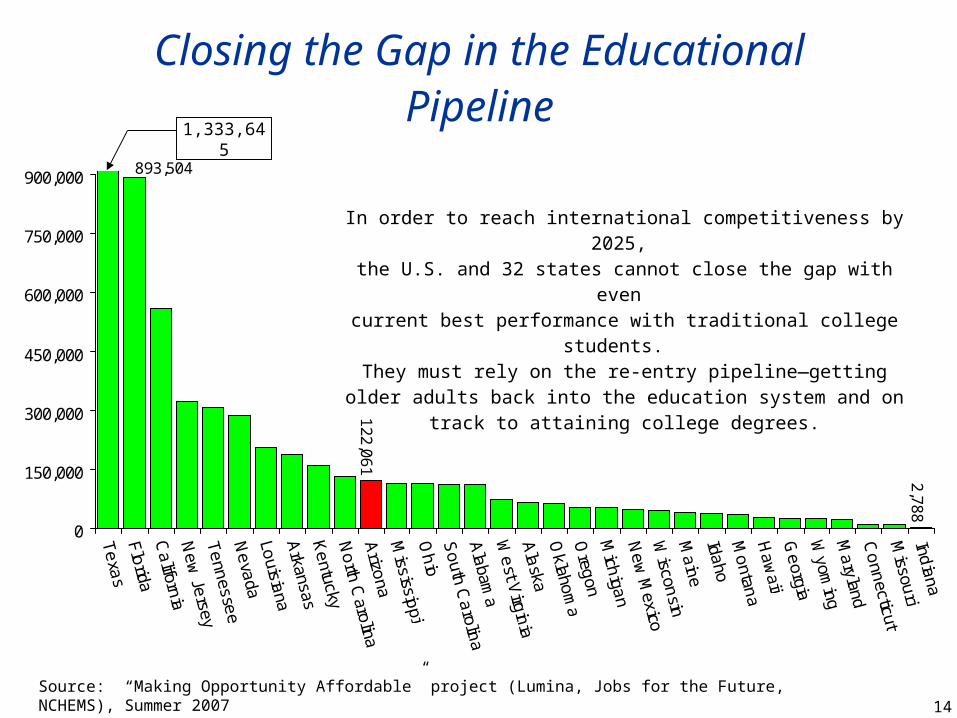
Closing the Gap in the Educational Pipeline
Source: “Making Opportunity Affordable” project (Lumina, Jobs for the Future, NCHEMS), Summer 2007
2,7
88
893,504
12
2,0
61
0
150,000
300,000
450,000
600,000
750,000
900,000
Te
xas
Flo
ridaC
aliforn
iaN
ew
Jersey
Te
nnesse
eN
eva
daLo
uisiana
Arkansas
Ke
ntuckyN
orth
Carolina
Arizo
naM
ississippi
Oh
ioS
outh C
arolin
aA
labam
aW
est V
irgin
iaA
laska
Oklaho
ma
Oreg
onM
ichiga
nN
ew
Mexico
Wiscon
sinM
ain
eIda
hoM
ontan
aH
aw
aiiG
eorgia
Wyom
ingM
aryland
Co
nnecticut
Missou
riInd
iana
1,333,645
In order to reach international competitiveness by 2025, the U.S. and 32 states cannot close the gap with even
current best performance with traditional college students. They must rely on the re-entry pipeline—getting older adults back
into the education system and on track to attaining college degrees.

15
Increase in Certificates and Degrees Produced, 2007-25 (In Addition to Number Currently Produced)
51,233 40,950
100,34469,838 57,924
197,026
111,431139,438
244,090
0
100,000
200,000
300,000
400,000
500,000
600,000
Certificates Associate Degrees Bachelor's Degrees
Business as Usual
Closing Race/Ethnic Gaps
All Counties Performing at "Best County" Level
Increase required without migrationIncrease required with current levels of migration

16
Projected Increase in Population
► Be Concentrated in Three Counties
► Consist Primarily of Subpopulations that
Historically Have not Been Well Served by
Higher Education
Arizona Is Projected to Have a Large Increase
in Population that Will:

17
Projected Percent Change in Total Population, 2000-2025
Source: U.S. Census Bureau
24
.20
10
20
30
40
50
60
Nevada
Arizon
aF
lorida
Texas
Uta
hId
aho
North C
aro
lina
Geo
rgia
Wa
shing
ton
Ore
gon
Virg
inia
Ala
skaC
alifornia
Colora
do
New
Ham
psh
ireM
arylan
dD
elaware
Sou
th C
arolina
Ten
nessee
Minne
sota
United S
tates
Haw
aii
Arkan
sas
New
Me
xicoV
ermo
nt
Mon
tana
New
Jersey
Wisco
nsinM
issouri
Ken
tucky
Maine
Oklah
oma
Indian
aR
hode
Island
Massa
chuse
ttsK
ansa
sC
onne
cticutA
laba
ma
Mississipp
iM
ichigan
Illinois
Wyo
min
gL
ouisian
aS
outh
Dakota
Neb
raska
Pen
nsylvania
New
York
Iow
aO
hioW
est V
irginiaN
orth Da
kota
-3.3
85.8
93.3

18
Projected Change in Total Arizona Population By County, 2006-2025
11
9,4
50
11
2,7
83
99
,16
7
62
,52
8
44
,32
8
33
,90
4
21
,32
4
15
,92
6
14
,77
7
8,6
83
5,3
48
46
2,3
90
37
9,1
80
0
100,000
200,000
300,000
400,000
500,000
Marico
pa
Pin
al
Pim
a
Yavap
ai
Moh
ave
Yum
a
Cochise
Navajo
Cocon
ino
San
ta C
ruz
Apa
che
Gila
Gra
ham
La P
az
Gre
enle
e
1,992,244
-76
Source: Arizona Dept. of Commerce, Arizona Dept. of Economic Security

19
Projected Change in Arizona Population by Age Group and County, 2006-2025
Source: Arizona Dept. of Commerce, Arizona Dept. of Economic Security
2.4 0.3
0.0
0.1
15
2.4
5.4
21
.7
22
.4
1.1
4.7
6.02.7
1.6
0.0
-0.2
-0.2
-0.1
17
5.7
3.9
31
.0
17
.0
1.2
4.5
5.2
8.3
7.4 3
.0
4.1 1.2
1.4
35
.1 22
.3
59
.5
13
2.8
4.8
43
.4
14
.5
-0.6
-0.4
-2.1
-1.4
-3.3
-2.6
-0.7
-25
0
25
50
75
100
125
150
175
200
Apache
Cochise
Coconino
Gila
Graham
Greenlee
La Paz
Maricopa
Mohave
Navajo
Pim
a
Pinal
Santa C
ruz
Yavapai
Yum
a
Age 15-19
Age 20-24
Age 25-49
393.3

20
Projected Change in Arizona Population Age 15-24 By Race/Ethnicity and County, 2006-2025
Source: Arizona Dept. of Commerce, Arizona Dept. of Economic Security
83
9
4,2
50
6,7
39
17
,77
7
20
,49
9
6,0
65
1,1
73
2,9
98 1,1
86
55
2
34
0
21
3
3,7
17
30
,95
2
29
,64
8
2,7
57
3,5
83
11
,90
3
35
6
-13
1
-48
31
,23
1
32
5
6,4
44
3,1
28
0
18
9
26
2
-27
9
-19
3
-39
5 3
-48
9
-68
7
-68
3
-30
89
49
9
-3,6
44
-72
9
-2,2
80
-4,6
92
-17
-5,000
0
5,000
10,000
15,000
20,000
25,000
30,000
35,000
Apache
Cochise
Coconino
Gila
Graham
Greenlee
La Paz
Maricopa
Mohave
Navajo
Pim
a
Pinal
Santa C
ruz
Yavapai
Yum
a
White
Hispanic/Latino
Native American
180,841107,467

21
Percent Educational Attainment of Arizona’s Young Workforce (Age 25-34)—Indexed to Most Educated Country, 2005
Source: U.S. Census Bureau, 2005 ACS; OECD
Males Males Males Males MalesFemales Females Females Females Females
Native American/ Asian/White African-American Hispanic/Latino Alaska Native Pacific Islander
0
50
100
150
200
250
Top Country (Norway)
U.S. Index = 81%
Bachelor's Degree or Higher
0
50
100
150
200
Top Country (Canada)
U.S. Index = 72%
All College Degrees (Associate or Higher)

22
Difference Between Whites and Next Largest Race/Ethnic Group in Percentage of Adults Age 25-34 with an Associate Degree
or Higher, 2000
19
.3
27
.3
35
.8
1.4
0
10
20
30
40
Colorado
California
Conn
ecticutN
ebraskaS
outh D
akotaN
ew Y
orkM
assachuse
ttsN
ew Jersey
Kansas
Rhod
e Island
Te
xasN
orth Dakota
Washing
tonA
rizonaA
laskaU
tahIllinoisIow
aW
isconsinO
regon
Minn
esotaN
ew M
exico
Idaho
Virginia
Nevad
aM
ontana
Pennsylva
niaM
aryland
Wyom
ingD
elaware
United
States
Michig
anS
outh C
arolinaN
ew H
ampshire
North C
arolin
aM
ississippiLo
uisianaG
eorgia
Missou
riO
hioA
labama
Indiana
Arkan
sasF
lorida
Te
nnessee
Kentu
ckyV
ermont
Oklah
oma
Ma
ine
West V
irginia
Haw
aii
Source: U.S. Census Bureau, PUMS (based on 2000 Census)

23
Increases in Enrollment by 2025 Based on Population Growth and Participation Rates by County
129
657
982
1,263
1,381
1,652
2,080
2,399
2,798
3,765
4,289
6,367
8,373
10,932
11,901
12,292
12,648
27,515
129
323
583
595
821
545
1,176
1,994
1,087
3,142
2,701
3,342
5,197
5,126
10,402
8,158
10,437
23,636
0 5,000 10,000 15,000 20,000 25,000 30,000
Southwestern College
Prescott College
Eastern Arizona College
Embry-Riddle
DeVry University
Coconino Community College
Grand Canyon
Northland Pioneer College
Cochise College
Mohave Community College
Arizona Western College
Yavapai College
Northern Arizona University
University of Phoenix
Pima Community College
Central Arizona College
University of Arizona
Arizona State University
Maricopa Community College
Increase in Fall Enrollment (Status Quo)
Increase in Fall Enrollment (Raising Participation Ratesin Poor-Performing Counties to State Average)
56,98890,210
24
Arizona Historically Has
Relied on In-Migration for
Much of Its Workforce
25
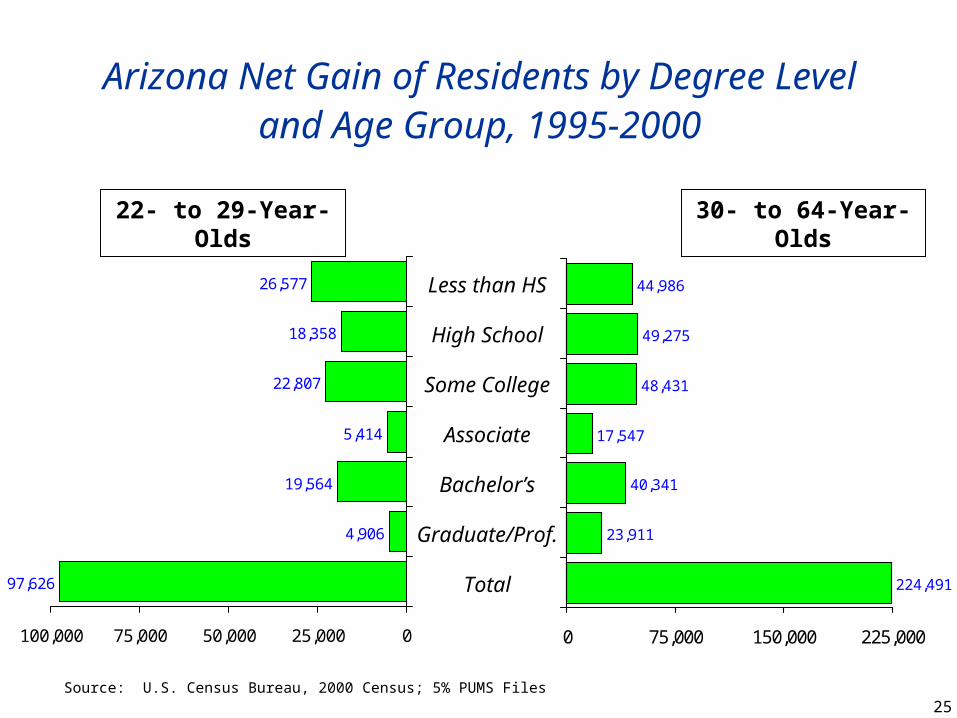
Arizona Net Gain of Residents by Degree Level and Age Group, 1995-2000
Source: U.S. Census Bureau, 2000 Census; 5% PUMS Files
22- to 29-Year-Olds 30- to 64-Year-Olds
224,491
23,911
40,341
17,547
48,431
49,275
44,986
0 75,000 150,000 225,000
97,626
4,906
19,564
5,414
22,807
18,358
26,577
025,00050,00075,000100,000
Less than HS
High School
Some College
Associate
Bachelor’s
Graduate/Prof.
Total

26
NCHEMS Analytical Framework (Draft)
Arizona in a National and International Context•Educational Attainment•Performance Within the Educational System•Population Characteristics`•Economic Competitiveness•Etc.
Race/Ethnic and Regional Differences Within the State
A Model that Will Take Into Account Potential Future Changes in:
•Population Growth•High School Graduation Rates•College-Going and Participation Rates•Persistence and Completion Rates•Closing Race/Ethnic Gaps•Closing Regional Gaps
The Cost Per FTE Student - "Business as Usual"
A Model that Will Estimate the Amount of Need-Based Grant Aid Needed to Ensure Affordability at the Public Institutions
Grounded Conceptually on the Principle that Students and Their Families, the Federal Government and the State Bear Primary Responsibility for Making College Affordable
Supply vs. Demand in Key High-Demand Occupations (Present and Future)
•Healthcare Occupations•Teaching•High Tech Occupations•(Regional Differences for the Above)
Educational Requirements and Degrees Needed to Meet Demand in and Expand the 12 "Industries of Opportunity"
The Variation in Which the Above Issues Apply Regionally
The Role and Ability of the Local Institutions in Addressing the Issues
The Relationship Between Local Institutions and Local Workforce Demand and Economic Development
Data and Information Project Activity Outcomes
Consensus on the Most Important Issues Facing the State
Creating a Framework for the Regional Meetings and the Final Report
A Planning Tool that Can Be Used for:•Assessing the Impact of Achieving a Variety of
Goals on Enrollment and Degree Production•Which Improvements Would Yield the Greatest
Impact •Costs Associated with Meeting Performance Goals•Cost Savings Associated with Improved Efficiency•Cost Savings Associated with Alternative Methods
of Delivery (e.g. 2+2, Distance Learning, etc.)
A Planning Tool for Estimating the Investment Needed from the State According to Shared Responsibility
To Gain a Better Sense of:•The Shortages In Key Occupations - the Gaps
Between Supply and Demand•Regional Differences - and the Institutions Positioned
to Address the Gaps•Degrees Needed to Expand Key Industries of
Opportunity
Garnering Consensus on the Key Issues Around the State
More Insight Into How Potential Strategies Should Play Out Regionally
Final Report•Highlighting the Findings from Above•Policy Options•Cost Implications
Comparative Data Analysis
Student Flow Simulation Model
Student Financial Aid Simulation
Model
Assessment of Workforce Needs
Regional Visits
27
Simulation Models
► Student Flow Model
► Enrollment Projection Model
► Occupation Projection Model

28
Student Flow Model—A Tool to Help Guide Policy Decisions
► High School Graduation► College-Going► Participation Rates of Non-Traditional Adults► First-Year Retention Rates► Transfer from Two- to Four-Year Institutions► Graduation Rates► Population Growth (Impacting All of the Above)
Policy Parameters
(continued)
29
Student Flow Model—A Tool to Help Guide Policy Decisions (continued)
► Change in Annual Enrollment
► Change in Certificates/Degrees Awarded
► Cost to State and Students—“Business as Usual”
Model Outputs
30
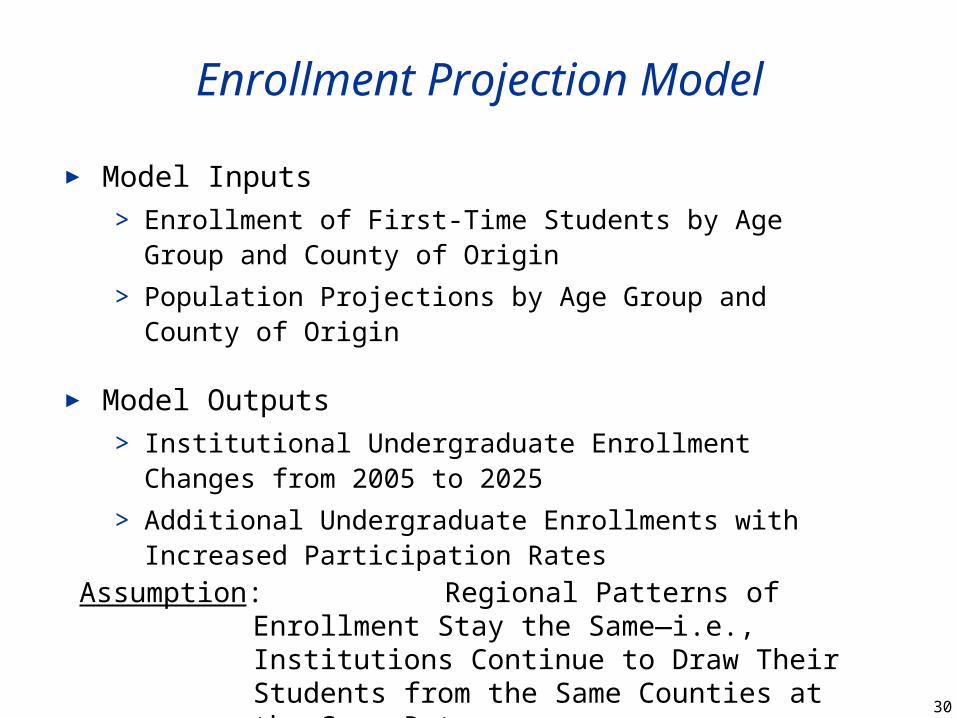
Enrollment Projection Model
► Model Inputs> Enrollment of First-Time Students by Age Group and County
of Origin
> Population Projections by Age Group and County of Origin
► Model Outputs> Institutional Undergraduate Enrollment Changes from 2005 to
2025
> Additional Undergraduate Enrollments with Increased Participation Rates
Assumption: Regional Patterns of Enrollment Stay the Same—i.e., Institutions Continue to Draw Their Students from the Same Counties at the Same Rates

31
Occupation Model—A Tool to Help Gauge Which Occupations Will Have the Greatest Shortages
► Projected Annual Openings by Occupation from 2000 to 2025 (Provided by DES)
► Current Annual Degree Production by the Fields Associated with Occupations Above—Carried Out to 2025 (Provided by NCES)
Model Inputs
(continued)

32
Occupation Model—A Tool to Help Gauge Which Occupations Will Have the Greatest Shortages (continued)
► Additional Workers Needed
► Additional Workers Needed (with College Degrees)
► Projected Annual Openings (Growth + Turnover)
► Projected Annual Surplus or Shortage (Degree Production, Fewer Openings)
► Impact of All of the Above on the 12 Industries of Opportunity
Model Outputs

33
Regional Forums

34
Building a State-Wide
Public Agenda
“SWOT”

35
Strengths
► Traction
► Governor’s Attention
► Culture of Change
36
Weaknesses
► Data System – availability to move quickly on technical issues
► Lack of an Established Public Entity to Lead a State-Wide Public Agenda Over Time
37
Opportunities
► Chartering “Unchartered Territory” – the chance to set a precedent for the nation
> Improving Performance of Certain Race/Ethnic Populations
> Creative Program Delivery
► Lack of an Established Public Entity that Has a Long-Established History of Doing the Wrong Things
38
Threats
► Sustainability
► Retreating Away from the Concept of “Collective Action”

39
Developing a Statewide
Accountability System