Objective · Web viewIt also understands the IP datagram format, so that it can extract the TCP...
20
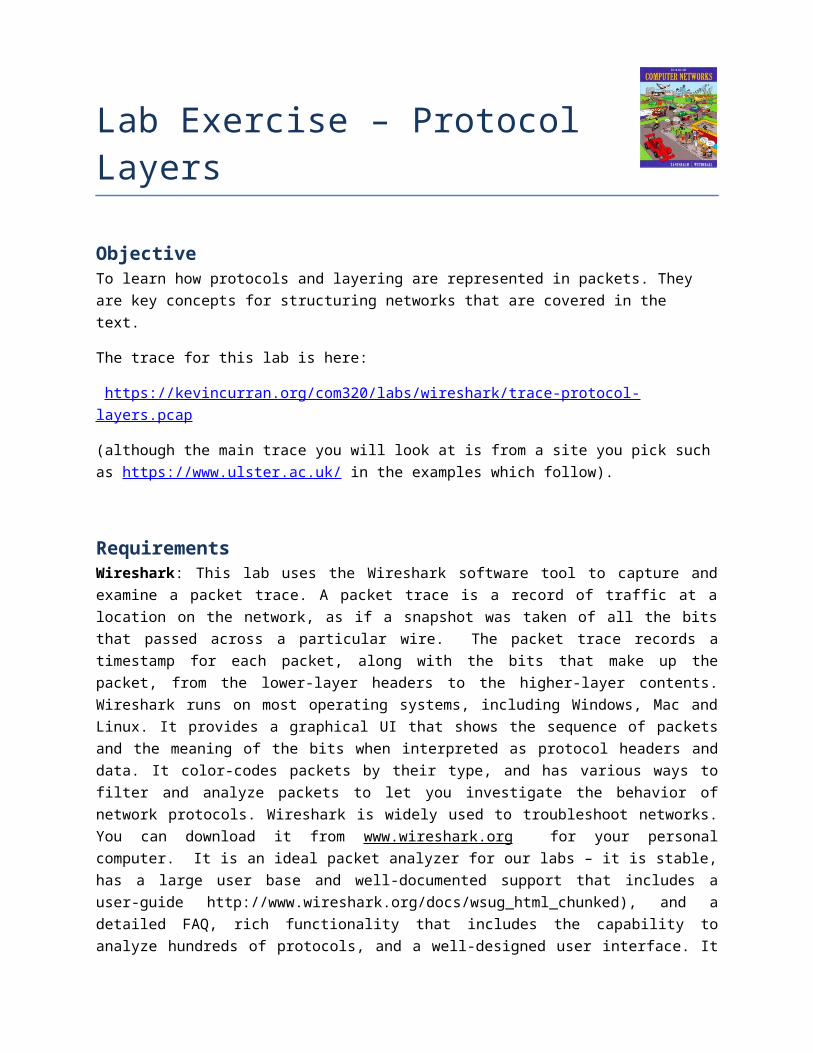
Lab Exercise – Protocol Layers Objective To learn how protocols and layering are represented in packets. They are key concepts for structuring networks that are covered in the text. The trace for this lab is here: https://kevincurran.org/com320/labs/wireshark/trace-protocol- layers.pcap (although the main trace you will look at is from a site you pick such as https://www.ulster.ac.uk/ in the examples which follow). Requirements Wireshark: This lab uses the Wireshark software tool to capture and examine a packet trace. A packet trace is a record of traffic at a location on the network, as if a snapshot was taken of all the bits that passed across a particular wire. The packet trace records a timestamp for each packet, along with the bits that make up the packet, from the lower-layer headers to the higher-layer contents. Wireshark runs on most operating systems, including Windows, Mac and Linux. It provides a graphical UI that shows the sequence of packets and the meaning of the bits when interpreted as protocol headers and data. It color-codes packets by their type, and has various ways to filter and analyze packets to let you investigate the behavior of network protocols. Wireshark is widely used to troubleshoot networks. You can download it from www.wireshark.org for your personal computer. It is an ideal packet analyzer for our labs – it is stable, has a large user base and well-documented support that includes a user-guide http://www.wireshark.org/docs/wsug_html_chunked), and a detailed FAQ, rich functionality that includes the capability to analyze hundreds of protocols, and a well-designed user interface. It
Transcript of Objective · Web viewIt also understands the IP datagram format, so that it can extract the TCP...
Lab Exercise – Protocol Layers
ObjectiveTo learn how protocols and layering are represented in packets. They are key concepts for structuring networks that are covered in the text.
The trace for this lab is here:
https://kevincurran.org/com320/labs/wireshark/trace-protocol-layers.pcap
(although the main trace you will look at is from a site you pick such as https://www.ulster.ac.uk/ in the examples which follow).
RequirementsWireshark: This lab uses the Wireshark software tool to capture and examine a packet trace. A packet trace is a record of traffic at a location on the network, as if a snapshot was taken of all the bits that passed across a particular wire. The packet trace records a timestamp for each packet, along with the bits that make up the packet, from the lower-layer headers to the higher-layer contents. Wireshark runs on most operating systems, including Windows, Mac and Linux. It provides a graphical UI that shows the sequence of packets and the meaning of the bits when interpreted as protocol headers and data. It color-codes packets by their type, and has various ways to filter and analyze packets to let you investi-gate the behavior of network protocols. Wireshark is widely used to troubleshoot networks. You can download it from www.wireshark.org for your personal computer. It is an ideal packet analyzer for our labs – it is stable, has a large user base and well-documented support that includes a user-guide http://www.wireshark.org/docs/wsug_html_chunked), and a detailed FAQ, rich functionality that includes the capability to analyze hundreds of protocols, and a well-designed user interface. It operates in computers using Ethernet, serial (PPP and SLIP), 802.11 wireless LANs, and many other link-layer technologies (if the OS on which it is running allows Wireshark to do so). It is already installed in the labs.
A quick help guide to Wireshark display filters is here: http://openmaniak.com/wireshark_filters.php
Wireshark is a core tool for any wireless ‘man in the middle’ or similar snooping attack. It is simply indis-pensable for those who wish to examine packets being transferred over a network – good or bad…..
Wireshark & Packet Sniffing Background
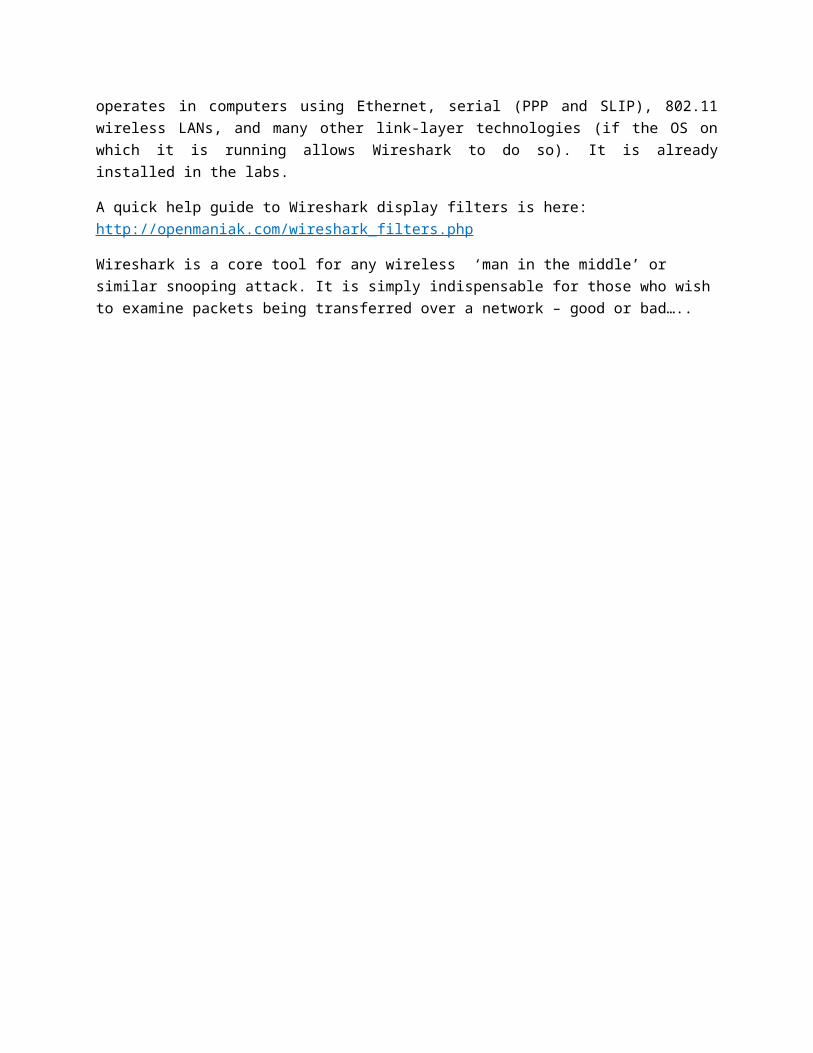
The basic tool for observing the messages exchanged between executing protocol entities is called a packet sniffer. As the name suggests, a packet sniffer captures (“sniffs”) messages being sent/received from/by your computer; it will also typically store and/or display the contents of the various protocol fields in these captured messages. A packet sniffer itself is passive. It observes messages being sent and received by applications and protocols running on your computer, but never sends packets itself. Simi-larly, received packets are never explicitly addressed to the packet sniffer. Instead, a packet sniffer re-ceives a copy of packets that are sent/received from/by application and protocols executing on your ma-chine.
Figure 1 shows the structure of a packet sniffer. At the right of Figure 1 are the protocols (in this case, In-ternet protocols) and applications (such as a web browser or ftp client) that normally run on your com-puter. The packet sniffer, shown within the dashed rectangle in Figure 1 is an addition to the usual soft-ware in your computer, and consists of two parts. The packet capture library receives a copy of every link-layer frame that is sent from or received by your computer. Messages exchanged by higher layer protocols such as HTTP, FTP, TCP, UDP, DNS, or IP all are eventually encapsulated in link-layer frames that are transmitted over physical media such as an Ethernet cable.
Figure 1: Packet Sniffer Structure
In Figure 1, the assumed physical media is an Ethernet, and so all upper-layer protocols are eventually encapsulated within an Ethernet frame. Capturing all link-layer frames thus gives you all messages sent/received from/by all protocols and applications executing in your computer.
The second component of a packet sniffer is the packet analyzer, which displays the contents of all fields within a protocol message. In order to do so, the packet analyzer must “understand” the structure of all messages exchanged by protocols. For example, suppose we are interested in displaying the various fields in messages exchanged by the HTTP protocol in Figure 1. The packet analyzer understands the for-mat of Ethernet frames, and so can identify the IP datagram within an Ethernet frame. It also under-stands the IP datagram format, so that it can extract the TCP segment within the IP datagram. Finally, it understands the TCP segment structure, so it can extract the HTTP message contained in the TCP seg-ment. Finally, it understands the HTTP protocol and so, for example, knows that the first bytes of an HTTP message will contain the string “GET,” “POST,” or “HEAD,”.
Step 1: Capture a Trace
1. Launching WiresharkYou can type Wireshark in the run box of main Windows start screen. Press the Windows key on the keyboard and type “wireshark”. If a problem launching it then see here1.
Figure 2: Wireshark in lab
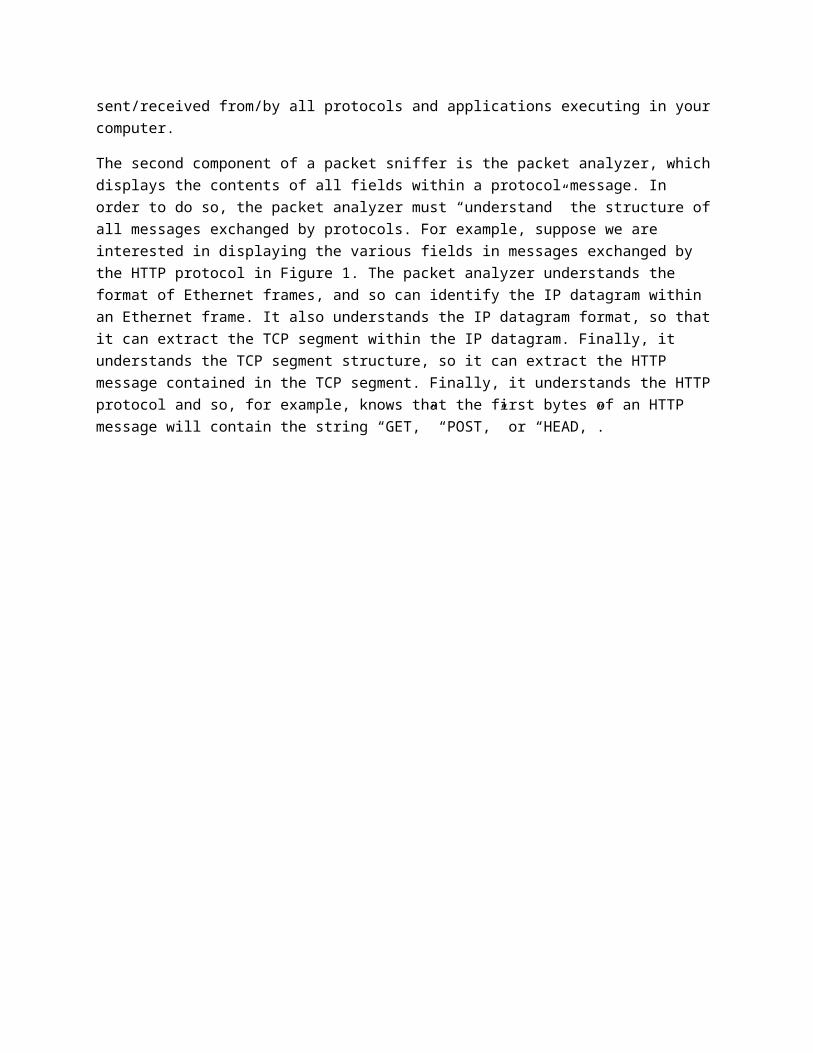
2. Just close the dialog box which prompts you to install a new version. You will then see a startup screen, as shown next.
Figure 3: Initial Wireshark Screen
3. Take a look at the left hand side of the screen – you’ll see an “Interface list”. This is the list of network interfaces on your computer. Choose Ethernet.
1 It should load but there can be a problem with the new lab configuration for Wireshark and npf driver. Therefore if this is not working…. then please do the next step. Launch Wireshark as follows. Click desktop icon on main windows screen & use the file explorer to browse to C:\local Disk (C)\Program Files\Wireshark. Finally, RIGHT CLICK on Wireshark as “Run as administrator”.
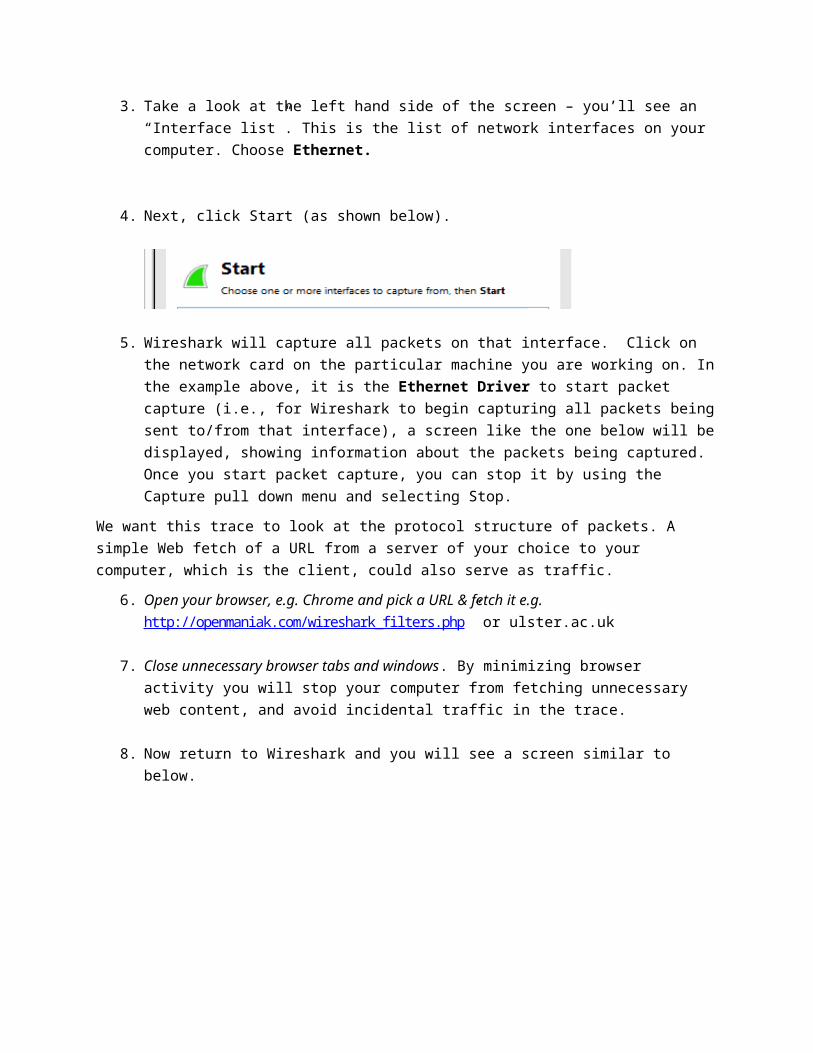
4. Next, click Start (as shown below).
5. Wireshark will capture all packets on that interface. Click on the network card on the particular machine you are working on. In the example above, it is the Ethernet Driver to start packet cap-ture (i.e., for Wireshark to begin capturing all packets being sent to/from that interface), a screen like the one below will be displayed, showing information about the packets being cap-tured. Once you start packet capture, you can stop it by using the Capture pull down menu and selecting Stop.
We want this trace to look at the protocol structure of packets. A simple Web fetch of a URL from a server of your choice to your computer, which is the client, could also serve as traffic.
6. Open your browser, e.g. Chrome and pick a URL & fetch it e.g. http://openmaniak.com/wireshark_filters.php” or ulster.ac.uk
7. Close unnecessary browser tabs and windows. By minimizing browser activity you will stop your computer from fetching unnecessary web content, and avoid incidental traffic in the trace.
8. Now return to Wireshark and you will see a screen similar to below.
That is all for now. Next you will read a little more about Wireshark and tracing packets.
Main Wireshark Interface
The Wireshark interface has five major components:
Figure 4: Wireshark Graphical User Interface, during packet capture and analysis
• The command menus are standard pull down menus located at the top of the window. The File menu allows you to save captured packet data or open a file containing previously captured packet data. The Capture menu allows you to begin packet capture.
• The packet-listing window displays a one-line summary for eachpacket capturedd, including the packet number (assigned by Wireshark; this is not a packet number contained in any protocol’s header), the time at which the packet was captured, the packet’s source and destination addresses, the protocol type, and protocol-specific information contained in the packet. The packet listing can be sorted accord-ing to any of these categories by clicking on a column name. The protocol type field lists the highest-level protocol that sent or received this packet, i.e., the protocol that is source or ultimate sink for this packet.
• The packet-header details window provides details about the packet selected (highlighted) in the packet-listing window. (To select a packet in the packet-listing window, place the cursor over the packet’s one-line summary in the packet-listing window and click with the left mouse button.). These de-tails include information about the Ethernet frame (assuming the packet was sent/received over an Eth-ernet interface) and IP datagram that contains this packet. The amount of Ethernet and IP-layer detail displayed can be expanded or minimized by clicking on the plus minus boxes to the left of the Ethernet frame or IP datagram line in the packet details window.
• The packet-contents window displays the entire contents of the captured frame, in both ASCII and hexadecimal format. Towards the top of the Wireshark graphical user interface, is the packet display fil-
ter field, into which a protocol name or other information can be entered in order to filter the informa-tion displayed in the packet-listing window.
Filtering Traffic
Now return to your Wireshark trace captured earlier. We will look to see how we can isolate the Web Page traffic from the other protocol packets.
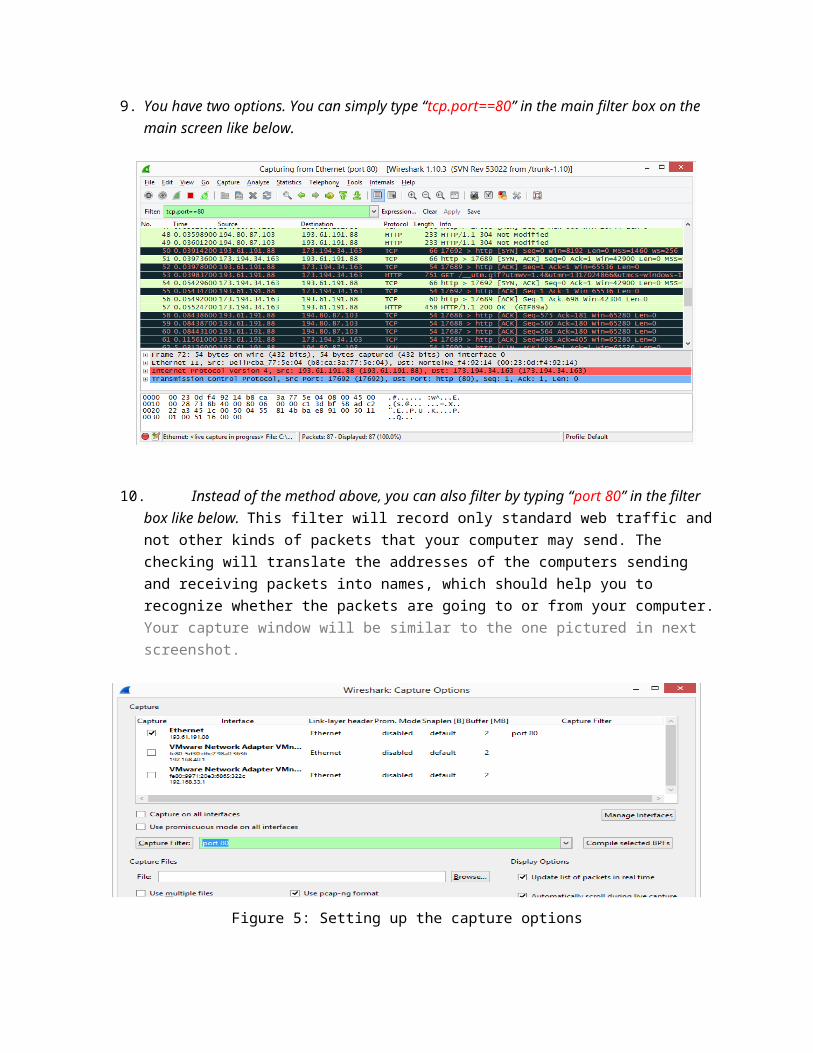
9. You have two options. You can simply type “tcp.port==80” in the main filter box on the main screen like below.
10. Instead of the method above, you can also filter by typing “port 80” in the filter box like below. This filter will record only standard web traffic and not other kinds of packets that your com-puter may send. The checking will translate the addresses of the computers sending and receiv-ing packets into names, which should help you to recognize whether the packets are going to or from your computer. Your capture window will be similar to the one pictured in next screen-shot.
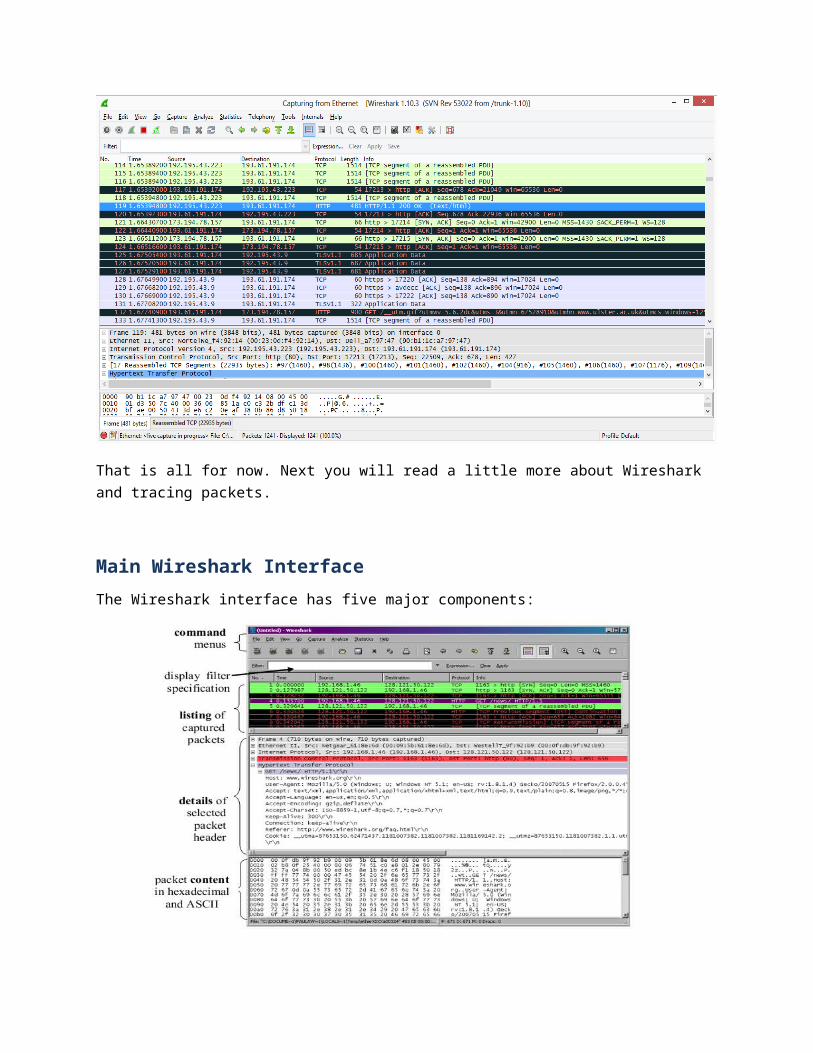
Figure 5: Setting up the capture options
11. When the capture is started, visit a site which uses http (not https). This time, the packets will be recorded by Wireshark as the content is transferred. Try again, http://openmaniak.com/wire-shark_filters.php in your browser.
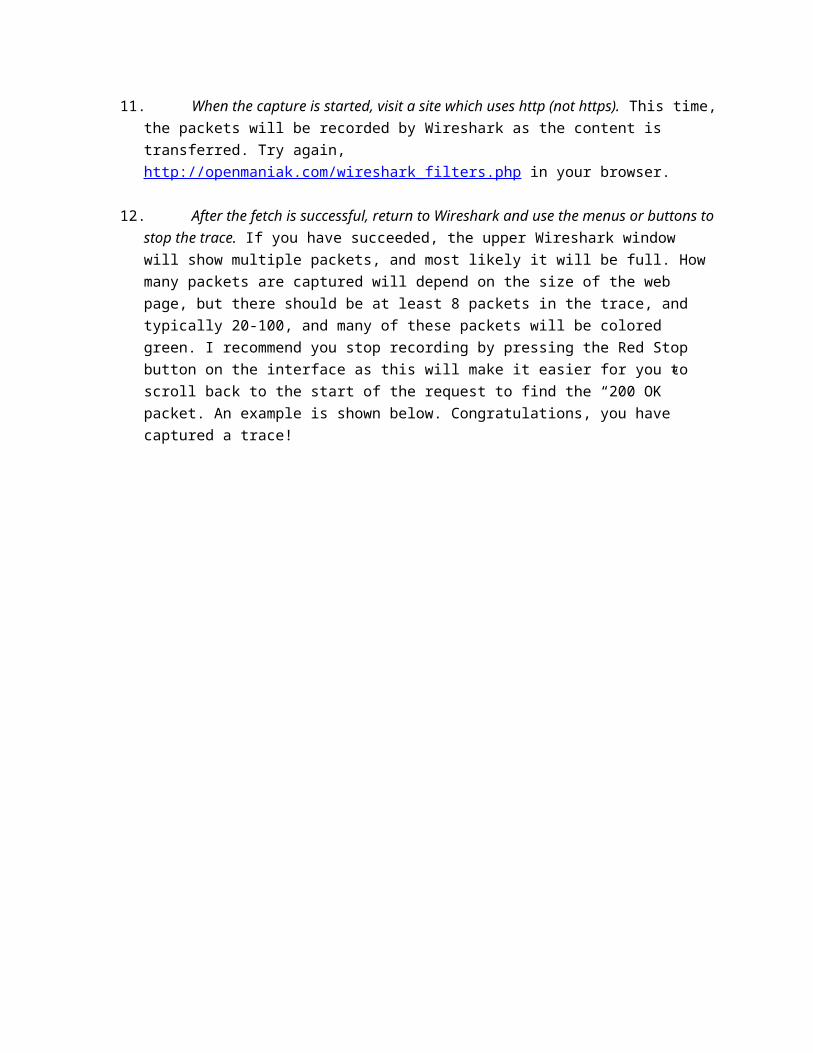
12. After the fetch is successful, return to Wireshark and use the menus or buttons to stop the trace. If you have succeeded, the upper Wireshark window will show multiple packets, and most likely it will be full. How many packets are captured will depend on the size of the web page, but there should be at least 8 packets in the trace, and typically 20-100, and many of these packets will be colored green. I recommend you stop recording by pressing the Red Stop button on the inter-face as this will make it easier for you to scroll back to the start of the request to find the “200 OK” packet. An example is shown below. Congratulations, you have captured a trace!
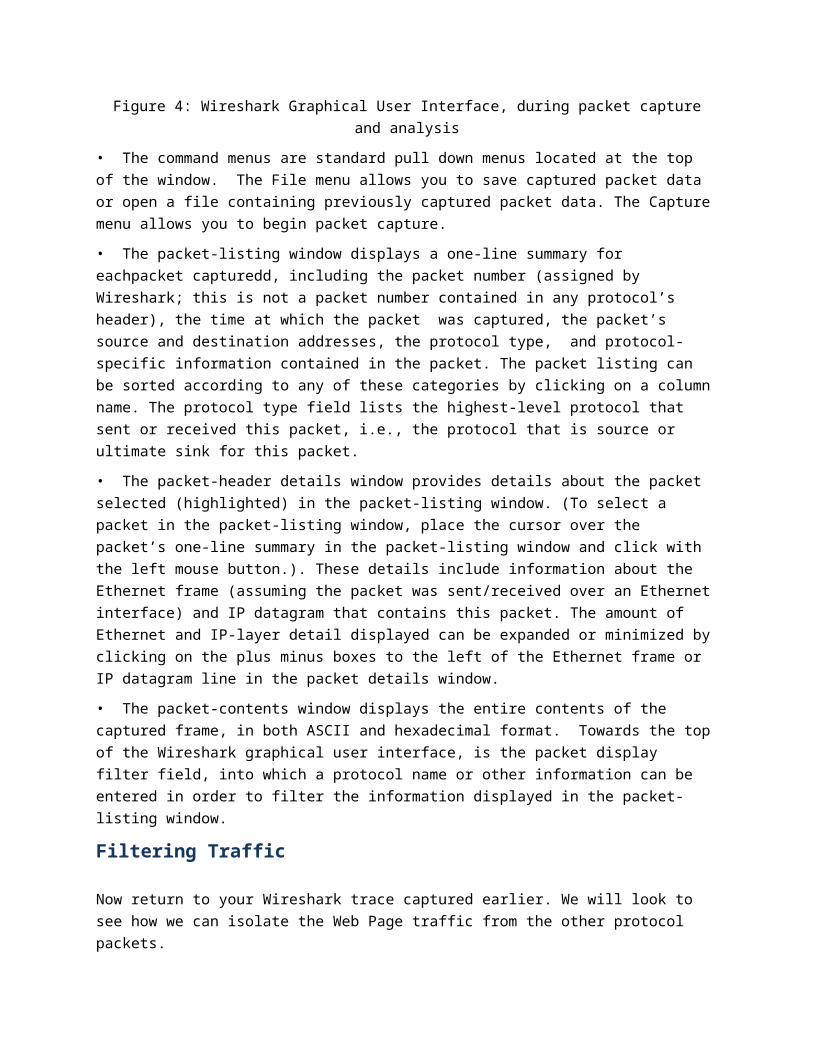
Figure 6: Packet trace of web browsing traffic
Step 2: Inspect the Trace
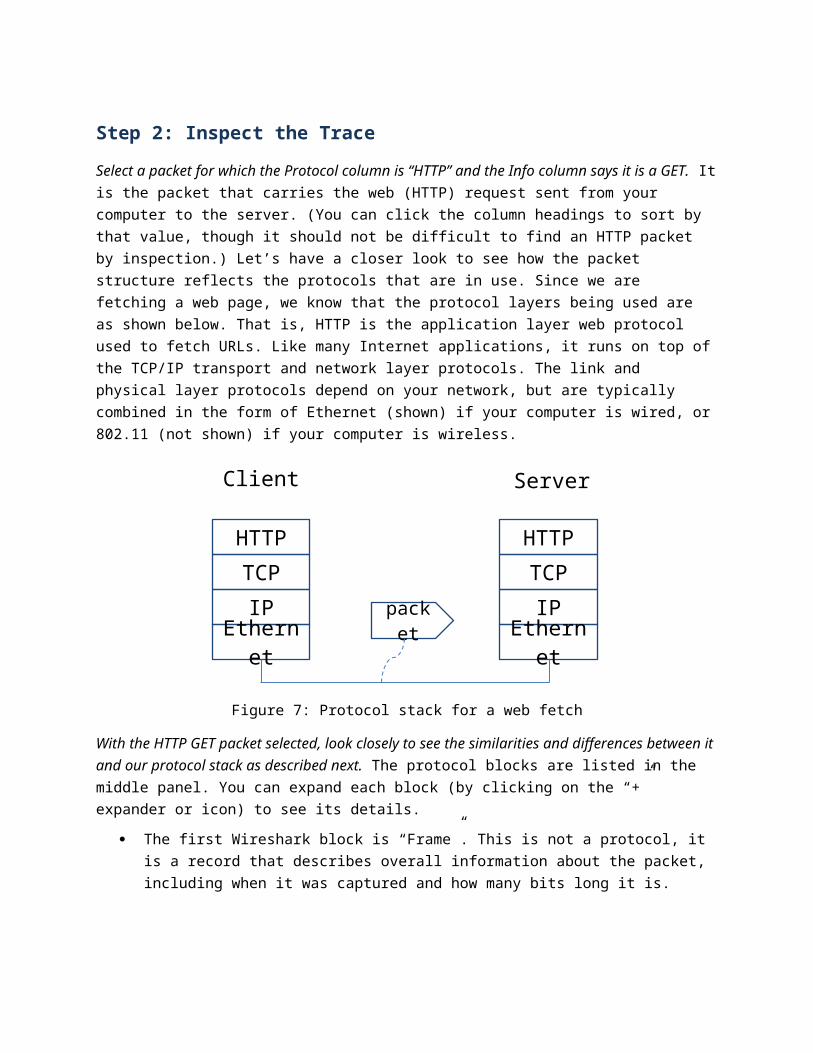
Select a packet for which the Protocol column is “HTTP” and the Info column says it is a GET. It is the packet that carries the web (HTTP) request sent from your computer to the server. (You can click the column headings to sort by that value, though it should not be difficult to find an HTTP packet by inspec-tion.) Let’s have a closer look to see how the packet structure reflects the protocols that are in use. Since we are fetching a web page, we know that the protocol layers being used are as shown below. That is, HTTP is the application layer web protocol used to fetch URLs. Like many Internet applications, it runs on top of the TCP/IP transport and network layer protocols. The link and physical layer protocols depend on your network, but are typically combined in the form of Ethernet (shown) if your computer is wired, or 802.11 (not shown) if your computer is wireless.
Figure 7: Protocol stack for a web fetch
With the HTTP GET packet selected, look closely to see the similarities and differences between it and our protocol stack as described next. The protocol blocks are listed in the middle panel. You can expand each block (by clicking on the “+” expander or icon) to see its details.
The first Wireshark block is “Frame”. This is not a protocol, it is a record that describes overall in-formation about the packet, including when it was captured and how many bits long it is.
The second block is “Ethernet”. Note that you may have taken a trace on a computer using 802.11 yet still see an Ethernet block instead of an 802.11 block. Why? It happens because we asked Wireshark to capture traffic in Ethernet format on the capture options, so it converted the real 802.11 header into a pseudo-Ethernet header.
Then come IP, TCP, and HTTP, which are just as we wanted. Note that the order is from the bot-tom of the protocol stack upwards. This is because as packets are passed down the stack, the header information of the lower layer protocol is added to the front of the information from the higher layer protocol, as in Fig. 1-15 of your text. That is, the lower layer protocols come first in the packet “on the wire”.
packetEthernet
IP
TCP
HTTP
ServerClient
Ethernet
IP
TCP
HTTP
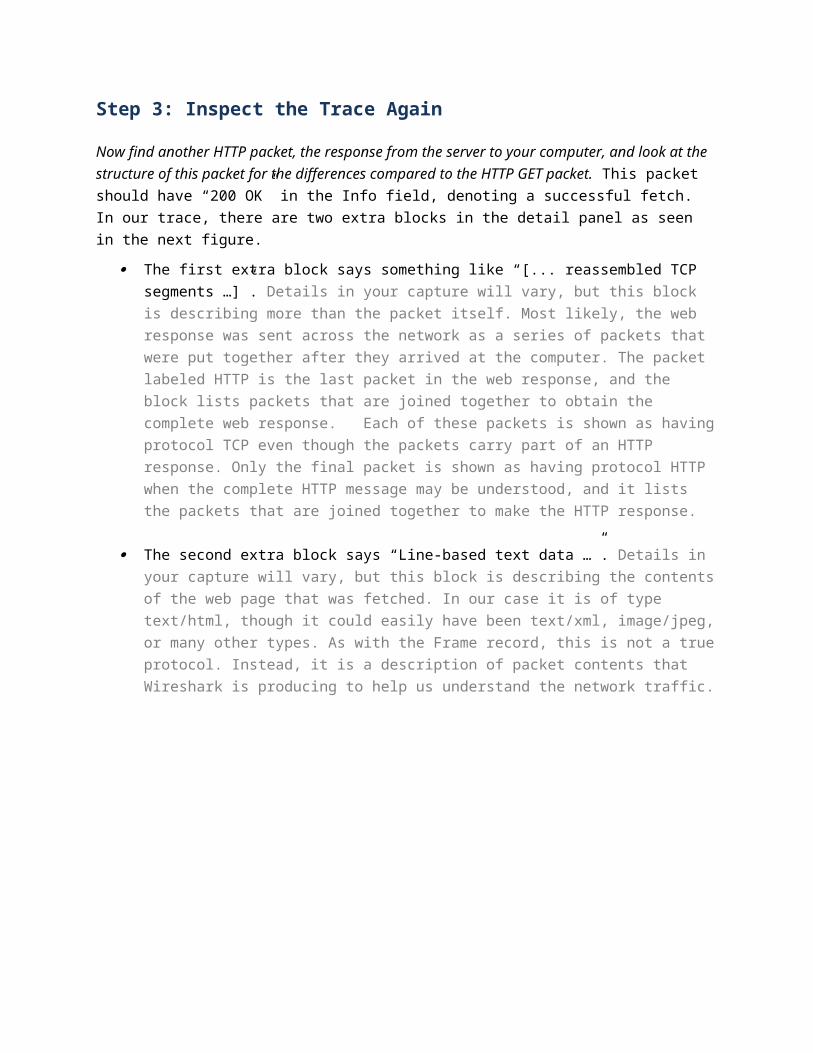
Step 3: Inspect the Trace Again
Now find another HTTP packet, the response from the server to your computer, and look at the structure of this packet for the differences compared to the HTTP GET packet. This packet should have “200 OK” in the Info field, denoting a successful fetch. In our trace, there are two extra blocks in the detail panel as seen in the next figure.
The first extra block says something like “[... reassembled TCP segments …]”. Details in your cap-ture will vary, but this block is describing more than the packet itself. Most likely, the web re-sponse was sent across the network as a series of packets that were put together after they ar-rived at the computer. The packet labeled HTTP is the last packet in the web response, and the block lists packets that are joined together to obtain the complete web response. Each of these packets is shown as having protocol TCP even though the packets carry part of an HTTP re-sponse. Only the final packet is shown as having protocol HTTP when the complete HTTP mes-sage may be understood, and it lists the packets that are joined together to make the HTTP re-sponse.
The second extra block says “Line-based text data …”. Details in your capture will vary, but this block is describing the contents of the web page that was fetched. In our case it is of type text/html, though it could easily have been text/xml, image/jpeg, or many other types. As with the Frame record, this is not a true protocol. Instead, it is a description of packet contents that Wire-shark is producing to help us understand the network traffic.
Figure 8: Inspecting a HTTP “200 OK” response
1. Locate the HTTP GET packet which has “200 OK (text/html)” in the Info field, denoting a successful fetch. See below for instance in the third line in white.
2. Scroll down in the middle pane to [+] Line-based text data: text/html and right click with your mouse. (See above)
3. From the context menu which now appears, select Copy - Bytes Printable Text Only You should see a window similar to the following popup window below.
4. This copies all the code for the Ulster home page.
5. Open up a text editor such as notepad++ and paste this HTML code into a new document. Save as TestDownloadedPage in a directory such as W: or downloads. Next open up explorer and scroll to where you have saved the file and open it in the default browser by clicking on it.
6. Note how much of that page actually gets sent over the wire to your PC.
Step 4: Packet Structure
Examine a HTTP GET packet that shows the position and size in bytes of the TCP, IP and Ethernet proto-col headers. Note the range of the Ethernet header and the Ethernet payload that IP passes to Ethernet to send over the network. Note also the range of the IP header and the IP payload.
To work out sizes, observe that when you click on a protocol block in the middle panel (the block itself, not the “+” expander) then Wireshark will highlight the bytes it corresponds to in the packet in the lower panel and display the length at the bottom of the window. For instance, clicking on the IP version 4 header of a packet in our trace shows us that the length is 20 bytes. (Your trace will be different if it is IPv6, and may be different even with IPv4 depend-ing on various options.) You may also use the overall packet size shown in the Length column or Frame detail block.
Answer
Figure 9: Protocol layer structure of the HTTP GET packet
There are several features to note:
The order of the headers (Ethernet, IP, TCP, HTTP) is the protocol stack from the bottom up-wards because the lower layers are outermost in the packet as it travels through the network.
Observant students will note some differences between the Ethernet header size in Wireshark and in the text that will be explored in later labs.
The size of the IP and TCP headers is normally around 20 bytes each, but it may be larger in some cases depending on the OS, e.g., IPv6 instead of IPv4 and optional TCP header fields might double these numbers.
The size of the HTTP message will vary depending on what tool and URL is used to send the web request. For wget/curl, it is likely to be around 100-300 bytes.
The Ethernet payload comprises everything beyond the Ethernet header. That is, Ethernet does not understand the IP / TCP / HTTP internal structure; it is up to higher layers to determine their headers and message boundaries.
IP payloadIP header
Start of packet
166 bytestotal
Ethernet payloadEthernet header
112 bytes20 bytes20 bytes14 bytes
TCPIPEthernet HTTP
Similarly, the IP payload comprises everything beyond the IP header. Note that neither the IP header nor payload covers the Ethernet header.
Step 5: Demultiplexing Keys
When an Ethernet frame arrives at a computer, the Ethernet layer must hand the packet that it contains to the next higher layer to be processed. The act of finding the right higher layer to process received packets is called demultiplexing. We know that in our case the higher layer is IP. But how does the Ether-net protocol know this? After all, the higher-layer could have been another protocol entirely (such as ARP). We have the same issue at the IP layer – IP must be able to determine that the contents of IP mes-sage is a TCP packet so that it can hand it to the TCP protocol to process. The answer is that protocols use information in their header known as a “demultiplexing key” to determine the higher layer.
Look at the Ethernet and IP headers of a download packet in detail to answer the following questions:
1. Which Ethernet header field is the demultiplexing key that tells it the next higher layer is IP? What value is used in this field to indicate “IP”?
Answer. The demultiplexing key for Ethernet is the Type field. It holds 0x800 when the higher layer is IP.
2. Which IP header field is the demultiplexing key that tells it the next higher layer is TCP? What value is used in this field to indicate “TCP”?
Answer: The demultiplexing key for IP is the Protocol field. It has value 6 when the higher layer is TCP.