Objective Regionalisation of Tamil Nadu, a Southern … rainfall during NEM season. ABSTRACT The...
10
113 Wales based on the daily rainfall data. Barring (1987) applied common factor analysis for the regionalisation of daily rainfall of Kenya. White et al (1991) made use of cluster analysis and different rotation algorithms to monthly Pennsylvanian pre- cipitation data while Bonell and Sumner (1992) used cluster analysis and obliquely rotated Principal Com- ponent Analysis (PCA) for the daily precipitation in Wales. Fovell and Fovell (1993) identified the cli- matic zones and sub zones of the conterminous United States from monthly temperatures and pre- cipitation after clustering the orthogonally rotated principal components. Also objective regionalisation was done by Sumner et al (1993) for Mallorea, Periago et al (1991) for Catalonia and Romero et al (1999) for whole of Spain. Therefore, arriving an objective regional division shall be more meaning- ful and can be explained with reasoning. Further such objective analysis will facilitate forecasting in a more meaningful way. Identifying basic rainfall regions of Tamil Nadu objectively, therefore, may explain the sub regional characteristics of the distribution. In other words, the identification of the 29 districts of Tamil Nadu into fewer objective rainfall regions can serve for practical administrative purposes. This type of regionalisation has potential use in providing a regional short, medium and long range forecasting of rainfall during NEM season. ABSTRACT The daily rainfall of 29 districts of Tamil Nadu during northeast monsoon is used for principal component analysis. Out of 29 districts, 22 districts are grouped into five homogenous Sub-regions which are having stronger relationship with five Varimax rotated principal components and the 7 districts are found with weak / moderate relations to any of the Principal components. Tamil Nadu is regionalised in to five Sub-regions based on strong relationship with first 5 PCs; Sub- region 1 comprises of districts Cuddalore, Perambalur, Pudukottai, Thanjavur, Thiruvarur and Nagapattinam. The Interior districts Madurai, Sivaganga, Virudhunagar and Dindugul make sub- region II. The districts Dharmapuri, Salem, Namakkal, Karur, Erode, Nilgiris and Coimbatore make Sub-region III and the districts Chennai, Kanchipuram, Vellore and Thiruvallur form Sub- region IV. The group of districts Tirunelveli, Thoothukudi and Kanyakumari make Sub-region V. Keywords: Principal component analysis, sub-regions, northeast monsoon, climate variables. R. Asokan 1 and N. Sivagnanam 2 1 Regional Meteorological Centre, Chennai 2 (Retd.), Department of Geography University of Madras, Chennai E-mail: [email protected] 1. Introduction Tamil Nadu is one of the southernmost states of India The proximity of sea influences the climate of eastern and southern part of Tamil Nadu whereas hilly orography and distance from the sea play an important role over rest of the State. The topography and proximity to sea influences the rainfall distribution of Tamil Nadu and the state provides an interesting area for studies of spatial variability of rainfall. As per convention followed by India Meteorological Department at Chennai, Tamil Nadu is divided into four sub regions mainly based on their proximity to coast and their geographical location for the purpose of regional level forecasting of weather over Tamil Nadu (Fig.1). They are namely, (1) North Coastal Tamil Nadu (NCTN), (2) South Coastal Tamil Nadu (SCTN), (3) North Interior Tamil Nadu (NITN) and (4) South Interior Tamil Nadu (SITN). It may be noted that objective regionalisation concept is not a factor for the classification of the administrative districts. Objective regionalisation based on different cli- mate variables like temperature and rainfall is the basis for dividing the large areas into many sub re- gions. This regionalisation can be obtained by us- ing different methods, ranging from elementary link- age analysis to more complex multivariate statisti- cal techniques like factor analysis, cluster analy- sis, corresponding analysis, etc. Sumner and Bonell (1990) used linkage analysis regionalisation of Objective Regionalisation of Tamil Nadu, a Southern State of India based on Principal Component Analysis
-
Upload
vuongxuyen -
Category
Documents
-
view
215 -
download
0
Transcript of Objective Regionalisation of Tamil Nadu, a Southern … rainfall during NEM season. ABSTRACT The...

113
Wales based on the daily rainfall data. Barring (1987)applied common factor analysis for theregionalisation of daily rainfall of Kenya. White et al(1991) made use of cluster analysis and differentrotation algorithms to monthly Pennsylvanian pre-cipitation data while Bonell and Sumner (1992) usedcluster analysis and obliquely rotated Principal Com-ponent Analysis (PCA) for the daily precipitation inWales. Fovell and Fovell (1993) identified the cli-matic zones and sub zones of the conterminousUnited States from monthly temperatures and pre-cipitation after clustering the orthogonally rotatedprincipal components. Also objective regionalisationwas done by Sumner et al (1993) for Mallorea,Periago et al (1991) for Catalonia and Romero et al(1999) for whole of Spain. Therefore, arriving anobjective regional division shall be more meaning-ful and can be explained with reasoning. Furthersuch objective analysis will facilitate forecasting ina more meaningful way.
Identifying basic rainfall regions of Tamil Naduobjectively, therefore, may explain the sub regionalcharacteristics of the distribution. In other words,the identification of the 29 districts of Tamil Naduinto fewer objective rainfall regions can serve forpractical administrative purposes. This type ofregionalisation has potential use in providing aregional short, medium and long range forecastingof rainfall during NEM season.
ABSTRACT
The daily rainfall of 29 districts of Tamil Nadu during northeast monsoon is used for principalcomponent analysis. Out of 29 districts, 22 districts are grouped into five homogenous Sub-regionswhich are having stronger relationship with five Varimax rotated principal components and the7 districts are found with weak / moderate relations to any of the Principal components. TamilNadu is regionalised in to five Sub-regions based on strong relationship with first 5 PCs; Sub-region 1 comprises of districts Cuddalore, Perambalur, Pudukottai, Thanjavur, Thiruvarur andNagapattinam. The Interior districts Madurai, Sivaganga, Virudhunagar and Dindugul make sub-region II. The districts Dharmapuri, Salem, Namakkal, Karur, Erode, Nilgiris and Coimbatoremake Sub-region III and the districts Chennai, Kanchipuram, Vellore and Thiruvallur form Sub-region IV. The group of districts Tirunelveli, Thoothukudi and Kanyakumari make Sub-region V.
Keywords: Principal component analysis, sub-regions, northeast monsoon, climate variables.
R. Asokan1 and N. Sivagnanam2
1Regional Meteorological Centre, Chennai2(Retd.), Department of Geography
University of Madras, ChennaiE-mail: [email protected]
1. IntroductionTamil Nadu is one of the southernmost states
of India The proximity of sea influences the climateof eastern and southern part of Tamil Nadu whereashilly orography and distance from the sea play animportant role over rest of the State. The topographyand proximity to sea influences the rainfalldistribution of Tamil Nadu and the state providesan interesting area for studies of spatial variabilityof rainfall. As per convention followed by IndiaMeteorological Department at Chennai, Tamil Naduis divided into four sub regions mainly based ontheir proximity to coast and their geographicallocation for the purpose of regional level forecastingof weather over Tamil Nadu (Fig.1). They arenamely, (1) North Coastal Tamil Nadu (NCTN), (2)South Coastal Tamil Nadu (SCTN), (3) NorthInterior Tamil Nadu (NITN) and (4) South InteriorTamil Nadu (SITN). It may be noted that objectiveregionalisation concept is not a factor for theclassification of the administrative districts.
Objective regionalisation based on different cli-mate variables like temperature and rainfall is thebasis for dividing the large areas into many sub re-gions. This regionalisation can be obtained by us-ing different methods, ranging from elementary link-age analysis to more complex multivariate statisti-cal techniques like factor analysis, cluster analy-sis, corresponding analysis, etc. Sumner and Bonell(1990) used linkage analysis regionalisation of
Objective Regionalisation ofTamil Nadu, a Southern State ofIndia based on PrincipalComponent Analysis

114
Fig.1 29 districts and four sub-regions of Tamil Nadu.
2. Data and MethodologyThe daily rainfall data of 173 rain gauge stations
of Tamil Nadu during the main rainy season namelynortheast monsoon season (1st October to 31stDecember) for the period from 1965 to 1996 is used.The rain gauge stations are spatially well distributedin the state and there is no spatial bias in the dataset. Based on this data, the daily rainfall data of the29 districts of Tamil Nadu during northeast monsoonseason for the period of 31 years (1965 to 1996) isconstructed. The daily rainfall series is a completetime series. Here S- mode Principal componentanalysis (PCA) is carried out taking 29 districts asvariables and 2852 days rainfall as cases to providean objective pluviometric regionalisation of TamilNadu.
Since the casual mechanisms of precipitationare fuzzy and overlapping, the regionalisation basedon unrotated PCs will have overlapping areas. Forthis reason, assuming the rotation can producesimple structures (as in Gong and Richman, 1995),rotation of PCs has been attempted. The rotationof components wants to simplify the interpretationof the derived variables and to optimise by a criterionto obtain a 'simple structure'. If the division of a
region into fairly homogeneous areas is required,the rotated PCs will almost inevitably do it betterthan unrotated PCs (Jolliffe, 1987). Since theloadings of various PCs depend upon the numberof PCs retained for rotation, several criteria basedon dominant variance rule are suggested by variousauthors for deciding how many PCs to be retained.
Kaiser criterion (Kaiser, 1958), Scree test(Cattle, 1996) & Log-Eigen value (LEV) diagram(Craddock et al, 1969), Preisendorfer's rule 'N' aregenerally used as methods to decide the numberPCs to be retained for rotation. Kaiser criterion saysthat the factors with Eigen values having greaterthan one are to be retained for rotation. Figure 2(a)is the Scree plot and 2(b) is LEV diagram. The goalhere is to identify the break in slope or a cut off inthe difference between successive PCs in the plot.The method of Preisendorfer's rule N (Preisendorferet al (1981), Wilks (1995)) identifies the largestnumber of principal components to be involved onthe basis of resampling tests involving thedistribution of Eigen values of randomly generateddispersion matrices. The first method suggests 5PCs for rotation but other three methods suggest 4PCs for rotation. Here in this study, the first 5 PCsare retained for rotation as per Kaiser's criterion.Generally Varimax (orthogonal) (Richman, 1986,1987), Quart imax (orthogonal), Equamax(orthogonal) and Oblimin (oblique) (Richman, 1981)rotation methods are used for rotation of PCs. Herein this study, Varimax rotation IS used to find outmost interpretable simple structure of PC loadings.
Fig.2(a) Scree diagram.
Fig.2(b) Log- Eigen value (LEV) diagram.
115
3. Results and Discussion3.1 Variance explained by Principal
ComponentsTable 1 shows the Eigen values and the
corresponding variance explained by each PC withthe cumulative percentage of total variance. Thecomponent loadings are the correlation coefficientsbetween the variables and components analogousto Pearson's correlation coefficient 'r'. The squaredcomponent loadings are the percentage of variancein that variable explained by the component. To getthe percentage of variance in all the variables
accounted for by each component, add the sum ofthe squared factor loadings for that component anddivide by the number of variables. Here the first 10principal components are sufficient for explaining85% of total variance while first 14 and 20 principalcomponents are needed to explain 90% and 95%of total variances respectively. The first five PCsexplained about 73% of total variance. In this studyfirst five components are chosen for interpretationand further analysis, as it is often customary torestrict the choice of Eigen values higher than orequal to 1.0 only.
TABLE 1Variance and cumulative variance explained by first 10 PCs based on 2852X29 matrix.
PC Numbers Eigen value Cumulative Variance (%) Cumulative % ofEigen value Total variance.
01 12.43 12.43 42.88 42.8802 3.21 14.24 11.07 53.9503 2.59 18.23 8.93 62.9504 2.17 20.40 7.51 70.3905 1.00 21.40 3.46 73.8506 0.73 22.13 2.52 76.3607 0.72 22.85 2.47 78.8308 0.65 23.50 2.26 81.0909 0.56 24.06 1.94 83.0310 0.50 24.56 1.73 84.77
Fig .3bFig .3a

116
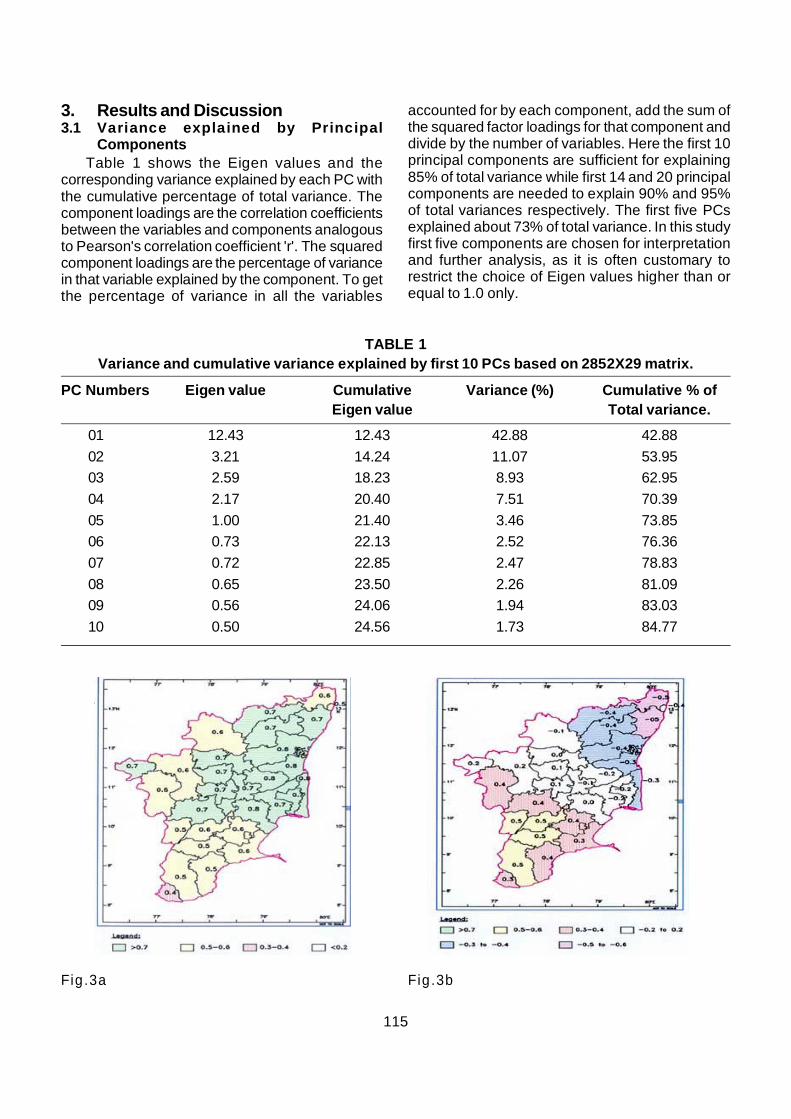
3.2 Unrotated Principal Components.The factor loadings of first 5 PCs are shown in
Fig.3. The raw or unrotated component I (varianceexplained 43%) has positive loadings in all districts.This means that all districts are positively correlatedwith PC I. This PC indicates that first source ofvariance in the data is associated with the overallmagnitude of rainfall events in the region as a whole.In the table, factor loadings greater than 0.7 arefound in central coastal districts along with Dinduguland in some north interior districts. PC II (varianceexplained 11%) has positive loadings of more than0.3 in south TN and negative loading of less than -0.3 in north coastal and neighbouring north interiordistricts. PC III (variance explained about 9%) haspositive loadings (more than 0.3) in central coastaldistricts and in south coastal districts. Negativeloadings (less than -0.3) are found over northwestTamil Nadu. PC IV (variance explained is about8%) has positive loadings of more than 0.3 inCauvary basin region and adjoining districts whilenortheast Tamil Nadu have negative loading of lessthan -0.3. PC V (variance explained is about 3.5%)has positive loading of more than 0.3 in southerntip of Tamil Nadu while Madurai have negativeloadings less than -0.3.
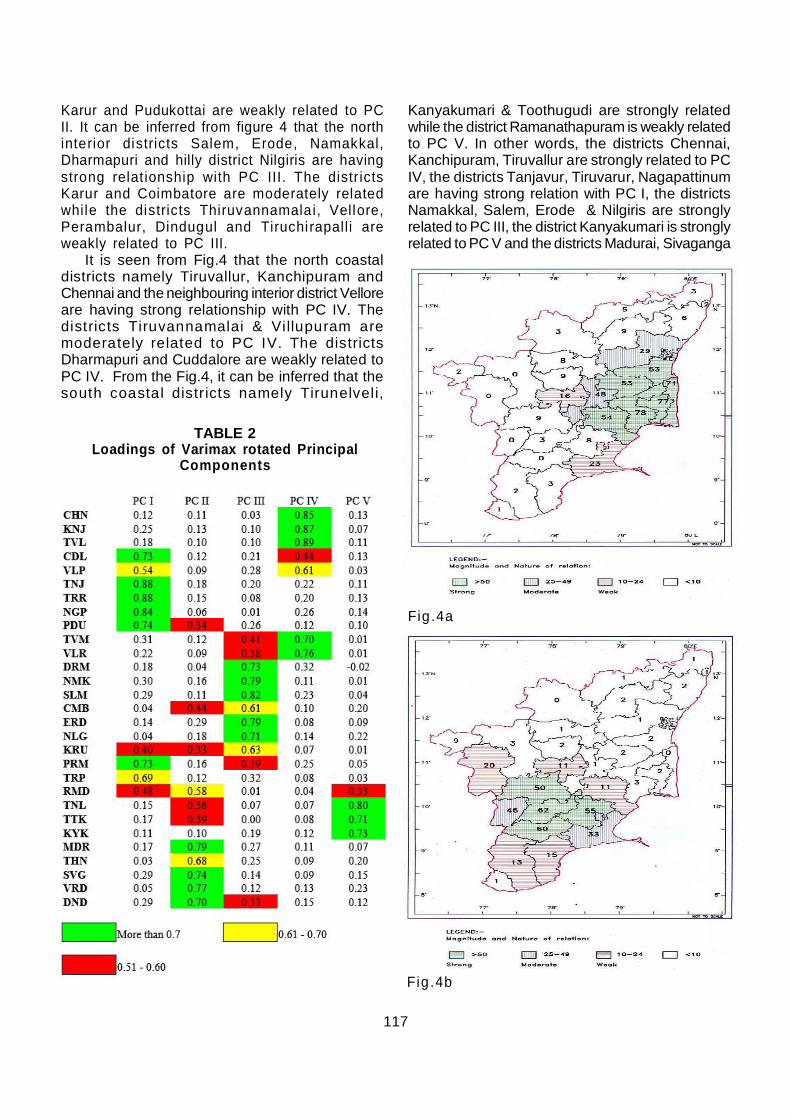
3.3 Varimax rotated Principal Components A Varimax solution yields results, which make
it as easy as possible to identify each variable witha single component. This is the most commonrotation option. Varimax rotation is done keepingthe first 5 Principal components for rotation and thefactor loadings of the five rotated PCs arecalculated. The coefficients of determinationexpressed in percentage are shown in Fig. 4(a -e). The component loadings of Varimax rotation aregiven in Table 2.
From the Fig.4, it is seen that the centralcoastal dis tricts of Tanjavur, Tiruvarur,Nagapattinum, Pudukottai, Cuddalore and theneighbouring district Perambalur are stronglyrelated to PC I. The districts Tiruchirapalli andVillupuram are moderately related and Karur& Ramanathapuram are weakly related to PCI. The other districts are having insignificantrelationship with PC I. It can be seen from thefigure 4 that the four south interior distr ictsnamely Madurai, Sivaganga, Virudhunagarand Dindugul are having strong relationshipwith PC II. The districts Ramanathapuram andTheni are moderately related to PC II and thedistricts Coimbatore, Toothugudi, Tirunelveli,
Fig.3 Loadings of unrotated Principal Components(a) PC-I (b) PC-II (b)PC-III (d) PC-IV(e) PC-V.
(c)
(d)
(e)
117
Karur and Pudukottai are weakly related to PCII. It can be inferred from figure 4 that the northinterior districts Salem, Erode, Namakkal,Dharmapuri and hilly district Nilgiris are havingstrong relat ionship with PC III. The distr ictsKarur and Coimbatore are moderately relatedwhile the districts Thiruvannamalai, Vellore,Perambalur, Dindugul and Tiruchirapall i areweakly related to PC III.
It is seen from Fig.4 that the north coastaldistricts namely Tiruvallur, Kanchipuram andChennai and the neighbouring interior district Velloreare having strong relationship with PC IV. Thedistricts Tiruvannamalai & Villupuram aremoderately related to PC IV. The districtsDharmapuri and Cuddalore are weakly related toPC IV. From the Fig.4, it can be inferred that thesouth coastal districts namely Tirunelveli,
Kanyakumari & Toothugudi are strongly relatedwhile the district Ramanathapuram is weakly relatedto PC V. In other words, the districts Chennai,Kanchipuram, Tiruvallur are strongly related to PCIV, the districts Tanjavur, Tiruvarur, Nagapattinumare having strong relation with PC I, the districtsNamakkal, Salem, Erode & Nilgiris are stronglyrelated to PC III, the district Kanyakumari is stronglyrelated to PC V and the districts Madurai, Sivaganga
TABLE 2Loadings of Varimax rotated Principal
Components
Fig .4a
Fig .4b

118
relation with PC IV. The Tiruvannamalai district ishaving moderate relationship with PC IV and weakrelationship with PC III while the Vellore district ishaving strong relationship with PC IV and a weakrelationship with PC III. The Dharmapuri district ishaving a strong relation with PC III and a weakrelation with PC IV. The Coimbatore district is havinga moderate relation with PC III and a weak relationwith PC II. The district Perambalur is stronglyrelated to PC I and weakly related to PC III whileTiruchirapalli is moderately related to PC I andweakly related to PC III. The districts Tirunelveli &Toothugudi are strongly related to PC IV and weaklyrelated to PC II. The Dindugul district is stronglyrelated to PC II and weakly related to PC III. TheRamanathapuram district is having a moderaterelation with PC II and weak relation with PC I andPC V while the Karur district is having moderaterelation with PC III and weak relation with PC I andPC II. By Varimax rotation it is found that thedistricts Villupuram, Tiruvannamalai, Tiruchirapalli,Ramanathapuram, Coimbatore, Karur and Theni(table 3) do not have strong relations with any ofthe PCs. These districts are unclassified districts.They may be grouped in to a region called afragmented rainfall region.
Fig.4c
& Virudhunagar are strongly related to PC II. Thedistrict Theni is moderately related to PC IV. Thedistrict Cuddalore is having a strong relationshipwith PC I and is having a weak relationship withPC IV.
The district Villupuram is moderately related toPC I & PC IV. The Pudukottai district is having astrong relationship with PC I and is having a weak
Fig .4e
Fig.4Loadings of Varimax rotated Principalcomponents (a) PC-I (b) PC-II (c) PC-III (d)PC-IV (e) PC-V.
Fig .4d

119
4 . Regionalisation of NEMRSince Varimax rotation is better to interpret the
22 districts into group of 5 regions, the results ofVarimax rotation is used for regionalisation of TamilNadu. Based on the strong relationship of thedistricts with five principal components, Tamil Naduis split into five homogeneous sub regions (Fig.5).However it is found that some of the districts arefound with the high loading in factor 6 but they arespatially non contiguous. Table 3 and 4 gives themean, SD, minimum and maximum rainfall in themonth of October, November, December andNortheast monsoon season.
4.1 Sub-region I : Central coastal regionThe region I comprises of Cuddalore, Tanjavur,
Tiruvarur, Nagapattinum, Pudukottai andPerambalur districts. Except Perambalur all thedistricts are located over Central coastal TamilNadu. Hence this region may be called as ‘CentralCoastal region or Cauvary delta basin’. This regioncovers an area of 20,615 sq. km. There are 34 raingauges out of 173 rain gauge stations in this regionand the average height of the rain gauges is 55mamsl. This region receives a mean rainfall of 201.1mm, 259.7 mm, 157mm and 613.5mm with standard
TABLE 4Mean, SD, minimum and maximum rainfall of 5 regions in the month of December
and during NEMRDecember NEMR
Mean SD Min Max Mean SD Min Max
Reg. 1 157.0 130.7 0.3 664.8 613.5 210.0 172.0 1149.8Reg. 2 67.8 57.9 0.2 232.7 423.2 121.2 178.2 734.4Reg. 3 39.1 41.0 0.0 225.4 316.7 108.0 84.4 616.6Reg. 4 97.6 109.0 0.0 569.8 533.1 200.5 106.2 1212.2Reg. 5 89.8 76.2 0.4 379.7 469.7 154.5 157.8 931.8
TABLE 3Mean, SD, minimum and maximum rainfall of 5 regions in the month of October and November.
October NovemberMean SD Min Max Mean SD Min Max
Reg. 1 201.1 96.2 46.2 587.7 259.7 148.8 28.1 856.5Reg. 2 192.8 69.3 64.0 433.2 162.3 87.3 10.4 490.8Reg. 3 170.7 68.7 41.2 381.8 107.3 68.0 5.2 271.0Reg. 4 207.5 110.2 10.7 566.9 228.7 136.7 4.6 545.1Reg. 5 179.4 76.5 33.0 398.7 200.9 95.8 29.7 493.4
Fig.5 Five homogeneous sub-regions andfragmented region of Tamil Nadu.

120
deviation of 96.2mm, 148.8mm, 130.7mm and210.0mm in the month of October, November,December and NEM season respectively. Thisregion receives a minimum rainfall of 46.2mm anda maximum of 587.7mm, a minimum of 28.1mm anda maximum of 856.5, a minimum of 0.3mm and amaximum of 664.8 mm in the month of October,November and December respectively. DuringNEM season, it receives a minimum total rainfall of172 mm and a maximum total rainfall of 1150 mmduring NEM season.
4.2 Sub-region II : South interior regionThe districts Madurai, Sivaganga, Virudhunagar
and Dindugul constitute the region II. These districtsare south interior districts and this region may becalled as 'south interior region'. This region coversan area of 18,108 sq. km. There are 23 rain gaugesin the region and the average height of the raingauges is 244 m amsl. This region receives a meanrainfall of 192.8 mm, 162.3 mm, 67.8 and 423.2mmwith standard deviation of 69.3mm, 87.3mm,57.9mm and 121.2 mm in the month of October,November, December and NEMS respectively.This region receives a minimum rainfall of 64.0mmand a maximum of 433.2mm, a minimum of 10.4mmand a maximum of 490.8, a minimum of 0.2 mmand a maximum of 232.7 mm in the month ofOctober, November and December respectively.During NEMS, it receives a minimum total rainfallof 178.2m and a maximum total rainfall of 734.4 mmduring NEMS
4.3 Sub-region III : North interior or Northwestregion
The districts Dharmapuri, Namakkal, Salem,Erode and Nilgiris form the region III. The districtsare located over north interior Tamil Nadu and thisregion may be called as 'north interior region'. Thisregion covers an area of 29029 sq. km. There are36 rain gauges located in the region and theaverage height of the rain gauges is 555 m amsl.This region receives a mean rainfall of 170.7 mm,107.3 mm, 39.1 and 316.7mm with standarddeviation of 68.7mm, 68.0mm, 41.0mm and 108.0mm in the month of October, November, Decemberand NEMS respectively. This region receives aminimum rainfall of 41.2mm and a maximum of381.8mm, a minimum of 5.2mm and a maximum of271.0, a minimum of 0.0mm and a maximum of225.4 mm in the month of October, November andDecember respectively. During NEMS, it receives
a minimum total rainfall of 84.4mm and a maximumtotal rainfall of 616.6 mm during NEMS
4.4 Sub-region IV : Northeast or north coastalregion
Region IV comprises of Chennai,Kanchipuram, Thiruvallur and Vellore districts.Except Vellore, all the other districts are locatedover north coastal Tamil Nadu and this region maybe designated as 'north coastal or northeastregion'. This region covers an area of 14108 sq.km. There are 19 rain gauges in the region andthe average height of the rain gauges is 104 mamsl. This region receives a mean rainfall of 207.5mm, 228.7 mm, 97.6 and 533.1mm with standarddeviation of 110.2mm, 136.7mm, 109.0mm and200.5 mm in the month of October, November,December and NEMS respectively. This regionreceives a minimum rainfall of 10.7mm and amaximum of 566.9 mm, a minimum of 4.6mm anda maximum of 545.1, a minimum of 0.0 mm and amaximum of 569.8 mm in the month of October,November and December respectively. DuringNEMS, it receives a minimum total rainfall of106.2mm and a maximum total rainfall of 1212.2mm during NEMS.
4.5 Sub-region V : South Coastal regionThe districts Tirunelveli, Thoothukudi and
Kanyakumari make the region V. These districtsare located over south coastal Tamil Nadu andthis region can be called as 'South coastal region'.This region covers an area of 13116 sq. km. Thereare 22 rain gauges in the region and the averageheight of the rain gauges is 66 m a. m. s. l.
This region receives a mean rainfall of 179.4mm, 200.9 mm, 89.8 and 469.7mm with standarddeviation of 76.5mm, 95.8mm, 76.2mm and 154.5mm in the month of October, November,December and NEMS respectively. This regionreceives a minimum rainfall of 33.0mm and amaximum of 398.7mm, a minimum of 29.7mm anda maximum of 493.4, a minimum of 0.4mm and amaximum of 379.7 mm in the month of October,November and December respectively. DuringNEMS, it receives a minimum total rainfall of157.8mm and a maximum total rainfall of 931.8mm during NEMS.
Comparing the mean rainfall in the month ofOctober between the regions, the Region 4, whichis located in northeast part of the state, receiveshigher rainfall of 207.5 mm but with higher standarddeviation of 110mm while the region3 receives low

121
mean rainfall of 171 mm with low standard deviationof 69mm. As far as, the mean rainfall in the monthof November is concerned, the Region 1, which islocated in the central coastal part of the state,receives higher mean monthly rainfall of 207.5 mmbut with higher standard deviation of 149 mm whilethe region3 receives low mean rainfall of 107 mmwith low standard deviation of 68mm. In Decemberalso, the region1 receives a higher mean monthlyrainfall of 157mm with higher standard deviation of131mm. The standard deviation of region 3 andregion 4 is more than the mean monthly rainfall inthe month of December i.e., the CV is more than100%. The region1 receives higher mean NEMRwith higher standard deviation of 210mm
4.6 The fragmented regionsThe districts namely Villupuram,
Thiruvannamalai, Coimbatore, Karur,Tiruchirappalli, Ramanathapuram and Theni areunclassified districts as per strong alignment to anyof the five principal components found. Villupuram,which is lying between the Region 4 and 1 andRamanathapuram, which is located between region1 and 5, are coastal districts. The districtsCoimbatore and Theni are located close the'Western Ghats' and the rest of the districts areinterior districts Each of the sub regions outlined inthe figure 6 corresponds to a graphical area wherea distinct set of a mechanisms act either to enhanceor suppress the rainfall activity. These mechanismsare basically related to the configuration and positionof rainfall generating meteorological conditions andweather systems or to the interactions (bothenhancing and suppressing) between thetopography and the rain bearing air flows.
5. ConclusionsTaking the 29 districts as variables and the
daily district rainfal l of 2852 days of NEMseason (1st October to 31st December) of theperiod 1965-1996 as observations/cases, S-mode principal component analysis was done.Varimax rotation is done by taking five PCs andit c lassif ies 22 districts in to five groups.Balance of 7 districts are found with weak /moderate relations to any of the PCs either byVarimax rotation. Tamil Nadu is regionalisedbased on strong relationship with 5 PCs; Sub-region 1 comprises of distr icts Cuddalore,Perambalur, Pudukottai, Thanjavur, Thiruvarurand Nagapatt inam. The districts Madurai,Sivaganga, Virudhunagar and Dindugul makeSub-region II. The districts Dharmapuri, Salem,
Namakkal, Karur, Erode, Nilgiris andCoimbatore make Sub-region III and the districtsChennai, Kanchipuram, Vellore and Thiruvallurform Sub-region IV. The group of distr ictsTirunelveli, Thoothukudi and Kanyakumarimake Sub-region V.
AcknowledgementsThe authors are thankful to Dr. Y. E.A. Raj,
DDGM (Retd.) and Shri S.B. Thampi, DeputyDirector General of Meteorology, Regionalmeteorological centre, Chennai for providing facilityfor this research
ReferencesBarring, L, 1987, " Spatial patterns of daily rainfallin Central Kenya: application of pr incipalcomponent analysis, common factor analysis andspatial correlation", J. Climate, 7, pp267-290.
Bonell, M. and Sumner, G. N., 1992," Autumn -winter daily precipitation areas in Wales, 1982/83to 1986-87", Int. J. Climatol., 12,77-102.
Cattel, R.B., 1966, "The Scree test for the numberof factors", Multi var. Bebav. Res., 1, pp 245.
Craddock, J.M. and Flood, C. R., 1969," Eigenvectors for representing the 500 mb geopotentialsurface over northern hemisphere", Quart. J. R.Meteo. Soc., 95, pp476-593.
Fovell, R.G and Fovell, M. C., 1993, " Climaticzones of the conterminous United states definedusing cluster analysis", J. Climate, 6, 2103-2135.
Gong, X. and Richman, M. B., 1995, " On theapplication of cluster analysis to growing seasonprecipitation data in north America east of Rockies',J. Climate, 8, pp897 - 931.
Jolliffe, I. T.,1987, " Rotation of principalcomponents some comments", J. climate, 7, 507- 510.
Kaiser, H. F., 1958, " The Varimax criterion foranalytic rotation in factor analysis",psychometrika, 23, pp187-200.
Periago, M. C. Lana, X. Serra, G. and FernendezMills, G., 1991, "Precipitation regionalisation;an application using a meteorological net work inCatalonia (NE Spain)", Int. J. Climatol.,, 11,pp 529-543.
Preisendorfer, R. W., 1988, "Principal componentanalysis in meteorology and Oceanography".

122
Richman, M. B., 1981, "Obliquely rotated principalcomponents: An improved meteorological maptyping technique" , J. Appl. Meteorol., 20, pp1145- 1159.
Richman, M. B., 1986, "Rotation of principalcomponents", J. Climatol., 6, pp293 - 335.
Richman, M. B., 1987, "Rotation of Principalcomponents: a reply" , J. Climatol., 7(5), pp511 -520.
Romero, R, Ramis, C. and Guijarro,J.A.,1999, "A30 year (1964 - 1993) daily rainfall data base forthe Spanish Mediterranean regions: first exploratorystudy", int. J. Climatol.,18, pp541-560.
Sumner, G and Bonell.M, 1990," The spatialorganisation of daily rainfall in Wales during autumn- winter ", Weather, 45, pp174-187.
Sumner, G. Ramis, G. and Giuijano. J. A., 1993,"The spatial organisation of daily rainfall overmallorea, Spain", Int. J. Climatol., 13, pp89 - 109.
White, D., Richman, M and Yarnal.B,1991," Climateregionalisation and rotation of principalcomponents", Int. J. Climatol., 11, pp1-25.
Wilks. D. S., 1995, "Statistical methods in theatmospheric sciences an Introduction" Academicpress Inc, California.