Objective quality and customer satisfaction BEST CIG Berlin 2007-10-02.
16
Objective quality and customer satisfaction BEST CIG Berlin 2007-10-02
-
Upload
doreen-barton -
Category
Documents
-
view
213 -
download
0
Transcript of Objective quality and customer satisfaction BEST CIG Berlin 2007-10-02.
Objective quality and customer satisfaction
BEST CIG
Berlin 2007-10-02

The CIG
Participants:Oslo SporveierHelsinki City TransportStockholm TransportSAMOT research center, Karlstad

Questions in the CIG
How is PT satisfaction related to actual PT quality? What do people judge when they judge
satisfaction?What else than objective quality?And how do they do it?
Implications for how to collect, interpret and use customer data

Activities in the CIG
After the kick-off in Copenhagen Meetings in Helsinki and
Oslo Discussion of practices,
measurement systems and results (see BEST web page)
Experiences, problems and solutions
Begun work with a CIG report

A summary complex picture of public transport satisfaction
Objective quality, current
journey
Customer journey quality expectations
The customer's perception of journey quality relative to expectations
+b+c
Customer satisfaction,
previous journeys
"External noise"
+aCustomer satisfaction,
+e+f +/–g
–d

Examples of insights and conclusions so far
Impact of expectationsHistory/previous experienceMedia/reputation
Methods of data collection and analysisCustomer surveysCustomer complaints
How to interpret the resultAnd how to use them

Oslo – What is behind the satisfaction data
Interview follow-up of onboard survey of journey satisfaction
The scale In general: 1-2 are used when the
respondent is dissatisfied, 3-5 is used when the customer is satisfied.
The responses: not only performancePrevious experienceExpectations

Count.
Previous experiences influences This influences the answers adversely, not
positively.
Examples: Punctuality: "The tram was on time, I could have
given a top score. Still, in the back of my mind were all the delays lately, so I gave a poorer score."
Cleanliness: "In general, the metro is always dirty, people are spitting and putting their feet on the seat. Giving a top score is impossible".

Helsinki – Quality and compalints
Customer complaints and satisfactionComputerized system for analysing
customer complaintsContent analysis/conceptual mappingQuantifications and linkage to satisfaction
measuresComplaint data reveals the causes of
(dis-)satisfaction Immediate reaction of service problems
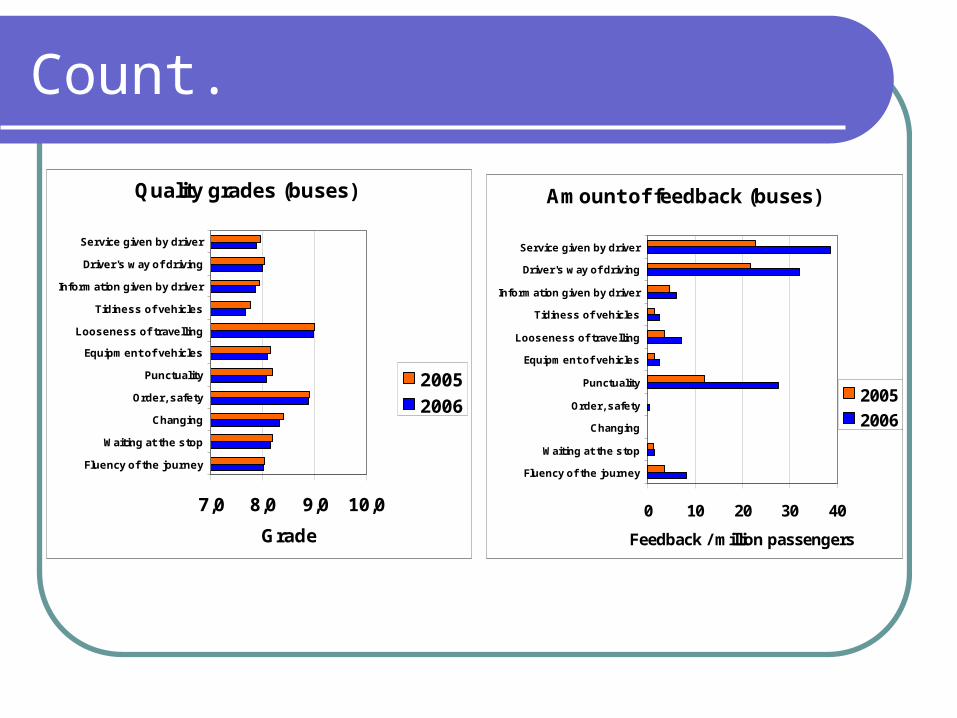
Count.
Quality grades (buses)
7,0 8,0 9,0 10,0
Fluency of the journey
Waiting at the stop
Changing
Order, safety
Punctuality
Equipment of vehicles
Looseness of travelling
Tidiness of vehicles
Information given by driver
Driver's w ay of driving
Service given by driver
Grade
2005
2006
Amount of feedback (buses)
0 10 20 30 40
Fluency of the journey
Waiting at the stop
Changing
Order, safety
Punctuality
Equipment of vehicles
Looseness of travelling
Tidiness of vehicles
Information given by driver
Driver's way of driving
Service given by driver
Feedback / million passengers
2005
2006

Discussion issues
Satisfaction in times of change Internal/external changesPositive/negative changes
Why satisfaction measures?Quality controlFollow up of operators/incentivesEffects of improvements Input to strategic decisions

Discussion issues (count)
Methodological aspectsData sources InstrumentsScalesSamples
Additional forcesAffective dimensions Impact of cultureMedia/reputation

Critical incidents

Critical incidents and satisfaction

Critial incidents, attributes and satisfaction

The Kano-model of quality attributes
High
Low
High
”Must be” (hygene factors)
”Delights” (attractors)
Traditional one-dimensional attributes
Customer satisfaction
Objective qualityLow