Objective Measurements and Subjetive Assessments
20
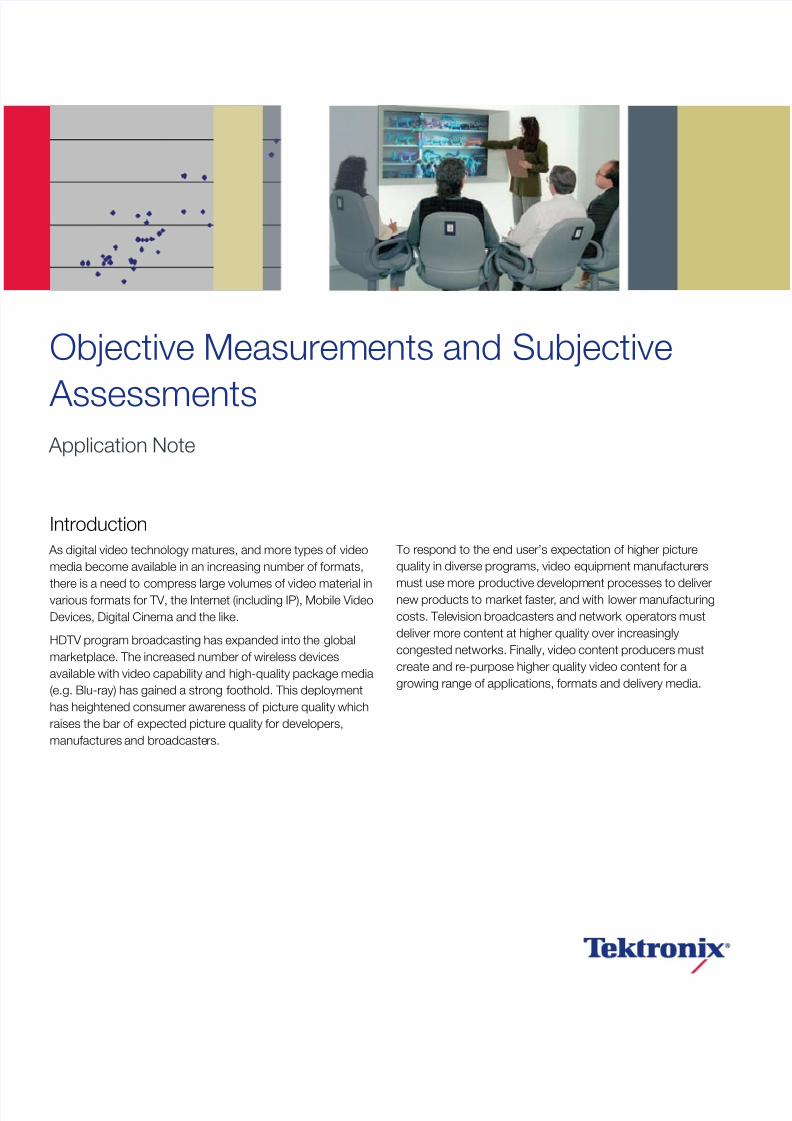
Introduction As digital video technology matures, and more types of video media become available in an increasing number of formats, there is a need to compress large volumes of video material in various formats for TV, the Internet (including IP), Mobile Video Devices, Digital Cinema and the like. HDTV program broadcasting has expanded into the global marketplace. The increased number of wireless devices available with video capability and high-quality package media (e.g. Blu-ray) has gained a strong foothold. This deployment has heightened consumer awareness of picture quality which raises the bar of expected picture quality for developers, manufactures and broadcasters. To respond to the end user’s expectation of higher picture quality in diverse programs, video equipment manufacturers must use more productive development processes to deliver new products to market faster, and with lower manufacturing costs. Tele vision broadcasters and network operators must deliver more content at higher quality over increasingly congested networks. Finally, video content producers must create and re-purpose higher quality video content for a growing range of applications, formats and delivery media. Objective Measurements and Subjective Assessments Application Note
-
Upload
viorel2004ro -
Category
Documents
-
view
220 -
download
0
Transcript of Objective Measurements and Subjetive Assessments
8/6/2019 Objective Measurements and Subjetive Assessments
http://slidepdf.com/reader/full/objective-measurements-and-subjetive-assessments 1/20
Introduction
As digital video technology matures, and more types of video
media become available in an increasing number of formats,
there is a need to compress large volumes of video material in
various formats for TV, the Internet (including IP), Mobile Video
Devices, Digital Cinema and the like.
HDTV program broadcasting has expanded into the global
marketplace. The increased number of wireless devices
available with video capability and high-quality package media
(e.g. Blu-ray) has gained a strong foothold. This deployment
has heightened consumer awareness of picture quality which
raises the bar of expected picture quality for developers,
manufactures and broadcasters.
To respond to the end user’s expectation of higher picture
quality in diverse programs, video equipment manufacturers
must use more productive development processes to deliver
new products to market faster, and with lower manufacturing
costs. Television broadcasters and network operators must
deliver more content at higher quality over increasingly
congested networks. Finally, video content producers must
create and re-purpose higher quality video content for a
growing range of applications, formats and delivery media.
Objective Measurements and Subjective
Assessments Application Note

8/6/2019 Objective Measurements and Subjetive Assessments
http://slidepdf.com/reader/full/objective-measurements-and-subjetive-assessments 2/20
Application Note
www.tektronix.com/PQA5002
In this environment, picture quality assessment techniques
are playing a larger role in video product design, video
system deployment and content quality assurance. Many
organizations assess picture quality using a subjective,
informal approach—one that asks people in the organization
to compare test video sequences to reference video
sequences. Over time, one person or a small group of people
will demonstrate an ability to detect video quality impairments.
These are the organization’s “golden eyes.”
A “golden eyes” subjective rating may match the end
consumer’s video experience or these discerning evaluators
may see artifacts that the average viewer might miss. But,
many typical organizations cannot afford a large staff of
“golden eyes.” Conicts in scheduling these limited resources
for picture quality assessments can delay work. Alternatively,
expenses for hiring a “golden eyes” evaluator from outside the
organization can be costly. Subjective evaluations can easily
take several hours, making evaluator error from fatigue, afactor in the evaluation.
Some organizations use formal subjective assessment to
replace or augment informal subjective assessments using
“golden eyes.” The ITU-R BT.500 recommendation describes
various methods of conducting formal subjective picture
quality assessments, along with requirements for selecting
and conguring displays, determining reference and test
video sequences, and selecting subjects for the viewer test
audiences.
Specifying the desired tests, gathering the required video
content, recruiting and selecting the viewing audience,conducting the tests and analyzing the results generally
requires several weeks. Typically, independent laboratories
perform this subjective testing, although a few organizations
may have internal resources that can conduct these formal
subjective assessments. When conducted by an independent
laboratory, overall costs for these subjective picture quality
assessments must include signicant time and thousand
of dollars. Given this commitment of time, resources and
expenses, typical organizations will conduct a very limited
amount of formal subjective picture quality assessments. If
they use these methods at all, teams will generally perform
this testing at very few critical milestones in the project or
deployment.
Whether they use informal or formal approaches, video
equipment manufacturers, television broadcasters, network
operators and video content producers are nding it
impractical to use subjective picture quality assessment to
fully address the challenges described above. Engineering and
quality assurance teams in these companies need to optimize
picture quality vs. various constraints. For example:
On a tight development schedule, a product development
team needs to determine the best picture quality they can
achieve at a specic product manufacturing cost.
A cable network operator needs to nd the system
conguration that produces the best picture quality
at a specic bandwidth allocation.
A post-product company needs to nd the best down-
conversion algorithm to use in repurposing digital cinema
content on DVDs.
These optimization processes require repeated picture
quality assessments as the engineering or quality assurance
team tries different approaches or congurations and tests
the results. Conducting subjective assessments for eachtrial using actual viewers is too time-consuming and costly.
Delivering video products, systems and content with optimal
picture quality in today’s environment requires instruments
that can make accurate, reliable, repeatable objective picture
quality measurement faster than subjective assessments.
8/6/2019 Objective Measurements and Subjetive Assessments
http://slidepdf.com/reader/full/objective-measurements-and-subjetive-assessments 3/20
www.tektronix.com/PQA500 3
To serve as an adequate replacement for “golden eyes”
and formal subjective assessment, objective picture quality
measurements on video content must produce results that
match subjective ratings on the same video content. Peak-
Signal-to-Noise Ratio (PSNR) measurements are not sufcient
to meet this criteria. Simple examples can produce PSNR
measurement results that completely disagree with subjective
ratings of picture quality. Any method for objective picture
quality assessment must prove its merit by verifying its ability
to match the results of subjective assessment. However,
comparing objective picture quality measurements and a
subjective picture quality assessment requires careful planning,
execution and analysis. Many factors affect the comparison
and may include:
Video content selected for the comparison
Method, conguration and subjects used in the subjective
assessments
Quality and characteristics of the subjective
assessment data
Objective measurements used in the comparison and
their conguration
Results analysis
Insufcient attention to these factors can lead to misleading
conclusions about the merits of a particular objective picture
quality measurement method.
This paper describes a comparison of PQA500 objective
picture quality measurements with subjective assessmentsperformed on HD video content processed with H.264
encoding. It will show that the measurements made by the
Tektronix PQA500, properly congured to match the subjective
assessment conditions, has a correlation coefcient of 0.935,
with an ideal value of 1.0 indicating an exact match between
assessment results. Root Mean Square Error deviation (RMSE)
of 6.11, with an ideal value of 0.0 indicating no difference
between the results, with an example subjective assessment
results from H.264 encoded 1080i video with bit rates
between 2 Mbps and 70 Mbps.
Video Content
The selection of test material is important for comparing
any objective measurement against subjective ratings. The
selected video content has to represent scenes from a variety
of programs which contain a diversity of contrast, brightness,
color, high motion, difculty to encode/decode and other
attributes, which would generally be shown in the TV
broadcasting content.
The video material that was selected for testing, as described
in this paper, consisted of 24 reference sequences (e.g.
unprocessed) in HD 1080i59. The duration of each reference
sequence was either 8.3 or 10 seconds. Brief descriptions for
each reference video are listed in the Appendix.
The 24 reference sequences were processed with H.264
encoding, using nine variations of bit rate from 2 Mbps to
70 Mbps producing a total of 216 test sequences. The test
sequences used for the subjective rating were narrowed
down from 216 to 60, with due consideration for keeping
the material diverse and to get a uniform distribution of
degradation scales from “Excellent” to “Bad.”
Objective Measurements and Subjective Assessments

8/6/2019 Objective Measurements and Subjetive Assessments
http://slidepdf.com/reader/full/objective-measurements-and-subjetive-assessments 4/20
Application Note
Subjective Assessment
Subjective assessments were conducted by the
Communications Research Centre (CRC), Canada. Thirty-
three viewers (18 males and 15 females) participated in
the experiment. One viewer had signicant experience with
the subjective assessment of picture quality. The remaining
viewers were all non-experts. Mean age was 33.9 years. All
viewers were screened prior to participation for normal, or
corrected to normal, visual acuity and normal color vision.
The viewing room used for the subjective test conformed
to ITU-R Rec. BT. 500 guidelines. The video sequences
to be evaluated were displayed on a Sony BVM-D24 CRT
professional monitor. Viewers saw the video sequences from
a distance approximately equal to three times the picture
high (e.g. viewing distance 3H). A detailed description of the
viewing parameters, including monitor characteristics and
viewing environment, was described in a nal report from the
CRC. (Figure 1)
No more than two viewers were tested simultaneously. A
personal computer was used for controlling stimulus delivery
and collecting the ratings provided by the viewers. Ratings
were collected electronically using a custom input device.
The subjective quality of the video sequences was measured
using the Double-Stimulus Continuous Quality-Scale (DSCQS)method (refer to Rec. ITU-R BT 500). The procedure consisted
of a series of judgment trials, each announced verbally by
number (e.g. Trial # 1, Trial # 2 and so on). In each trial, two
versions of the same video clips were presented twice (total of
four presentations). The rst presentation of a trial was always
verbally identied as “A”, and the second as “B.” This pair of
presentations was repeated twice, thereby completing a single
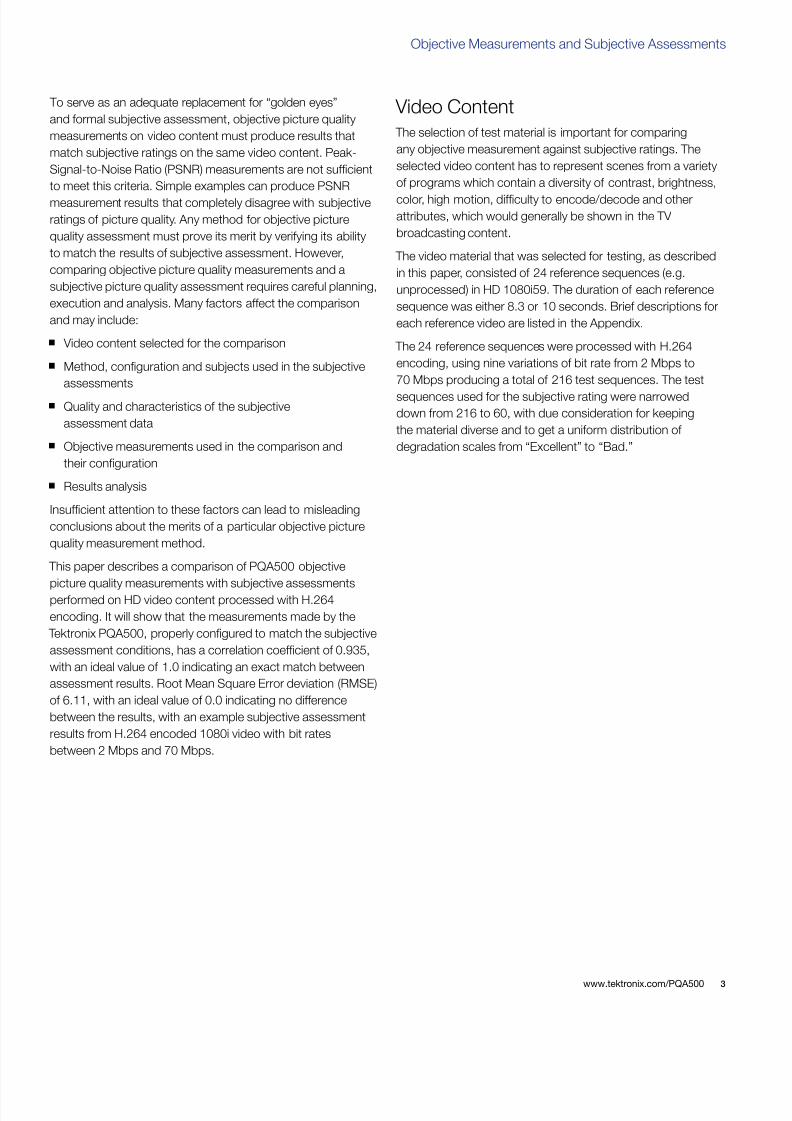
trial (e.g. AB, AB) as shown in Figure 2.
In each trial, either "A" or "B" was a Reference sequence; the
other was a Test sequence. The Reference was always one of
the unprocessed (e.g. original) source sequences, whereas the
Test sequence was one of the corresponding test sequences
obtained by processing the source sequence with one of the
test conditions. The order of presentation of the Reference
and Test was randomized across trials without informing the
viewers. The order of presentation of different test sequences
was also randomized across viewers or group of viewers.
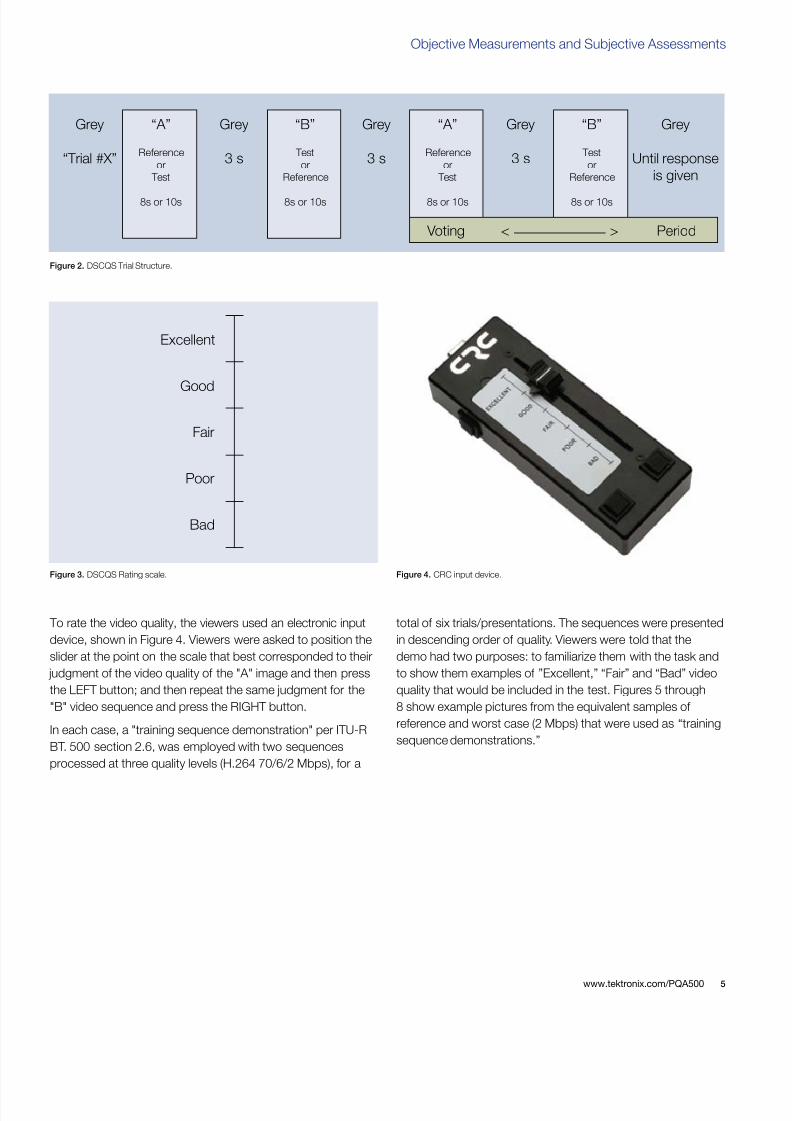
Viewers were asked to rate both the “A” and “B” video clips
using a continuous vertical scale as depicted in Figure 3.
Figure 1. Example of Subjective Assessment.
www.tektronix.com/PQA5004
8/6/2019 Objective Measurements and Subjetive Assessments
http://slidepdf.com/reader/full/objective-measurements-and-subjetive-assessments 5/20
5
To rate the video quality, the viewers used an electronic input
device, shown in Figure 4. Viewers were asked to position the
slider at the point on the scale that best corresponded to their
judgment of the video quality of the "A" image and then press
the LEFT button; and then repeat the same judgment for the
"B" video sequence and press the RIGHT button.
In each case, a "training sequence demonstration" per ITU-R
BT. 500 section 2.6, was employed with two sequences
processed at three quality levels (H.264 70/6/2 Mbps), for a
total of six trials/presentations. The sequences were presented
in descending order of quality. Viewers were told that the
demo had two purposes: to familiarize them with the task and
to show them examples of ”Excellent,” “Fair” and “Bad” video
quality that would be included in the test. Figures 5 through
8 show example pictures from the equivalent samples of
reference and worst case (2 Mbps) that were used as “training
sequence demonstrations.”
Objective Measurements and Subjective Assessments
Excellent
Good
Fair
Poor
Bad
Figure 2. DSCQS Trial Structure.
Reference
or
Test
8s or 10s
“A”Grey
“Trial #X” Test
or
Reference
8s or 10s
“B”Grey
3 sReference
or
Test
8s or 10s
“A”Grey
3 s Test
or
Reference
8s or 10s
“B”Grey
3 s
Grey
Until response
is given
Voting Period< >
Figure 3. DSCQS Rating scale. Figure 4. CRC input device.
www.tektronix.com/PQA500

8/6/2019 Objective Measurements and Subjetive Assessments
http://slidepdf.com/reader/full/objective-measurements-and-subjetive-assessments 6/20
Application Note
Figure 6. Worst case training Sample1.
Figure 8. Worst case training Sample2.
Figure 5. Reference Sample1.
Figure 7. Reference Sample2.
Pooling Subjective Assessment Data
In the DSCQS method, subjective quality is expressed in terms
of opinion scores. The Mean Opinion Score (MOS) has been
dened as the arithmetic average score of the opinion scores
from each viewer. Then, the Differential Mean Opinion Score
(DMOS) is the dened as the difference of the average opinion
scores. The DMOS is conventionally calculated by subtracting
the MOS score for reference sequence from that for test
sequence, but in this paper, we have the reversed subtraction
for the convenience. Thus, a negative DMOS implies that
the Test sequence was judged as having a higher perceived
quality than the Reference sequence; a DMOS of zero implies
that the Test and Reference sequences were judged as having
the same perceived quality; and nally a positive value implies
that the Test sequence was judged as having a lower perceived
quality than the Reference sequence. Thus a positive DMOS
represents the loss of quality, if any, due to processing.
Metrics Showing the Performance of
the Objective Measurement AgainstSubjective Rating
The metrics showing the performance of the objective
measurements against subjective ratings have to come from
statistical methods, to properly represent the characteristics
of the tests, and to be well known/accepted in the industry.
The correlation coefcient is one such metric that meets these
criteria. It can describe the degree of similarity between not
only the same metrics but also different metrics, enabling us
to compare PSNR(dB) with DMOS or PQR with DMOS. The
correlation coefcient gives results ranging between -1 to 1.
Where the relationship between two data arrays is shown as
the formula (Figure 9), and when K1 is positive, the correlation
is 1.0. When K1 is negative, the correlation is -1.0 (see Figures
10 and 11).
array[n] = K1 * array2[n] + K2(where K1 and k2 are constant)
Figure 9. The condition of correlation coefcient of 1.
www.tektronix.com/PQA5006

8/6/2019 Objective Measurements and Subjetive Assessments
http://slidepdf.com/reader/full/objective-measurements-and-subjetive-assessments 7/20
Figure 11. Correlation coefcient: 0.134.Figure 10. Correlation coefcient: 1.
Figure 13. Correlation Coefcient: 0.926, RMSE: 2.179 with error of 10 at last data.Figure 12. Correlation Coefcient: 0.935, RMSE: 2.179 with error of 10 at center data.
7
The correlation coefcient is denitely one metric to show
a performance attribute. But, heavily relying on that metric
alone, when discussing the performance of the objective
measurement, could be misleading. For example, the
correlation coefcient could be changed by the sample
location where the error is included or even where the degree
of error is unchanged. The error in Figure 12 is located in the
middle sample of the data array and the error in Figure 13 is
located on the last sample of data array. Both these errors
have same amount of error, but the correlation coefcients
have different results.
In this paper, RMSE of Root Mean Square Error (RMSE) will
be used—after correcting for mean error—the result is shown
to be equal to error standard deviation, as well as correlation
coefcient. RMSE can represent the error difference between
the two data arrays which has no variance caused by sample
location (Figures 12 and 13). However, its use is limited to
cases where the variables have identical units and expected
results are the same (e.g. Subjective DMOS vs Predicted
DMOS).
The ideal model will give a correlation coefcient equal to 1
and RMSE equal to 0. In practice, the high performance model
may show a high correlation coefcient of close to 1 and a low
RMSE of close to 0.
Objective Measurements and Subjective Assessments
www.tektronix.com/PQA500
8/6/2019 Objective Measurements and Subjetive Assessments
http://slidepdf.com/reader/full/objective-measurements-and-subjetive-assessments 8/20
Application Note
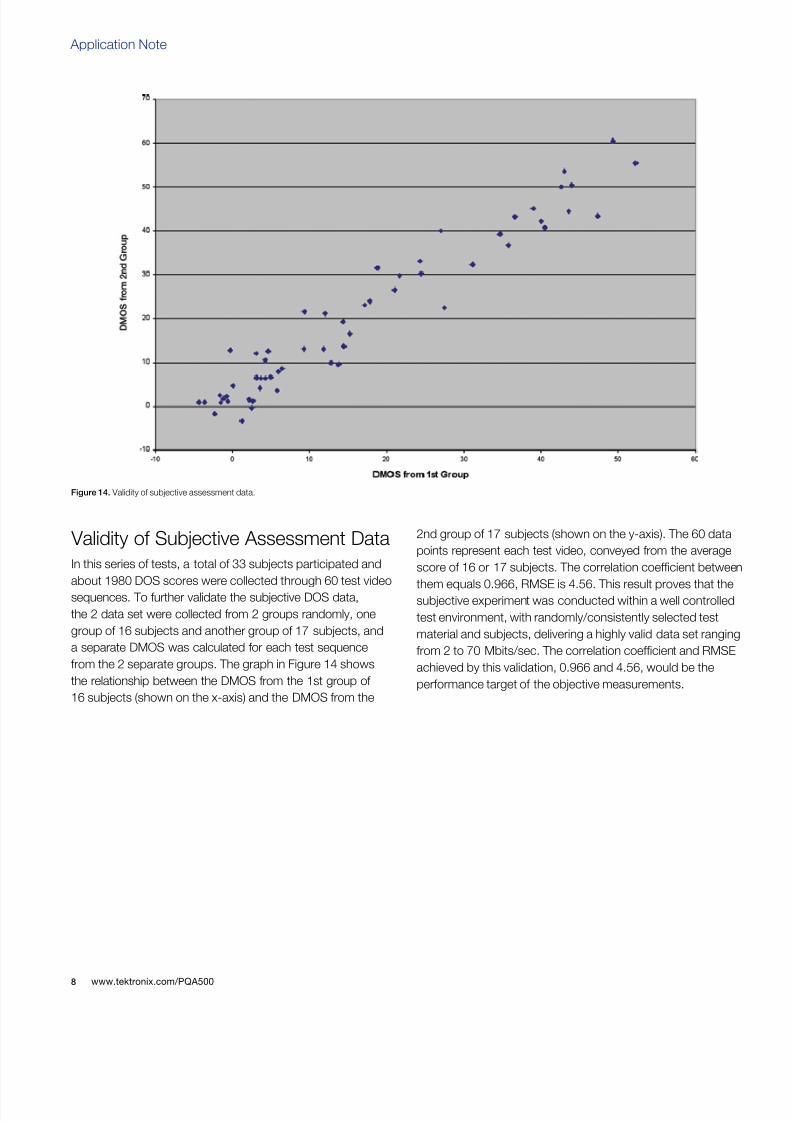
Validity of Subjective Assessment Data
In this series of tests, a total of 33 subjects participated and
about 1980 DOS scores were collected through 60 test video
sequences. To further validate the subjective DOS data,
the 2 data set were collected from 2 groups randomly, one
group of 16 subjects and another group of 17 subjects, and
a separate DMOS was calculated for each test sequence
from the 2 separate groups. The graph in Figure 14 shows
the relationship between the DMOS from the 1st group of
16 subjects (shown on the x-axis) and the DMOS from the
2nd group of 17 subjects (shown on the y-axis). The 60 data
points represent each test video, conveyed from the average
score of 16 or 17 subjects. The correlation coefcient between
them equals 0.966, RMSE is 4.56. This result proves that thesubjective experiment was conducted within a well controlled
test environment, with randomly/consistently selected test
material and subjects, delivering a highly valid data set ranging
from 2 to 70 Mbits/sec. The correlation coefcient and RMSE
achieved by this validation, 0.966 and 4.56, would be the
performance target of the objective measurements.
Figure 14. Validity of subjective assessment data.
www.tektronix.com/PQA5008

8/6/2019 Objective Measurements and Subjetive Assessments
http://slidepdf.com/reader/full/objective-measurements-and-subjetive-assessments 9/20
9
Objective Picture Quality Measurements
In this paper, the performances of 4 Full-Reference
measurements were evaluated. Peak Signal to Noise Ratio
(PSNR), Picture Quality Rating (PQR), DMOS and Attention
weighted DMOS (ADMOS), were measured by the PQA500
and compared against the subjective picture quality
assessments described above.
The PSNR measurement is a Noise-based measurement
that computes the noise, or error, in the test video relative
to the reference video. This measurement is well known as
having less correlation with subjective ratings. However, it is
periodically shown in papers and equipment literature since
the algorithm is very simple to understand and it historically
was more useful for less efcient encoders/decoders and
wider ranging quality. It provides intuitive results at debugging
stages during development and is commonly used in the
industry. This measurement is often picked up as a referencefor discussing the performances of other perceptual based
measurements.
PQR and DMOS are perceptual-based measurements
using human vision system models. They provide more
accurate rating results, correlating more closely to human
subjective tests than the PSNR measurement alone. The PQR
measurement evaluates whether viewers notice a difference
between the test and references video content, making
PQR very suitable for measuring high quality video (typically
broadcast video). The DMOS measurement evaluates how
much impairment viewers will perceive in test video content.
DMOS is more suitable for measuring the video content
differences over a wide quality range (after calibration training
for worst case video content).
ADMOS is a DMOS measurement, with the addition of a part
of human cognition that accounts for what we are most likely
to watch in any given scene. In any video sequence, some
elements in the video will draw viewers’ attention, while they
tend to ignore other elements. Differences will appear more
pronounced in areas which “grab” the viewer’s attention.
Conversely, differences that occur in regions of the video that
viewers are more likely to ignore will have less of an impact on
test scores. The standard DMOS measurement gives equal
weight to every perceptual contrast difference between the
reference and test video. ADMOS proves to be a suitablepicture quality measurement, providing higher comparison
accuracy against human subjective testing, when human
cognition is considered.
Please refer to the application note, “Understanding PQR,
DMOS and PSNR Measurements (28W-21224-0)” for more
information of PSNR, PQR and DMOS metrics.
Objective Measurements and Subjective Assessments
www.tektronix.com/PQA500
8/6/2019 Objective Measurements and Subjetive Assessments
http://slidepdf.com/reader/full/objective-measurements-and-subjetive-assessments 10/20
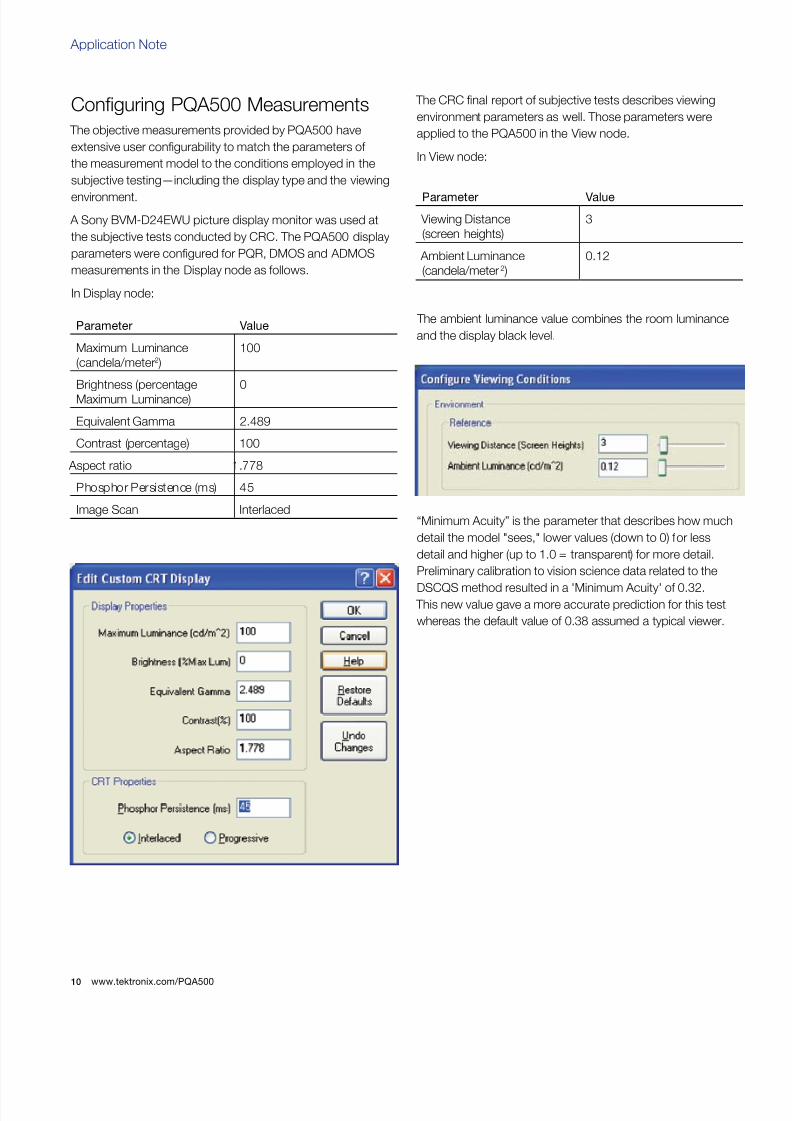
Conguring PQA500 Measurements
The objective measurements provided by PQA500 have
extensive user congurability to match the parameters of
the measurement model to the conditions employed in the
subjective testing—including the display type and the viewing
environment.
A Sony BVM-D24EWU picture display monitor was used at
the subjective tests conducted by CRC. The PQA500 display
parameters were congured for PQR, DMOS and ADMOS
measurements in the Display node as follows.
In Display node:
The CRC nal report of subjective tests describes viewing
environment parameters as well. Those parameters were
applied to the PQA500 in the View node.
In View node:
The ambient luminance value combines the room luminance
and the display black level.
“Minimum Acuity” is the parameter that describes how much
detail the model "sees," lower values (down to 0) for less
detail and higher (up to 1.0 = transparent) for more detail.
Preliminary calibration to vision science data related to the
DSCQS method resulted in a 'Minimum Acuity' of 0.32. This new value gave a more accurate prediction for this test
whereas the default value of 0.38 assumed a typical viewer.
Application Note
Parameter Value
Viewing Distance
(screen heights)
3
Ambient Luminance
(candela/meter2)
0.12
Parameter Value
Maximum Luminance
(candela/meter2)
100
Brightness (percentage
Maximum Luminance)
0
Equivalent Gamma 2.489
Contrast (percentage) 100
Aspect ratio 1.778
Phosphor Persistence (ms) 45
Image Scan Interlaced
www.tektronix.com/PQA50010
8/6/2019 Objective Measurements and Subjetive Assessments
http://slidepdf.com/reader/full/objective-measurements-and-subjetive-assessments 11/20
11
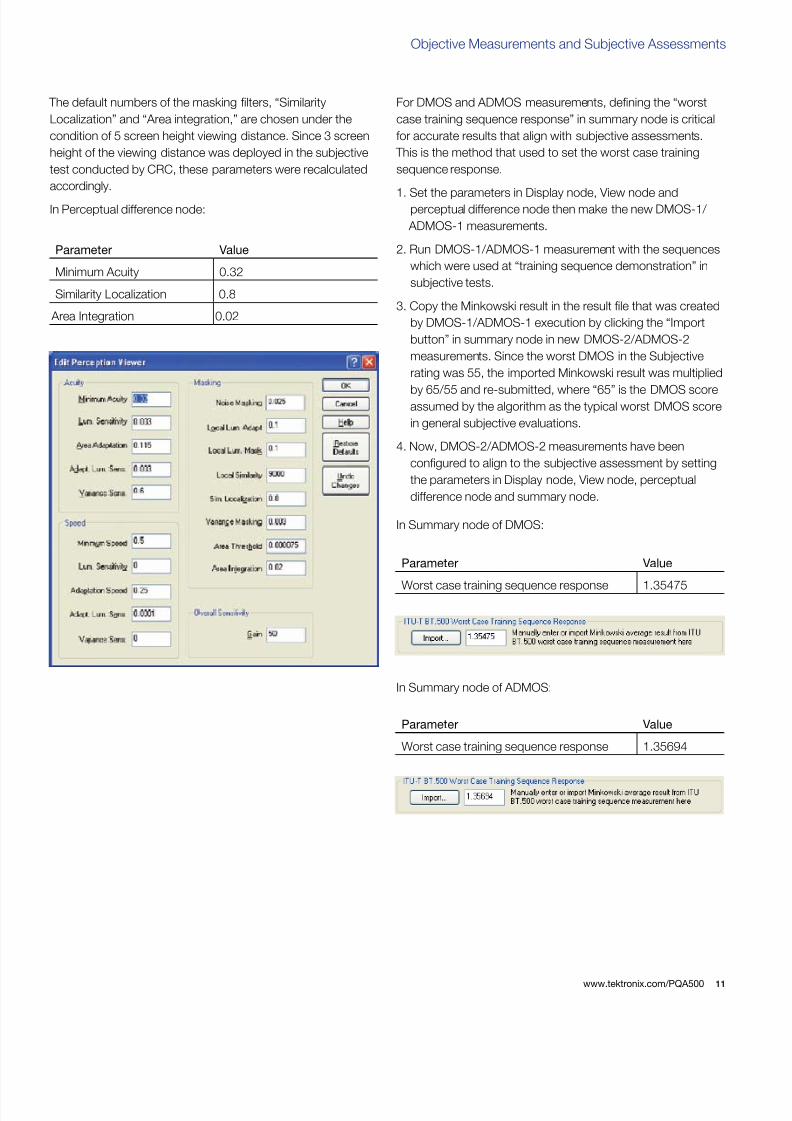
Objective Measurements and Subjective Assessments
The default numbers of the masking lters, “Similarity
Localization” and “Area integration,” are chosen under the
condition of 5 screen height viewing distance. Since 3 screen
height of the viewing distance was deployed in the subjective
test conducted by CRC, these parameters were recalculated
accordingly.
In Perceptual difference node:
For DMOS and ADMOS measurements, dening the “worst
case training sequence response” in summary node is critical
for accurate results that align with subjective assessments.
This is the method that used to set the worst case training
sequence response.
1. Set the parameters in Display node, View node andperceptual difference node then make the new DMOS-1/
ADMOS-1 measurements.
2. Run DMOS-1/ADMOS-1 measurement with the sequences
which were used at “training sequence demonstration” in
subjective tests.
3. Copy the Minkowski result in the result le that was created
by DMOS-1/ADMOS-1 execution by clicking the “Import
button” in summary node in new DMOS-2/ADMOS-2
measurements. Since the worst DMOS in the Subjective
rating was 55, the imported Minkowski result was multiplied
by 65/55 and re-submitted, where “65” is the DMOS scoreassumed by the algorithm as the typical worst DMOS score
in general subjective evaluations.
4. Now, DMOS-2/ADMOS-2 measurements have been
congured to align to the subjective assessment by setting
the parameters in Display node, View node, perceptual
difference node and summary node.
In Summary node of DMOS:
In Summary node of ADMOS:
Parameter Value
Minimum Acuity 0.32
Similarity Localization 0.8
Area Integration 0.02
Parameter Value
Worst case training sequence response 1.35475
Parameter Value
Worst case training sequence response 1.35694
www.tektronix.com/PQA500

8/6/2019 Objective Measurements and Subjetive Assessments
http://slidepdf.com/reader/full/objective-measurements-and-subjetive-assessments 12/20
Application Note
Comparing PQA500 Measurementsand Subjective Assessments
In this section of the paper, the results of PQA500 PSNR,
PQR, DMOS and ADMOS measurements are compared to the
subjective assessment results. In addition, the pre-congured
ADMOS measurement is done without any modication to
show the importance of PQA500 user congurability.
PSNR Measurements (Pre-confgured)
Peak-Signal-to-Noise Ratio measurements are not perceptual-
based measurements. They do not use the PQA500’s human
vision model. PQA500 makes PSNR measurements in
conformance to the T1.TR.74-2001 recommendation titled
“Objective Video Quality Measurement Using a Peak-Signal-
to-Noise Ratio (PSNR) Full Reference Technique” issued by
the Video Quality Expert Group (VQEG). The equation in Figure
16 shows the PSNR measurement result for the overall video
sequences as computed by this method.
The graph in Figure 15 shows the relationship between the
PQA500 PSNR measurements (shown on the y-axis) and
the DMOS values collected from viewers in the subjective
assessment (shown on the x-axis). Each point in the plot
represents one of the test video sequences. The graph shows
that a test video that achieves over 35 dB of PSNR would get
less than 20 out of 100 point (the input device in Figure 4
maps to a 100 point scale for ne comparisons) subjective
DMOS. However, the test video achieving less than 35 dB of
PSNR could get any score of subjective DMOS.
The correlation coefcient between the PQA500’s PSNR and
the subjective DMOS from the DSCQS assessments equal
0.625.
Figure 15. PSNR vs Subjective DMOS.
235
PSNRseq = 20 log10 Σi = 0
N h-1
Σ j = 0
N v -1
[ Yref (i, j, f n) – Ytest (i, j, f n) ]2
Σn = 0
M-1
MNvNh
1
235
PSNRseq = 20 log10 Σi = 0
N h-1
Σ j = 0
N v -1
[ Yref (i, j, f n) – Ytest (i, j, f n) ]2
Σn = 0
M-1
MNvNh
1Σ
i = 0
N h-1
Σi = 0
N h-1
Σ j = 0
N v -1
Σ j = 0
N v -1
[ Yref (i, j, f n) – Ytest (i, j, f n) ]2
Σn = 0
M-1
Σn = 0
M-1
MNvNh
1
MNvNh
1
Figure 16. Equation of PSNR.
www.tektronix.com/PQA50012

8/6/2019 Objective Measurements and Subjetive Assessments
http://slidepdf.com/reader/full/objective-measurements-and-subjetive-assessments 13/20
13
Objective Measurements and Subjective Assessments
PQR Measurements
As noted above in the discussion on objective picture quality
measurements, the PQR measurement evaluates how much
viewers notice the differences between the test and referencesvideos. Certainly the more noticeable differences between the
test and reference video, the more likely viewers will give the
test video a higher DMOS score. Thus PQR scores should
track subjective DMOS scores. Unlike the DMOS measurement,
however, the PQR measurement is not a prediction of a
DSCQS subjective evaluation which evaluates how much
impairments viewers perceive between the test and reference
video based on the training sequence demonstration.
Figure 17 shows the relationship between the PQA500’s PQR
measurement (y-axis) and the DMOS values collected from
viewers in the subjective assessments (x-axis). Compared to
PSNR measurements, the graph clearly shows that changes in
the PQA500’s PQR measurements correspond to changes in
subjective DMOS values. The correlation coefcient between
the PQA500’s PQR and the subjective DMOS from the
DSCQS assessments is equal 0.881.
Figure 17. PQR vs Subjective DMOS.
www.tektronix.com/PQA500
8/6/2019 Objective Measurements and Subjetive Assessments
http://slidepdf.com/reader/full/objective-measurements-and-subjetive-assessments 14/20
Application Note
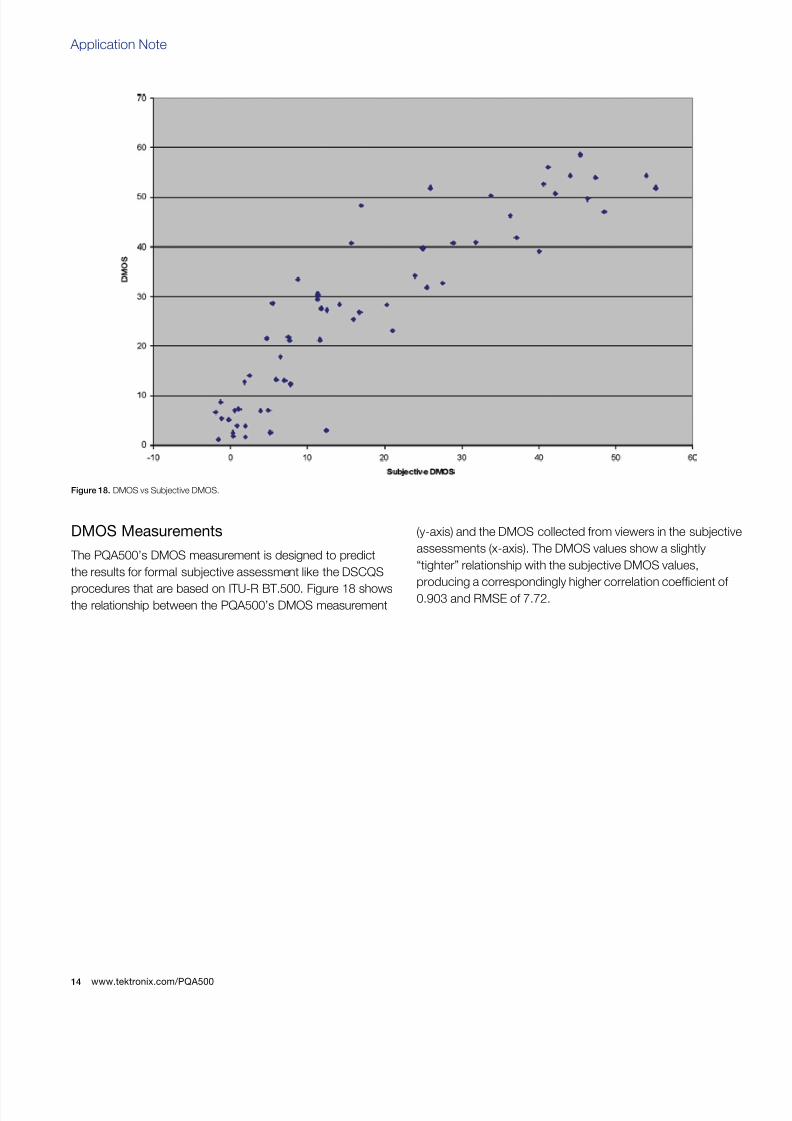
DMOS Measurements
The PQA500’s DMOS measurement is designed to predict
the results for formal subjective assessment like the DSCQS
procedures that are based on ITU-R BT.500. Figure 18 showsthe relationship between the PQA500’s DMOS measurement
(y-axis) and the DMOS collected from viewers in the subjective
assessments (x-axis). The DMOS values show a slightly
“tighter” relationship with the subjective DMOS values,
producing a correspondingly higher correlation coefcient of
0.903 and RMSE of 7.72.
Figure 18. DMOS vs Subjective DMOS.
www.tektronix.com/PQA50014
8/6/2019 Objective Measurements and Subjetive Assessments
http://slidepdf.com/reader/full/objective-measurements-and-subjetive-assessments 15/20
15
Objective Measurements and Subjective Assessments
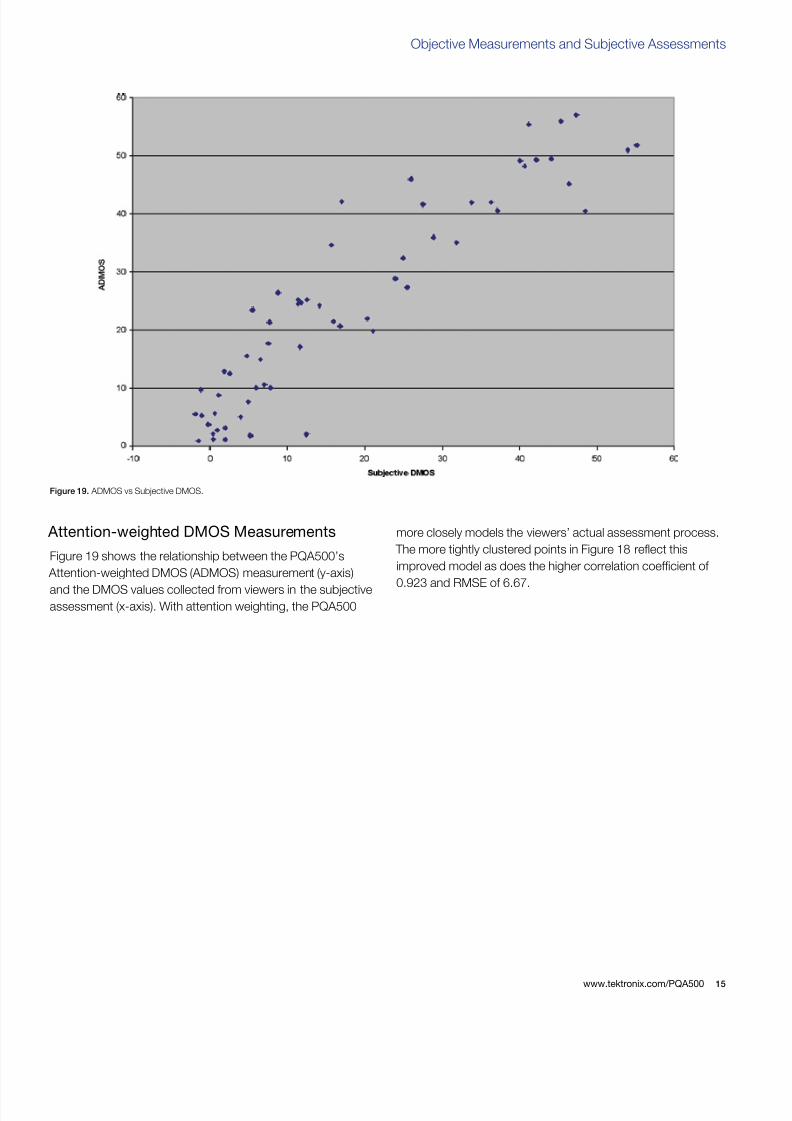
Attention-weighted DMOS Measurements
Figure 19 shows the relationship between the PQA500’s
Attention-weighted DMOS (ADMOS) measurement (y-axis)
and the DMOS values collected from viewers in the subjectiveassessment (x-axis). With attention weighting, the PQA500
more closely models the viewers’ actual assessment process.
The more tightly clustered points in Figure 18 reect this
improved model as does the higher correlation coefcient of
0.923 and RMSE of 6.67.
Figure 19. ADMOS vs Subjective DMOS.
www.tektronix.com/PQA500

8/6/2019 Objective Measurements and Subjetive Assessments
http://slidepdf.com/reader/full/objective-measurements-and-subjetive-assessments 16/20
Application Note
Attention-weighted DMOS Measurementswithout Outliers
The two ADMOS measurement results red circled in Figure 20
diverged signicantly from the other ADMOS measurements.In the video sequences that produced these “outlier”
measurements, the primary difference between the reference
and test videos appeared in chrominance rather than
luminance.
Currently, the PQA500’s human vision model does not process
chrominance information, which accounts for the divergent
results for these two outlier sequence scores.
To estimate the performance of this enhanced PQA500, the
outliers were removed from the dataset and the correlation
was recalculated. This approach also provides a correlation of
the PQA500’s current ADMOS measurements for most typical
situations where luminance dominates the difference between
reference and test video. With this reduced data set, the
PQA500’s ADMOS measurement had a correlation coefcient
of 0.935 and RMSE of 6.11.
Figure 20. ADMOS without 2 outlier vs Subjective DMOS.
www.tektronix.com/PQA50016

8/6/2019 Objective Measurements and Subjetive Assessments
http://slidepdf.com/reader/full/objective-measurements-and-subjetive-assessments 17/20
17
Objective Measurements and Subjective Assessments
Attention-weighted DMOS Measurements(Pre-confgured)
The ADMOS measurement described above had parameter
modications based on the precongured measurement,“010 HD Broadcast ADMOS measurement.” Here, the original
“010 HD Broadcast ADMOS measurement,” was used without
any modication and compared with another set of ADMOS
measurements with the proper parameter modications
matching the environment that was used for the subjective
evaluation.
Figure 21 shows the relationship between the PQA500’s
precongured Attention-weighted DMOS (ADMOS)
measurement (y-axis) and the DMOS values collected from
viewers in the subjective assessment (x-axis). It shows
correlation coefcient of 0.912 and RMSE of 10.91 without 2outliners described above. A correlation coefcient difference
of 0.02 from the ADMOS without outliners would not usually
be considered as a big difference. However, the difference
of 4.80 of RMSE couldn't be ignored. The error variation of
ADMOS without user conguration was up to 1.8 times bigger
than ADMOS with proper conguration. This measurement
also created a new outliner red colored in Figure 20 due to the
different parameter in the perceptual difference node from one
in the ADMOS with proper conguration.
This result shows the importance of setting the parameters
in the measurement appropriately in order to get highly
accurate objective measurement result that tightly match
subjective assessments. PQA500 users are encouraged to
set the parameters of an “assumed hypothetical subjective
assessment” into the user conguration areas in order to
better meet the requirement of the application.
Figure 21. Pre-congured ADMOS vs Subjective DMOS.
www.tektronix.com/PQA500
8/6/2019 Objective Measurements and Subjetive Assessments
http://slidepdf.com/reader/full/objective-measurements-and-subjetive-assessments 18/20
Application Note
Conclusion
To address the conicting demands, engineering and quality
assurance teams need solutions that help them efciently
and effectively optimize picture quality in their video products
and systems. Subjective assessments are too slow and
costly. Objective picture quality measurements can offer the
needed speed at a reasonable cost. We have shown that the
PQA500’s perceptual-based picture quality measurements
do match subjective viewer assessment. This comparison
was performed on 1080-line video processed with H.264
encoding, but the same process can be applied to other video
formats and processing. Done properly, these comparisons
will show a high correlation between PQA500 measurement
results and scores collected in formal subjective assessments.
Properly comparing PQA500 measurement results to
subjective assessment involves consideration of several
factors:
Selected video data set and the detail of conducted
subjective assessment
Quality of subjective assessments
Conguring measurement to account for display and
viewing conditions
Using Attention model
Attention to these factors can lead to correlations with
subjective assessment above 0.9.
The PQA provides repeatable objective measurements are
shown to correlate well with subjective viewer trials. This
means that manufacturer can use the PQA500 during the
development of their algorithms to effectively ensure that their
design produces the highest possible picture quality.
By using the PQA500 test can be carried our quickly atmultiple stages during the design process to validate the
picture quality produce by the device.
Consumers today are demand the best possible picture quality
and with high resolution display are able to discern more easily
picture quality artifacts. Therefore manufacturers and engineers
need to ensure that their device produce the best quality
picture output to make their product produce a pleasing image
to the viewer. The PQA500 provides consumer/professional
video manufacturers with a repeatable method of measuring
the picture quality and ensuring changes to the design do not
degrade the picture quality of their device.
For broadcasters and network operators being able to dene
delivery specication which give the best picture quality to the
viewer will ensure that their program/network will standout
from the rest.
Video content providers are now being asked to produce
their content in a wider array of formats for a variety of device
applications. Within these applications it is important that the
picture quality in HD has the same impact as that delivered
to the user on a mobile phone. By using the PQA500 video
content providers can evaluate the various compression and
delivery formats to ensure the best possible picture quality of
the program.
www.tektronix.com/PQA50018
8/6/2019 Objective Measurements and Subjetive Assessments
http://slidepdf.com/reader/full/objective-measurements-and-subjetive-assessments 19/20
19
Objective Measurements and Subjective Assessments
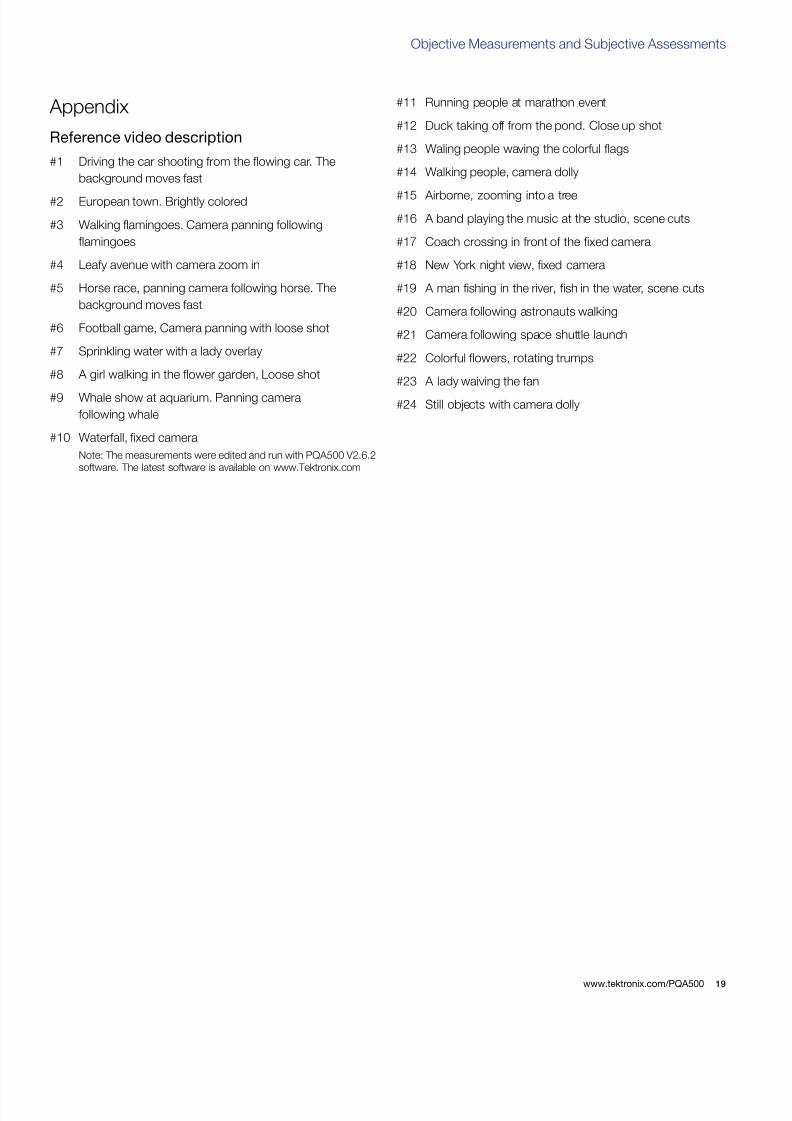
Appendix
Reerence video description
#1 Driving the car shooting from the owing car. The
background moves fast
#2 European town. Brightly colored
#3 Walking amingoes. Camera panning following
amingoes
#4 Leafy avenue with camera zoom in
#5 Horse race, panning camera following horse. The
background moves fast
#6 Football game, Camera panning with loose shot
#7 Sprinkling water with a lady overlay
#8 A girl walking in the ower garden, Loose shot
#9 Whale show at aquarium. Panning camera
following whale
#10 Waterfall, xed camera
Note: The measurements were edited and run with PQA500 V2.6.2
software. The latest software is available on www.Tektronix.com
#11 Running people at marathon event
#12 Duck taking off from the pond. Close up shot
#13 Waling people waving the colorful ags
#14 Walking people, camera dolly
#15 Airborne, zooming into a tree
#16 A band playing the music at the studio, scene cuts
#17 Coach crossing in front of the xed camera
#18 New York night view, xed camera
#19 A man shing in the river, sh in the water, scene cuts
#20 Camera following astronauts walking
#21 Camera following space shuttle launch
#22 Colorful owers, rotating trumps
#23 A lady waiving the fan
#24 Still objects with camera dolly
www.tektronix.com/PQA500
8/6/2019 Objective Measurements and Subjetive Assessments
http://slidepdf.com/reader/full/objective-measurements-and-subjetive-assessments 20/20
Copyright © 2009/2010, Tektronix. All rights reserved. Tektronix products are
covered by U.S. and foreign patents, issued and pending. Information in this
publication supersedes that in all previously published material. Specication
and price change privileges reserved. TEKTRONIX and TEK are registeredtrademarks of Tektronix, Inc. All other trade names referenced are the service
marks, trademarks or registered trademarks of their respective companies.
12/09 EA/POD 28W-24876-
TEK0526
For Further Information
Tektronix maintains a comprehensive, constantly expanding collection o
application notes, technical briefs and other resources to help engineers
working on the cutting edge of technology. Please visit www.tektronix.com
Contact Tektronix
ASEAN / Australasia (65) 6356 390
Austria 00800 2255 4835
Balkans, Israel, South Africa and other ISE Countries +41 52 675 377
Belgium 00800 2255 4835
Brazil +55 (11) 3759 760
Canada 1 (800) 833-920
Central East Europe, Ukraine and the Baltics +41 52 675 377
Central Europe & Greece +41 52 675 377
Denmark +45 80 88 140
Finland +41 52 675 377
France 00800 2255 4835
Germany 00800 2255 4835
Hong Kong 400-820-583
India (91) 80-4292260
Italy 00800 2255 4835
Japan 81 (3) 6714-301
Luxembourg +41 52 675 377
Mexico, Central/South America & Caribbean 52 (55) 53 35 10 85
Middle East, Asia and North Africa +41 52 675 377
The Netherlands 00800 2255 4835
Norway 800 1609
People’s Republic of China 400-820-583
Poland +41 52 675 377Portugal 80 08 12370
Republic of Korea 82 (2) 6917-500
Russia & CIS +7 (495) 748490
South Africa +27 11 206 836
Spain 00800 2255 4835
Sweden 00800 2255 4835
Switzerland 00800 2255 4835
Taiwan 886 (2) 2722-9622
United Kingdom & Ireland 00800 2255 4835
USA 1 (800) 833-920
* European toll-free number. If not accessible, call: +41 52 675 3777
Contact List Updated 09 December 2009