EJournals from the Library Directors Viewpoint Sue McKnight 29 June 2007.
IntroductionInsufficiency of pancreas exocrine function leads to malnutri-tion and causes a worse prognosis in patients with chronic pan-creatitis or pancreatic cancer. Therefore, it is important to un-derstand the mechanism of malnutrition, especially in patientswith pancreatic disease [1, 2]. The pancreas and small intestineplay central roles in digestion and absorption of nutrients, and a
close interaction between these organs is likely. For example,pancreatic juice containing digestive enzymes is considered tobe an important factor for small intestinal villous growth [3, 4].However, since an endoscopic approach to the small intestine isanatomically difficult, there are only a few studies on the inter-action of these organs, and most interactions in humans havenot been defined [4, 5].
Objective evaluation of blood flow in the small-intestinal villous:quantification of findings from dynamic endoscopy withconcomitant narrow-band imaging
Authors
Tomoaki Takeyama1, Yoshiki Hirooka2, Hiroki Kawashima1, Eizaburo Ohno1, Takuya Ishikawa1, Takeshi Yamamura1,
Kazuhiro Furukawa1, Kohei Funasaka2, Masanao Nakamura3, Ryoji Miyahara1, Masatoshi ishigami1, Hidemi Goto1
Institutions
1 Department of Gastroenterology and Hepatology,
Nagoya University Graduate School of Medicine,
Nagoya, Aichi, Japan
2 Department of Endoscopy, Nagoya University Hospital,
Nagoya, Aichi, Japan
3 Department of Internal Medicine, Division of
Therapeutic Medicine, Nagoya University Graduate
School of Medicine, Nagoya, Aichi, Japan
submitted 23.11.2017
accepted after revision 9.4.2018
Bibliography
DOI https://doi.org/10.1055/a-0619-4965 |
Endoscopy International Open 2018; 06: E941–E949
© Georg Thieme Verlag KG Stuttgart · New York
ISSN 2364-3722
Corresponding author
Yoshiki Hirooka, Department of Endoscopy, Nagoya
University Hospital, 65, Tsuruma-Cho, Showa-Ku, Nagoya,
Aichi 466-8550, Japan
Fax: +81-52-7358806
ABSTRACT
Background and aims We have previously shown that the
increase in blood flow volume in jejunum villi after spraying
of 10% dextrose solution correlates with pancreatic exo-
crine function (PEF). The aim of this study was to establish
an objective method to evaluate the amount of jejunum vil-
lous blood flow using a novel image analysis system.
Patients and methods The subjects were 26 patients who
underwent upper gastrointestinal endoscopy with a newly
developed small intestine endoscope (SIF-Y0007, Olympus,
Tokyo, Japan). By defining the ratio of capillary occupancy
in each villus at levels from 1 to 5, villous blood flow was
evaluated subjectively on the villous blood flow scale
(VBFS). Objective evaluation was performed based on lumi-
nance analysis. The morphological opening process was
used to make images with leveled brightness. A histogram
was prepared from the luminance information and the
standard deviation was determined and defined as SDOV
(Standard Deviation calculated from a histogram made by
luminance analysis Of Villi). PEF was evaluated by measur-
ing the BT-PABA (N-benzoyl-L-tyrosyl-p-aminobenzoic
acid) excretion rate.
Results There was a significant positive correlation be-
tween VBFS and SDOV (P <0.0001, ρ=0.5882). SDOV was
also positively correlated with PEF (P=0.0004, ρ=0.6421).Conclusions SDOV is a new objective index for evaluation
of blood flow volume in jejunum villi. SDOV may be useful in
clinical practice to estimate PEF and for clarification of the
mechanisms underlying the functional correlation between
the pancreas and small intestine.
University Hospital Medical Network Clinical Trials Registry
UMIN000014200
TRIAL REGISTRATION: Retrospective, Observational Single-
Center Study UMIN000014200 at http://www.umin.ac.jp
Original article
Takeyama Tomoaki et al. Objective evaluation of… Endoscopy International Open 2018; 06: E941–E949 E941

A prototype endoscope for the small intestine (SIF-Y0002,Olympus, Tokyo, Japan) can be used to observe the proximal je-junum without use of a balloon, and allows morphological eval-uation of villi by biopsy [6]. This approach has shown significantatrophy in small-intestinal villi in patients with chronic pancrea-titis with reduced pancreatic exocrine function (PEF); the villusform was closely correlated with PEF; and incretin-secretingcells, which are also likely to be correlated with PEF, were foundto be expressed in the upper small intestine [6].
Using a recently developed small intestine endoscope (SIF-Y0007, Olympus, Tokyo, Japan) with 80×magnification powerfor optical zooming, the capillary network and blood flow ineach villus can be observed in magnified observation with con-comitant use of narrow-band imaging (NBI) (▶Video 1). In ad-dition, we found that the blood flow volume in villi increasedwhen 10% dextrose solution was applied to the small intestinemucosa (thicker blood vessels and a deeper brown color in theimage were seen in magnified observation with NBI). To clarifythe relationship between this phenomenon and small-intestinalmucosal function, subjective changes in blood flow (changes incolor) before and after spraying dextrose solution were exam-ined in animated observation of endoscopic findings, using anascending scale of 1 to 5. This was defined as the villous bloodflow change. That study showed that villous atrophy had a neg-ative correlation with villous blood flow change and a positivecorrelation with the PABA excretion rate in urine, an index ofPEF (that is, an increase in blood flow was correlated with PEF)[7].
These data indicate that PEF can be measured using magni-fying endoscopy with concomitant use of NBI in small-intestinalmucosa. However, villous blood flow change is based on subjec-tive evaluation, and is not an objective index. Therefore, thecurrent study was performed to develop a method to quantifyblood flow in small-intestinal villi objectively, based on thedepth of brown color in endoscopic findings after processingof images obtained using magnified observation with NBI.
Patients and methodsStudy design
This was a retrospective, observational, open label, single cen-ter, phase I study.
Subjects
Among 30 patients who underwent small intestinal endoscopywith a prototype small intestinal endoscope with a magnifyingfunction (SIF-Y0007, Olympus) from August 2015 to Septem-ber 2016, 26 who could be favorably followed by magnified ob-servation with concomitant NBI were selected as the subjects.The inclusion criteria were patients with pancreatic diseasesuch as pancreatitis and pancreatic cancer or patients withoutpancreatic disease as controls and adults aged≥20 years whogave informed consent to the study and who required uppergastrointestinal tract endoscopy for screening for upper gas-trointestinal disease (e. g. gastric cancer or gastric ulcer). Theexclusion criteria included premenopausal women, patientswith severe malnutrition, a history of surgery for the stomach/duodenum/small intestine, internal administration of antiplate-let drugs or anticoagulants, routine use of NSAIDs, severechronic cardiac failure/chronic renal failure, and no provisionof written informed consent.
Favorable magnified observation was defined as continuousvideo uptake in a 3-minute interval after spraying dextrose so-lution with a sharp focus on the image center and no halation(▶Fig. 1) in the central part of the image taken at the highestmagnification (see ▶Video 1: example of favorable observa-tion; and ▶Video 2: example of inappropriate observation be-cause of halation). Subjects with autoimmune or chronic pan-creatitis were diagnosed based on ICDC2011 [8, 9], and thosewith pancreatic cancer were histopathologically diagnosedwith pancreatic duct cancer by surgery or endoscopic ultra-
▶ Fig. 1 Example of halation (circles). Halation is a phenomenonthat causes whiteout of an image because of the reflection of lightfrom the endoscope.
Video 1 Example of favorable magnified observation with asharp focus on the image center and no halation in the centralpart of the image.
E942 Takeyama Tomoaki et al. Objective evaluation of… Endoscopy International Open 2018; 06: E941–E949
Original article
sound (EUS)-guided fine needle aspiration. Subjects with non-pancreatic disease included those with unexplained abdominalpain, abdominal symptoms such as diarrhea, and a need to re-ceive an endoscopic examination of the upper digestive tractfor preoperative screening for conditions such as gallstones. Inall subjects, the absence of pancreatic disease was shown basedon the results of blood tests, abdominal ultrasonography, andcomputed tomography (CT).
Data collection
Data for sex, date of birth, age, height, and weight were collec-ted for all patients. Blood tests (red blood cell count, hemoglo-bin level, white blood cell count, platelet count) and biochem-ical tests (GOT, GPT, ALP, γGTP, LDH, total bilirubin, AMY, li-pase, elastase 1, total protein, albumin, prealbumin (TTR), reti-nol-binding protein (RBP), vitamin D3 (VitD3), Fe, UIBC, Zn, Mg,ferritin, transferrin, total cholesterol level, LDL cholesterol level,HDL cholesterol level, triglyceride, blood glucose level, HbA1c,INS, C-peptide, IgG, IgA, IgM, IgE, BUN, Cr, Na, Cl, K, Ca, PT,APTT) were performed in all patients. All data were collectedretrospectively.
Pancreatic exocrine function (PEF) test
PEF was evaluated by measuring the PT-PABA excretion rate.This was measured twice and the mean value was used as thePEF value.
Endoscopic examination
The procedure was performed with an improved enteroscopewith 80×magnification function in optical zooming (SIF-Y0007: working length 2000mm, outer diameter 9.2mm, andchannel size 2.8mm; Olympus), which can reach the jejunumwithout balloon assistance. The endoscopy video system wasan Evis Lucera Spectrum (CV-260/CLV-260SL) (Olympus) andthe NBI image was created using the sequential scanning meth-od. Using the SIF-Y0007, push enteroscopy was performed withthe oral method without any overtube or balloon assistance,
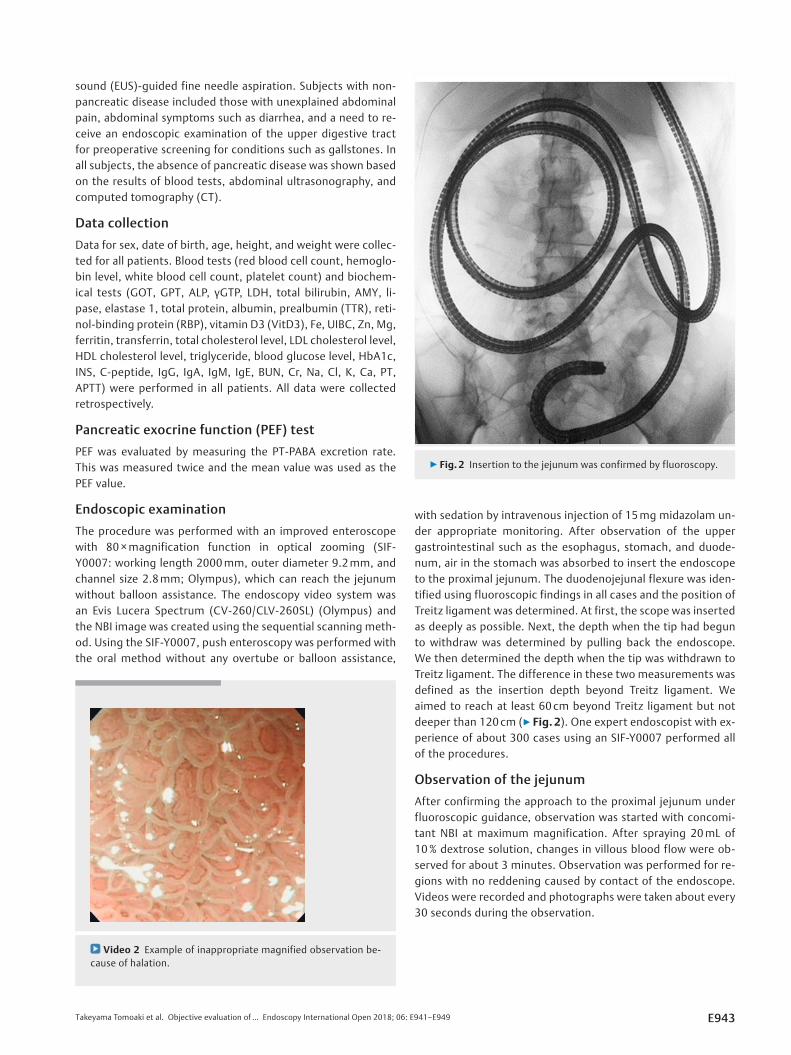
with sedation by intravenous injection of 15mg midazolam un-der appropriate monitoring. After observation of the uppergastrointestinal such as the esophagus, stomach, and duode-num, air in the stomach was absorbed to insert the endoscopeto the proximal jejunum. The duodenojejunal flexure was iden-tified using fluoroscopic findings in all cases and the position ofTreitz ligament was determined. At first, the scope was insertedas deeply as possible. Next, the depth when the tip had begunto withdraw was determined by pulling back the endoscope.We then determined the depth when the tip was withdrawn toTreitz ligament. The difference in these two measurements wasdefined as the insertion depth beyond Treitz ligament. Weaimed to reach at least 60 cm beyond Treitz ligament but notdeeper than 120cm (▶Fig. 2). One expert endoscopist with ex-perience of about 300 cases using an SIF-Y0007 performed allof the procedures.
Observation of the jejunum
After confirming the approach to the proximal jejunum underfluoroscopic guidance, observation was started with concomi-tant NBI at maximum magnification. After spraying 20mL of10% dextrose solution, changes in villous blood flow were ob-served for about 3 minutes. Observation was performed for re-gions with no reddening caused by contact of the endoscope.Videos were recorded and photographs were taken about every30 seconds during the observation.
▶ Fig. 2 Insertion to the jejunum was confirmed by fluoroscopy.
Video 2 Example of inappropriate magnified observation be-cause of halation.
Takeyama Tomoaki et al. Objective evaluation of… Endoscopy International Open 2018; 06: E941–E949 E943
Subjective evaluation of villous blood flow in thesmall intestine using still images: VBFS
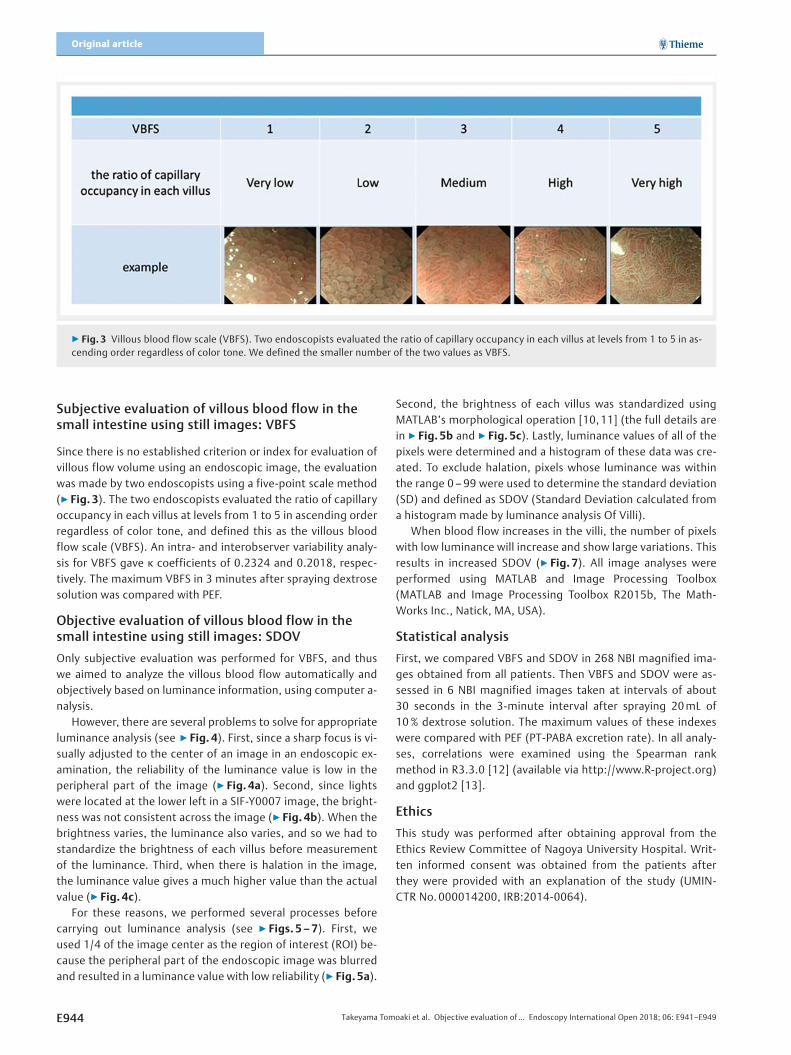
Since there is no established criterion or index for evaluation ofvillous flow volume using an endoscopic image, the evaluationwas made by two endoscopists using a five-point scale method(▶Fig. 3). The two endoscopists evaluated the ratio of capillaryoccupancy in each villus at levels from 1 to 5 in ascending orderregardless of color tone, and defined this as the villous bloodflow scale (VBFS). An intra- and interobserver variability analy-sis for VBFS gave κ coefficients of 0.2324 and 0.2018, respec-tively. The maximum VBFS in 3 minutes after spraying dextrosesolution was compared with PEF.
Objective evaluation of villous blood flow in thesmall intestine using still images: SDOV
Only subjective evaluation was performed for VBFS, and thuswe aimed to analyze the villous blood flow automatically andobjectively based on luminance information, using computer a-nalysis.
However, there are several problems to solve for appropriateluminance analysis (see ▶Fig. 4). First, since a sharp focus is vi-sually adjusted to the center of an image in an endoscopic ex-amination, the reliability of the luminance value is low in theperipheral part of the image (▶Fig. 4a). Second, since lightswere located at the lower left in a SIF-Y0007 image, the bright-ness was not consistent across the image (▶Fig. 4b). When thebrightness varies, the luminance also varies, and so we had tostandardize the brightness of each villus before measurementof the luminance. Third, when there is halation in the image,the luminance value gives a much higher value than the actualvalue (▶Fig. 4c).
For these reasons, we performed several processes beforecarrying out luminance analysis (see ▶Figs. 5–7). First, weused 1/4 of the image center as the region of interest (ROI) be-cause the peripheral part of the endoscopic image was blurredand resulted in a luminance value with low reliability (▶Fig. 5a).
Second, the brightness of each villus was standardized usingMATLAB’s morphological operation [10, 11] (the full details arein ▶Fig. 5b and ▶Fig. 5c). Lastly, luminance values of all of thepixels were determined and a histogram of these data was cre-ated. To exclude halation, pixels whose luminance was withinthe range 0–99 were used to determine the standard deviation(SD) and defined as SDOV (Standard Deviation calculated froma histogram made by luminance analysis Of Villi).
When blood flow increases in the villi, the number of pixelswith low luminance will increase and show large variations. Thisresults in increased SDOV (▶Fig. 7). All image analyses wereperformed using MATLAB and Image Processing Toolbox(MATLAB and Image Processing Toolbox R2015b, The Math-Works Inc., Natick, MA, USA).
Statistical analysis
First, we compared VBFS and SDOV in 268 NBI magnified ima-ges obtained from all patients. Then VBFS and SDOV were as-sessed in 6 NBI magnified images taken at intervals of about30 seconds in the 3-minute interval after spraying 20mL of10 % dextrose solution. The maximum values of these indexeswere compared with PEF (PT-PABA excretion rate). In all analy-ses, correlations were examined using the Spearman rankmethod in R3.3.0 [12] (available via http://www.R-project.org)and ggplot2 [13].
Ethics
This study was performed after obtaining approval from theEthics Review Committee of Nagoya University Hospital. Writ-ten informed consent was obtained from the patients afterthey were provided with an explanation of the study (UMIN-CTR No. 000014200, IRB:2014-0064).
▶ Fig. 3 Villous blood flow scale (VBFS). Two endoscopists evaluated the ratio of capillary occupancy in each villus at levels from 1 to 5 in as-cending order regardless of color tone. We defined the smaller number of the two values as VBFS.
E944 Takeyama Tomoaki et al. Objective evaluation of… Endoscopy International Open 2018; 06: E941–E949
Original article

ResultsPatients
The target diseases were chronic pancreatitis (n =13 subjects),autoimmune pancreatitis (n =5), and pancreatic cancer (n =1).Based on the results of blood tests, abdominal ultrasonogra-phy, and CT, patients without pancreatic disease were used ascontrols (n =7) (▶Table1). There were no cases of suspectedvillous atrophy at the time of recruitment, but villous atrophywas pointed out in some cases as a result of the procedure.
Pancreatic exocrine function (PEF) test
The median (IQR) value of PT-PABA excretion rate, which wasmeasured twice, was 54.4% (46.52–76.88%).
Evaluation of small-intestinal villous blood flowbased on endoscopic images
In tests on 26 subjects, 4 NBI magnified images were taken be-fore application of 10% dextrose solution, and 6 NBI magnifiedimages were taken every 30 seconds in the 3-minute intervalafter application of dextrose solution. In total, 268 imageswere taken, including 112 and 156 images taken before andafter dextrose application, respectively. Evaluation of these
▶ Fig. 4 a The peripheral part of the endoscopic image is blurred and results in a luminance value with low reliability. Therefore we used 1/4of the image center as the region of interest (ROI). b The brightness was not consistent across the image. Therefore we had to standardize thebrightness of each villus. c Halation (arrows) affects the luminance information since its luminance value is much higher than the actual value.
Takeyama Tomoaki et al. Objective evaluation of… Endoscopy International Open 2018; 06: E941–E949 E945
images gave median (IQR) values of VBFS and SDOV after dex-trose application of 4 (3–4) and 14.33 (12.72–16.89), respec-tively. A comparison of SDOV and VBFS in each of the 268 ima-ges showed a significant positive correlation between theseparameters (P<0.0001, ρ=0.5882) (▶Fig. 8). This correlationshows that data from subjective evaluation are expressed wellby objective data.
Correlation between villous blood flow and PEF
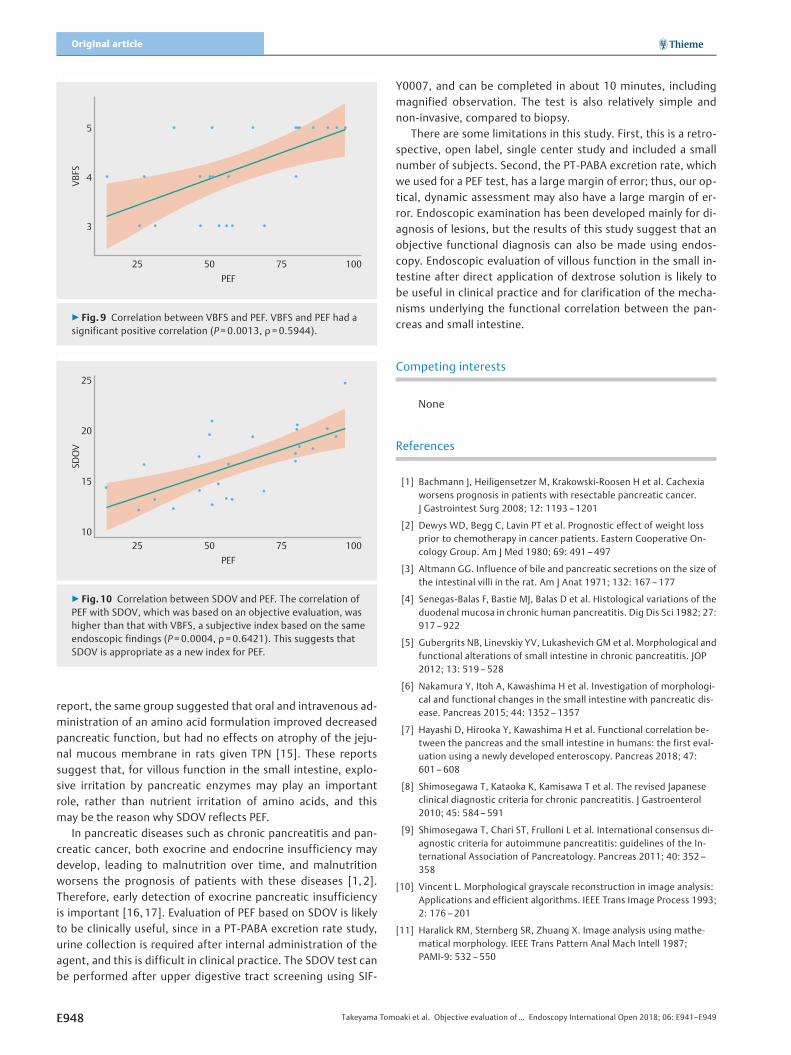
VBFS was examined as a potential index of PEF. VBFS and PEFhad a significant positive correlation (P=0.0013, ρ=0.5944)(▶Fig. 9). This result indicates that PEF can be evaluated usingsubjective evaluation based on still images taken after applica-tion of dextrose solution. The maximum value of SDOV in the 3-minute interval after application of dextrose also showed a sig-nificant positive correlation with PEF (P=0.0004, ρ=0.6421)(▶Fig. 10). The correlation of PEF with SDOV (an objective in-dex), was higher than that with VBFS (a subjective index basedon the same endoscopic findings). This suggests that SDOV isappropriate as a new index for PEF.
DiscussionIn the current study, a newly developed endoscope for the smallintestine, SIF-Y0007, allowed further clarification of organfunction correlation, since this endoscope has an 80×magnifi-cation function and improved insertability. This magnifyingfunction enabled dynamic observation of the reaction of thesmall intestine to direct mucous membrane irritation by disper-sion of nutrients. Dextrose was chosen as the nutrient becauseit is rapidly absorbed in the small intestine, and thus the appro-
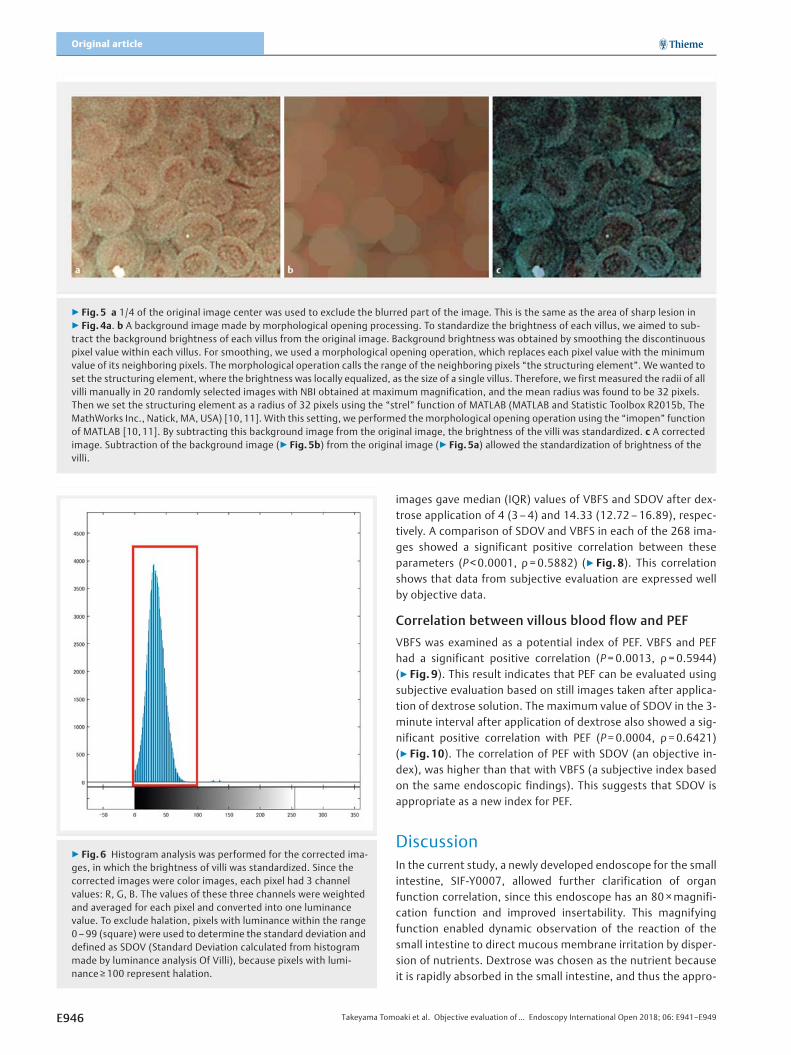
▶ Fig. 5 a 1/4 of the original image center was used to exclude the blurred part of the image. This is the same as the area of sharp lesion in▶ Fig. 4a. b A background image made by morphological opening processing. To standardize the brightness of each villus, we aimed to sub-tract the background brightness of each villus from the original image. Background brightness was obtained by smoothing the discontinuouspixel value within each villus. For smoothing, we used a morphological opening operation, which replaces each pixel value with the minimumvalue of its neighboring pixels. The morphological operation calls the range of the neighboring pixels “the structuring element”. We wanted toset the structuring element, where the brightness was locally equalized, as the size of a single villus. Therefore, we first measured the radii of allvilli manually in 20 randomly selected images with NBI obtained at maximum magnification, and the mean radius was found to be 32 pixels.Then we set the structuring element as a radius of 32 pixels using the “strel” function of MATLAB (MATLAB and Statistic Toolbox R2015b, TheMathWorks Inc., Natick, MA, USA) [10, 11]. With this setting, we performed the morphological opening operation using the “imopen” functionof MATLAB [10, 11]. By subtracting this background image from the original image, the brightness of the villi was standardized. c A correctedimage. Subtraction of the background image (▶ Fig. 5b) from the original image (▶ Fig. 5a) allowed the standardization of brightness of thevilli.
▶ Fig. 6 Histogram analysis was performed for the corrected ima-ges, in which the brightness of villi was standardized. Since thecorrected images were color images, each pixel had 3 channelvalues: R, G, B. The values of these three channels were weightedand averaged for each pixel and converted into one luminancevalue. To exclude halation, pixels with luminance within the range0–99 (square) were used to determine the standard deviation anddefined as SDOV (Standard Deviation calculated from histogrammade by luminance analysis Of Villi), because pixels with lumi-nance≥100 represent halation.
E946 Takeyama Tomoaki et al. Objective evaluation of… Endoscopy International Open 2018; 06: E941–E949
Original article

priate concentration can be determined. A 10% dextrose solu-tion was ultimately used because the villous form could not bemaintained due to the high osmotic pressure produced by adextrose concentration of 20% or higher, causing difficulty inevaluating changes in internal blood flow.
In this study, we found a significant positive correlation be-tween SDOV and PEF. Baumler et al. found that rats receivingtotal parenteral nutrition (TPN) can develop jejunum atrophydue to lack of nutrient irritation in the bowel [14]. In another
▶ Fig. 7 Examples of luminance analysis. When blood flow increases in the villi, the number of pixels with low luminance will increase andshow large variations. This results in an increased standard deviation (SD) obtained from the histogram. Therefore, SD can be used as an ob-jective index of villous blood flow volume. We named the SD as SDOV: SD calculated from histogram made by luminance analysis Of Villi.
▶ Table 1 Patient demographics.
Item Value
Age (range), y 70.5 (61.25– 75.00)1
Sex, M:F 21:5
Disease
▪ Chronic pancreatitis 13
▪ Autoimmune pancreatitis 5
▪ Pancreatic carcinoma 1
▪ Pancreatic cystic disease 4
▪ Others 3
PT-PABA excretion rate (%) 54.4 (46.52– 76.88)1
VBFS (maximum value after sprayingdextrose solution)
4.0 (3.25–5.00)1
SDOV (maximum value after sprayingdextrose solution)
16.92 (14.12–19.40)1
SDOV, Standard Deviation calculated from a histogram made by luminanceanalysis Of Villi; VBFS, villous blood flow scale.1 Interquartile range (IQR).
SDOV10 15 20 25
6
4
2
VBFS
▶ Fig. 8 Correlation between VBFS and SDOV. A comparison ofSDOV and VBFS in each of the 268 images showed a significantpositive correlation between these parameters (P<0.0001,ρ=0.5882).
Takeyama Tomoaki et al. Objective evaluation of… Endoscopy International Open 2018; 06: E941–E949 E947
report, the same group suggested that oral and intravenous ad-ministration of an amino acid formulation improved decreasedpancreatic function, but had no effects on atrophy of the jeju-nal mucous membrane in rats given TPN [15]. These reportssuggest that, for villous function in the small intestine, explo-sive irritation by pancreatic enzymes may play an importantrole, rather than nutrient irritation of amino acids, and thismay be the reason why SDOV reflects PEF.
In pancreatic diseases such as chronic pancreatitis and pan-creatic cancer, both exocrine and endocrine insufficiency maydevelop, leading to malnutrition over time, and malnutritionworsens the prognosis of patients with these diseases [1, 2].Therefore, early detection of exocrine pancreatic insufficiencyis important [16, 17]. Evaluation of PEF based on SDOV is likelyto be clinically useful, since in a PT-PABA excretion rate study,urine collection is required after internal administration of theagent, and this is difficult in clinical practice. The SDOV test canbe performed after upper digestive tract screening using SIF-
Y0007, and can be completed in about 10 minutes, includingmagnified observation. The test is also relatively simple andnon-invasive, compared to biopsy.
There are some limitations in this study. First, this is a retro-spective, open label, single center study and included a smallnumber of subjects. Second, the PT-PABA excretion rate, whichwe used for a PEF test, has a large margin of error; thus, our op-tical, dynamic assessment may also have a large margin of er-ror. Endoscopic examination has been developed mainly for di-agnosis of lesions, but the results of this study suggest that anobjective functional diagnosis can also be made using endos-copy. Endoscopic evaluation of villous function in the small in-testine after direct application of dextrose solution is likely tobe useful in clinical practice and for clarification of the mecha-nisms underlying the functional correlation between the pan-creas and small intestine.
Competing interests
None
References
[1] Bachmann J, Heiligensetzer M, Krakowski-Roosen H et al. Cachexiaworsens prognosis in patients with resectable pancreatic cancer.J Gastrointest Surg 2008; 12: 1193–1201
[2] Dewys WD, Begg C, Lavin PT et al. Prognostic effect of weight lossprior to chemotherapy in cancer patients. Eastern Cooperative On-cology Group. Am J Med 1980; 69: 491–497
[3] Altmann GG. Influence of bile and pancreatic secretions on the size ofthe intestinal villi in the rat. Am J Anat 1971; 132: 167–177
[4] Senegas-Balas F, Bastie MJ, Balas D et al. Histological variations of theduodenal mucosa in chronic human pancreatitis. Dig Dis Sci 1982; 27:917–922
[5] Gubergrits NB, Linevskiy YV, Lukashevich GM et al. Morphological andfunctional alterations of small intestine in chronic pancreatitis. JOP2012; 13: 519–528
[6] Nakamura Y, Itoh A, Kawashima H et al. Investigation of morphologi-cal and functional changes in the small intestine with pancreatic dis-ease. Pancreas 2015; 44: 1352–1357
[7] Hayashi D, Hirooka Y, Kawashima H et al. Functional correlation be-tween the pancreas and the small intestine in humans: the first eval-uation using a newly developed enteroscopy. Pancreas 2018; 47:601–608
[8] Shimosegawa T, Kataoka K, Kamisawa T et al. The revised Japaneseclinical diagnostic criteria for chronic pancreatitis. J Gastroenterol2010; 45: 584–591
[9] Shimosegawa T, Chari ST, Frulloni L et al. International consensus di-agnostic criteria for autoimmune pancreatitis: guidelines of the In-ternational Association of Pancreatology. Pancreas 2011; 40: 352–358
[10] Vincent L. Morphological grayscale reconstruction in image analysis:Applications and efficient algorithms. IEEE Trans Image Process 1993;2: 176–201
[11] Haralick RM, Sternberg SR, Zhuang X. Image analysis using mathe-matical morphology. IEEE Trans Pattern Anal Mach Intell 1987;PAMI-9: 532–550
PEF25 50 75 100
25
20
15
10
SDOV
▶ Fig. 10 Correlation between SDOV and PEF. The correlation ofPEF with SDOV, which was based on an objective evaluation, washigher than that with VBFS, a subjective index based on the sameendoscopic findings (P=0.0004, ρ=0.6421). This suggests thatSDOV is appropriate as a new index for PEF.
PEF25 50 75 100
5
4
3
VBFS
▶ Fig. 9 Correlation between VBFS and PEF. VBFS and PEF had asignificant positive correlation (P=0.0013, ρ=0.5944).
E948 Takeyama Tomoaki et al. Objective evaluation of… Endoscopy International Open 2018; 06: E941–E949
Original article

[12] Ihaka R, Gentleman R. R: a language for data analysis and graphics.J Comp Graph Stat 1996; 5: 299–314
[13] Wickham H. ggplot2: Elegant graphics for data analysis. New York:Springer-Verlag; 2009
[14] Baumler MD, Nelson DW, Ney DM et al. Loss of exocrine pancreaticstimulation during parenteral feeding suppresses digestive enzymeexpression and induces Hsp70 expression. Am J Physiol GastrointestLiver Physiol 2007; 292: G857–866
[15] Baumler MD, Koopmann MC, Thomas DD et al. Intravenous or luminalamino acids are insufficient to maintain pancreatic growth and di-gestive enzyme expression in the absence of intact dietary protein.Am J Physiol Gastrointest Liver Physiol 2010; 299: G338–347
[16] Rasmussen HH, Irtun O, Olesen SS et al. Nutrition in chronic pancrea-titis. World J Gastroenterol 2013; 19: 7267–7275
[17] Gilliland TM, Villafane-Ferriol N, Shah KP et al. Nutritional and meta-bolic derangements in pancreatic cancer and pancreatic resection.Nutrients 2017; 9: E243
Takeyama Tomoaki et al. Objective evaluation of… Endoscopy International Open 2018; 06: E941–E949 E949