Obesity Indicators: Monitoring Progress for the … · Obesity Indicators Monitoring Progress for...
36
1 Obesity Indicators Monitoring Progress for the Prevention of Obesity Route Map December 2016 report Key points In 2015, 65% of adults aged 16 and over were overweight, including 29% who were obese. Levels of overweight and obesity increased between 1995 and 2008, but have remained relatively stable since then. Since 1998, the proportion of children at risk of overweight (including obesity) has fluctuated between 28% and 33%. In 2015, 28% of children were at risk of overweight, including 15% at risk of obesity. At the end of 2015, there were 284,122 people diagnosed with diabetes in Scotland recorded on local diabetes registers. Of all cases, 88.3% (250,881) were Type 2 diabetes. Prevalence of Type 2 diabetes continues to increase steadily. Sixty three percent of adults aged 16 and over met the current moderate/vigorous physical activity (MVPA) guideline. There has been no significant change to this proportion since 2012. Seventy three percent of children are active for an average of 60 minutes per day (including school-based activity). Trends in physical activity for children have fluctuated over the years but are similar in 2015 and 2008. In 2014, the percentage of food energy contributed by added sugars (14.1%) remained higher than the Scottish Dietary Goal of less than 11% of food energy. Between 2010 and 2014, the volume of sales of regular soft drinks reduced, while sales of confectionery, biscuits, cakes and pastries remained relatively unchanged.
Transcript of Obesity Indicators: Monitoring Progress for the … · Obesity Indicators Monitoring Progress for...

1
Obesity Indicators
Monitoring Progress for the Prevention of Obesity Route Map
December 2016 report
Key points
In 2015, 65% of adults aged 16 and over were overweight, including 29% whowere obese. Levels of overweight and obesity increased between 1995 and2008, but have remained relatively stable since then.
Since 1998, the proportion of children at risk of overweight (including obesity)has fluctuated between 28% and 33%. In 2015, 28% of children were at risk ofoverweight, including 15% at risk of obesity.
At the end of 2015, there were 284,122 people diagnosed with diabetes inScotland recorded on local diabetes registers. Of all cases, 88.3% (250,881)were Type 2 diabetes. Prevalence of Type 2 diabetes continues to increasesteadily.
Sixty three percent of adults aged 16 and over met the currentmoderate/vigorous physical activity (MVPA) guideline. There has been nosignificant change to this proportion since 2012.
Seventy three percent of children are active for an average of 60 minutes perday (including school-based activity). Trends in physical activity for childrenhave fluctuated over the years but are similar in 2015 and 2008.
In 2014, the percentage of food energy contributed by added sugars (14.1%)remained higher than the Scottish Dietary Goal of less than 11% of food energy.
Between 2010 and 2014, the volume of sales of regular soft drinks reduced,while sales of confectionery, biscuits, cakes and pastries remained relativelyunchanged.

2
About this publication
This publication reports the latest results for the indicators selected to monitor progress of the Scottish Government’s Prevention of Obesity Route Map. The data for most indicators have been updated to include 2015, although some are more or less recent than this. The indicator framework was informed by NHS Health Scotland’s healthy weight outcomes logic model, and by the Scottish Public Health Network’s Route Map engagement process.
Contents
Prevention of Obesity Route Map Indicator Framework ..................................... 3
Adult overweight and obesity ................................................................................ 4
Children at risk of overweight and obesity ........................................................... 6
Prevalence of Type 2 diabetes ............................................................................... 9
Total and saturated fat .......................................................................................... 11
Added sugars ......................................................................................................... 13
Adult physical activity ........................................................................................... 15
Adult sedentary activity ........................................................................................ 17
Child physical activity ........................................................................................... 19
Child sedentary activity ........................................................................................ 22
HealthyLiving Awards ........................................................................................... 24
Volume of sales of soft drinks with added sugar ............................................... 26
Volume of sales of confectionery, biscuits, cakes and pastries ...................... 28
Adult active travel to work .................................................................................... 30
Child active travel to school ................................................................................. 32
Healthy Working Lives Awards ............................................................................ 34

3
Prevention of Obesity Route Map Indicator
Framework The indicator framework has been informed by NHS Health Scotland’s healthy weight outcomes logic model and by the Scottish Public Health Network’s Route Map engagement process1.
Indicators to monitor implementation and outcomes of the Route Map are wide-ranging, including top-line measures as well as interim indicators of progress. Short-term indicators are presented for uptake of healthy food choices and options for active travel. Intermediate and long-term indicators are used to measure the ultimate outcomes of the Route Map e.g. from behaviour changes in diet and physical activity to securing goals of healthy weight population and health improvements.
The focus of the indicator set is on national measures of progress, but the process of selecting indicators included consideration of measures which could indicate progress at local level.
Obesity Indicator Model
1 * Obesity- A Route Map towards a Healthy Weight Scotland Report of an Engagement Process, Hannah M, Connacher A, Tyrell L, Scottish Public Health Network, July 2010
Energy consumption
Energy Expenditure,
Early Years,
Working Lives
Influenced food intake and physical
activity,
Environment conducive to physical
activity
Majority of population in healthy
weight range throughout adult life,
Improved Health
More options for active travel,
More options for nutritional food,
Smaller less energy dense portions,
Increased knowledge
SHORT–TERM INDICATORS
INTERMEDIATE- TERM INDICATORS
LONG-TERM INDICATORS
i.e. national and
high level outcomes

4
Adult overweight and obesity Indicator Source: Scottish Health Survey
LATEST RESULTS
In 2015, 65% of adults aged 16 and over were overweight, including 29% whowere obese.
There has been an increase in the proportion who are overweight or obeseamong both sexes (aged 16-64) since 1995, from 52% to 62%. Most of thisincrease was seen between 1995 and 2008, with figures remaining broadlystable since then.
Men were more likely than women to be overweight including obese (67%compared to 62%), whereas obesity prevalence was higher among women thanmen (30% compared to 28%).
Overweight (including obesity) prevalence was lowest among young peopleaged 16-24 (42%). A significantly higher proportion of those aged 25-34 wereoverweight (54%), with further increases with age up to age 65-74. Almost threequarters of those aged 55-74 were overweight including obese (74%), as were73% of those in the oldest age group (75+).
Figure 1. Proportion of adults overweight and obese, 1995-2015 (ages 16-64) and 2003 to 2015 (ages 16+)
Although inequalities in overweight prevalence vary by sex and over time,obesity rates are consistently higher in Scotland’s most deprived areascompared to the least deprived (Figure 2). The gap has been particularlypronounced for women in recent years- rates were 34% in the most deprivedareas compared to 20% in the least deprived.

5
Figure 2. Proportion of adults (16+) obese by gender and area deprivation2,
2003-2015
ABOUT THIS INDICATOR
Desired Outcome: Majority of Scotland’s adult population in normal weight range throughout adult life.
Definitions: Overweight – BMI 25+ Obese – BMI 30+
Geography available: National, Health Board.
Equalities data: Breakdowns by most equalities groups are possible. Breakdowns by age, gender and disability (limiting long term illness) are available in SHeS 2015 supplementary tables (http://www.gov.scot/Resource/0050/00505713.xls). Further breakdowns, using SHeS 2008-2011 data, are available in the topic report on equality groups published in October 2012. http://www.scotland.gov.uk/Publications/2012/10/8988
Rationale for including this indicator:
The aim of this indicator is to monitor changes in the proportion of Scotland’s adult population who are overweight and obese. It is used to identify any different patterns (and hence need for specific policy focus) amongst men and women of different ages. It is a long term measure of success of the Route Map.
Factors influencing this indicator:
Diet, physical activity and sedentary behaviour are strongly associated with BMI.
For women, obesity is significantly associated with area-level deprivation (SIMD)but not for men.3
2 Scottish Index of Multiple Deprivation. Chart presents most and least deprived SIMD quintiles.

6
Children at risk of overweight and obesity Indicator Source: Scottish Health Survey LATEST RESULTS
In 2015, 15% of children aged 2 to 15 were at risk of obesity, with a further 13% at risk of overweight.
Since 1998, the proportion of children aged 2-15 at risk of overweight (including obesity) has fluctuated between 29% and 33%, and was 28% in 2015.
In 2015, the figure for those at risk of overweight (including obesity) in girls was higher than for boys (29% compared to 26%), though the reverse was true prior to 2014. A higher proportion of boys were at risk of obesity (15%, compared to 14% of girls).
Prevalence was highest among those children aged 7 to 11 (30%). Of girls this age, 32% were at risk of overweight including obesity. The equivalent figure for boys of the same age was 29%.
Figure 3. Proportion of children (2-15) at risk of overweight and obesity,
1998-2015
3 The Scottish Health Survey Topic Report: Obesity, October 2011 (updated March 2012) http://www.scotland.gov.uk/Publications/2011/10/1138/0
7
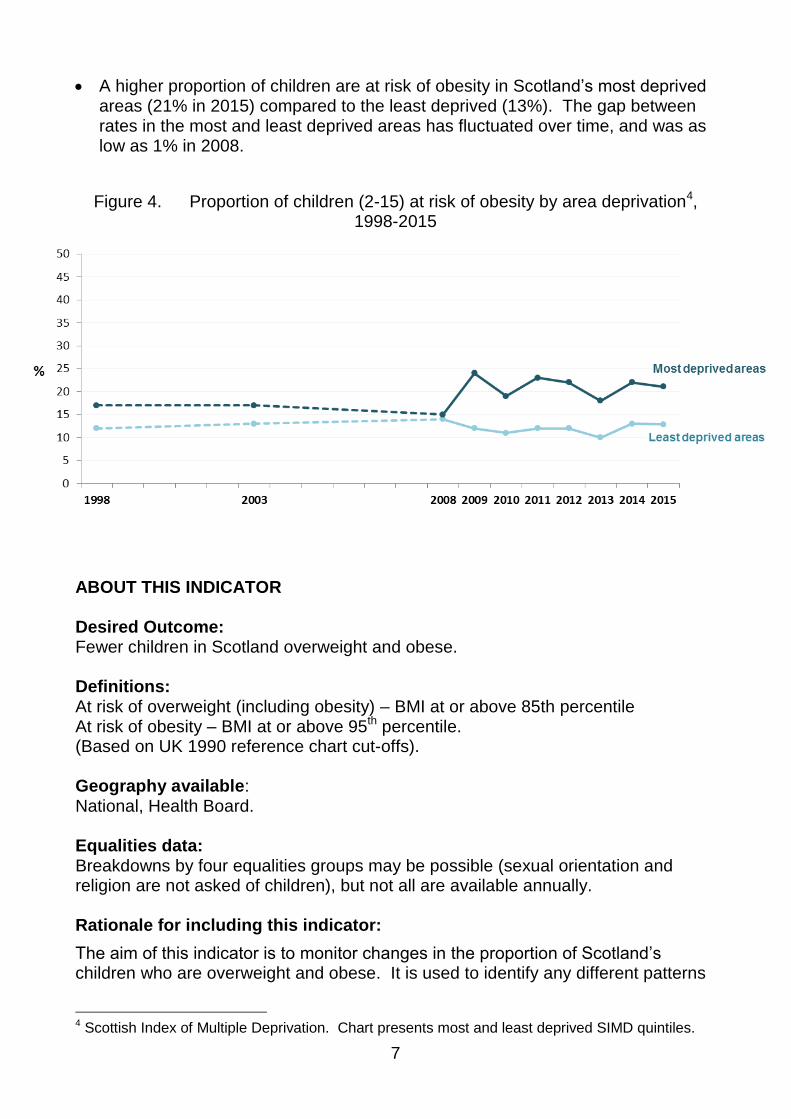
A higher proportion of children are at risk of obesity in Scotland’s most deprivedareas (21% in 2015) compared to the least deprived (13%). The gap betweenrates in the most and least deprived areas has fluctuated over time, and was aslow as 1% in 2008.
Figure 4. Proportion of children (2-15) at risk of obesity by area deprivation4, 1998-2015
ABOUT THIS INDICATOR
Desired Outcome: Fewer children in Scotland overweight and obese.
Definitions: At risk of overweight (including obesity) – BMI at or above 85th percentile At risk of obesity – BMI at or above 95th percentile. (Based on UK 1990 reference chart cut-offs).
Geography available: National, Health Board.
Equalities data: Breakdowns by four equalities groups may be possible (sexual orientation and religion are not asked of children), but not all are available annually.
Rationale for including this indicator:
The aim of this indicator is to monitor changes in the proportion of Scotland’s children who are overweight and obese. It is used to identify any different patterns
4 Scottish Index of Multiple Deprivation. Chart presents most and least deprived SIMD quintiles.

8
(and hence need for specific policy focus) amongst children of different ages. It is a long term measure of success of the Route Map. Factors influencing this indicator5:
Diet, physical activity and sedentary behaviour are strongly associated with BMI.
Parental BMI: children with an obese parent are significantly more likely to be at risk of being overweight including obese than both those with an overweight parent and those with no overweight parent. They are also significantly more likely to be at risk of being obese.
Household income: boys in the lowest income households are more likely than those in other households to be obese. There is no clear association for girls.
5 Based on information from the 2015 SHeS report (chapter 8) and 2011 SHeS Volume 2- children (chapter 5): See http://www.gov.scot/Topics/Statistics/Browse/Health/scottish-health-survey/Publications

9
Prevalence of Type 2 diabetes Indicator Source: Scottish Diabetes Survey LATEST RESULTS
At the end of 2015, there were 284,122 people diagnosed with diabetes in Scotland recorded on local diabetes registers. This represented 5.3% of the population.
Of all cases, 88.3% (250,881) were Type 2 diabetes.
Prevalence of Type 2 diabetes continues to increase steadily6. There were 17,051 new cases of Type 2 diabetes in 2015 and 69,290 since 2012.
In 2015, 31.5% of patients with a recorded BMI and Type 2 diabetes were overweight (BMI 25-30) and a further 55.7% were obese (BMI 30+).
Figure 5. Number of people with a Type 2 diabetes diagnosis, 2001-2015
6 Between 2001 and 2006, the increase in numbers was partly due to improved recording. The increase observed since 2007 is more likely to reflect a real increase in numbers.

10
ABOUT THIS INDICATOR Desired Outcome: Reduced mortality in obesity related disease. Equalities: Breakdowns by gender and age are included in the survey. Ethnic group is collected by the survey but subject to variable response rates and may require several years of data to be combined. Breakdowns by religion, disability and sexual orientation are not available. Geography available: National, Health Board from 2009. Rationale for including this indicator:
The aim of this indicator is to monitor changes in the proportion of Scotland’s population who have Type 2 diabetes. The Scottish Public Health Observatory estimates that almost half of Type 2 diabetes can be attributed to obesity. Diabetes is an important cause of disability and increases the risk of coronary heart disease and other health problems. Complications associated with diabetes include peripheral vascular disease (foot ulcers), which can in turn lead to amputation and diabetic retinopathy- the commonest cause of blindness in working age people. Those with poor glucose control are at increased risk of developing complications.
Type 2 diabetes is more common in deprived areas, and becomes much more common with increasing age. Overweight and obesity are also important risk factors: the risk of Type 2 diabetes is around ten times higher among those with a BMI over 30 compared to those with a BMI under 30. Factors influencing this indicator:
Poor diet (specifically excess energy intake), low levels of physical activity, and the resulting increase in levels of obesity.

11
Total and saturated fat Indicator Source: Food Standards Scotland LATEST RESULTS
In 2014, the percentage of household food energy from all fats was 39.5%, above the recommendation of no more than 35% and relatively stable over time.
The percentage of food energy from saturated fat was 15.3%, compared with the recommendation of no more than 11%.
Figure 6. Proportion of household food energy from fat, 2001-2014

12
ABOUT THIS INDICATOR
Desired Outcome: Reduced energy intake.
Relevant Route Map action: All energy consumption actions.
Indicator Sources:
Food Standards Scotland commissioned analysis of data from the ONS LivingCost and Food Survey. Estimated nutrient intakes are calculated fromhousehold food purchases following secondary analysis to convert purchasedata to mean per capita consumption and nutrient intakes and to allowmeaningful comparisons to be made between years.
Equalities: Information is collected on differences in food and nutrient intake by deprivation (using the Scottish Index of Multiple Deprivation (SIMD)).
Geography available: Population level information is collected on differences in food and nutrient intake by urban/rural classification.
Rationale for including this indicator:
The aim of this indicator is to monitor change in the proportion of the population consuming energy dense foods. Currently people are eating more saturated fat on average than is recommended (FSAS Barton et al, 2010). Prevalence of obesity indicates that energy intakes currently exceed energy requirements. Both these issues raise serious health concerns, particularly in relation to coronary heart disease, high blood pressure, stroke, Type 2 diabetes and certain types of cancers (SHeS).
Recommendations for food and nutrient intake are based on advice from the Committee on Medical Aspects of Food and Nutrition Policy (COMA) and the Scientific Advisory Committee on Nutrition (SACN). Published Dietary Reference Values cover a range of intakes for most nutrients and for fat and saturated fat are set as a percentage of daily energy intake for adults.
Factors influencing this indicator:
Availability, cost, and access to different food types.

13
Added sugars Indicator Source: Food Standards Scotland LATEST RESULTS
The percentage of food energy contributed by added sugars was 14.1% in 2014. Prior to 2011, the figure was relatively stable at between 15% and 16%. There has been little change since the fall to 14% in 2011.
Intakes over this period were higher than the Scottish Dietary Goal of less than 11% of food energy.7
Figure 7. Proportion of household food energy from added sugars, 2001-2014
7 The Scottish Dietary Goal (SDG) has recently been updated (Scottish Government, 2016) and is now that no more than 5% of daily energy intake should be from free sugars. As the data presented precedes this change, this report focuses on the SDG prior to 2016.

14
ABOUT THIS INDICATOR Desired Outcome: Reduced energy intake. Relevant Route Map action: All energy consumption actions. Indicator Source:
Food Standards Scotland commissioned Scottish specific analysis of population level data from the ONS Living Cost and Food Survey.
Equalities: Information is collected on differences in food and nutrient intake by deprivation (using the Scottish Index of Multiple Deprivation (SIMD). Geography available: Population level information is collected on differences in food and nutrient intake by urban/rural classification. Rationale for including this indicator: The aim of this indicator is to monitor change in the proportion of adults and children consuming energy dense foods. As noted above, prevalence of obesity indicates that energy intakes currently exceed energy requirements with associated health problems. Factors influencing this indicator:
Availability, cost, and access to different food types.

15
Adult physical activity8 Indicator Source: Scottish Health Survey
LATEST RESULTS
In 2015, 63% of adults aged 16 and over met the current moderate/vigorousphysical activity (MVPA) guideline. There has been no significant change to thisproportion since 2012.
Men were more likely than women to meet the guideline (67% compared to59%). The gap was widest within the oldest age group: 42% of men aged 75and above met the guideline, compared with 23% of women of the same age.
The proportion of adults meeting the guidelines was highest for those aged 16-24 (75%) and steadily declined with increasing age, with 31% of adults aged 75and above meeting the requirement.
Between 2012 and 2015, the proportion of men meeting the guideline has variedbetween 67% and 71%. Over the same period adherence to the guideline haschanged very little for women (between 58% and 59%).
Figure 8. Proportion of adults (16+) meeting physical activity guidelines,
2008-2015
8 Note that physical activity guidelines changed in 2011. See chapter 6 (physical activity) in the 2012 Scottish Health Survey for more information: http://www.scotland.gov.uk/Publications/2013/09/3684/10
16
ABOUT THIS INDICATOR
Desired Outcome: Increased energy expenditure.
Definition: Accumulation of 150 minutes moderate/ 75 minutes vigorous intensity physical activity (or a combination of both) per week, using 2012 definitions of walking pace, sports and time spent very active at work.
Relevant Route Map action: All energy expenditure actions.
Geography available: National, Health Board.
Equalities data: Breakdowns by most equalities groups are possible. Breakdowns by age, gender and disability (limiting long term illness) are available in SHeS 2015 supplementary tables (http://www.gov.scot/Resource/0050/00505692.xls). Further breakdowns, using SHeS 2008-2011 data, are available in the topic report on equality groups published in October 2012. http://www.scotland.gov.uk/Publications/2012/10/8988
Rationale for including this indicator:
The aim of this indicator is to monitor change in the proportion of adults who meet physical activity guidelines. The current recommendation, detailed above, is designed to promote general health outcomes and weight maintenance. The recommended level of activity for weight loss is higher.
Factors influencing this indicator:
Age and gender: Although men were more likely than women to meet thecurrent guideline, adherence to this differs markedly by age.
Deprivation: Adult activity levels are significantly associated with areadeprivation. In 2015, the age standardised prevalence of adherence to theMVPA guideline was highest among adults in the least deprived areas (71%)and steadily declined with increasing deprivation to 50% among adults in themost deprived areas. This pattern was true for both men and women.

17
Adult sedentary activity Indicator Source: Scottish Health Survey
LATEST RESULTS
In 2015, adults reported sitting in their leisure time for a mean of 5.2 hours onweekdays and 5.9 hours on weekend days. Reported sedentary leisure timewas slightly higher for men than for women (5.3 and 5.1 weekday mean hours,respectively, and 6.1 and 5.8 weekend day mean hours).
Sedentary activity levels varied by age, with those aged 25 to 54 tending tospend the least time sitting both on weekdays and weekend days (mean hoursranging from 4.0 to 4.5 on weekdays and 5.0 to 5.6 hours on weekend days).Older people (aged 65 and over) were the most sedentary on both weekdays(6.6 to 7.2 hours) and weekend days (6.8 to 7.4 hours).
The proportion of adults spending four or more hours sitting at a screen orsimilar display on an average day (excluding time at work) in 2015 was 35%(38% for men, 33% for women).
Figure 9. Proportion of adults (16+) spending four or more hours sitting watching TV/other screen, by gender, 2003-2015

18
ABOUT THIS INDICATOR Desired Outcome: Increased energy expenditure. Definition: Time spent sitting during leisure time (including weekdays and weekends). Relevant Route Map action: Does not map onto specific obesity action but indirectly relates to energy expenditure actions. Geography available: National. Equalities data: Breakdowns by most equalities groups are possible as all are included in the survey. However, some may require several years of data to be combined. Rationale for including this indicator:
The aim of this indicator is to monitor the proportion of adults engaging in sedentary behaviour, such as hours spent sitting at a screen or reading during leisure time. Sedentary time at work is not included in the summary estimates. Factors influencing this indicator:
Choice and availability of leisure activities.

19
Child physical activity Indicator Source: Scottish Health Survey LATEST RESULTS
In 2015, 73% of children were active for an average of 60 minutes per day (including school-based activity). This is a similar proportion to that seen in 2008 and 2009 (71%). Boys (77%) remain more likely than girls (69%) to be active at this level.
Prior to 2008, data were only collected excluding school-based activity. Using this measure, the proportion of children active for an average of 60 minutes per day has fluctuated at between 62% and 70% (the figure in 2015 was 66%).
Boys are generally more physically active at all ages, but the difference is particularly pronounced in the early teenage years. Only 46% of girls aged 13-15 are active for an average of 60 minutes per day (including school based activity), compared to 78% of boys. A similar gap was observed when school-based activity was excluded.
Figure 10. Proportion of children (2-15) active for an average of 60 minutes per
day (including school based activity), by gender, 2008-2015

20
Inequalities in the proportion of children active for an average of 60 minutes per day (including and excluding school based activity) have fluctuated over time.
Figure 11. Proportion of children (2-15) active for an average of 60 minutes per
day (including school based activity), by area deprivation9, 2008-2015
However, sports participation among 2-15 year olds is considerably higher in the least deprived areas (79% in 2015, compared to 55% in the most deprived areas).
ABOUT THIS INDICATOR Desired Outcome: Increased energy expenditure. Definition: Accumulating 1 hour or more of moderate intensity physical activity on average every day of the week. The questions in the Scottish Health Survey were changed in 2008 to include school-based physical activity. It is possible to look at trends since 1998 excluding school-based activity. Relevant Route Map action: Early years actions, specifically less sedentary activities for young children. Geography available: National, Health Board.
9 Scottish Index of Multiple Deprivation. Chart presents most and least deprived SIMD quintiles.

21
Equalities data: Breakdowns by equalities groups are possible but not all are available annually.
Rationale:
The aim of this indicator is to monitor the proportion of children (aged 2-15 years) accumulating 60 minutes or more of moderate intensity physical activity on average every day of the week. Although surveys indicate no significant association between children’s activity and their BMI, research suggests that focusing on physical activity is important as part of a wider weight management strategy for children.
Factors influencing this indicator:
Availability of safe outdoor places.
Access to leisure facilities.
22
Child sedentary activity Indicator Source: Scottish Health Survey LATEST RESULTS
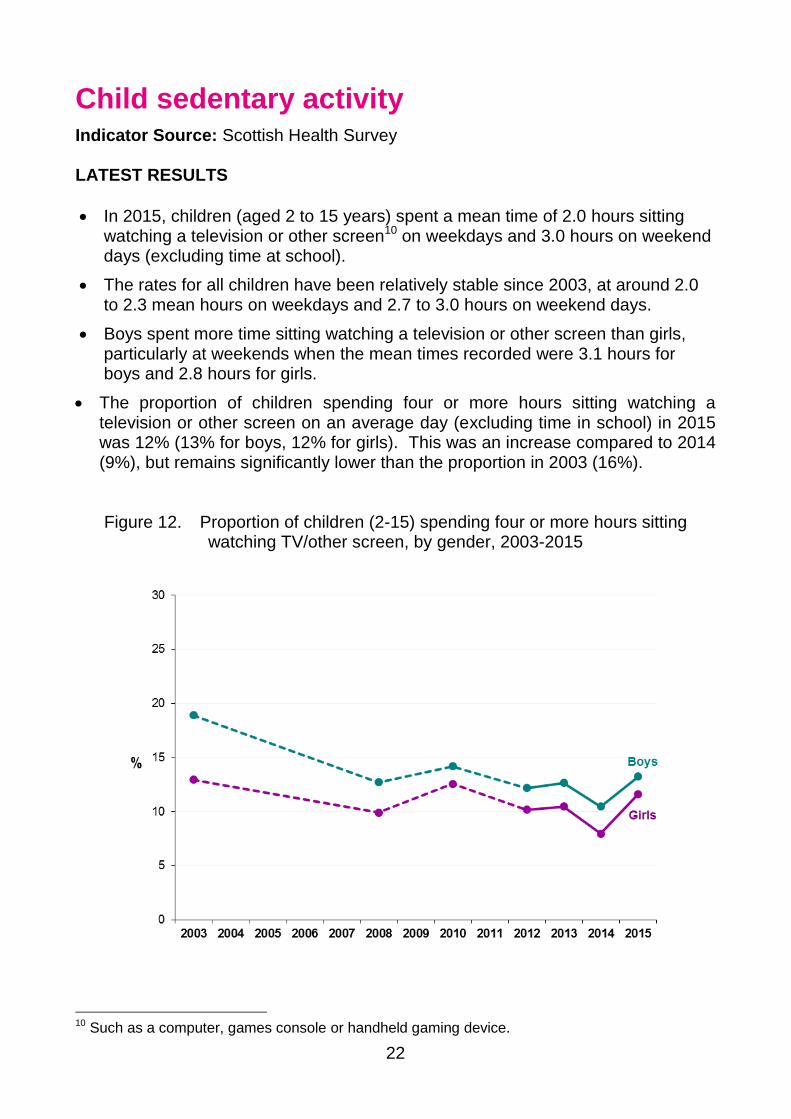
In 2015, children (aged 2 to 15 years) spent a mean time of 2.0 hours sitting watching a television or other screen10 on weekdays and 3.0 hours on weekend days (excluding time at school).
The rates for all children have been relatively stable since 2003, at around 2.0 to 2.3 mean hours on weekdays and 2.7 to 3.0 hours on weekend days.
Boys spent more time sitting watching a television or other screen than girls, particularly at weekends when the mean times recorded were 3.1 hours for boys and 2.8 hours for girls.
The proportion of children spending four or more hours sitting watching a television or other screen on an average day (excluding time in school) in 2015 was 12% (13% for boys, 12% for girls). This was an increase compared to 2014 (9%), but remains significantly lower than the proportion in 2003 (16%). Figure 12. Proportion of children (2-15) spending four or more hours sitting
watching TV/other screen, by gender, 2003-2015
10 Such as a computer, games console or handheld gaming device.
23
ABOUT THIS INDICATOR Desired Outcome: Increased energy expenditure. Definition: Time spent at a screen (TV or other screen such as a computer, games console or handheld gaming device) on an average day (including weekdays and weekends) excluding time at school. Relevant Route Map action: Early years actions, specifically less sedentary activities for young children. Geography available: National. Equalities data: Breakdowns by equalities groups are possible but not all are available annually. Rationale for including this indicator:
The aim of this indicator is to monitor the proportion of children engaging in sedentary behaviour such as hours spent sitting at screen on an average day. Factors influencing this indicator:
Choice of leisure activities.
Availability of alternatives to screen-based activity.
Safe outdoor spaces to play.

24
HealthyLiving Awards Indicator Source: NHS Health Scotland LATEST RESULTS
In October 2016, a total of 776 catering establishments, serving 226,331 customers, held the HealthyLiving Award (HLA) or HLA Plus award.
Of these, 246 are first term HLA awards and 332 are renewed awards. A further 198 establishments hold the HealthyLiving Plus Award.
Table 1. Number of businesses with HealthyLiving Awards
DATE CURRENT AWARDS
FIRST TERM
RENEWALS PLUS
2006 6 6
2007 140 140
2008 374 374
2009 602 496 106
2010 656 353 283 20
2011 675 295 291 89
2012 680 241 315 124
2013 625 185 315 125
2014 686 231 273 182
2015 757 260 294 203
2016 776 246 332 198

25
ABOUT THIS INDICATOR Desired Outcome: Reduced consumption of high energy food and drink in workplaces. Relevant Route Map action: Two actions to encourage participation in HealthyLiving award scheme. Geography available: National Equalities data: Not applicable Rationale for including this indicator
The aim of this indicator is to assess the take-up of HealthyLiving awards by companies. The HealthyLiving Award, introduced in 2006, recognises catering establishments for serving healthier food and finding ways of helping their customers make better food choices. The award is open to all kinds of catering places from sandwich shops to staff restaurants, and increasing the number of establishments with this award will play a part in improving diet across Scotland. For all organisations already participating, the HealthyLiving Award plus offers an opportunity to achieve step increases in the required ratio of healthy options to other options on the menus from participating caterers.
Evidence from existing literature11 suggests a low level of evidence for the effectiveness of consumer targeted incentives but with potentially high levels of population effectiveness. The ScotPHN engagement process for the Route Map12 assessed the action as having high impact with medium to high effort. Factors influencing this indicator:
Exposure to high energy foods.
11 Environmental Scan of Potential Policy Interventions to Tackle Obesogenic Aspects of the Built Environment, Mooney et al 2010 12 Hannah, Connacher and Tyrell, Obesity – A Route Map towards a Healthy Weight Scotland Report of Engagement Process

26
Volume of sales of soft drinks with added
sugar13 Indicator Source: Food Standards Scotland (Kantar Worldpanel)
LATEST RESULTS
Between 2010 and 2014, the volume of regular take home soft drinks14
purchased by Scottish households dropped by 16.8% to 183 million litres.
The volume of carbonated drinks purchased by Scottish households declinedfrom 314 to 290 million litres.
The calorie contribution of carbonated drinks reduced from 32 kilocalories perperson per day in 2010 to 28 kilocalories in 2014.
Figure 13. Sales of soft drinks, 2010-2014
13 Complete 2015 data was not available at the time of publication. 14 ‘Regular soft drinks’ includes juices/fruit drinks, carbonates, squash, and others (such as flavoured milk), but excludes chilled drinks, mineral water and all diet soft drinks.

27
ABOUT THIS INDICATOR Desired Outcome: Reduced consumption of high energy food and drink. Relevant Route Map action: Action to work with the Food Implementation Group to reduce sugar levels and portion sizes. Geography available: Scotland level only. Equalities data: Not applicable. Rationale for including this indicator:
The aim of this indicator is to monitor the volume of sales of soft drinks with added sugar in supermarkets in Scotland. There is evidence of an association between sugar-sweetened soft drinks and prevalence of obesity and interventions in this area have been shown to be effective. Factors influencing this indicator:
Availability and affordability of healthy choices.

28
Volume of sales of confectionery, biscuits,
cakes and pastries15 Indicator Source: Food Standards Scotland (Kantar Worldpanel) LATEST RESULTS
In 2014, the total volume of take home biscuits and confectionery purchased by Scottish households was just over one hundred thousand tonnes (103,000). Sales volumes have remained stable since 2010.
Figure 14. Sales of biscuits and confectionery, 2010-2014
In 2014, just under one billion (981 million) servings of cake and pastry were purchased by Scottish households. Purchases have remained stable since 2011.
Figure 15. Sales of cake and pastry servings, 2011-2014
15 Complete 2015 data was not available at the time of publication.
29
ABOUT THIS INDICATOR
Desired Outcome: Reduced consumption of high energy food and drink.
Relevant Route Map action: Action to work with retailers to encourage stocking of smaller and less energy-dense portions, with the Food Implementation Group to reduce saturated fat and sugar levels.
Geography available: Scotland level only.
Equalities data: Not applicable.
Rationale for including this indicator:
The aim of this indicator is to monitor the sales by volume of confectionery, biscuits, cakes and pastries in supermarkets in Scotland.
There is evidence that obesity is associated with over consumption of energy dense snack foods such as confectionery, biscuits, cakes and pastries. Moderate evidence exists in the literature for interventions aimed at reducing availability and affordability of energy dense foods and with a moderate rating for potential population effectiveness. The ScotPHN engagement process for the Route Map assessed the action as having high impact with medium to high effort.
Factors influencing this indicator:
Availability and affordability of healthy choices

30
Adult active travel to work Indicator Source: Transport Scotland (Transport & Travel in Scotland)
LATEST RESULTS
In 2015, 16% of working adults travelled to work by walking or cycling.
There has been little change in this proportion since 2000, with the figuresfluctuating at around 13% to 16%.
Figure 16. Proportion of adults (16+) walking or cycling to work, 2010-2015

31
ABOUT THIS INDICATOR
Desired Outcome: Promotion of active travel.
Relevant Route Map action: Deliver cycle action plan.
Indicator Source: Transport Scotland: Transport & Travel in Scotland bulletin. Employed adults’ (not working at home) usual method of travel to work.
Geography available: National, Local Authority.
Equalities data: Breakdowns by gender, age and disability possible.
Rationale for including this indicator:
The indicator provides a measure of the extent to which adults are choosing physically active means of travel to work (cycling or walking). The indicator supports actions in the Route Map encouraging employers to support employees to use more active means of travelling to and from work.
A low level of evidence exists in literature for the effectiveness of active travel incentives and facilities with a moderate rating for potential population effectiveness. The ScotPHN engagement process for the Route Map assessed the action as having medium impact with medium to high effort.
Factors influencing this indicator:
Availability of alternative transport options
Employer incentives

32
Child active travel to school Indicator Source: Transport Scotland (Transport & Travel in Scotland)
LATEST RESULTS
In 2015, 50% of school aged children travelled to school by walking or cycling.
This proportion has fluctuated between 50% and 56% since 2000, with no cleartrend.
Figure 17. Proportion of school aged children walking or cycling to school, 2000-2015

33
ABOUT THIS INDICATOR
Desired Outcome: Promotion of active travel.
Relevant Route Map action: Deliver cycle action plan.
Indicator Source: Transport Scotland: Transport & Travel in Scotland bulletin. Pupils in full-time education at school usual method to travel to school.
Geography available: National, Local Authority.
Equalities data: Breakdowns by gender, age and disability possible.
Rationale for including this indicator:
This indicator relates to Route Map actions relating to encouraging opportunities for physical activity and sport including safer routes to schools.
Low level of evidence exists in literature for the effectiveness of active travel incentives and facilities with a moderate rating for potential population effectiveness. The ScotPHN engagement process for the Route Map assessed the action as having medium impact with medium to high effort.
Factors influencing this indicator:
Availability of safe routes to schools.

34
Healthy Working Lives Awards Indicator Source: Scottish Centre for Healthy Working Lives.
LATEST RESULTS
In October 2016 there are currently 1,039 organisations registered for theHealthy Working Lives Award Programme, representing almost 730,000employees.
Of these, 549 organisations have attained at least a Bronze award. A further490 organisations are actively working towards their first award.
Figure 18. Organisations registered for Healthy Working Lives Awards (including awards attained), October 2016

35
ABOUT THIS INDICATOR
Desired Outcome: Promotion of active workplaces.
Relevant Route Map action: Maximise promotion of healthy lives approach in public sector through clear, consistent vision.
Geography available: National, Health Board.
Equalities data: Not applicable.
Rationale for including this indicator:
The aim of this indicator is to assess the take-up of Healthy Working Lives Awards by companies. The indicator will show the level of award (Gold, Silver, Bronze) as well as the number of companies working towards their Bronze award – hence providing both an indication of the general awareness and take-up of the scheme, and the proportion of companies providing the highest level of support.
A high level of evidence exists in literature for the effectiveness of multi-component workplace interventions with a low to moderate rating for potential population effectiveness. The ScotPHN engagement process for the Route Map assessed the action as having high impact with low to medium effort.
Factors influencing this indicator:
Availability and affordability of healthy choices.

36
An Official Statistics publication for Scotland
Official and National Statistics are produced to high professional standards set out in the Code of Practice for Official Statistics. Both undergo regular quality assurance reviews to ensure that they meet customer needs and are produced free from any political interference.
Correspondence and enquiries For enquiries about this publication please contact: Scott Jackson Health & Social Care Analysis Directorate of Population Health DG Health and Social Care Scottish Government Telephone: 0131 244 4098 e-mail: [email protected]
For general enquiries about Scottish Government statistics please contact: Office of the Chief Statistician, Telephone: 0131 244 0442, e-mail: [email protected]
How to access background or source data
The data collected for this statistical bulletin :
☐ are available in more detail through Scottish Neighbourhood Statistics
☐ are available via an alternative route
☒ may be made available on request, subject to consideration of legal and ethical
factors. Please contact [email protected] for further information.
☐ cannot be made available by Scottish Government for further analysis as
Scottish Government is not the data controller.
Complaints and suggestions If you are not satisfied with our service or have any comments or suggestions, please write to the Chief Statistician, 3WR, St Andrew’s House, Edinburgh, EH1 3DG, Telephone: (0131) 244 0302, e-mail [email protected].
If you would like to be consulted about statistical collections or receive notification of publications, please register your interest at www.gov.scot/scotstat Details of forthcoming publications can be found at www.gov.scot/statistics
ISBN 978-1-78652-644-1 (web only)
Crown Copyright You may use or re-use this information (not including logos) free of charge in any format or medium, under the terms of the Open Government Licence. See: www.nationalarchives.gov.uk/doc/open-government-licence/
APS Group Scotland, 21 Tennant Street, Edinburgh EH6 5NA PPDAS81813 (12/16)