Obesity Drives the Metabolic Syndrome in Spinal Cord … · Obesity Drives the Metabolic Syndrome...
98
Obesity Drives the Metabolic Syndrome in Spinal Cord Injury David R. Gater, Jr., MD, Ph.D., M.S. Rocco Ortenzio Chair & Professor Physical Medicine & Rehabilitation Penn State Milton S. Hershey Medical Center Penn State College of Medicine Hershey, PA [email protected]
Transcript of Obesity Drives the Metabolic Syndrome in Spinal Cord … · Obesity Drives the Metabolic Syndrome...
Obesity Drives the Metabolic Syndrome in Spinal Cord Injury
David R. Gater, Jr., MD, Ph.D., M.S.
Rocco Ortenzio Chair & Professor
Physical Medicine & Rehabilitation
Penn State Milton S. Hershey Medical Center
Penn State College of Medicine
Hershey, PA
Disclosures
The presenters of this session have nothing to disclose.
This continuing education activity is managed and accredited by Professional Education Services Group in cooperation with the Paralyzed Veterans of America. Neither PESG nor PVA nor any accrediting organization supports or endorses any product or service mentioned in this activity.
PESG Staff and the Program Planning Committee have no financial interest to disclose.
Commercial Support was not received for this activity.
Objectives
Describe causative and relationship components of the metabolic syndrome
Review the relationship between physical inactivity, body composition and secondary morbidities after SCI
Review nutritional concepts of caloric density and nutrient density in promoting fat loss
Associate various forms of physical activities with long term physical and psychological benefits for those with SCI
Discuss potential risks & benefits of bariatric surgical options for persons with SCI

Objective 1
Describe causative and relationship components of the metabolic syndrome
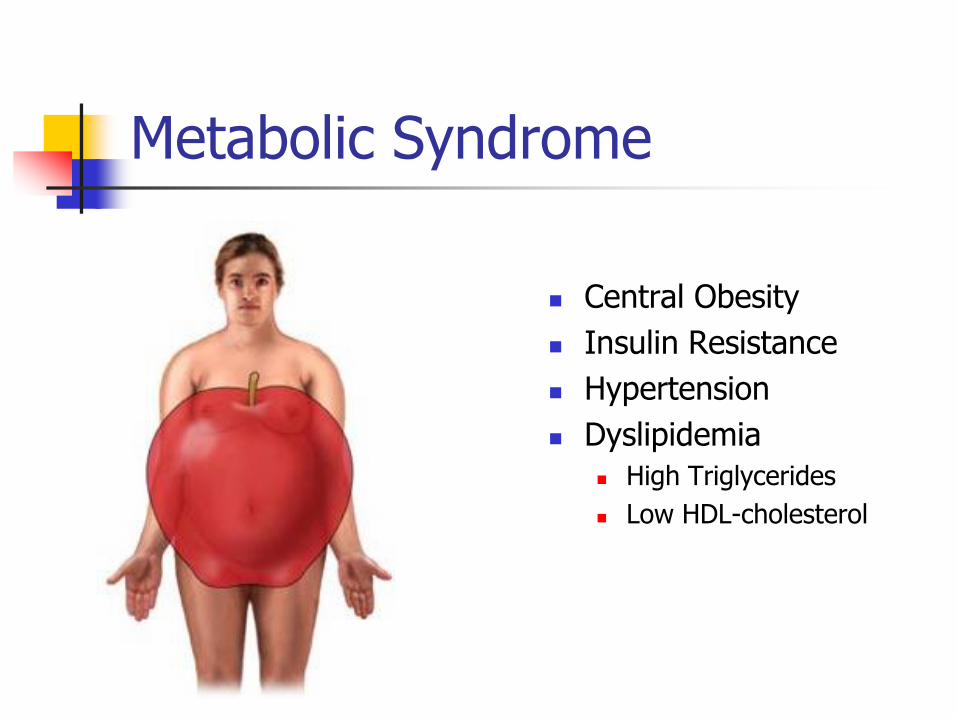
Metabolic Syndrome
Central Obesity
Insulin Resistance
Hypertension
Dyslipidemia
High Triglycerides
Low HDL-cholesterol
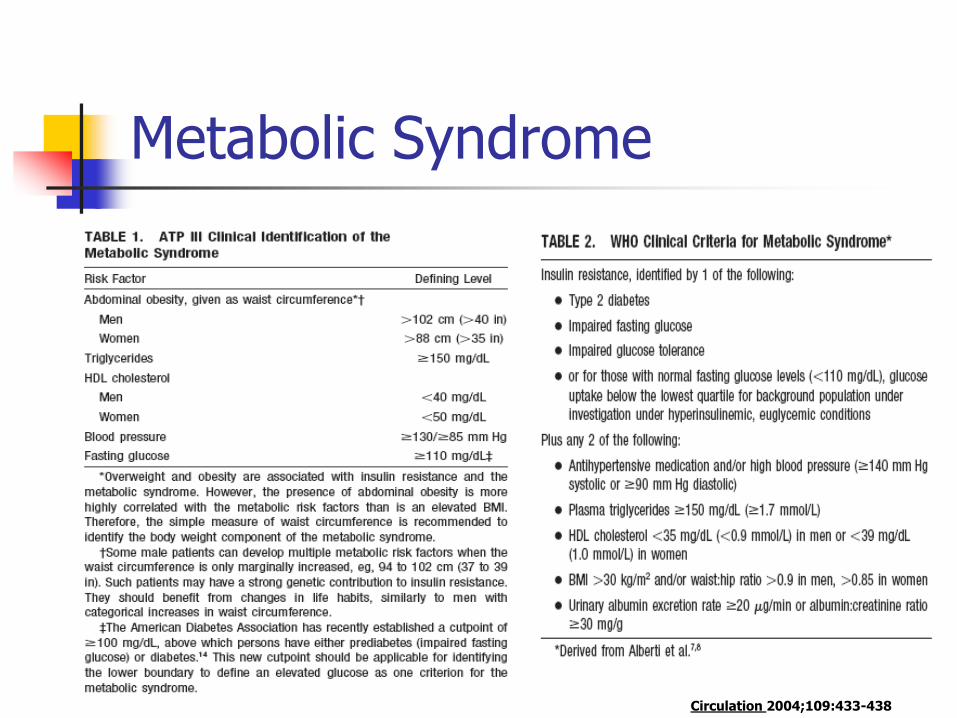
Metabolic Syndrome
Circulation 2004;109:433-438

Metabolic Syndrome: IDF Updated Definition
Central Obesity (Waist Circumference)
European Men ≥94 cm (37”) or US Men ≥102 cm (40”)
European Women ≥ 80 cm (31.5”) or US Women ≥88 cm (34.5”)
Plus any two of the following:
TG ≥150 mg/dl (1.7 mmol/L) or under Rx
Low HDL-cholesterol or under Rx
Men <40 mg/dl (1.03 mmol/L)
Women <50 mg/dl (1.29 mmol/L)
Elevated Blood Pressure or under Rx
SBP ≥130 mmHg or DBP ≥85 mm Hg
Fasting Plasma Glucose ≥100 mg/dl (5.6 mmol/L)
IDF Consensus Panel, August 2005 Holt (2005) Diabetes, Obesity & Metab 7(5):618
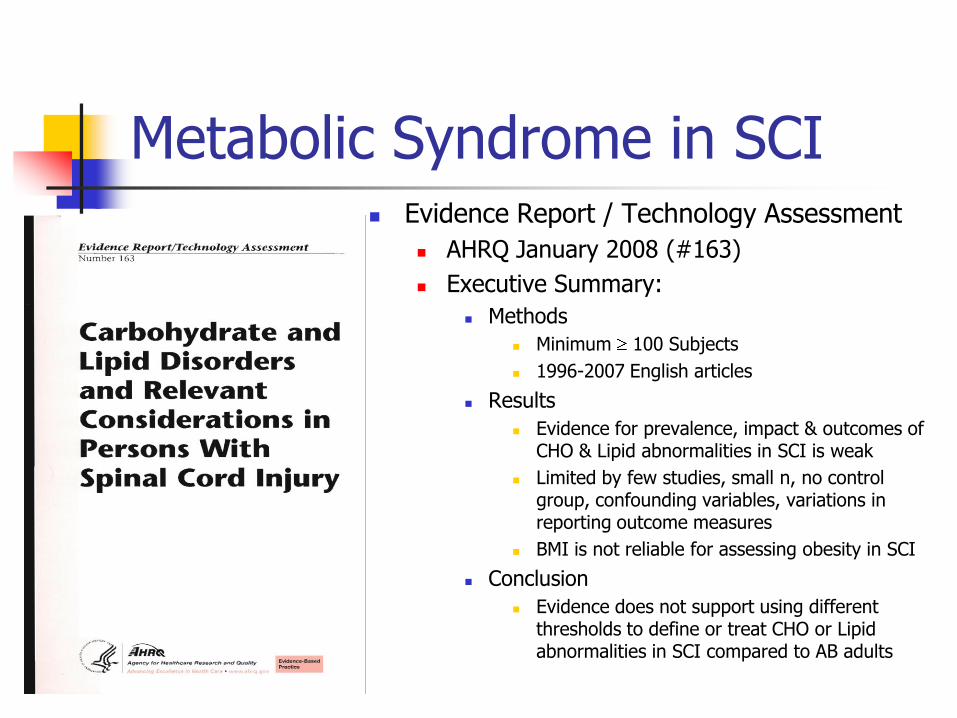
Metabolic Syndrome in SCI Evidence Report / Technology Assessment
AHRQ January 2008 (#163)
Executive Summary:
Methods
Minimum 100 Subjects
1996-2007 English articles
Results
Evidence for prevalence, impact & outcomes of CHO & Lipid abnormalities in SCI is weak
Limited by few studies, small n, no control group, confounding variables, variations in reporting outcome measures
BMI is not reliable for assessing obesity in SCI
Conclusion
Evidence does not support using different thresholds to define or treat CHO or Lipid abnormalities in SCI compared to AB adults
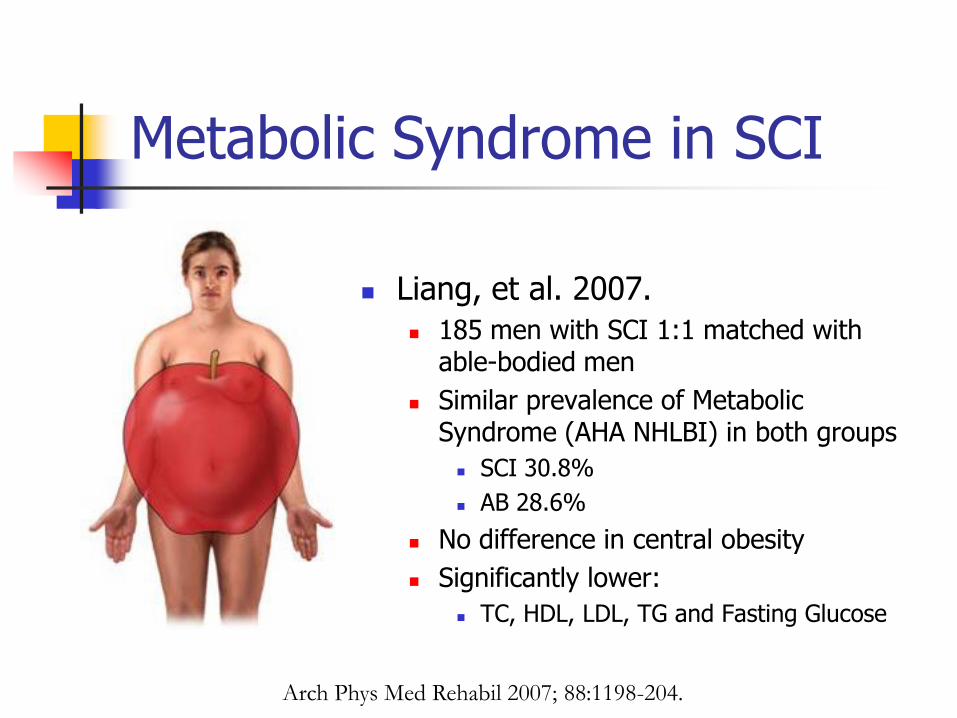
Metabolic Syndrome in SCI
Liang, et al. 2007.
185 men with SCI 1:1 matched with able-bodied men
Similar prevalence of Metabolic Syndrome (AHA NHLBI) in both groups
SCI 30.8%
AB 28.6%
No difference in central obesity
Significantly lower:
TC, HDL, LDL, TG and Fasting Glucose
Arch Phys Med Rehabil 2007; 88:1198-204.
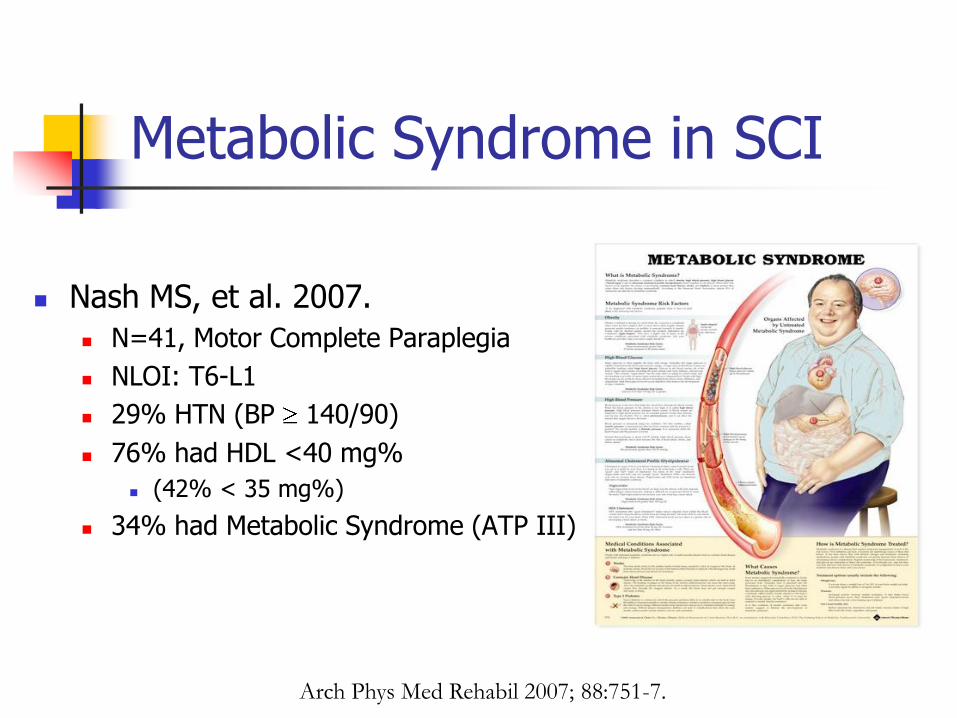
Metabolic Syndrome in SCI
Nash MS, et al. 2007.
N=41, Motor Complete Paraplegia
NLOI: T6-L1
29% HTN (BP 140/90)
76% had HDL <40 mg%
(42% < 35 mg%)
34% had Metabolic Syndrome (ATP III)
Arch Phys Med Rehabil 2007; 88:751-7.
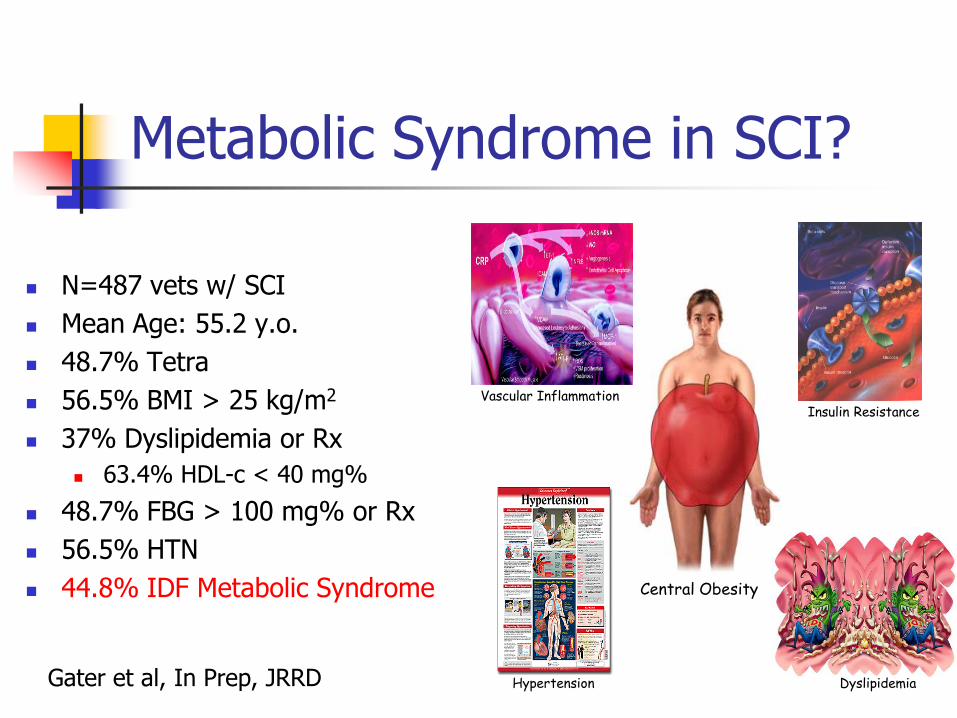
Metabolic Syndrome in SCI?
N=487 vets w/ SCI
Mean Age: 55.2 y.o.
48.7% Tetra
56.5% BMI > 25 kg/m2
37% Dyslipidemia or Rx
63.4% HDL-c < 40 mg%
48.7% FBG > 100 mg% or Rx
56.5% HTN
44.8% IDF Metabolic Syndrome
Insulin Resistance
Central Obesity
Vascular Inflammation
Dyslipidemia Hypertension Gater et al, In Prep, JRRD
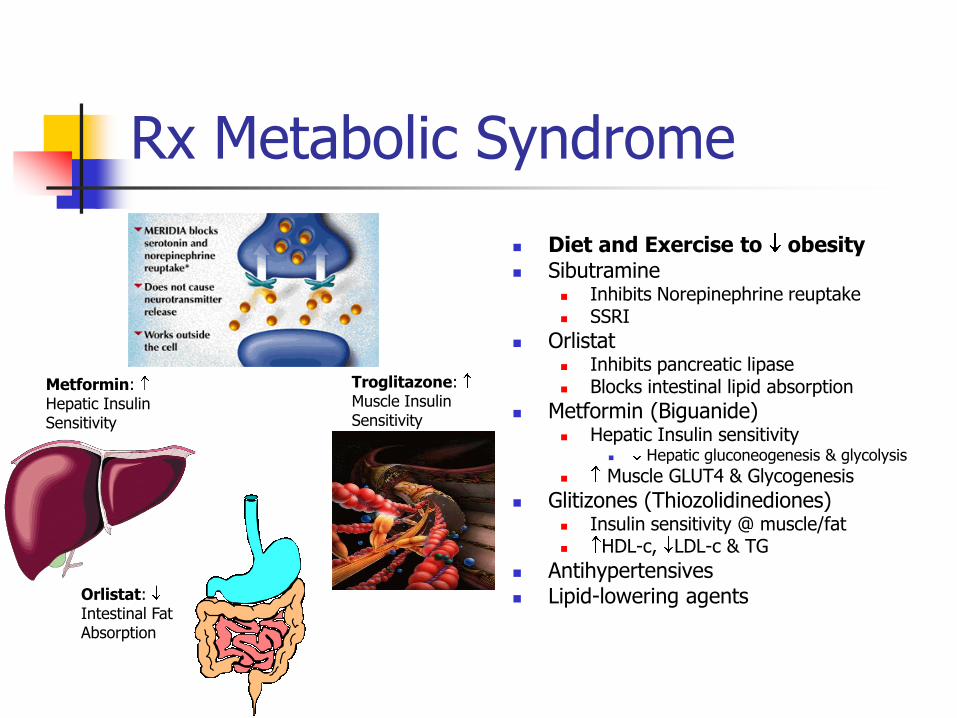
Rx Metabolic Syndrome
Diet and Exercise to obesity Sibutramine
Inhibits Norepinephrine reuptake SSRI
Orlistat Inhibits pancreatic lipase Blocks intestinal lipid absorption
Metformin (Biguanide) Hepatic Insulin sensitivity
Hepatic gluconeogenesis & glycolysis
Muscle GLUT4 & Glycogenesis
Glitizones (Thiozolidinediones) Insulin sensitivity @ muscle/fat HDL-c, LDL-c & TG
Antihypertensives Lipid-lowering agents
Metformin: Hepatic Insulin Sensitivity
Troglitazone: Muscle Insulin Sensitivity
Orlistat: Intestinal Fat Absorption

Dangers of Obesity
Hypertension Dyslipidemia Type 2 (non-insulin
dependent) diabetes Insulin resistance, glucose
intolerance Hyperinsulinemia Coronary heart disease Angina pectoris Congestive heart failure Stroke Gallstones
Cholecystitis & cholelithiasis Gout Osteoarthritis Obstructive sleep apnea Some types of cancer (e.g.,
Breast, Prostate, Colon) Complications of pregnancy Poor female reproductive
health Urinary stress incontinence Uric acid nephrolithiasis Psychological disorders (e.g.
Depression)
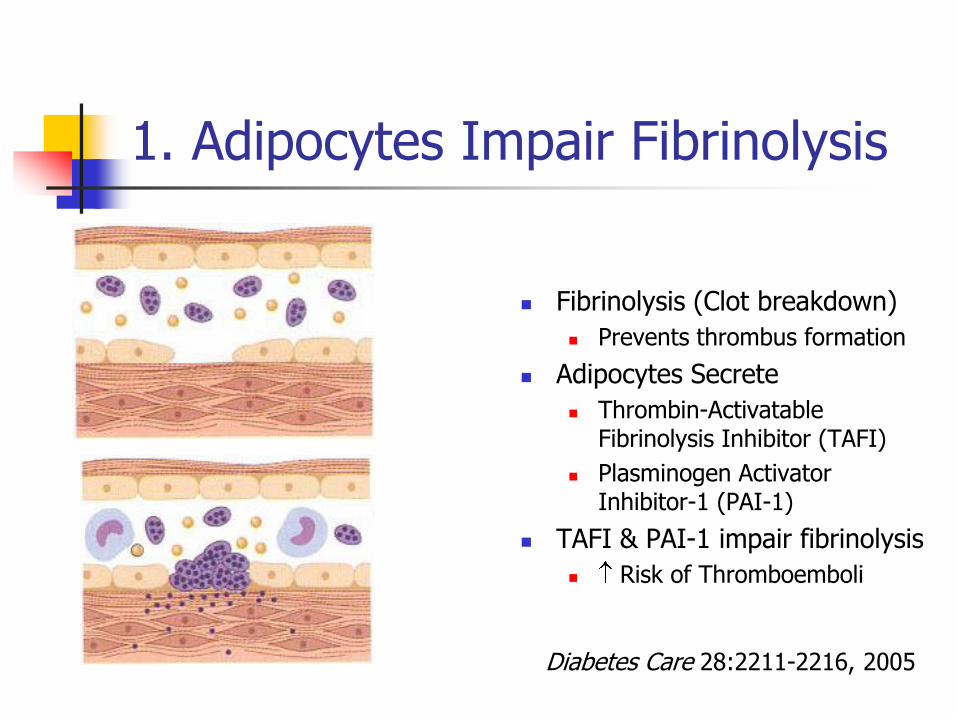
1. Adipocytes Impair Fibrinolysis
Fibrinolysis (Clot breakdown)
Prevents thrombus formation
Adipocytes Secrete
Thrombin-Activatable Fibrinolysis Inhibitor (TAFI)
Plasminogen Activator Inhibitor-1 (PAI-1)
TAFI & PAI-1 impair fibrinolysis
Risk of Thromboemboli
Diabetes Care 28:2211-2216, 2005
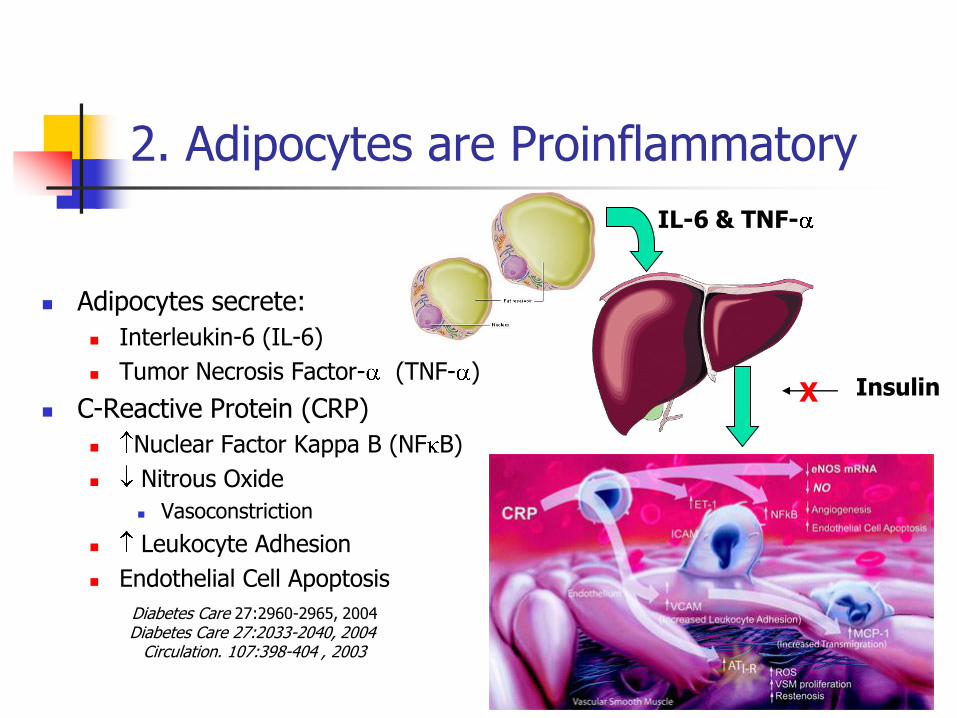
2. Adipocytes are Proinflammatory
Adipocytes secrete:
Interleukin-6 (IL-6)
Tumor Necrosis Factor- (TNF- )
C-Reactive Protein (CRP)
Nuclear Factor Kappa B (NF B)
Nitrous Oxide
Vasoconstriction
Leukocyte Adhesion
Endothelial Cell Apoptosis
Diabetes Care 27:2960-2965, 2004 Diabetes Care 27:2033-2040, 2004
Circulation. 107:398-404 , 2003
IL-6 & TNF-
Insulin X
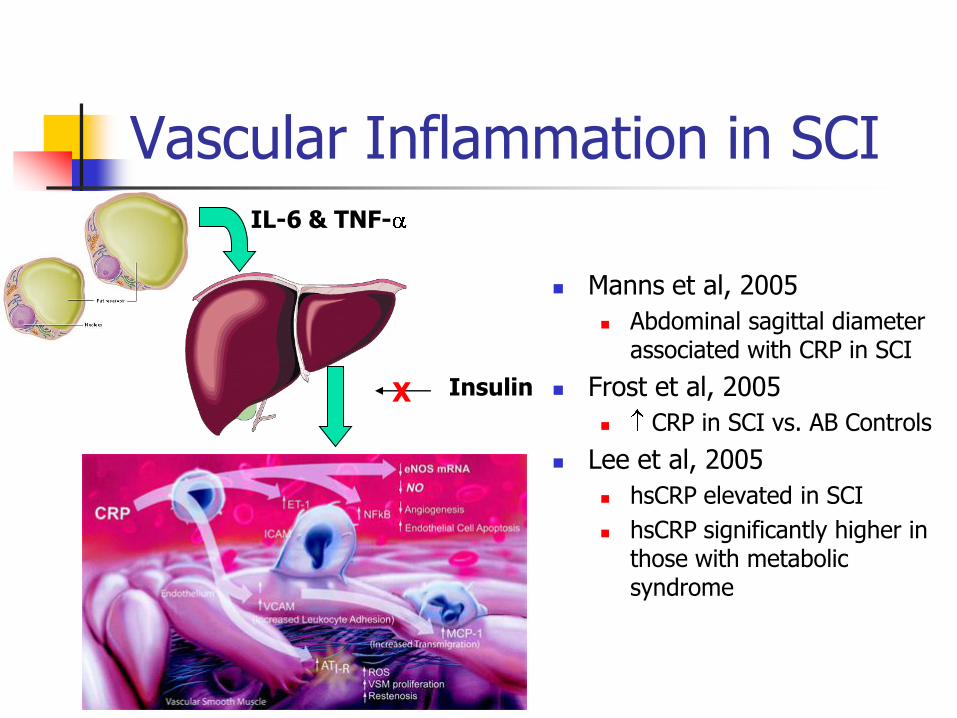
Vascular Inflammation in SCI
Manns et al, 2005
Abdominal sagittal diameter associated with CRP in SCI
Frost et al, 2005
CRP in SCI vs. AB Controls
Lee et al, 2005
hsCRP elevated in SCI
hsCRP significantly higher in those with metabolic syndrome
IL-6 & TNF-
Insulin X

3. Adipocytes cause Hypertension
Adipocytes Secrete:
Angiotensinogen
Potent Vasoconstrictor
Renin-Angiotensin-Aldosterone Syndrome
IL-6 CRP NO
Diminished Vasodilation
Free-Fatty Acids (FFA)
Atherogenesis
Poor Compliance Arterioles
Unusual HTN in SCI
Weaver et al, JSCIM 2007
N=7,959 vets w/ SCI&D
39% BP 120/79-139/89
23% BP >140/90
25% Para
16% Tetra
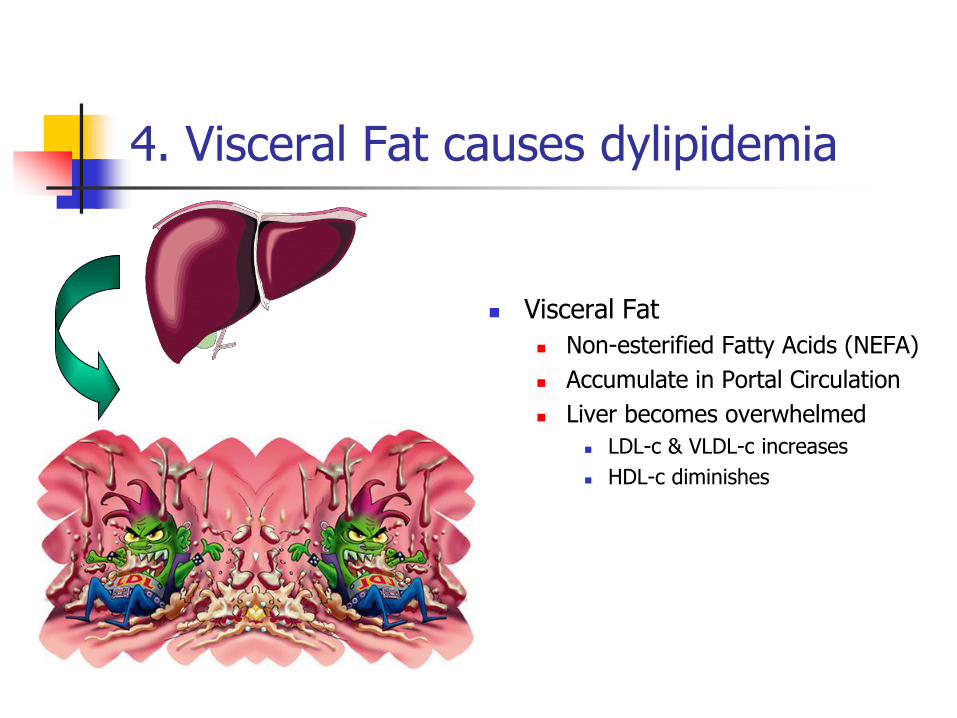
4. Visceral Fat causes dylipidemia
Visceral Fat
Non-esterified Fatty Acids (NEFA)
Accumulate in Portal Circulation
Liver becomes overwhelmed
LDL-c & VLDL-c increases
HDL-c diminishes
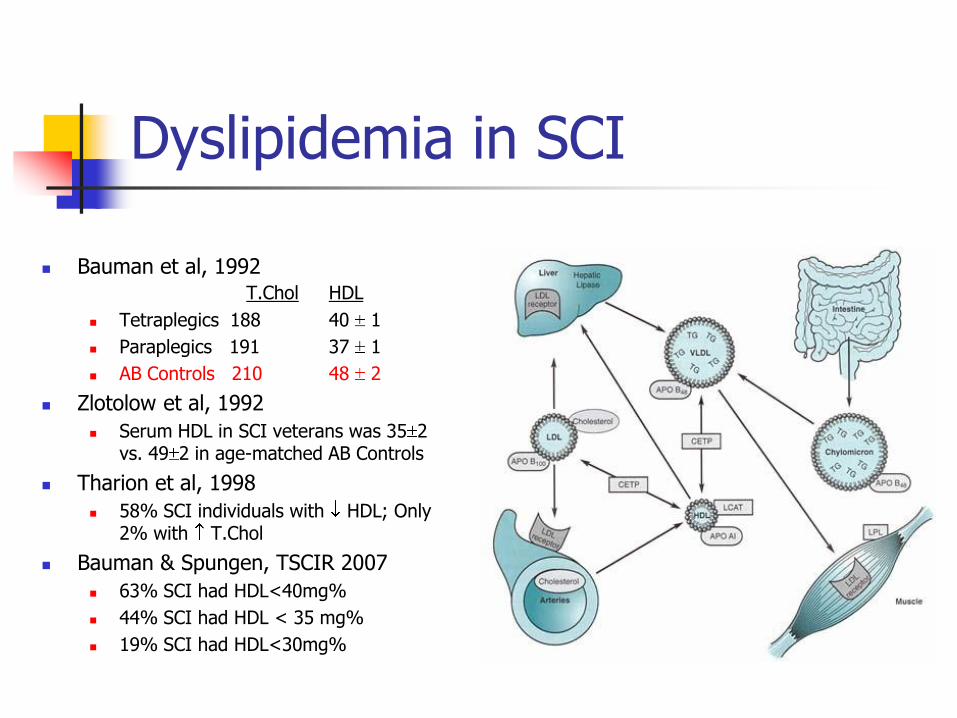
Dyslipidemia in SCI
Bauman et al, 1992 T.Chol HDL
Tetraplegics 188 40 1
Paraplegics 191 37 1
AB Controls 210 48 2
Zlotolow et al, 1992
Serum HDL in SCI veterans was 35 2 vs. 49 2 in age-matched AB Controls
Tharion et al, 1998
58% SCI individuals with HDL; Only 2% with T.Chol
Bauman & Spungen, TSCIR 2007
63% SCI had HDL<40mg%
44% SCI had HDL < 35 mg%
19% SCI had HDL<30mg%

5. Adipocytes cause Insulin Resistance
Adipocytes secrete:
IL-6
TNF-
Resulting CRP highly associated with insulin resistance
Accumulation of FFA @ liver and skeletal muscle impair insulin sensitivity
FFA diminish glucose concentration gradient
PI-3 Kinase Cascade Inhibition
Fatty acyl CoA
Diacylglycerol
Ceramides
Diabetes Care 28:2322-2325, 2005 Diabetes Care 27:2960-2965, 2004
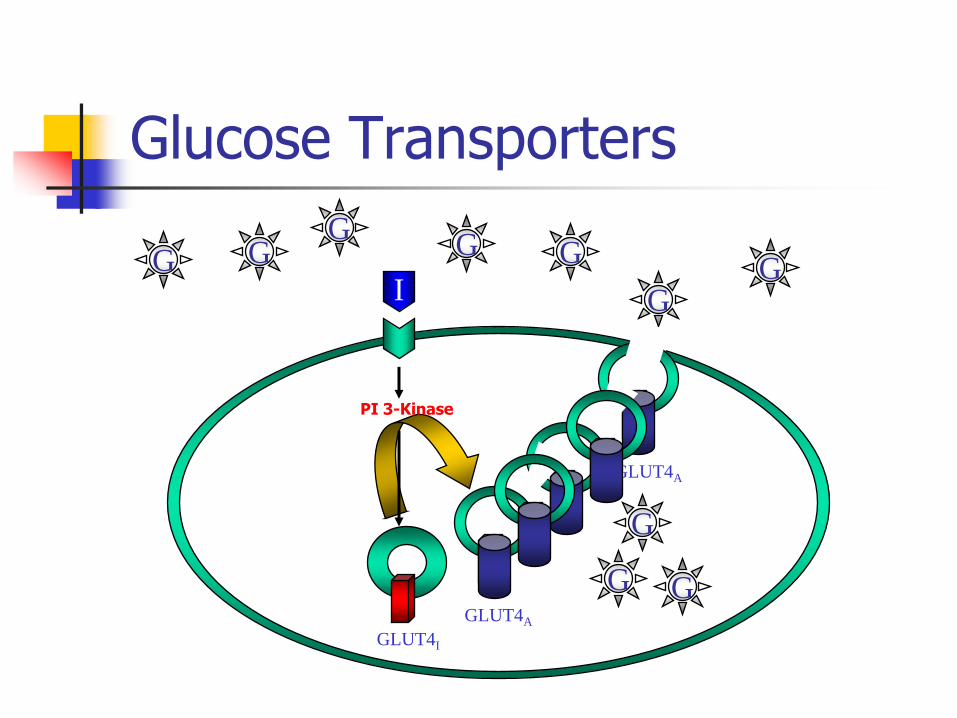
Glucose Transporters
I G G
G G
G G
G
GLUT4I
GLUT4A
G
G G GLUT4A
PI 3-Kinase

Copyright ©2000 American Society for Clinical Investigation Shulman, G. I. J. Clin. Invest. 2000;106:171-176
Non-Esterifed FAs Inhibit Insulin-Signaling Cascade
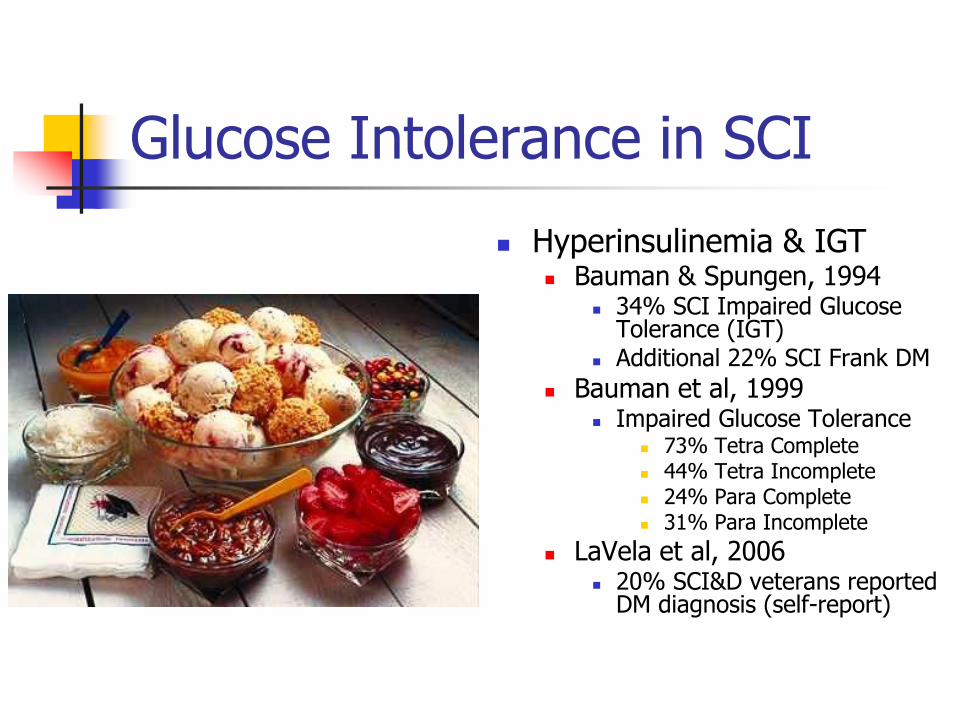
Glucose Intolerance in SCI
Hyperinsulinemia & IGT Bauman & Spungen, 1994
34% SCI Impaired Glucose Tolerance (IGT)
Additional 22% SCI Frank DM
Bauman et al, 1999 Impaired Glucose Tolerance
73% Tetra Complete 44% Tetra Incomplete 24% Para Complete 31% Para Incomplete
LaVela et al, 2006 20% SCI&D veterans reported
DM diagnosis (self-report)
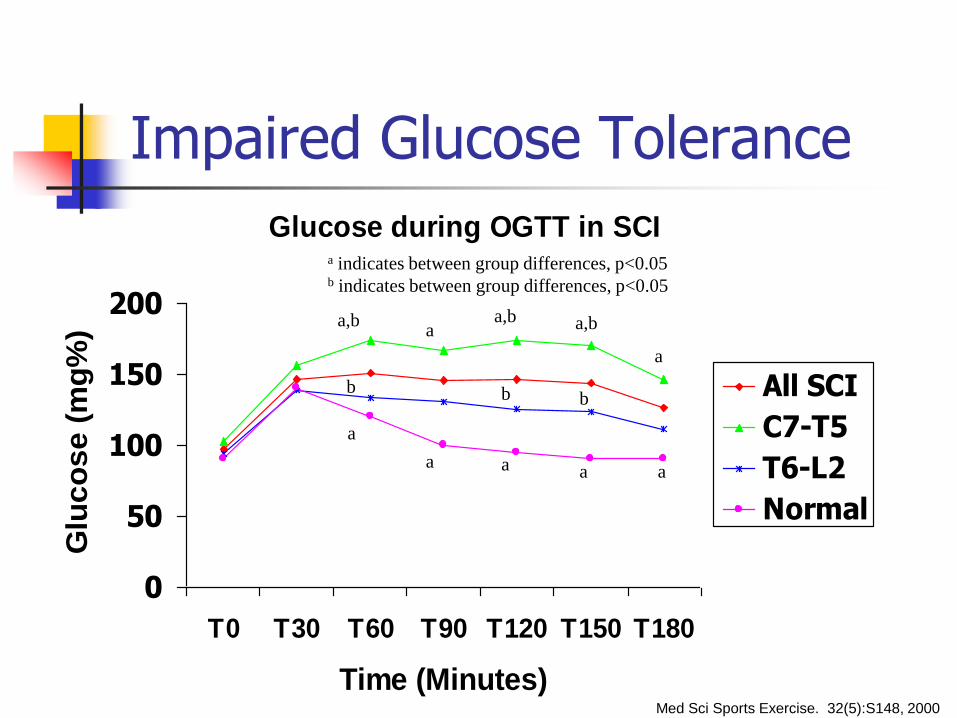
Impaired Glucose Tolerance
Glucose during OGTT in SCI
0
50
100
150
200
T0 T30 T60 T90 T120 T150 T180
Time (Minutes)
Glu
co
se
(m
g%
)
All SCI
C7-T5
T6-L2
Normal
a,b
a
b
a
a
a,b
a a a
a,b
b b
a
a indicates between group differences, p<0.05 b indicates between group differences, p<0.05
Med Sci Sports Exercise. 32(5):S148, 2000
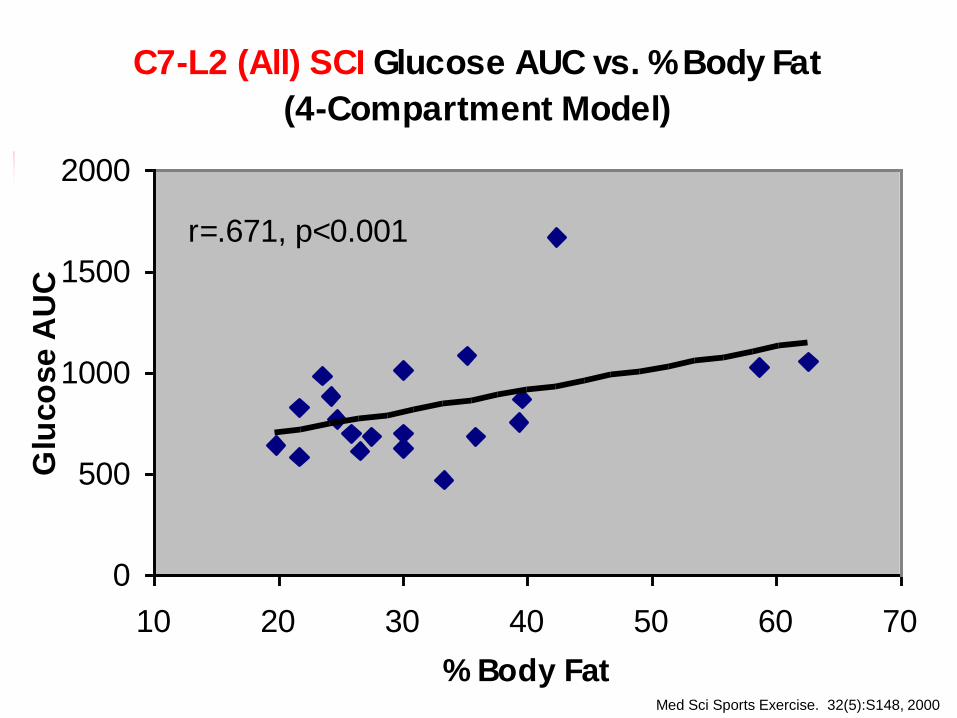
C7-L2 (All) SCI Glucose AUC vs. % Body Fat
(4-Compartment Model)
r=.671, p<0.001
0
500
1000
1500
2000
10 20 30 40 50 60 70
% Body Fat
Glu
co
se A
UC
Med Sci Sports Exercise. 32(5):S148, 2000
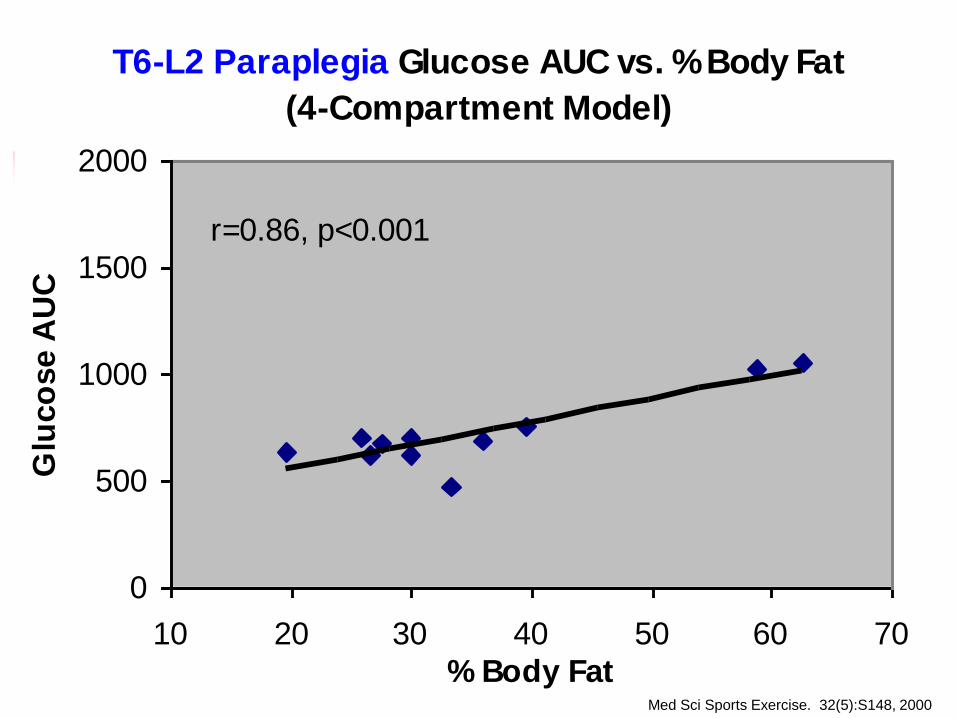
T6-L2 Paraplegia Glucose AUC vs. % Body Fat
(4-Compartment Model)
r=0.86, p<0.001
0
500
1000
1500
2000
10 20 30 40 50 60 70
% Body Fat
Glu
co
se A
UC
Med Sci Sports Exercise. 32(5):S148, 2000
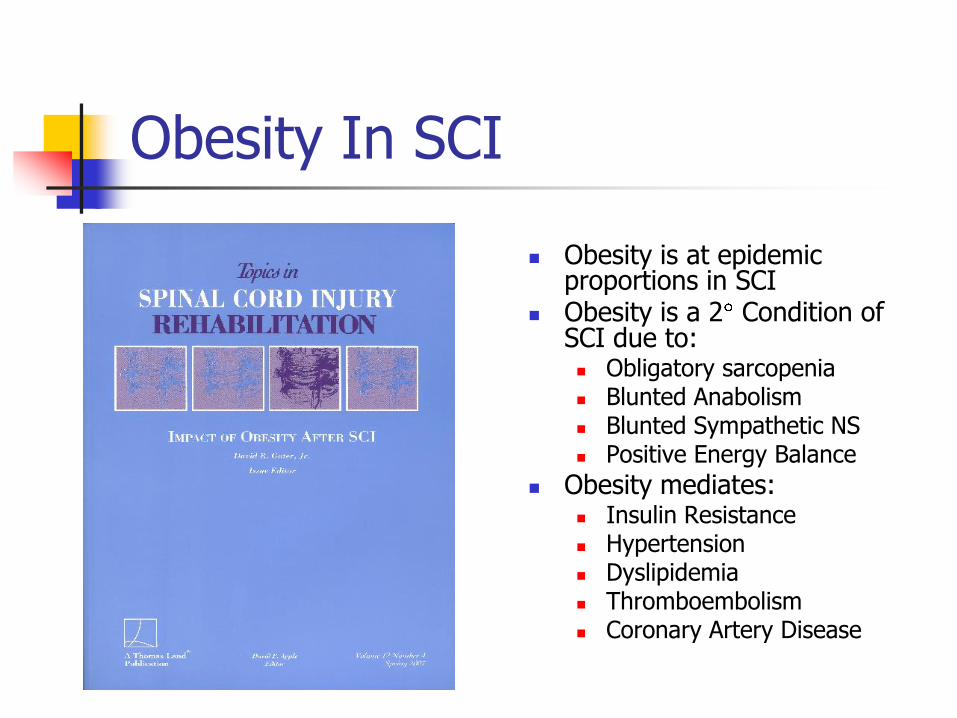
Obesity In SCI
Obesity is at epidemic proportions in SCI
Obesity is a 2 Condition of SCI due to: Obligatory sarcopenia Blunted Anabolism Blunted Sympathetic NS Positive Energy Balance
Obesity mediates: Insulin Resistance Hypertension Dyslipidemia Thromboembolism Coronary Artery Disease

Energy Balance
Energy Expenditure = Energy Intake

Resting Energy Requirements
Liver 29%
Brain 19%
Kidney 7%
Heart 10%
Skeletal Muscle 18%
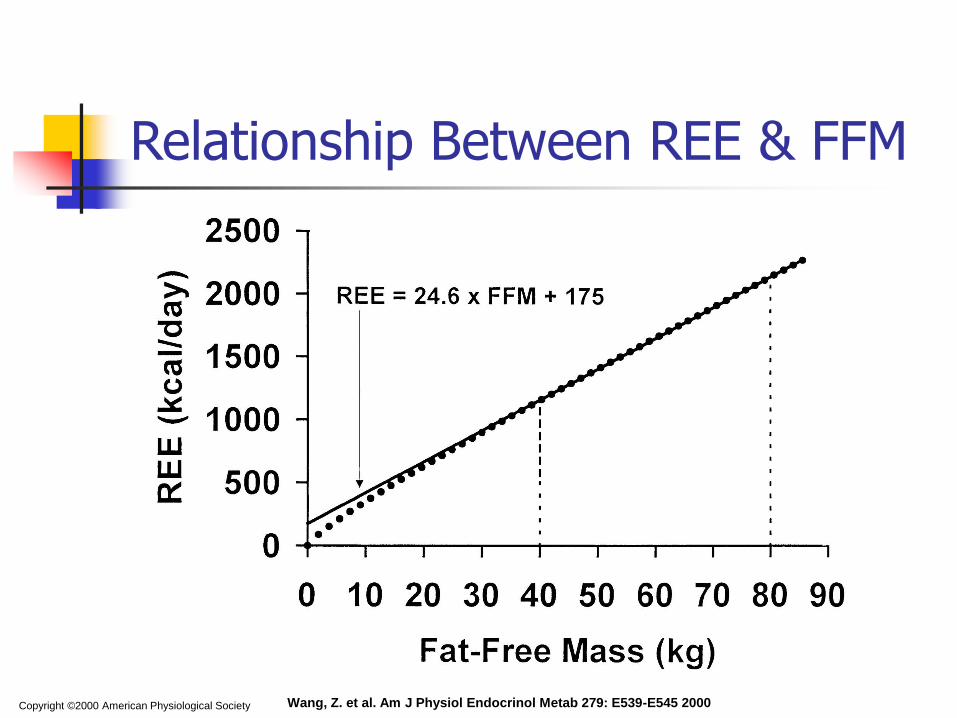
Copyright ©2000 American Physiological Society Wang, Z. et al. Am J Physiol Endocrinol Metab 279: E539-E545 2000
Relationship Between REE & FFM
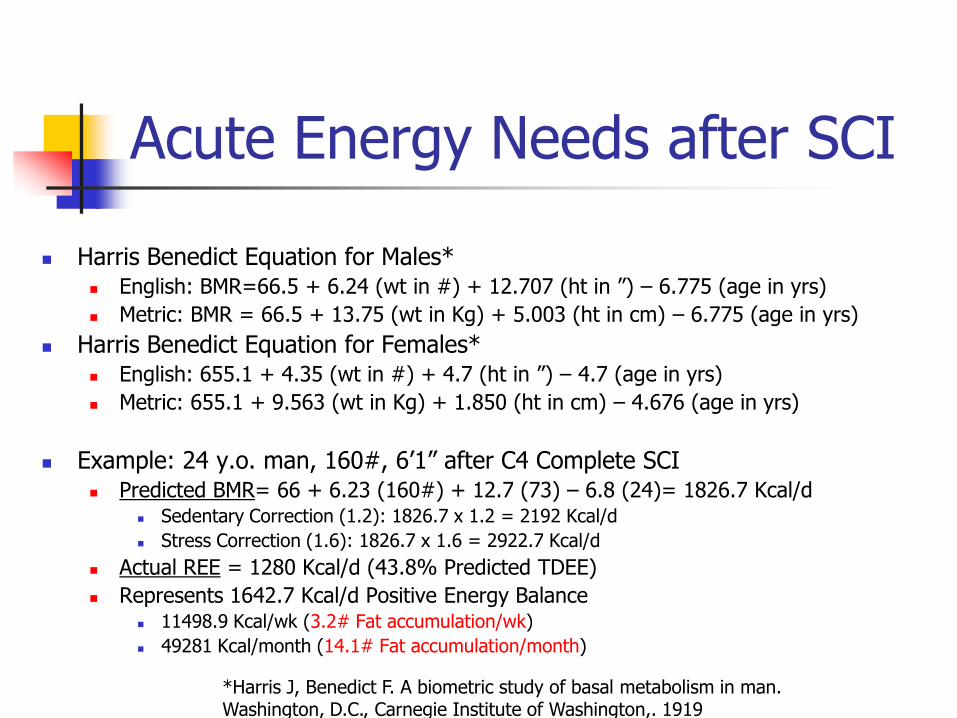
Acute Energy Needs after SCI
Harris Benedict Equation for Males* English: BMR=66.5 + 6.24 (wt in #) + 12.707 (ht in ”) – 6.775 (age in yrs)
Metric: BMR = 66.5 + 13.75 (wt in Kg) + 5.003 (ht in cm) – 6.775 (age in yrs)
Harris Benedict Equation for Females* English: 655.1 + 4.35 (wt in #) + 4.7 (ht in ”) – 4.7 (age in yrs)
Metric: 655.1 + 9.563 (wt in Kg) + 1.850 (ht in cm) – 4.676 (age in yrs)
Example: 24 y.o. man, 160#, 6’1” after C4 Complete SCI Predicted BMR= 66 + 6.23 (160#) + 12.7 (73) – 6.8 (24)= 1826.7 Kcal/d
Sedentary Correction (1.2): 1826.7 x 1.2 = 2192 Kcal/d
Stress Correction (1.6): 1826.7 x 1.6 = 2922.7 Kcal/d
Actual REE = 1280 Kcal/d (43.8% Predicted TDEE)
Represents 1642.7 Kcal/d Positive Energy Balance 11498.9 Kcal/wk (3.2# Fat accumulation/wk)
49281 Kcal/month (14.1# Fat accumulation/month)
*Harris J, Benedict F. A biometric study of basal metabolism in man. Washington, D.C., Carnegie Institute of Washington,. 1919

Acute Obligatory N2 Loss
Rodriguez et al, 1991
Provided SCI vs. Non-SCI
120% Predicted EE (Calories)
2.4 g Protein/kg IBW/d
Continued N2 loss in SCI until Wk 8
N2 Balance achieved in Non-SCI by Wk 3
Rodriguez et al, 1997
Inappropriate to use PEE, especially not:
1.2 Multiplier(Activity Factor for Bed rest)
1.6 Multiplier (Injury Factor for Major Trauma)
Obligatory Sarcopenia
Muscle atrophy due to Paralysis
REE diminishes with N2 loss
1J Parenteral & Enteral Nutrition (1991)15(3): 319-322 2Spinal Cord (1997) 35:599-604
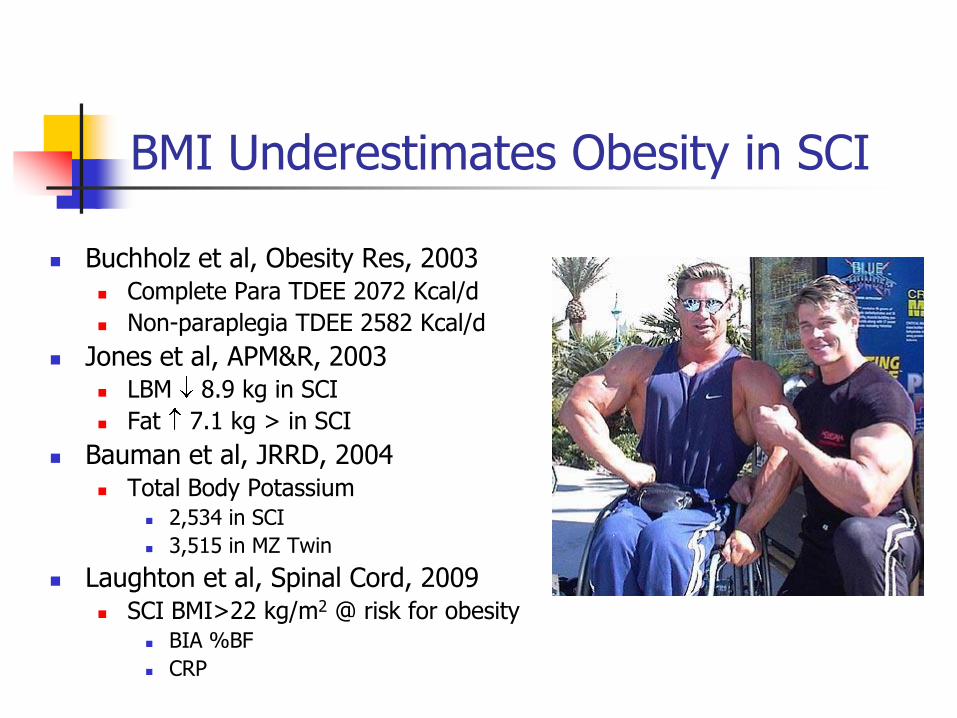
BMI Underestimates Obesity in SCI
Buchholz et al, Obesity Res, 2003 Complete Para TDEE 2072 Kcal/d
Non-paraplegia TDEE 2582 Kcal/d
Jones et al, APM&R, 2003 LBM 8.9 kg in SCI
Fat 7.1 kg > in SCI
Bauman et al, JRRD, 2004 Total Body Potassium
2,534 in SCI
3,515 in MZ Twin
Laughton et al, Spinal Cord, 2009 SCI BMI>22 kg/m2 @ risk for obesity
BIA %BF
CRP
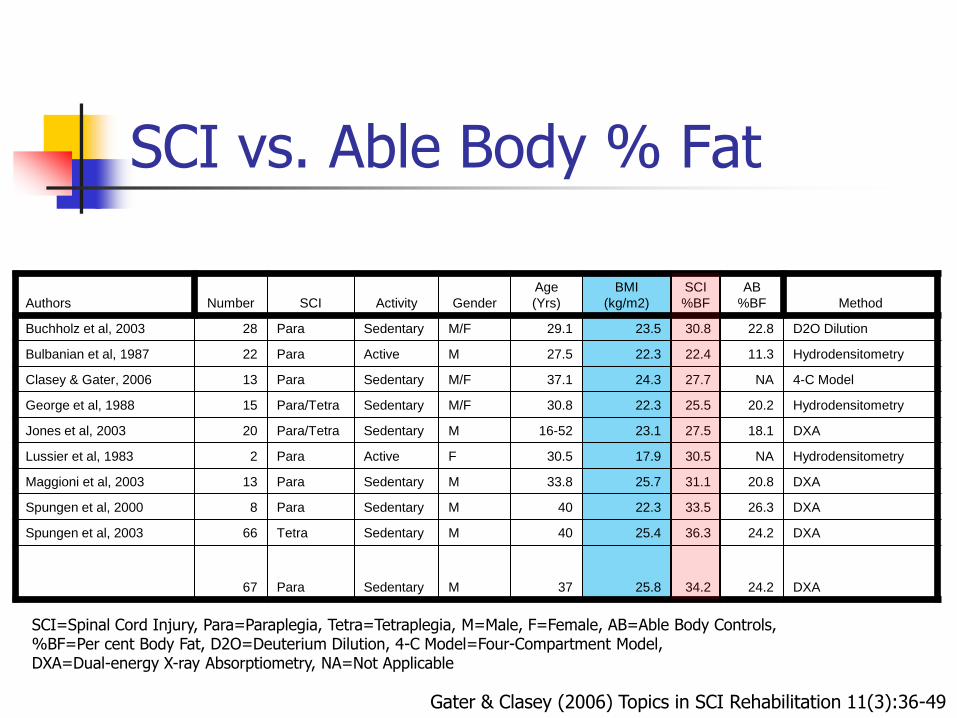
SCI vs. Able Body % Fat
Authors Number SCI Activity Gender
Age
(Yrs)
BMI
(kg/m2)
SCI
%BF
AB
%BF Method
Buchholz et al, 2003 28 Para Sedentary M/F 29.1 23.5 30.8 22.8 D2O Dilution
Bulbanian et al, 1987 22 Para Active M 27.5 22.3 22.4 11.3 Hydrodensitometry
Clasey & Gater, 2006 13 Para Sedentary M/F 37.1 24.3 27.7 NA 4-C Model
George et al, 1988 15 Para/Tetra Sedentary M/F 30.8 22.3 25.5 20.2 Hydrodensitometry
Jones et al, 2003 20 Para/Tetra Sedentary M 16-52 23.1 27.5 18.1 DXA
Lussier et al, 1983 2 Para Active F 30.5 17.9 30.5 NA Hydrodensitometry
Maggioni et al, 2003 13 Para Sedentary M 33.8 25.7 31.1 20.8 DXA
Spungen et al, 2000 8 Para Sedentary M 40 22.3 33.5 26.3 DXA
Spungen et al, 2003 66 Tetra Sedentary M 40 25.4 36.3 24.2 DXA
67 Para Sedentary M 37 25.8 34.2 24.2 DXA
SCI=Spinal Cord Injury, Para=Paraplegia, Tetra=Tetraplegia, M=Male, F=Female, AB=Able Body Controls, %BF=Per cent Body Fat, D2O=Deuterium Dilution, 4-C Model=Four-Compartment Model, DXA=Dual-energy X-ray Absorptiometry, NA=Not Applicable
Gater & Clasey (2006) Topics in SCI Rehabilitation 11(3):36-49
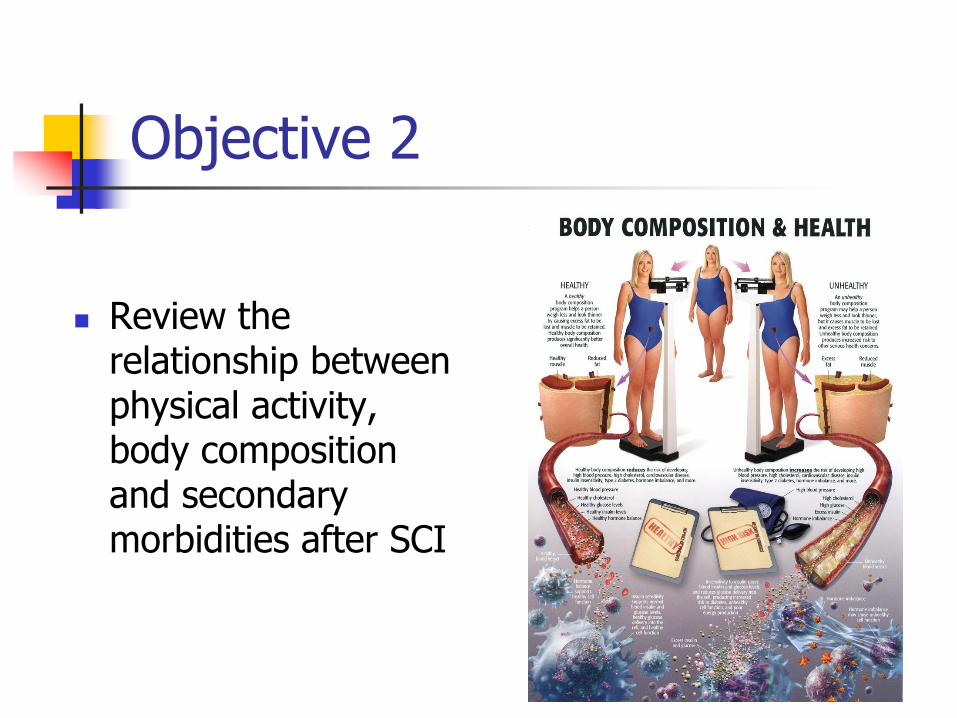
Objective 2
Review the relationship between physical activity, body composition and secondary morbidities after SCI

Daily Energy Expenditure
15-30%
7-10 %
60-75%
RMR
TEM
TEA
Resting Metabolic Rate Thermic Effect of Meal Thermic Effect of Activity
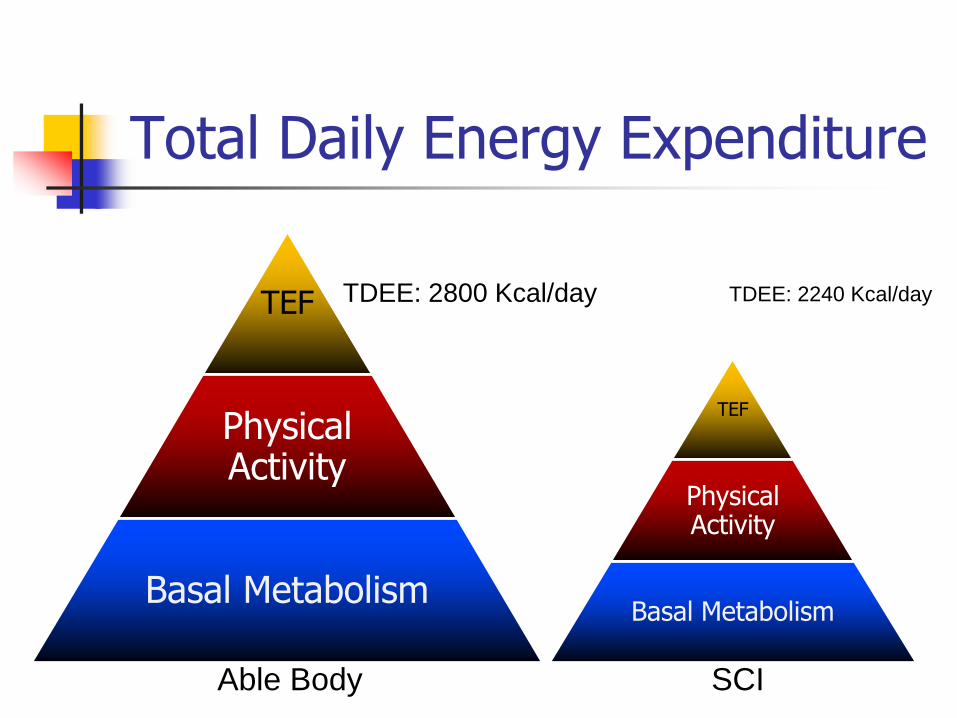
Total Daily Energy Expenditure
TEF
Physical Activity
Basal Metabolism
TDEE: 2800 Kcal/day
TEF
Physical Activity
Basal Metabolism
TDEE: 2240 Kcal/day
Able Body SCI
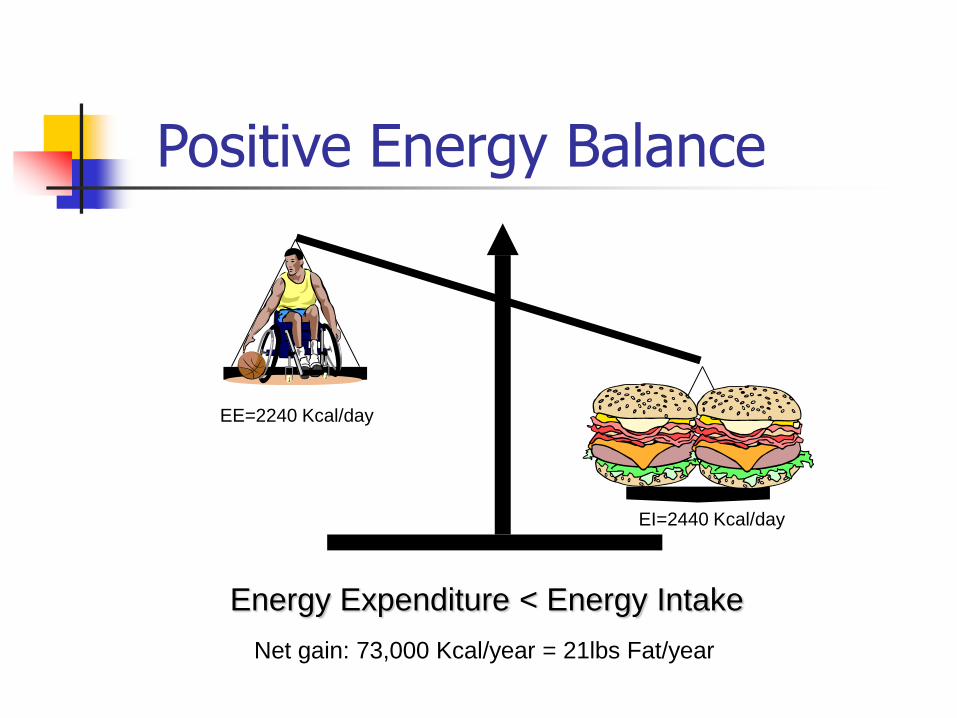
Energy Expenditure < Energy Intake
Positive Energy Balance
EE=2240 Kcal/day
EI=2440 Kcal/day
Net gain: 73,000 Kcal/year = 21lbs Fat/year
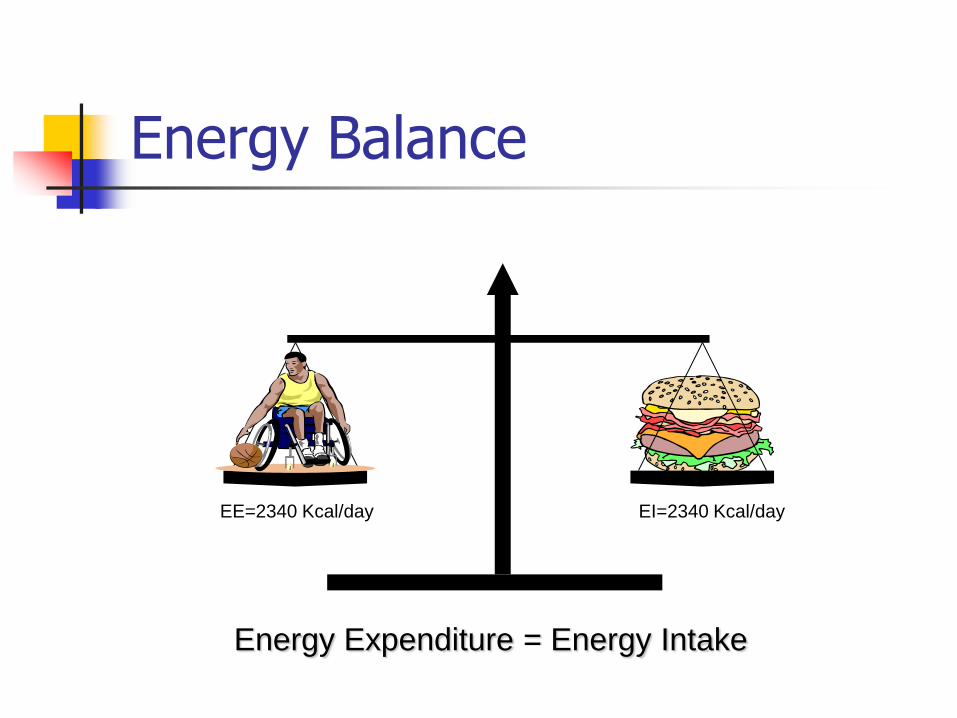
Energy Balance
Energy Expenditure = Energy Intake
EE=2340 Kcal/day EI=2340 Kcal/day
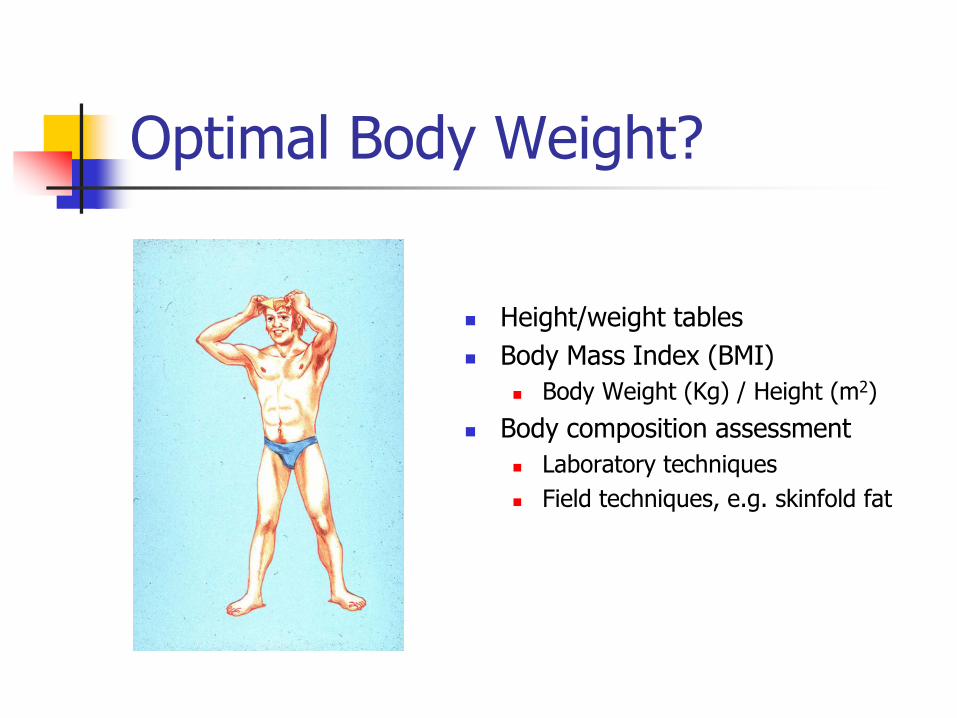
Optimal Body Weight?
Height/weight tables
Body Mass Index (BMI)
Body Weight (Kg) / Height (m2)
Body composition assessment
Laboratory techniques
Field techniques, e.g. skinfold fat
Body Composition Assessment
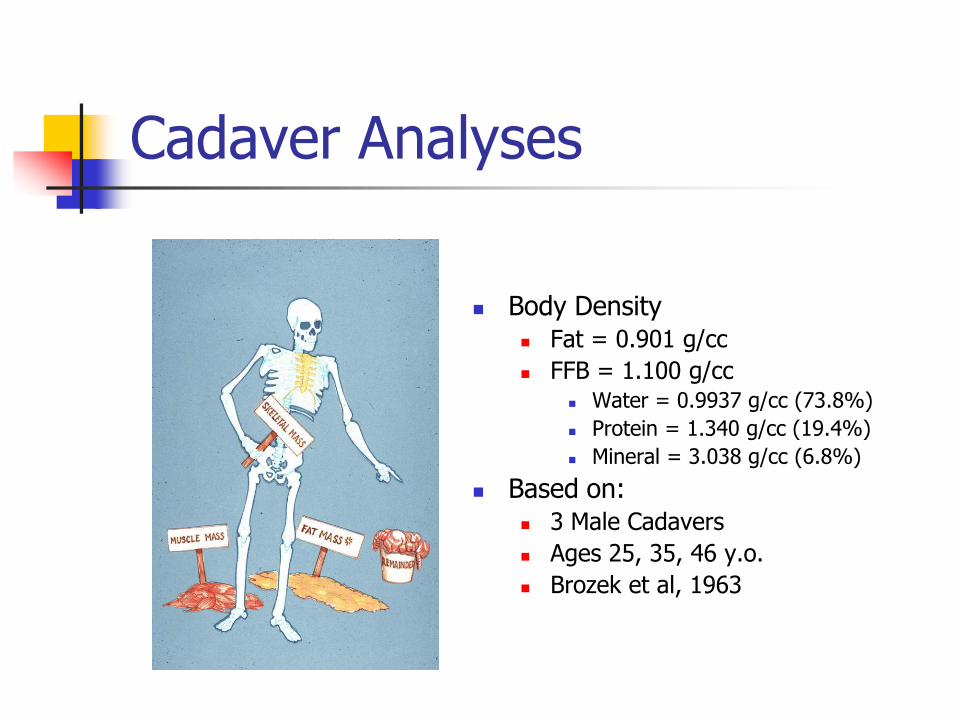
Cadaver Analyses
Body Density Fat = 0.901 g/cc
FFB = 1.100 g/cc Water = 0.9937 g/cc (73.8%)
Protein = 1.340 g/cc (19.4%)
Mineral = 3.038 g/cc (6.8%)
Based on: 3 Male Cadavers
Ages 25, 35, 46 y.o.
Brozek et al, 1963
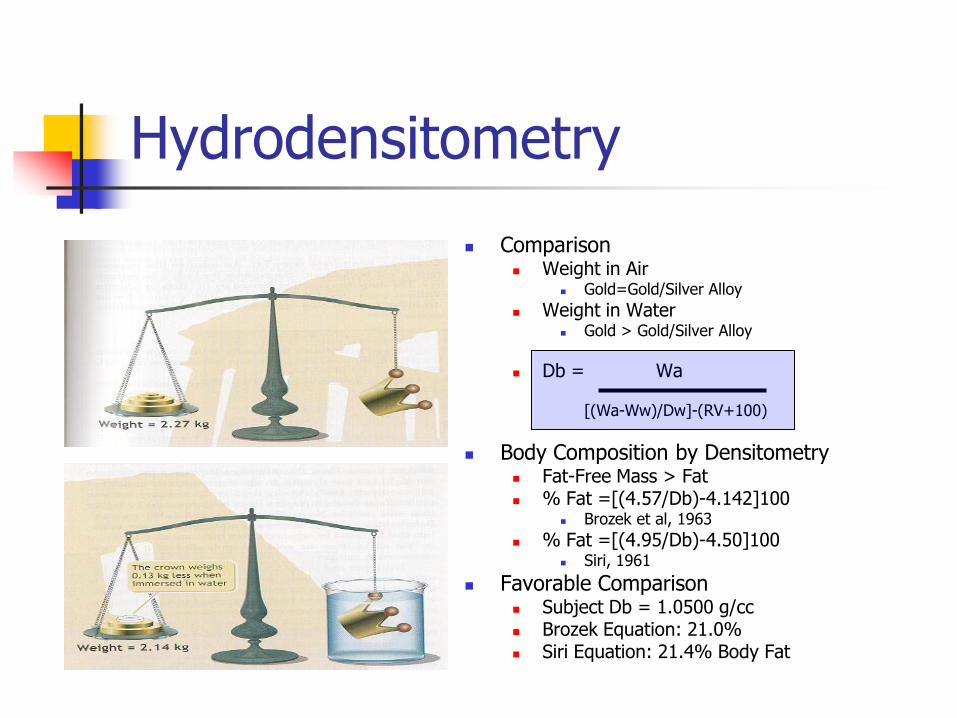
Hydrodensitometry
Comparison Weight in Air
Gold=Gold/Silver Alloy
Weight in Water Gold > Gold/Silver Alloy
Db = Wa [(Wa-Ww)/Dw]-(RV+100)
Body Composition by Densitometry Fat-Free Mass > Fat % Fat =[(4.57/Db)-4.142]100
Brozek et al, 1963
% Fat =[(4.95/Db)-4.50]100 Siri, 1961
Favorable Comparison Subject Db = 1.0500 g/cc Brozek Equation: 21.0% Siri Equation: 21.4% Body Fat
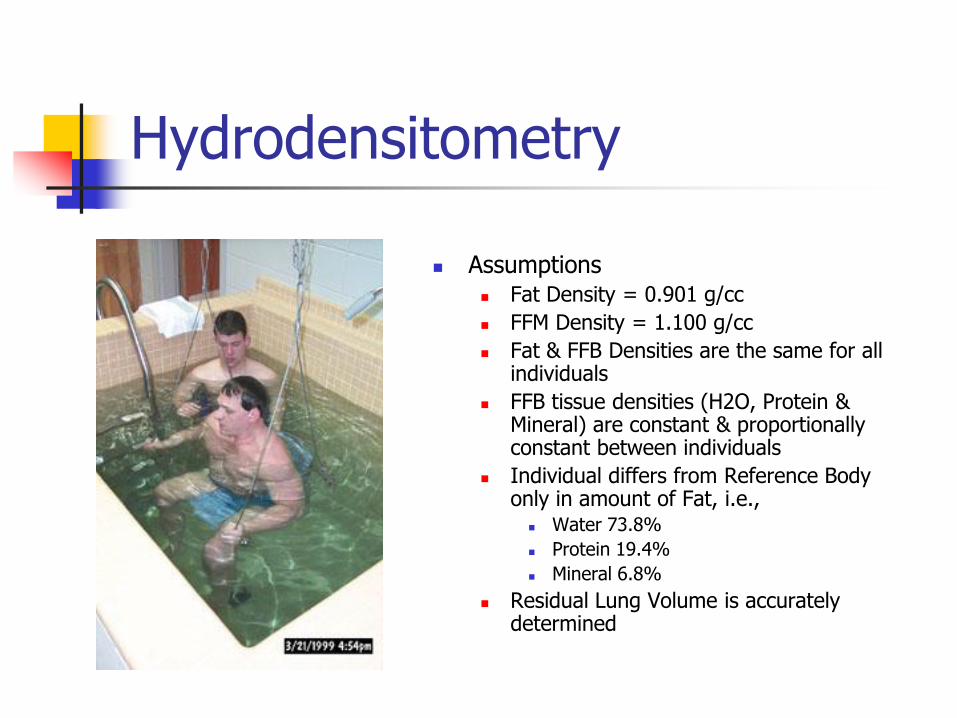
Hydrodensitometry
Assumptions Fat Density = 0.901 g/cc
FFM Density = 1.100 g/cc
Fat & FFB Densities are the same for all individuals
FFB tissue densities (H2O, Protein & Mineral) are constant & proportionally constant between individuals
Individual differs from Reference Body only in amount of Fat, i.e.,
Water 73.8%
Protein 19.4%
Mineral 6.8%
Residual Lung Volume is accurately determined
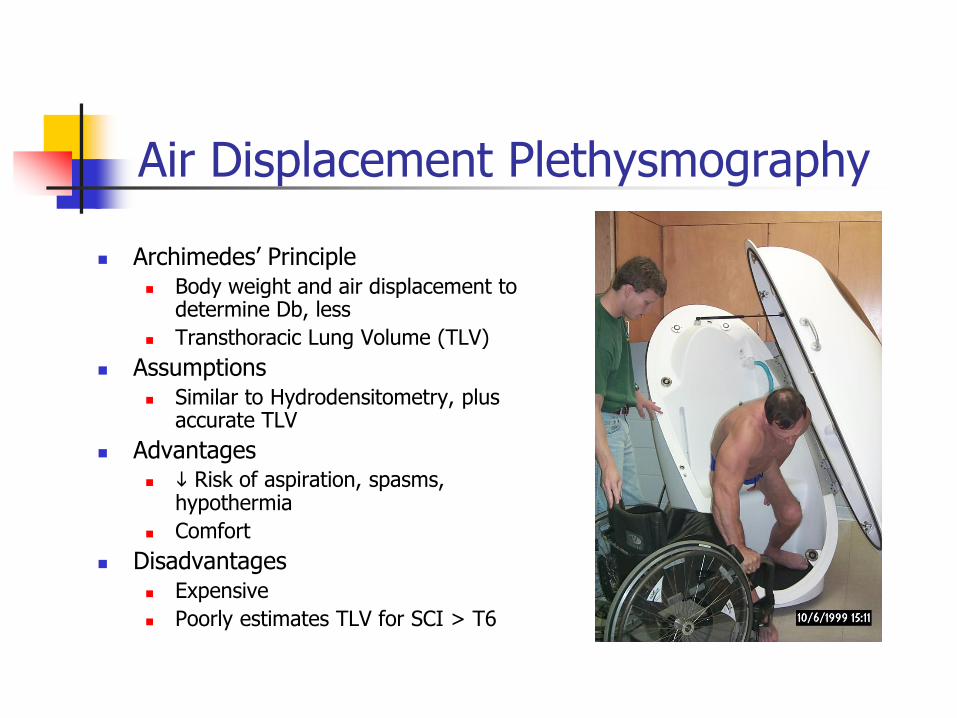
Air Displacement Plethysmography
Archimedes’ Principle Body weight and air displacement to
determine Db, less
Transthoracic Lung Volume (TLV)
Assumptions Similar to Hydrodensitometry, plus
accurate TLV
Advantages Risk of aspiration, spasms,
hypothermia
Comfort
Disadvantages Expensive
Poorly estimates TLV for SCI > T6
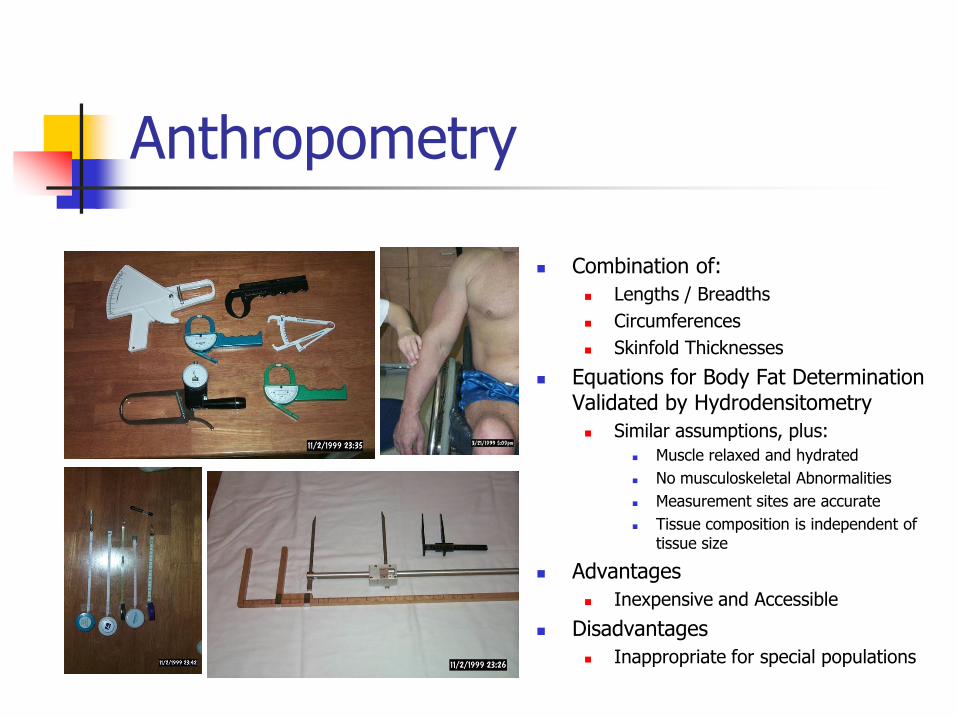
Anthropometry
Combination of:
Lengths / Breadths
Circumferences
Skinfold Thicknesses
Equations for Body Fat Determination Validated by Hydrodensitometry
Similar assumptions, plus:
Muscle relaxed and hydrated
No musculoskeletal Abnormalities
Measurement sites are accurate
Tissue composition is independent of tissue size
Advantages
Inexpensive and Accessible
Disadvantages
Inappropriate for special populations
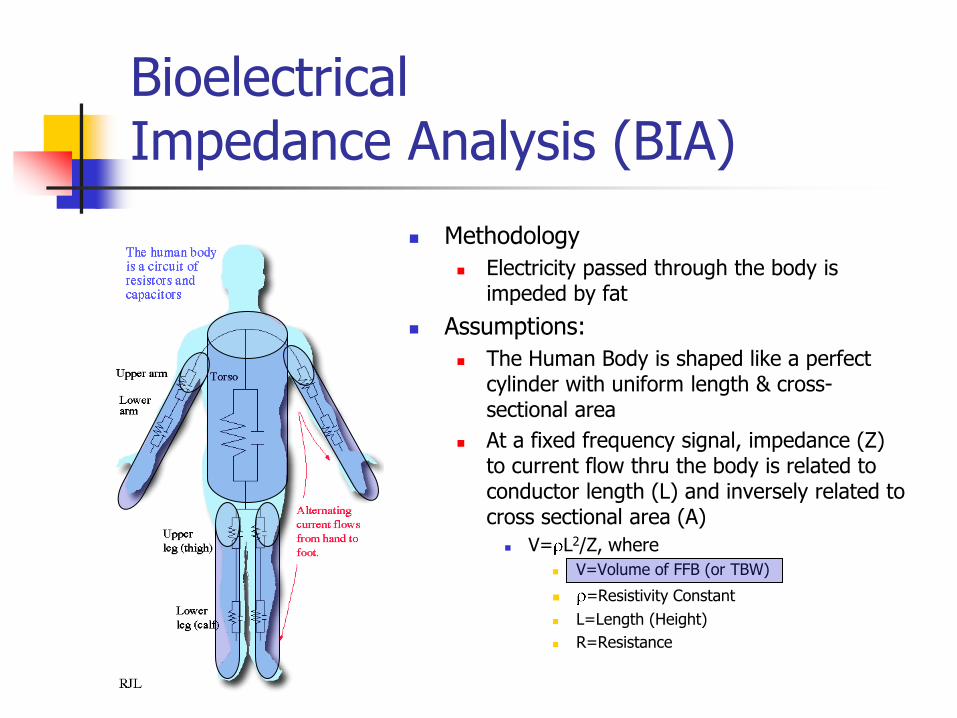
Bioelectrical Impedance Analysis (BIA)
Methodology
Electricity passed through the body is impeded by fat
Assumptions:
The Human Body is shaped like a perfect cylinder with uniform length & cross-sectional area
At a fixed frequency signal, impedance (Z) to current flow thru the body is related to conductor length (L) and inversely related to cross sectional area (A)
V= L2/Z, where
V=Volume of FFB (or TBW)
=Resistivity Constant
L=Length (Height)
R=Resistance
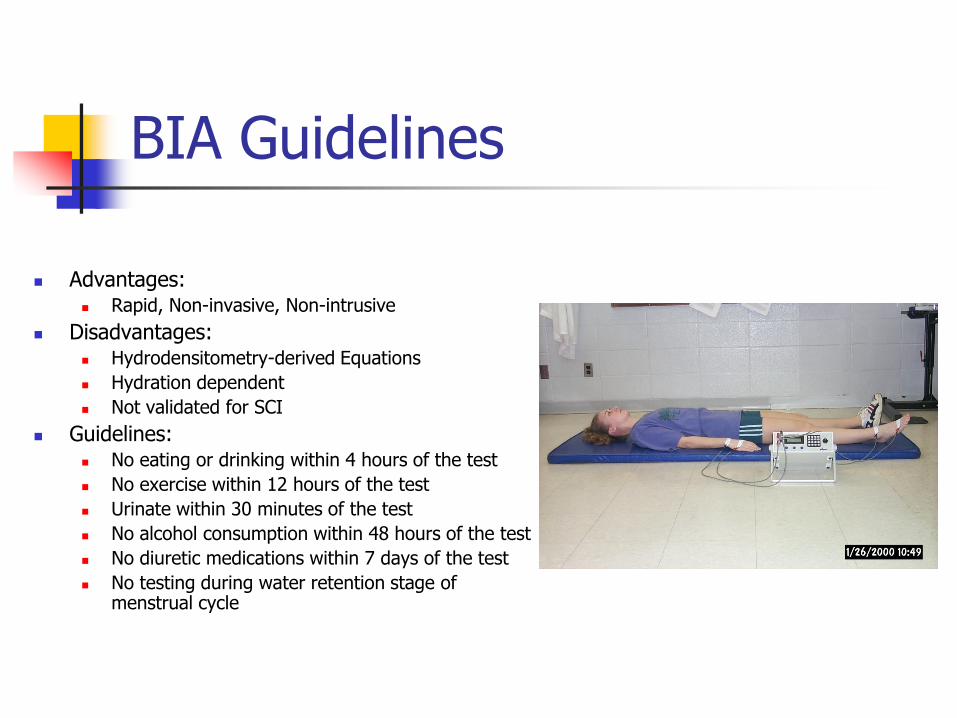
BIA Guidelines
Advantages: Rapid, Non-invasive, Non-intrusive
Disadvantages: Hydrodensitometry-derived Equations
Hydration dependent
Not validated for SCI
Guidelines: No eating or drinking within 4 hours of the test
No exercise within 12 hours of the test
Urinate within 30 minutes of the test
No alcohol consumption within 48 hours of the test
No diuretic medications within 7 days of the test
No testing during water retention stage of menstrual cycle
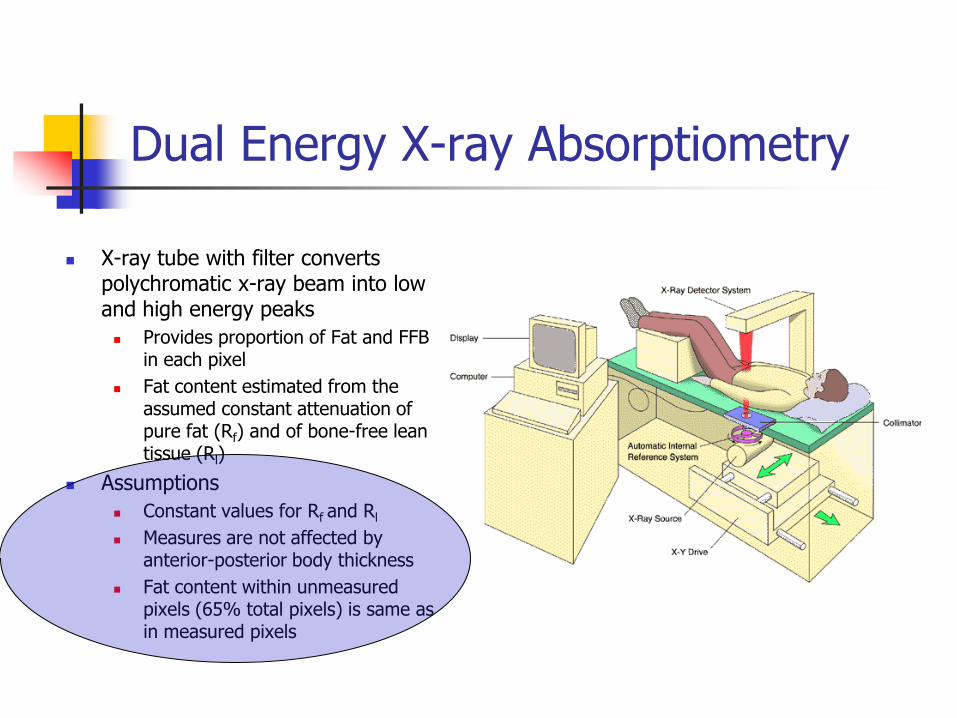
Dual Energy X-ray Absorptiometry
X-ray tube with filter converts polychromatic x-ray beam into low and high energy peaks
Provides proportion of Fat and FFB in each pixel
Fat content estimated from the assumed constant attenuation of pure fat (Rf) and of bone-free lean tissue (Rl)
Assumptions
Constant values for Rf and Rl
Measures are not affected by anterior-posterior body thickness
Fat content within unmeasured pixels (65% total pixels) is same as in measured pixels
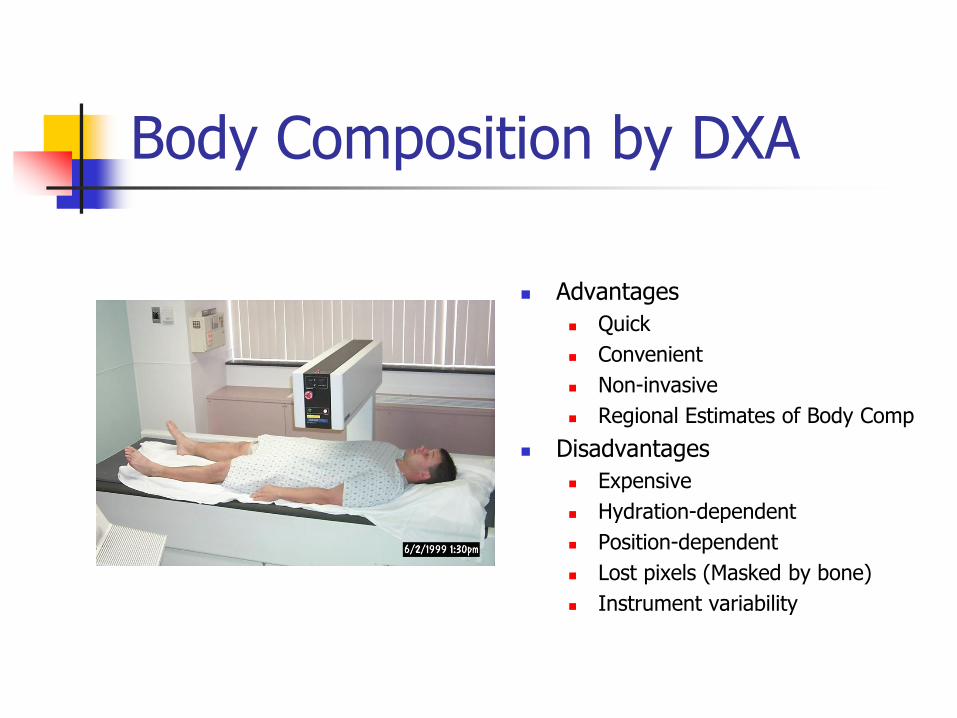
Body Composition by DXA
Advantages
Quick
Convenient
Non-invasive
Regional Estimates of Body Comp
Disadvantages
Expensive
Hydration-dependent
Position-dependent
Lost pixels (Masked by bone)
Instrument variability
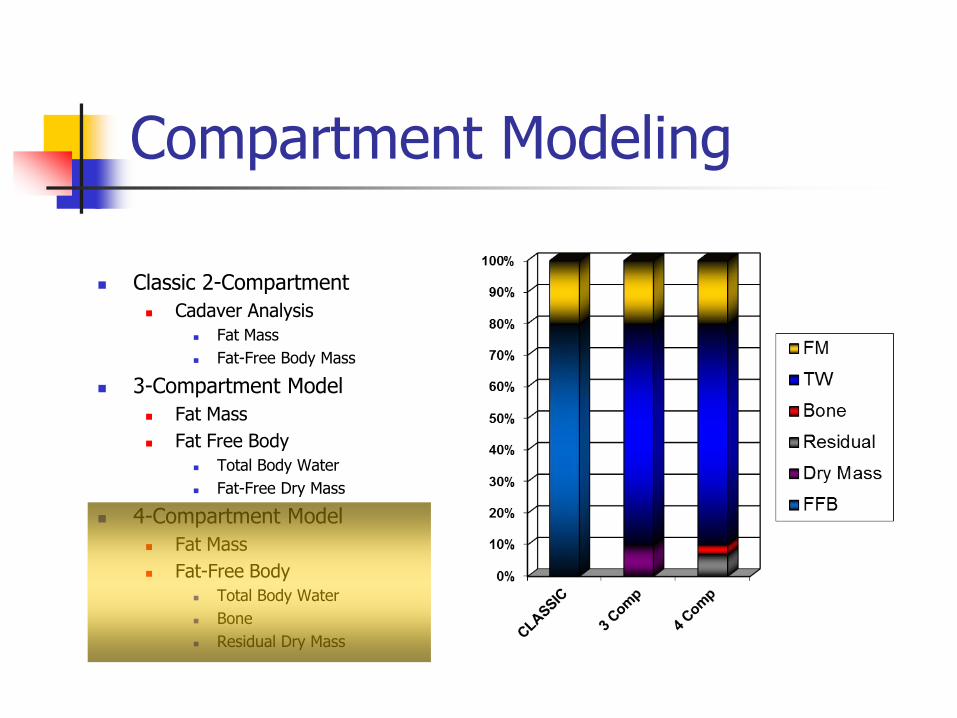
Compartment Modeling
Classic 2-Compartment
Cadaver Analysis
Fat Mass
Fat-Free Body Mass
3-Compartment Model
Fat Mass
Fat Free Body
Total Body Water
Fat-Free Dry Mass
4-Compartment Model
Fat Mass
Fat-Free Body
Total Body Water
Bone
Residual Dry Mass
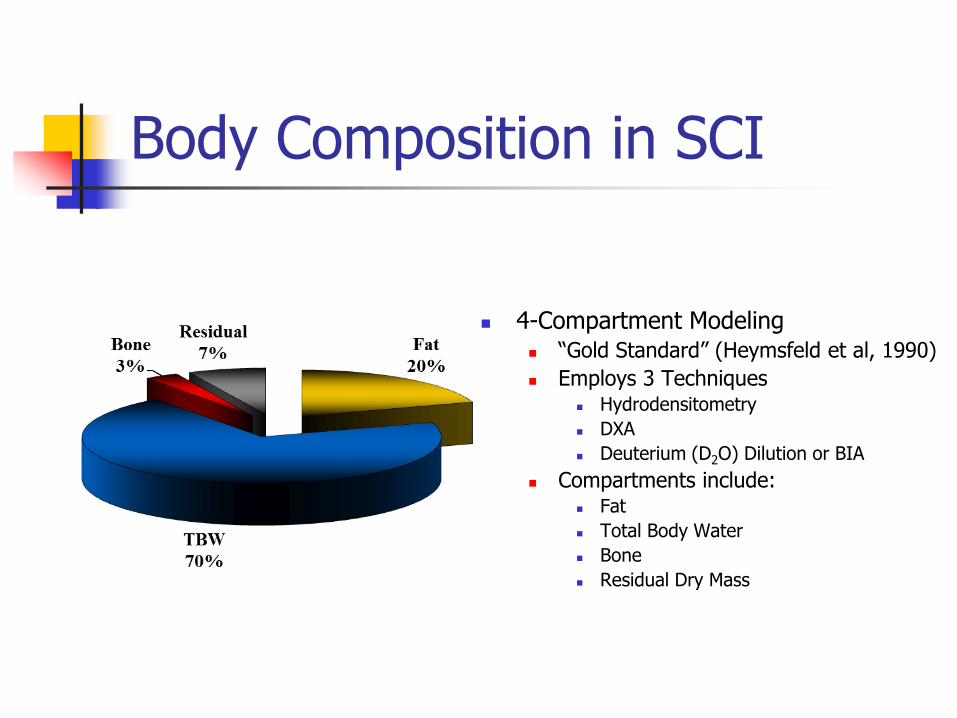
Body Composition in SCI
4-Compartment Modeling “Gold Standard” (Heymsfeld et al, 1990)
Employs 3 Techniques Hydrodensitometry
DXA
Deuterium (D2O) Dilution or BIA
Compartments include: Fat
Total Body Water
Bone
Residual Dry Mass
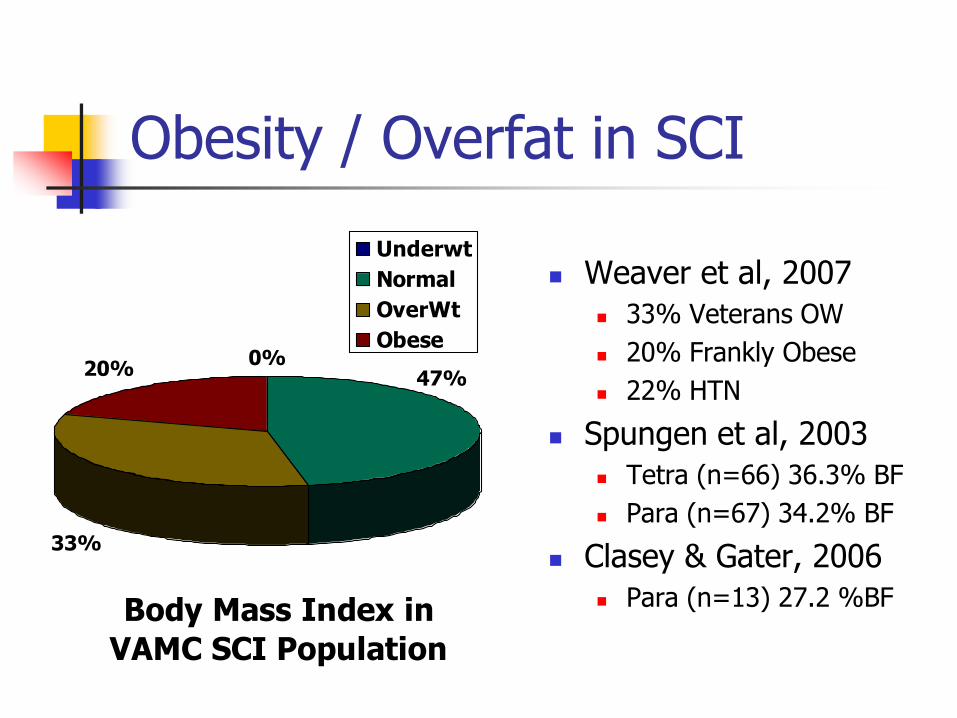
Obesity / Overfat in SCI
Weaver et al, 2007
33% Veterans OW
20% Frankly Obese
22% HTN
Spungen et al, 2003
Tetra (n=66) 36.3% BF
Para (n=67) 34.2% BF
Clasey & Gater, 2006
Para (n=13) 27.2 %BF Body Mass Index in
VAMC SCI Population
0%
33%
20% 47%
Underwt
Normal
OverWt
Obese
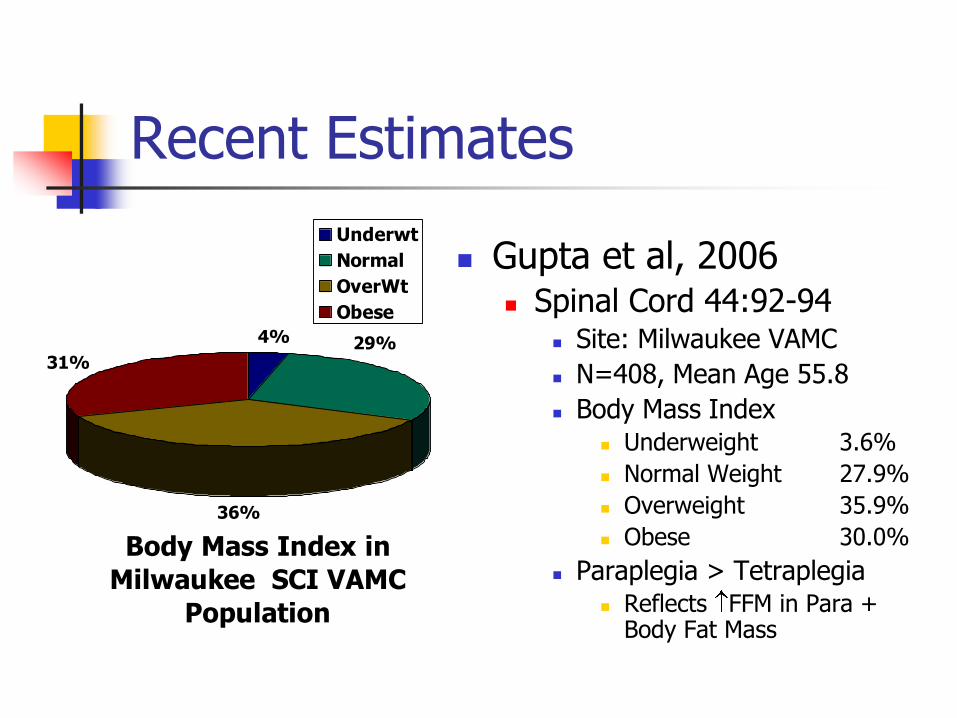
Recent Estimates
Body Mass Index in
Milwaukee SCI VAMC
Population
4%
36%
31%29%
Underwt
Normal
OverWt
Obese
Gupta et al, 2006 Spinal Cord 44:92-94
Site: Milwaukee VAMC
N=408, Mean Age 55.8
Body Mass Index Underweight 3.6%
Normal Weight 27.9%
Overweight 35.9%
Obese 30.0%
Paraplegia > Tetraplegia Reflects FFM in Para +
Body Fat Mass
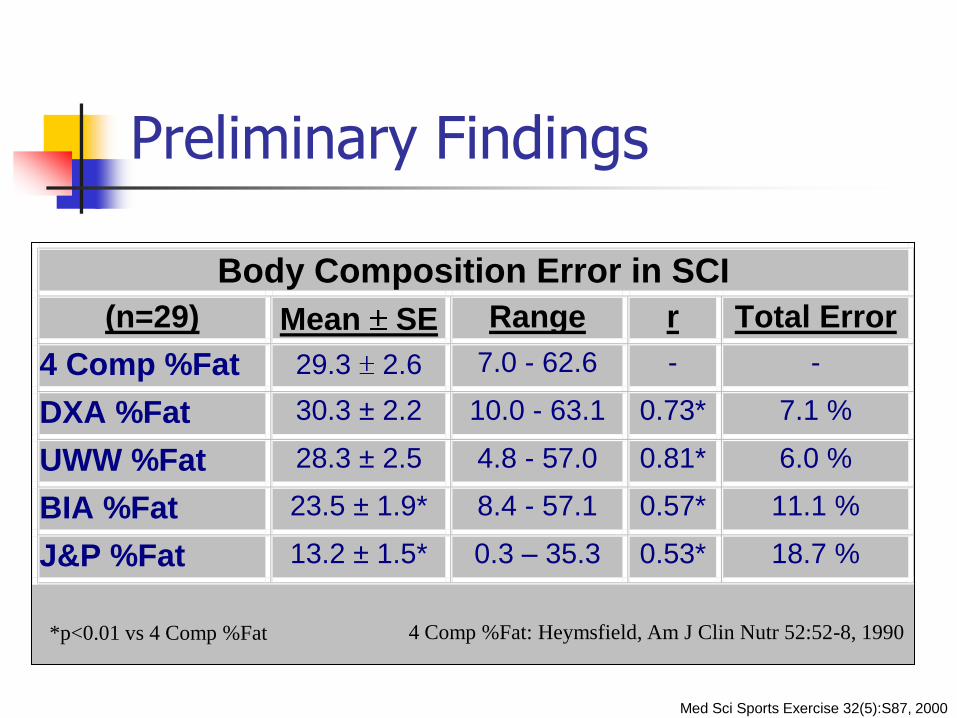
Preliminary Findings
Body Composition Error in SCI
(n=29) Mean SE Range r Total Error
4 Comp %Fat 29.3 2.6 7.0 - 62.6 - -
DXA %Fat 30.3 ± 2.2 10.0 - 63.1 0.73* 7.1 %
UWW %Fat 28.3 ± 2.5 4.8 - 57.0 0.81* 6.0 %
BIA %Fat 23.5 ± 1.9*
8.4 - 57.1 0.57* 11.1 %
J&P %Fat 13.2 ± 1.5* 0.3 – 35.3 0.53* 18.7 %
*p<0.01 vs 4 Comp %Fat
Med Sci Sports Exercise 32(5):S87, 2000
4 Comp %Fat: Heymsfield, Am J Clin Nutr 52:52-8, 1990
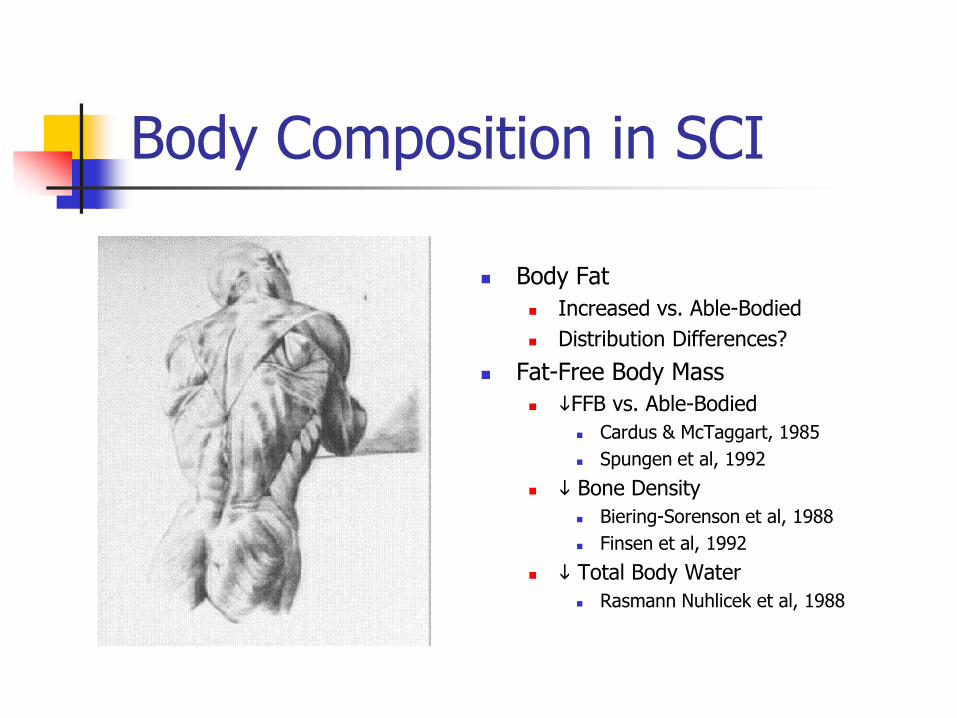
Body Composition in SCI
Body Fat
Increased vs. Able-Bodied
Distribution Differences?
Fat-Free Body Mass
FFB vs. Able-Bodied
Cardus & McTaggart, 1985
Spungen et al, 1992
Bone Density
Biering-Sorenson et al, 1988
Finsen et al, 1992
Total Body Water
Rasmann Nuhlicek et al, 1988
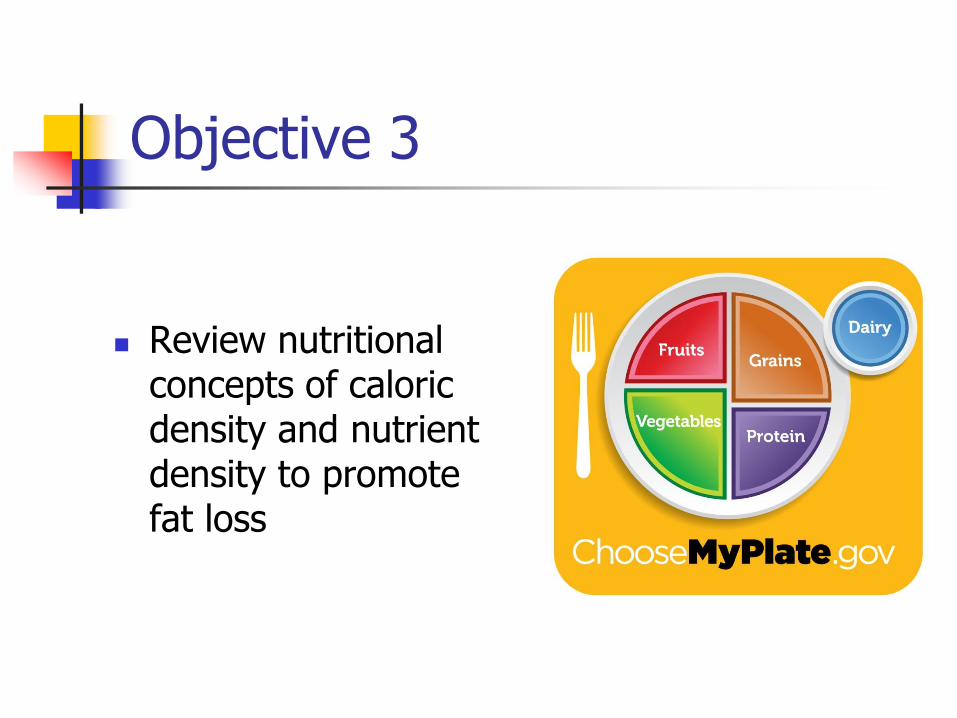
Objective 3
Review nutritional concepts of caloric density and nutrient density to promote fat loss
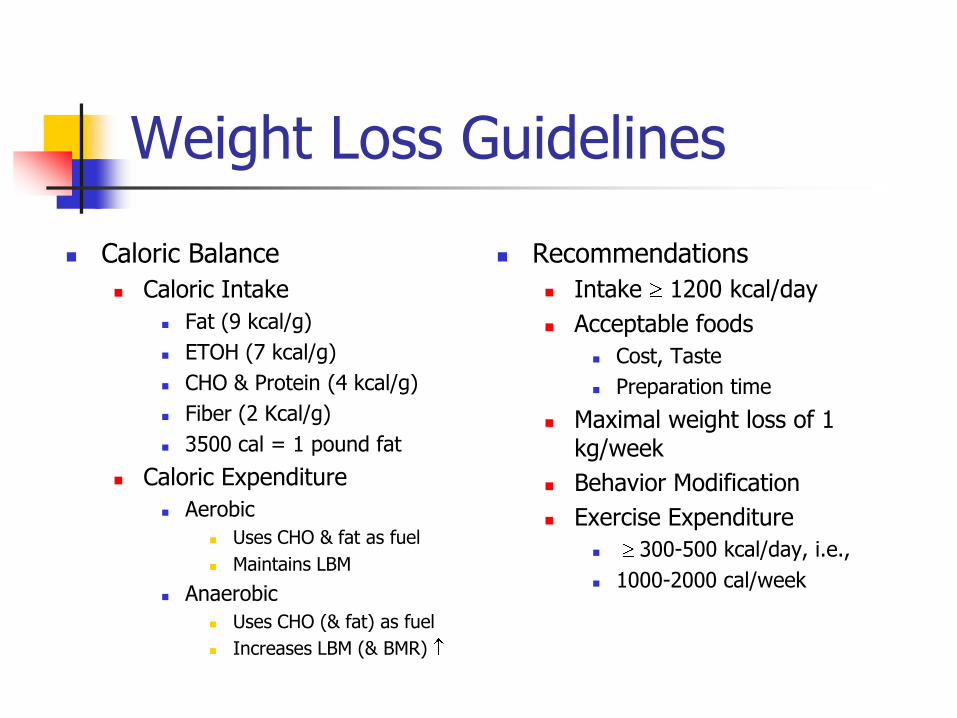
Weight Loss Guidelines
Caloric Balance
Caloric Intake
Fat (9 kcal/g)
ETOH (7 kcal/g)
CHO & Protein (4 kcal/g)
Fiber (2 Kcal/g)
3500 cal = 1 pound fat
Caloric Expenditure
Aerobic
Uses CHO & fat as fuel
Maintains LBM
Anaerobic
Uses CHO (& fat) as fuel
Increases LBM (& BMR)
Recommendations
Intake 1200 kcal/day
Acceptable foods
Cost, Taste
Preparation time
Maximal weight loss of 1 kg/week
Behavior Modification
Exercise Expenditure
300-500 kcal/day, i.e.,
1000-2000 cal/week
Caloric Requirements in SCI
Tetraplegia
15-20 lbs < IBW
Intake 10.3 Kcal/lb/d
Paraplegia
10-15 lbs < IBW
Intake 12.7 Kcal/lb/d
Obese: Use IBWAdj
[(WTactual – IBW)x.25] + IBW
Protein
20% Total Calories
Adequate protein is needed for wound healing and to prevent pressure ulcers
For patients at high risk of pressure ulcers, protein needs are 1.2 – 1.5 g/kg/d
With complicated or nonhealing wounds, protein needs are 1.5-2 g/kg/d
For long term health, protein requirements are 0.8 – 1.2 g/kg/day
Carbohydrates
50-60% Total Calories
Choose whole grains and whole grain products
Limit refined carbohydrates
Include legumes regularly
Include 6 to 10 small servings of fruits and vegetables each day
Fats
Total fat for most individuals should be no more than 30% of total calories Avoid fried foods
Limit added fats
Limit high fat snack foods
Make thoughtful choices when dining out
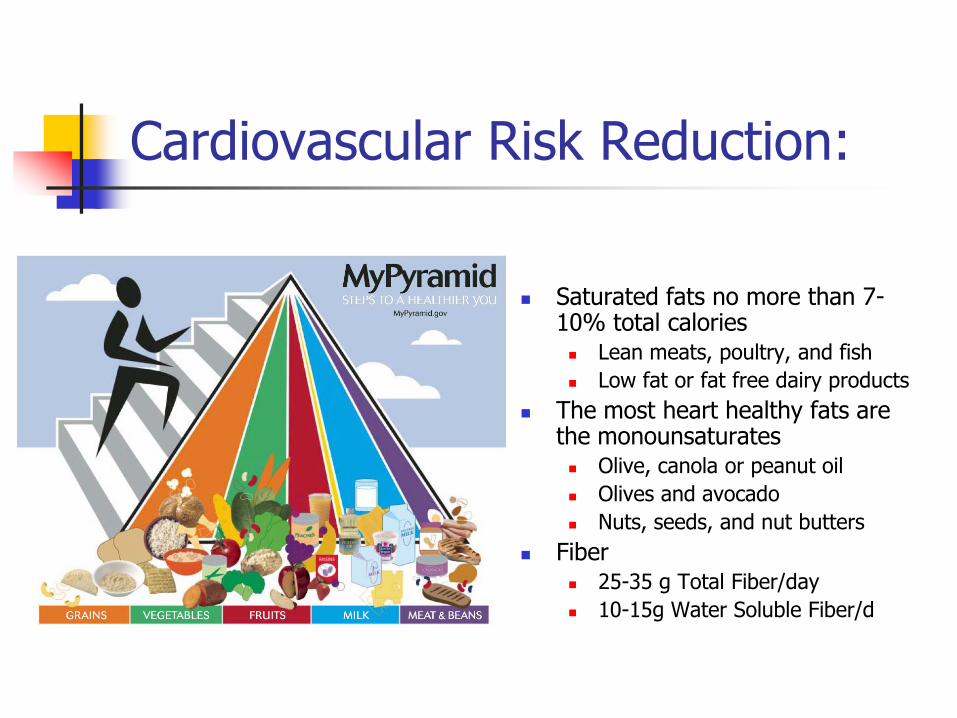
Cardiovascular Risk Reduction:
Saturated fats no more than 7-10% total calories Lean meats, poultry, and fish
Low fat or fat free dairy products
The most heart healthy fats are the monounsaturates Olive, canola or peanut oil
Olives and avocado
Nuts, seeds, and nut butters
Fiber 25-35 g Total Fiber/day
10-15g Water Soluble Fiber/d
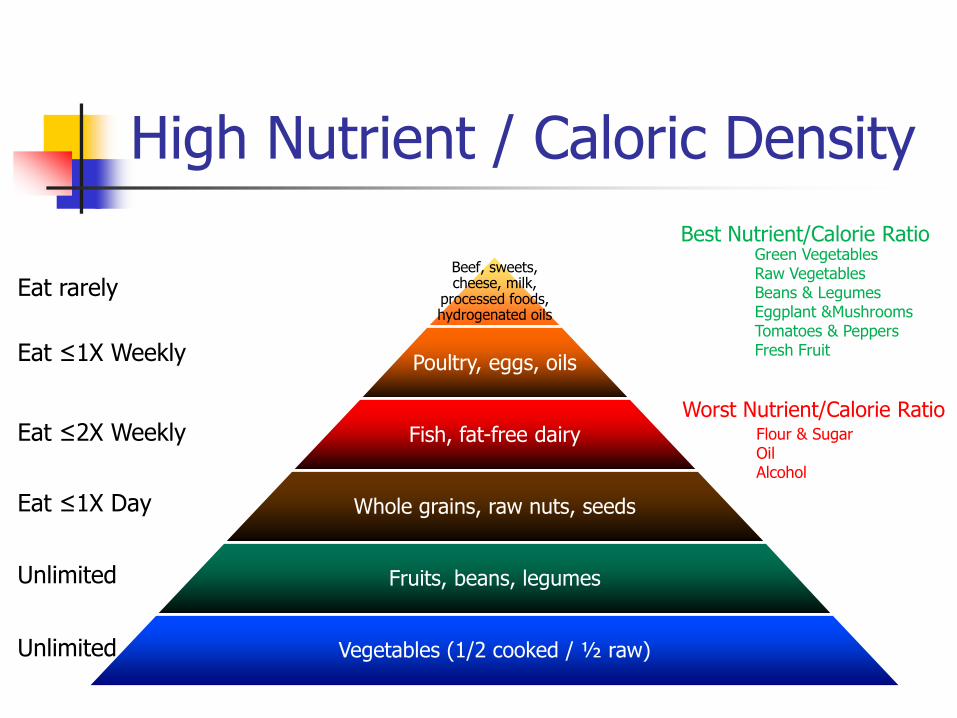
High Nutrient / Caloric Density
Beef, sweets, cheese, milk,
processed foods, hydrogenated oils
Poultry, eggs, oils
Fish, fat-free dairy
Whole grains, raw nuts, seeds
Fruits, beans, legumes
Vegetables (1/2 cooked / ½ raw)
Eat rarely
Eat ≤1X Weekly
Eat ≤2X Weekly
Eat ≤1X Day
Unlimited
Unlimited
Best Nutrient/Calorie Ratio Green Vegetables Raw Vegetables Beans & Legumes Eggplant &Mushrooms Tomatoes & Peppers Fresh Fruit
Worst Nutrient/Calorie Ratio Flour & Sugar Oil Alcohol
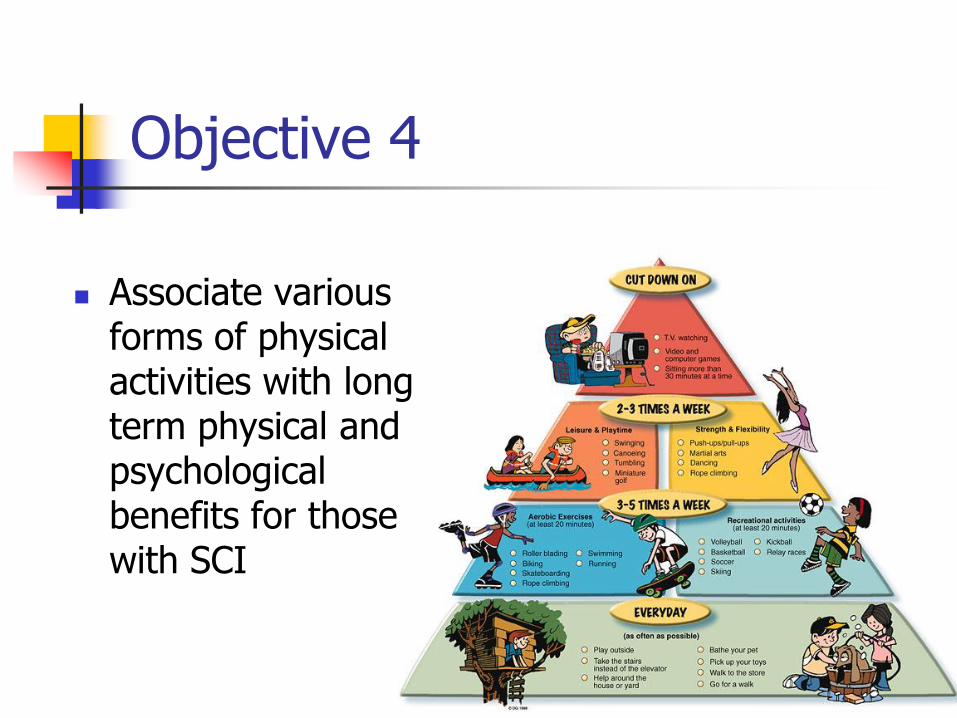
Objective 4
Associate various forms of physical activities with long term physical and psychological benefits for those with SCI
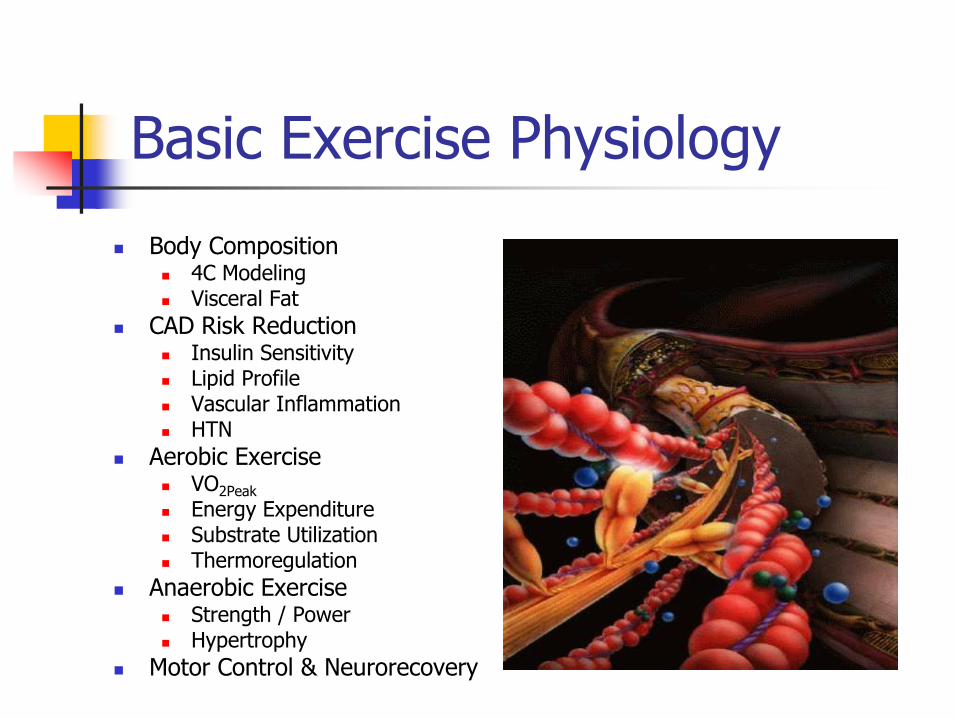
Basic Exercise Physiology
Body Composition 4C Modeling Visceral Fat
CAD Risk Reduction Insulin Sensitivity Lipid Profile Vascular Inflammation HTN
Aerobic Exercise VO2Peak
Energy Expenditure Substrate Utilization Thermoregulation
Anaerobic Exercise Strength / Power Hypertrophy
Motor Control & Neurorecovery
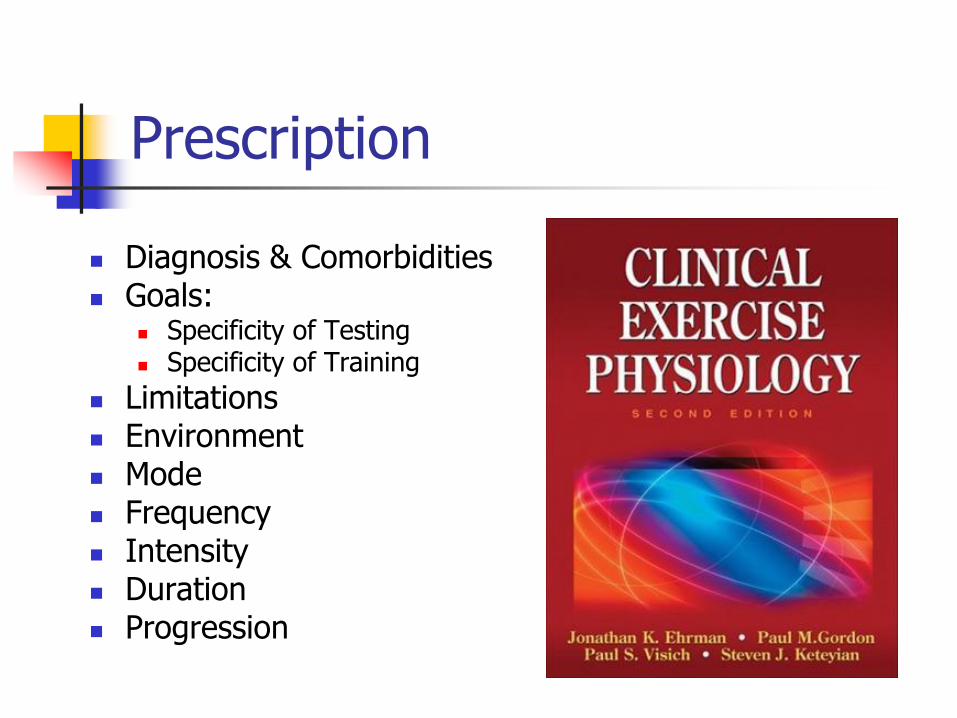
Prescription
Diagnosis & Comorbidities Goals:
Specificity of Testing Specificity of Training
Limitations Environment Mode Frequency Intensity Duration Progression
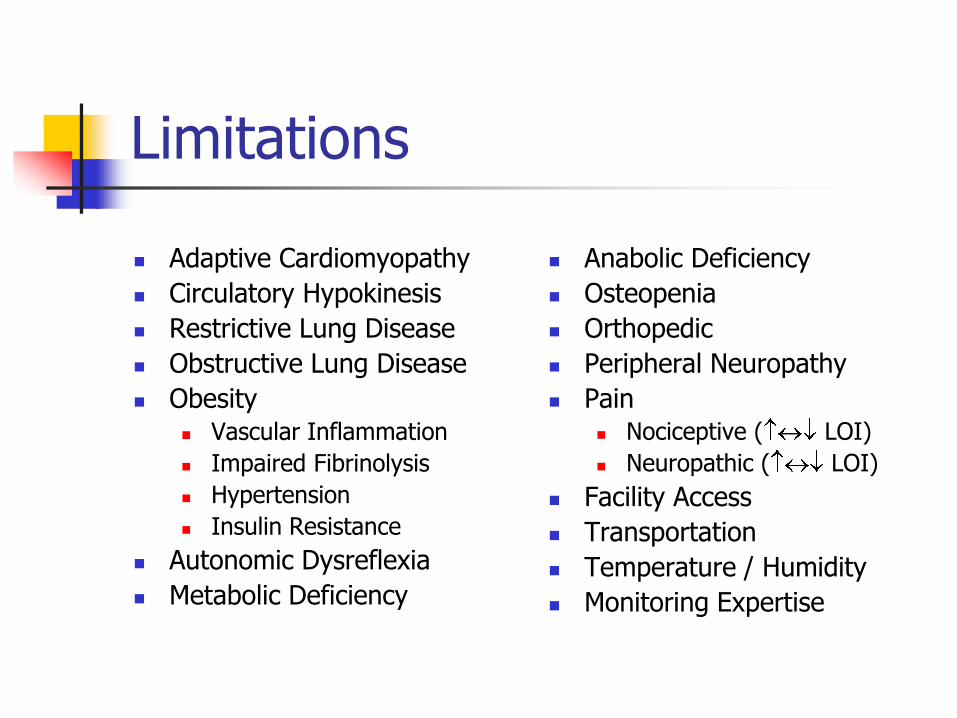
Limitations
Adaptive Cardiomyopathy
Circulatory Hypokinesis
Restrictive Lung Disease
Obstructive Lung Disease
Obesity Vascular Inflammation
Impaired Fibrinolysis
Hypertension
Insulin Resistance
Autonomic Dysreflexia
Metabolic Deficiency
Anabolic Deficiency
Osteopenia
Orthopedic
Peripheral Neuropathy
Pain Nociceptive ( LOI)
Neuropathic ( LOI)
Facility Access
Transportation
Temperature / Humidity
Monitoring Expertise
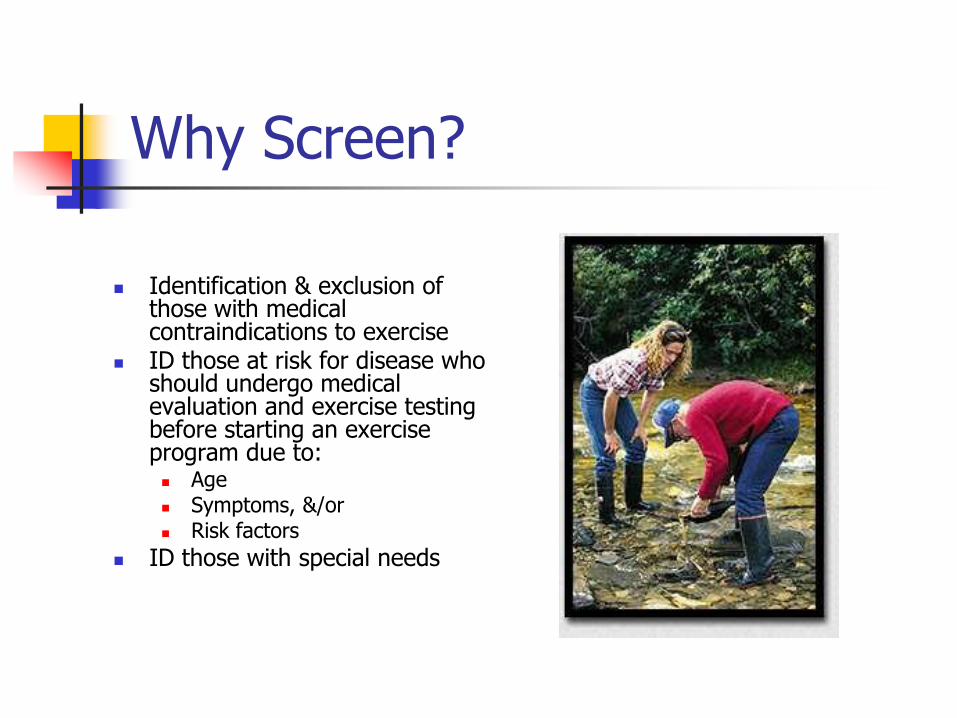
Why Screen?
Identification & exclusion of those with medical contraindications to exercise
ID those at risk for disease who should undergo medical evaluation and exercise testing before starting an exercise program due to: Age Symptoms, &/or Risk factors
ID those with special needs

Exercise Screening (ACSM)
CAD Risk Factors Family Hx
Male 1 Relative < 55 y.o.
Female 1 Relative < 65 y.o.
Cigarette Smoking
Hypertension SBP 140t or DBP 90t (>2x)
Hypercholesterolemia Total >200 mg%
HDL <40 mg%
LDL >100 mg%
Fasting Glucose 100 mg%
Obesity BMI 30 kg/m2 or Waist >100 cm
Sedentary Lifestyle
Major Signs or Symptoms Anginal equivalent at chest, neck,
jaw, arms Dyspnea on exertion Dizziness or syncope Orthopnea or Paroxysmal Nocturnal
Dyspnea Ankle Edema Palpitations or tachycardia Intermittent claudication Known heart murmur Unusual fatigue or dyspnea with
usual activities
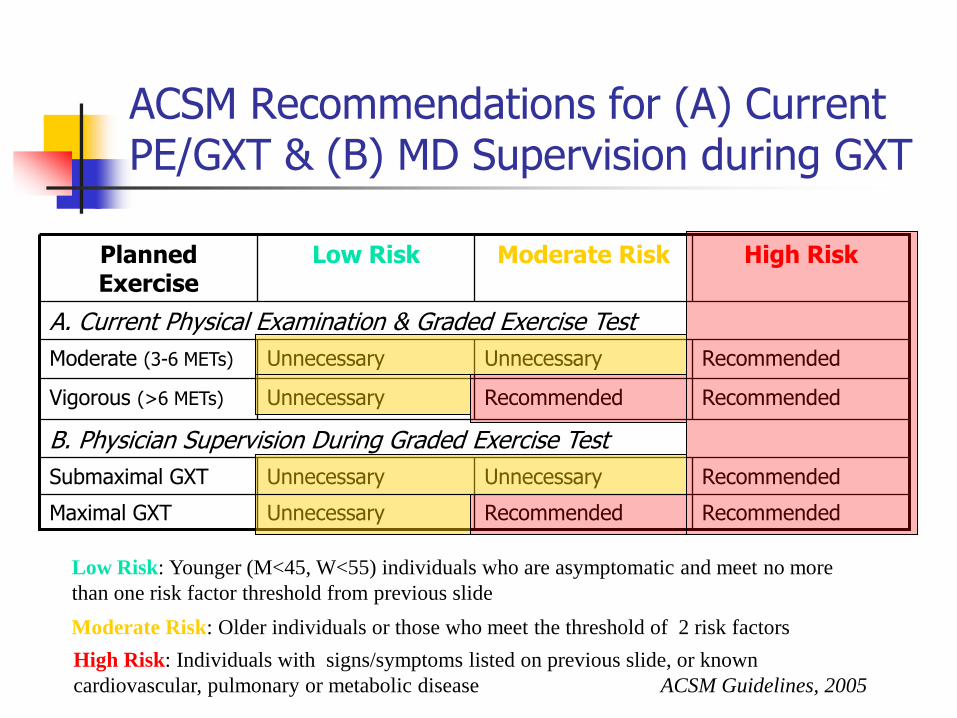
ACSM Recommendations for (A) Current PE/GXT & (B) MD Supervision during GXT
Planned Exercise
Low Risk Moderate Risk High Risk
A. Current Physical Examination & Graded Exercise Test
Moderate (3-6 METs) Unnecessary Unnecessary Recommended
Vigorous (>6 METs) Unnecessary Recommended Recommended
B. Physician Supervision During Graded Exercise Test
Submaximal GXT Unnecessary Unnecessary Recommended
Maximal GXT Unnecessary Recommended Recommended
Low Risk: Younger (M<45, W<55) individuals who are asymptomatic and meet no more
than one risk factor threshold from previous slide
Moderate Risk: Older individuals or those who meet the threshold of 2 risk factors
High Risk: Individuals with signs/symptoms listed on previous slide, or known
cardiovascular, pulmonary or metabolic disease ACSM Guidelines, 2005
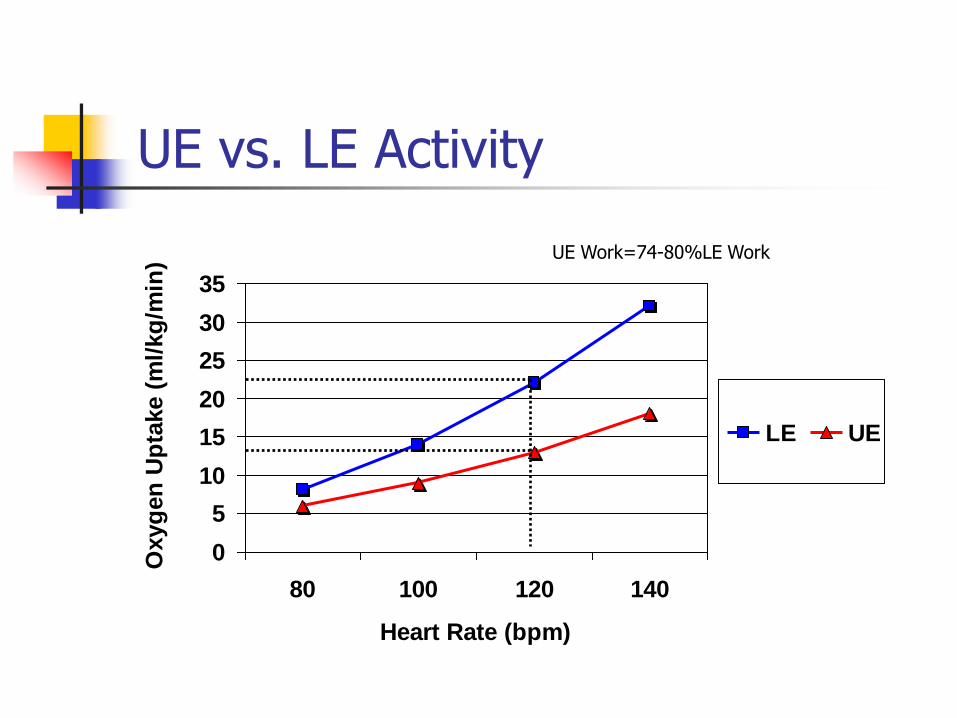
UE vs. LE Activity
0
5
10
15
20
25
30
35
80 100 120 140
Heart Rate (bpm)
Oxyg
en
Up
take (
ml/
kg
/min
)
LE UE
UE Work=74-80%LE Work
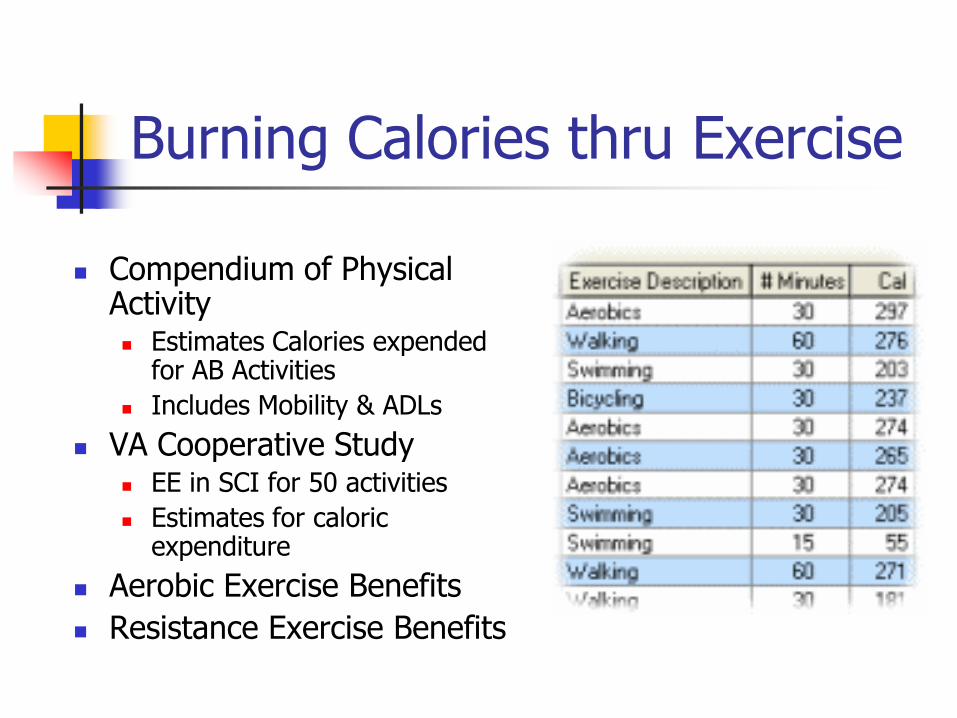
Burning Calories thru Exercise
Compendium of Physical Activity Estimates Calories expended
for AB Activities
Includes Mobility & ADLs
VA Cooperative Study EE in SCI for 50 activities
Estimates for caloric expenditure
Aerobic Exercise Benefits
Resistance Exercise Benefits
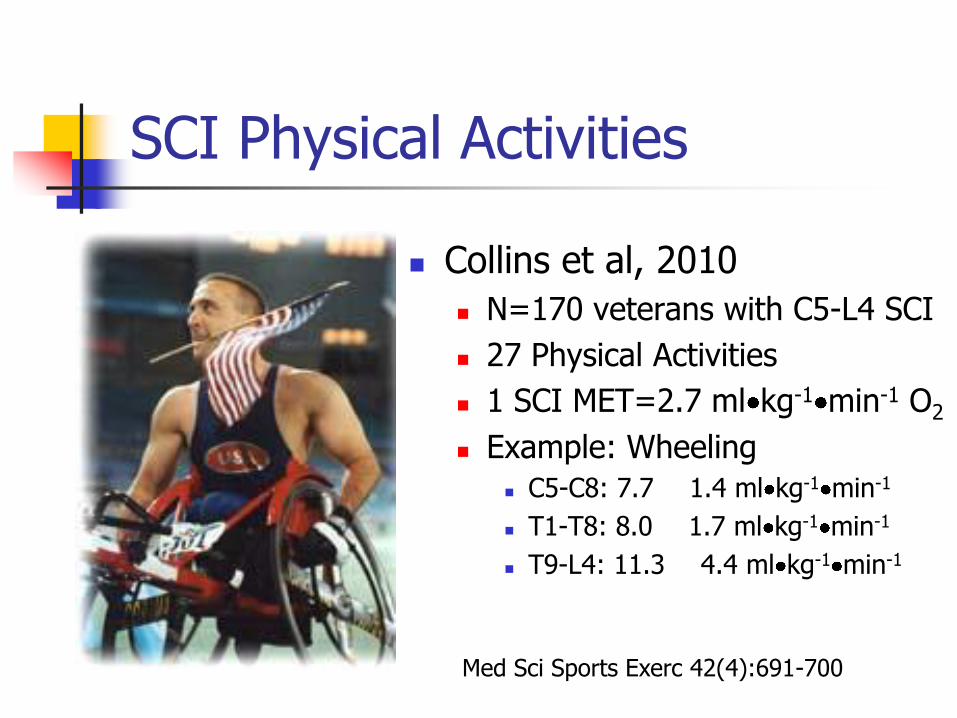
SCI Physical Activities
Collins et al, 2010
N=170 veterans with C5-L4 SCI
27 Physical Activities
1 SCI MET=2.7 ml kg-1 min-1 O2
Example: Wheeling
C5-C8: 7.7 1.4 ml kg-1 min-1
T1-T8: 8.0 1.7 ml kg-1 min-1
T9-L4: 11.3 4.4 ml kg-1 min-1
Med Sci Sports Exerc 42(4):691-700
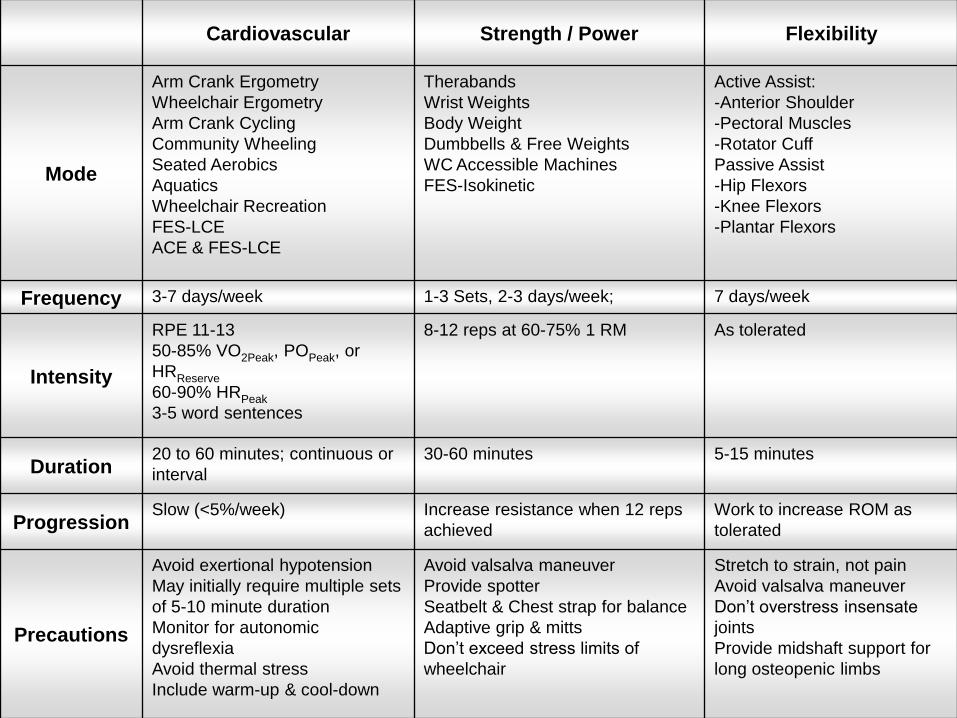
Cardiovascular Strength / Power Flexibility
Mode
Arm Crank Ergometry
Wheelchair Ergometry
Arm Crank Cycling
Community Wheeling
Seated Aerobics
Aquatics
Wheelchair Recreation
FES-LCE
ACE & FES-LCE
Therabands
Wrist Weights
Body Weight
Dumbbells & Free Weights
WC Accessible Machines
FES-Isokinetic
Active Assist:
-Anterior Shoulder
-Pectoral Muscles
-Rotator Cuff
Passive Assist
-Hip Flexors
-Knee Flexors
-Plantar Flexors
Frequency 3-7 days/week 1-3 Sets, 2-3 days/week; 7 days/week
Intensity
RPE 11-13
50-85% VO2Peak, POPeak, or
HRReserve
60-90% HRPeak
3-5 word sentences
8-12 reps at 60-75% 1 RM As tolerated
Duration 20 to 60 minutes; continuous or
interval
30-60 minutes 5-15 minutes
Progression Slow (<5%/week) Increase resistance when 12 reps
achieved
Work to increase ROM as
tolerated
Precautions
Avoid exertional hypotension
May initially require multiple sets
of 5-10 minute duration
Monitor for autonomic
dysreflexia
Avoid thermal stress
Include warm-up & cool-down
Avoid valsalva maneuver
Provide spotter
Seatbelt & Chest strap for balance
Adaptive grip & mitts
Don’t exceed stress limits of
wheelchair
Stretch to strain, not pain
Avoid valsalva maneuver
Don’t overstress insensate
joints
Provide midshaft support for
long osteopenic limbs
Exercise for SCI?
“I'm sorry. My responses are limited. You must ask the right questions“ Is it possible to achieve
negative energy balance after SCI?
“That, Detective, is the right question.”
Dr. Alfred Lanning to Det. Dell Spooner
I, Robot (2004)
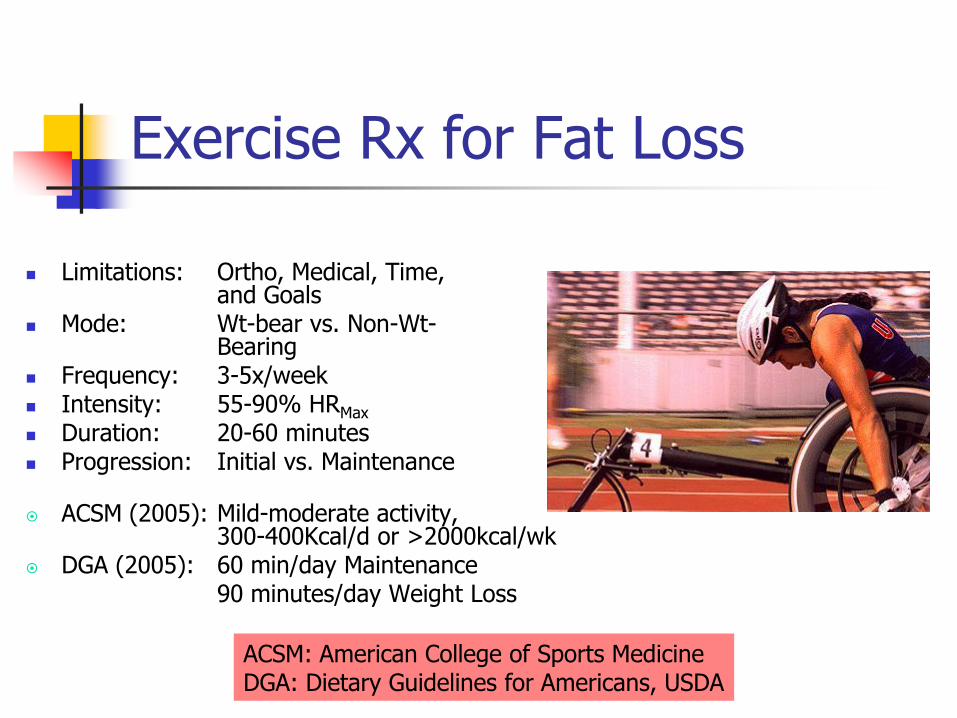
Exercise Rx for Fat Loss
Limitations: Ortho, Medical, Time, and Goals
Mode: Wt-bear vs. Non-Wt- Bearing
Frequency: 3-5x/week Intensity: 55-90% HRMax Duration: 20-60 minutes Progression: Initial vs. Maintenance
ACSM (2005): Mild-moderate activity,
300-400Kcal/d or >2000kcal/wk DGA (2005): 60 min/day Maintenance 90 minutes/day Weight Loss
ACSM: American College of Sports Medicine DGA: Dietary Guidelines for Americans, USDA
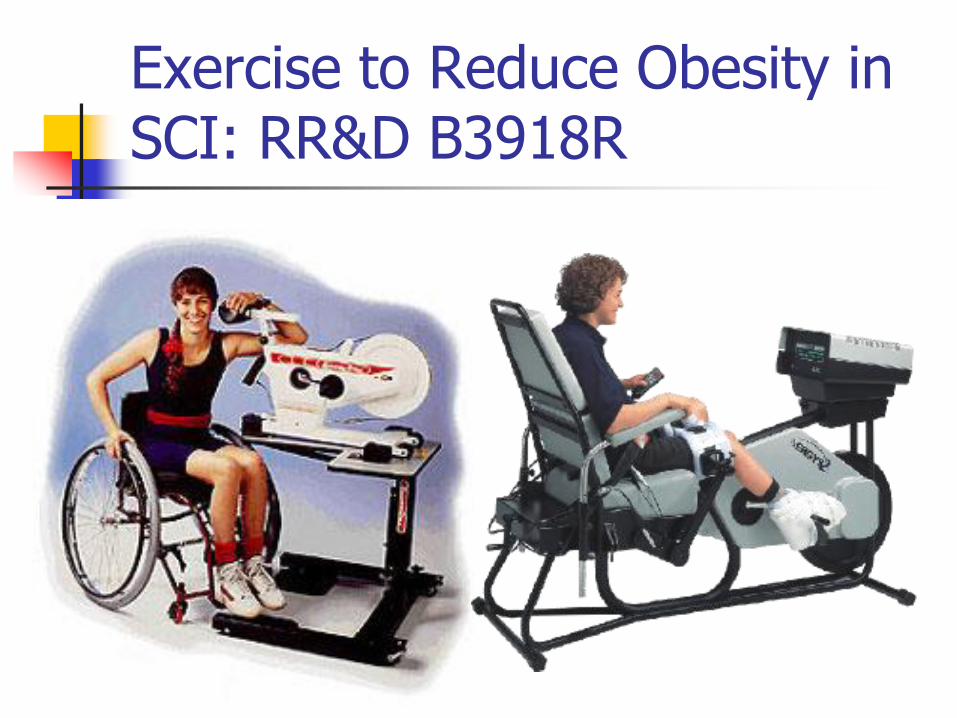
Exercise to Reduce Obesity in SCI: RR&D B3918R

Glucose Transporters
G G
G
G
G G
G
GLUT4I
GLUT4A
G
G G GLUT4A
EXERCISE
AMP:ATP CR:PCr
AMP Kinase
PI 3-Kinase
GLUT4 Transcription
GLUT4I
I
GLUT4I
GLUT4I Non-Insulin- Mediated Glucose Transport
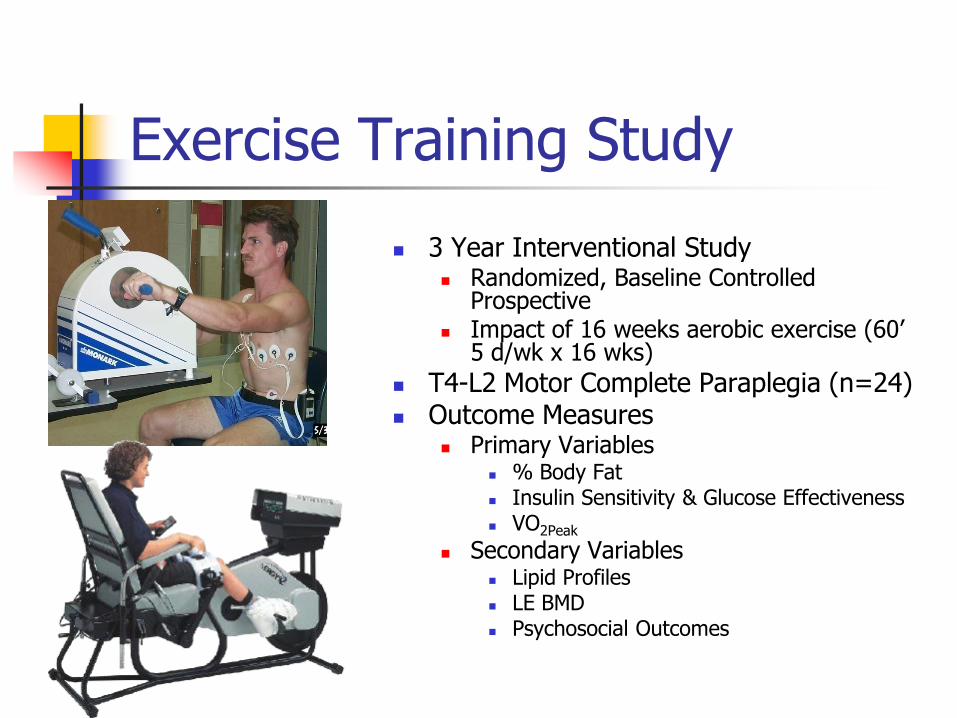
Exercise Training Study
3 Year Interventional Study Randomized, Baseline Controlled
Prospective Impact of 16 weeks aerobic exercise (60’
5 d/wk x 16 wks)
T4-L2 Motor Complete Paraplegia (n=24) Outcome Measures
Primary Variables % Body Fat Insulin Sensitivity & Glucose Effectiveness VO2Peak
Secondary Variables Lipid Profiles LE BMD Psychosocial Outcomes
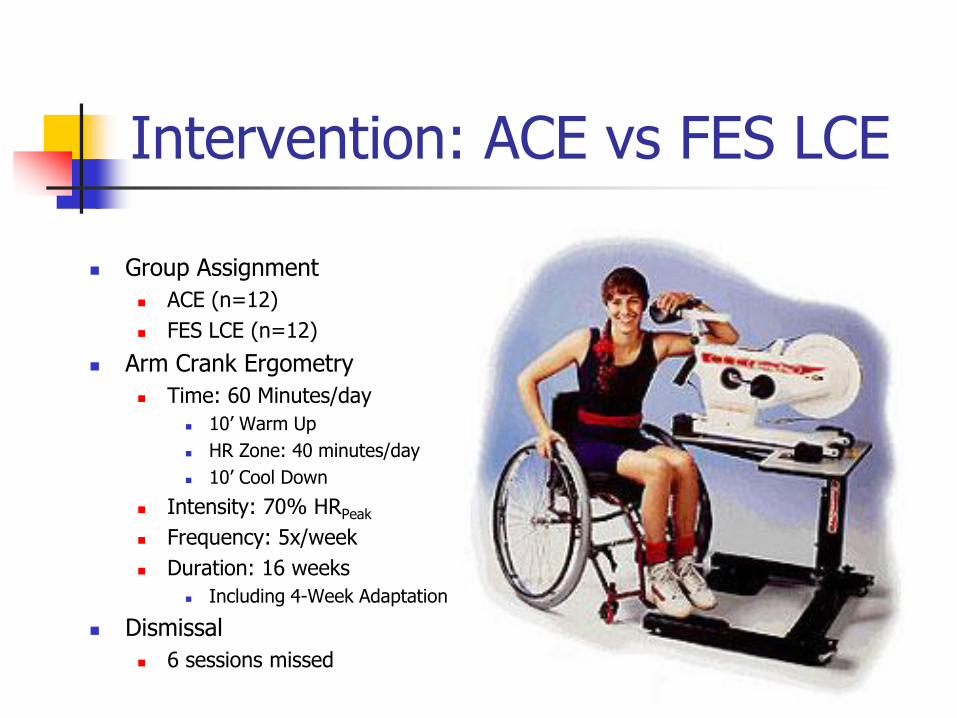
Intervention: ACE vs FES LCE
Group Assignment
ACE (n=12)
FES LCE (n=12)
Arm Crank Ergometry
Time: 60 Minutes/day
10’ Warm Up
HR Zone: 40 minutes/day
10’ Cool Down
Intensity: 70% HRPeak
Frequency: 5x/week
Duration: 16 weeks
Including 4-Week Adaptation
Dismissal
6 sessions missed
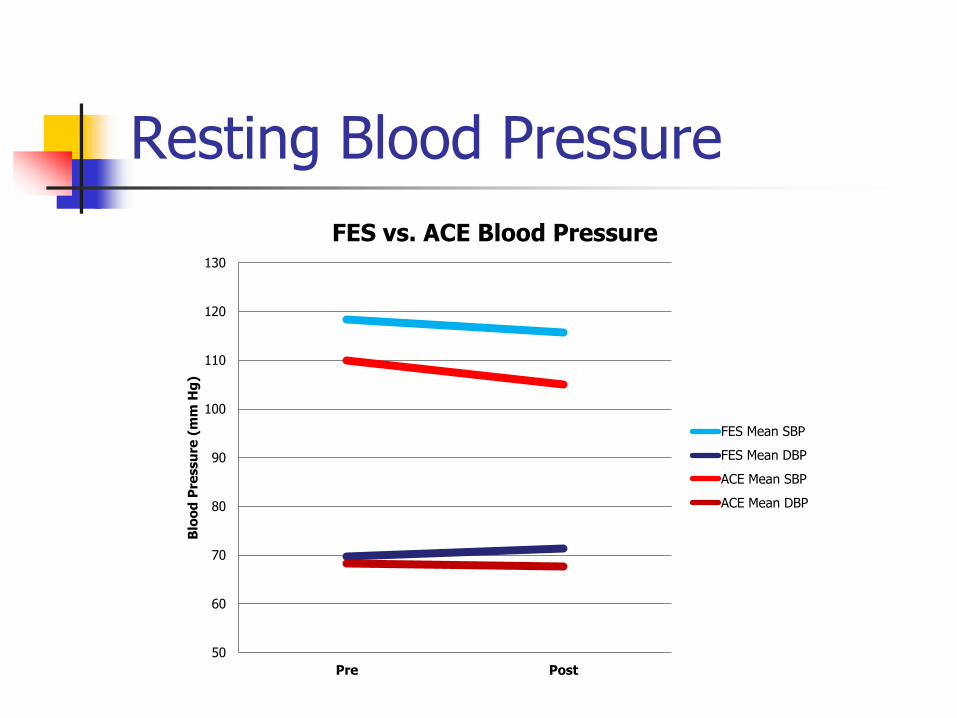
Resting Blood Pressure
50
60
70
80
90
100
110
120
130
Pre Post
Blo
od
Pre
ssu
re (
mm
Hg
)
FES vs. ACE Blood Pressure
FES Mean SBP
FES Mean DBP
ACE Mean SBP
ACE Mean DBP
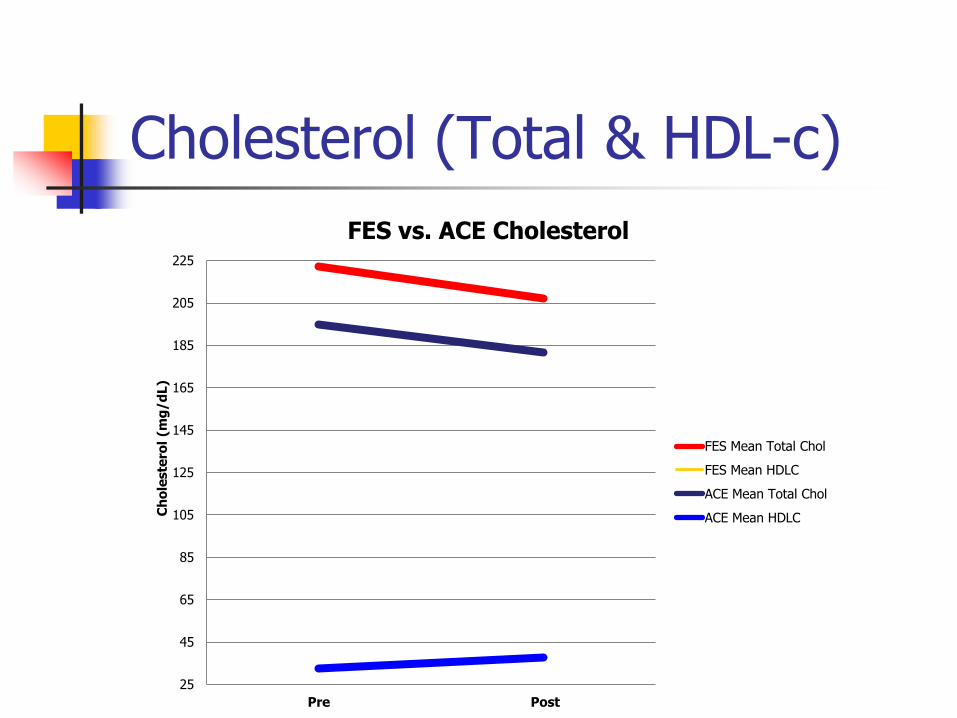
Cholesterol (Total & HDL-c)
25
45
65
85
105
125
145
165
185
205
225
Pre Post
Ch
ole
ste
rol
(mg
/d
L)
FES vs. ACE Cholesterol
FES Mean Total Chol
FES Mean HDLC
ACE Mean Total Chol
ACE Mean HDLC
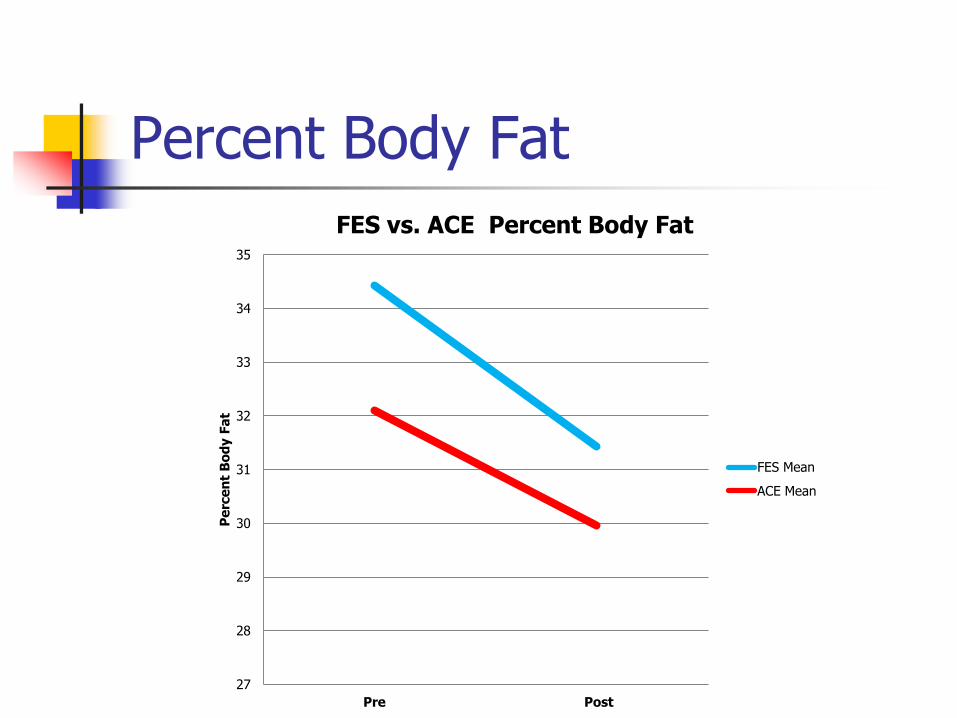
Percent Body Fat
27
28
29
30
31
32
33
34
35
Pre Post
Pe
rce
nt
Bo
dy F
at
FES vs. ACE Percent Body Fat
FES Mean
ACE Mean
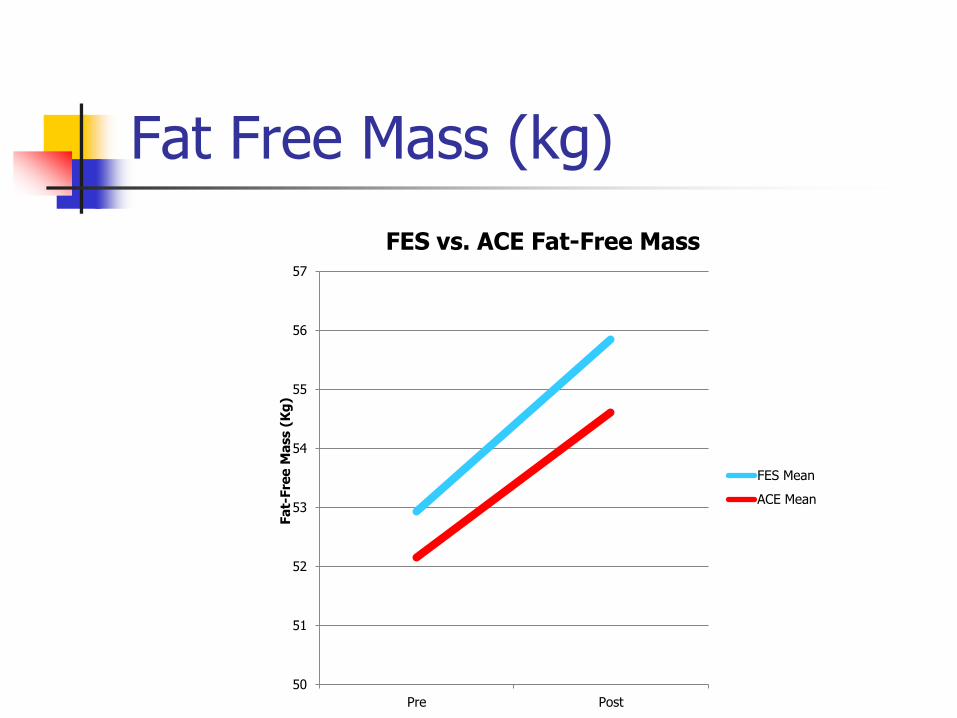
Fat Free Mass (kg)
50
51
52
53
54
55
56
57
Pre Post
Fa
t-Fre
e M
ass (
Kg
)
FES vs. ACE Fat-Free Mass
FES Mean
ACE Mean
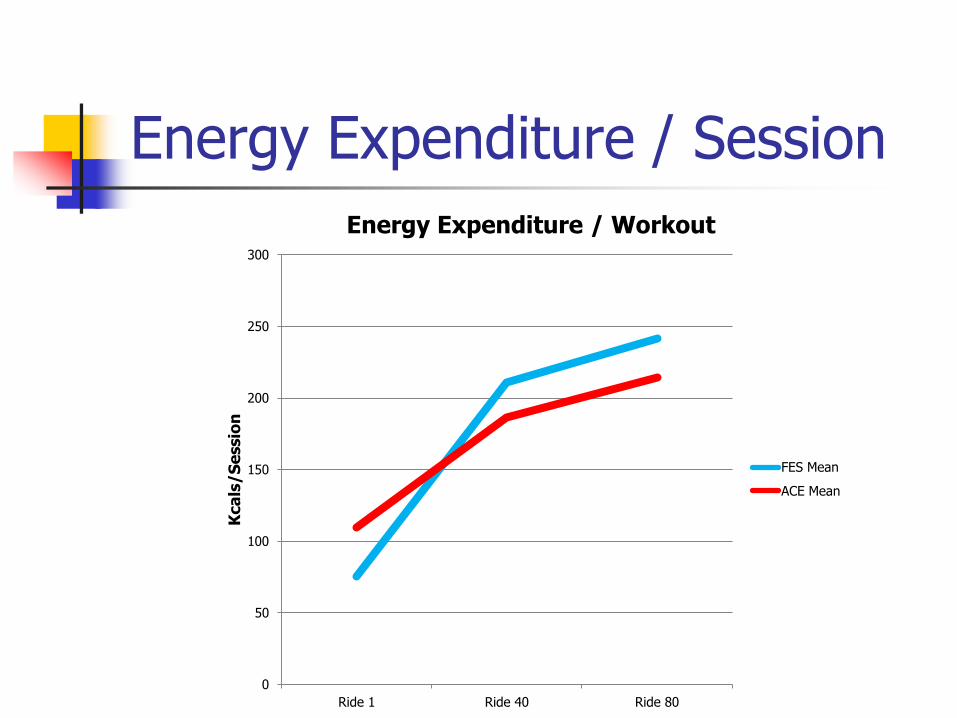
Energy Expenditure / Session
0
50
100
150
200
250
300
Ride 1 Ride 40 Ride 80
Kca
ls/S
essio
n
Energy Expenditure / Workout
FES Mean
ACE Mean

Anaerobic Exercise for FFB
Limitations: Ortho, Medical, Time, Goals
Mode: Free Weight vs Machine Isometric
Isotonic
Isokinetic
Frequency: 2-4x/wk
Intensity: >65% 1RM Repetitions: 1-10
Sets: 3-6
Recovery: 2-3 minutes/set
Periodization
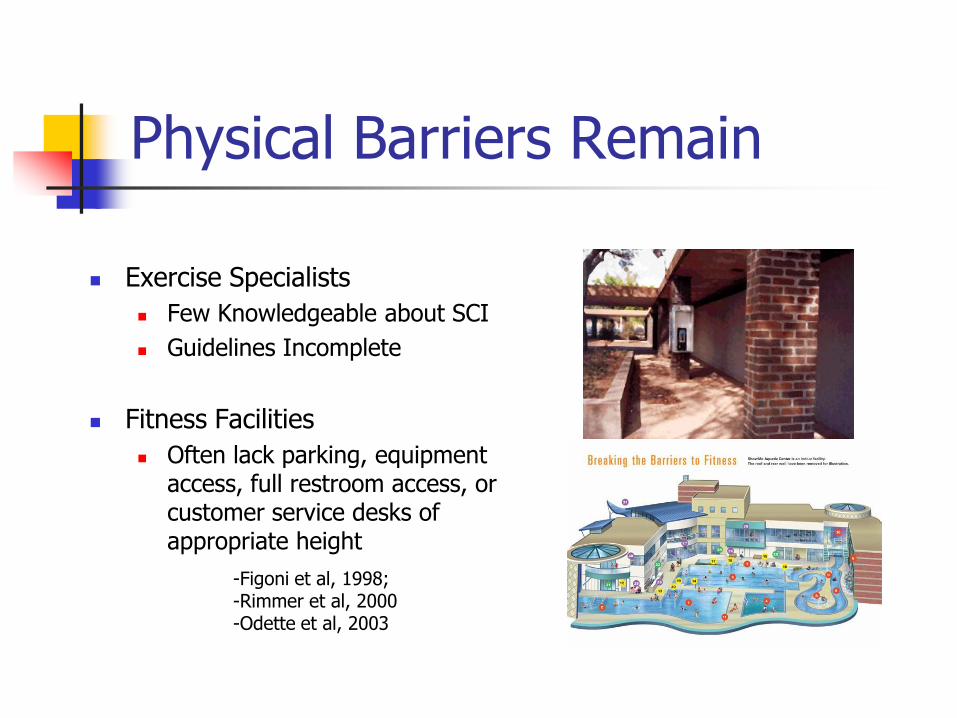
Physical Barriers Remain
Exercise Specialists
Few Knowledgeable about SCI
Guidelines Incomplete
Fitness Facilities
Often lack parking, equipment access, full restroom access, or customer service desks of appropriate height
-Figoni et al, 1998; -Rimmer et al, 2000 -Odette et al, 2003
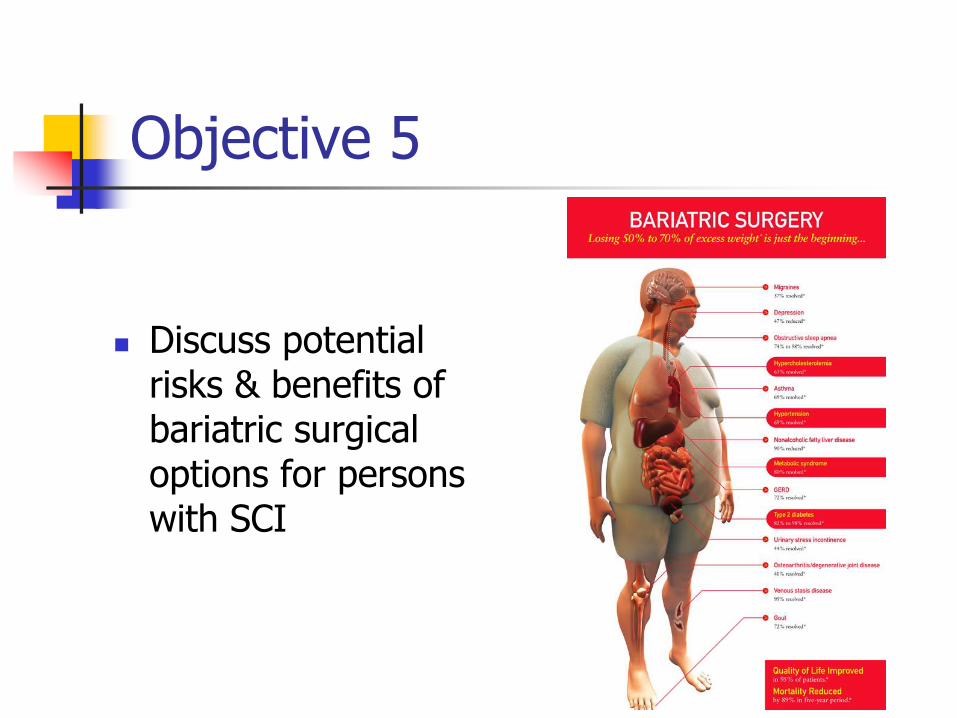
Objective 5
Discuss potential risks & benefits of bariatric surgical options for persons with SCI
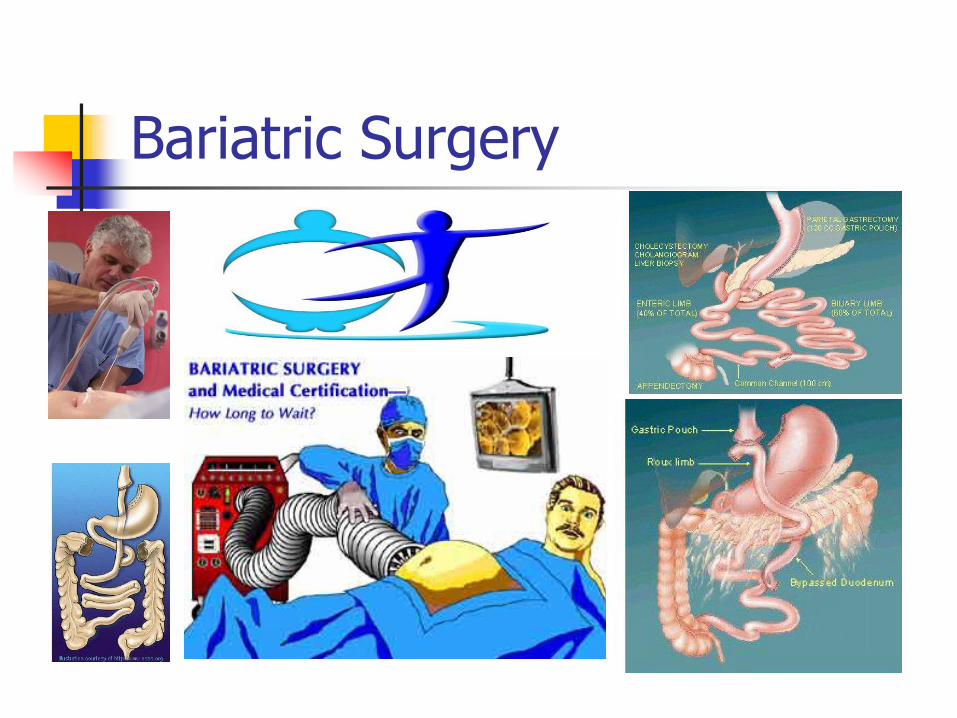
Bariatric Surgery
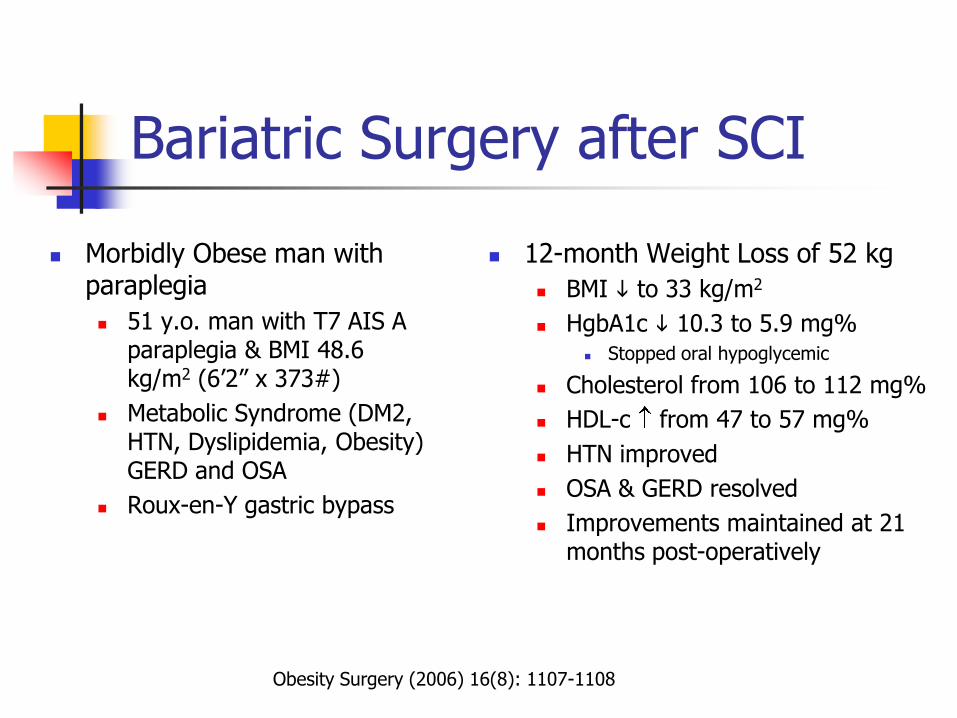
Bariatric Surgery after SCI
Morbidly Obese man with paraplegia
51 y.o. man with T7 AIS A paraplegia & BMI 48.6 kg/m2 (6’2” x 373#)
Metabolic Syndrome (DM2, HTN, Dyslipidemia, Obesity) GERD and OSA
Roux-en-Y gastric bypass
12-month Weight Loss of 52 kg
BMI to 33 kg/m2
HgbA1c 10.3 to 5.9 mg% Stopped oral hypoglycemic
Cholesterol from 106 to 112 mg%
HDL-c from 47 to 57 mg%
HTN improved
OSA & GERD resolved
Improvements maintained at 21 months post-operatively
Obesity Surgery (2006) 16(8): 1107-1108
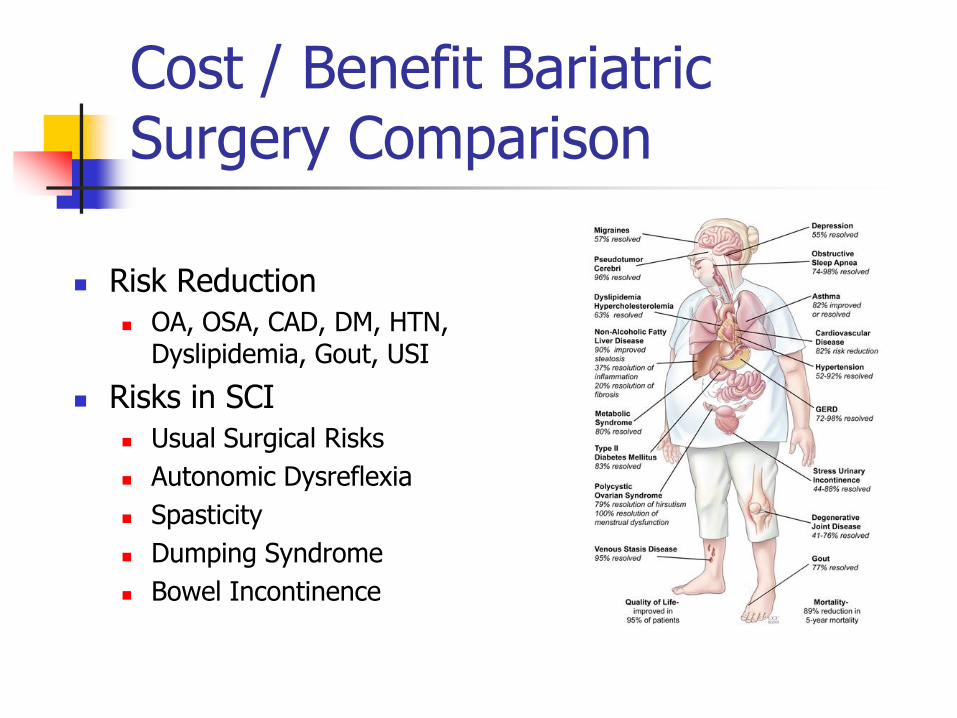
Cost / Benefit Bariatric Surgery Comparison
Risk Reduction
OA, OSA, CAD, DM, HTN, Dyslipidemia, Gout, USI
Risks in SCI
Usual Surgical Risks
Autonomic Dysreflexia
Spasticity
Dumping Syndrome
Bowel Incontinence

Summary
Obesity is underappreciated in SCI Epidemic proportions
Central mediator of the Metabolic Syndrome Central Obesity
Dyslipidemia High Triglycerides
Low HDL-cholesterol
Hypertension
Insulin Resistance
Treatment Options Behavior Modification
Pharmacological

Acknowledgements
VA Research Career Development Award
EPVA Scholar Award
VA RR&D B3307R
VA RR&D B3155R
VA RR&D B3918R
VA HSR&D
NIH NCRR K23 Mentored Clinical Research
NIDRR Model SCI System Grant H133N000009
NIDRR H133G040274
NIH NCRR General Clinical Research Grant
PVA SCRF Grant
Bibliography
Aksnes AK, Hjeltnes N, Wahlstrom EO, Katz A, Zierath JR, Wallberg-Henriksson H Intact glucose transport in morphologically altered denervated skeletal muscle from quadriplegic patients. American Journal of Physiology 271(3 Pt 1):E593-600, 1996.
Bauman WA and Spungen AM. Disorders of carbohydrate and lipid metabolism in veterans with paraplegia or quadriplegia: a model of premature aging. Metabolism 43(6):749-756, 1994.
Bauman WA, Spungen AM, Wang J, Pierson RN. The relationship between energy expenditure and lean tissue in monozygotic twins discordant for spinal cord injury. J Rehab Res Dev 41(1):108, 2004.
Bauman WA, Spungen AM, Zhong YG, Rothstein JL, Petry C, Gordon SK. Depressed serum high density lipoprotein cholesterol levels in veterans with spinal cord injury. Paraplegia 30:697-703, 1992b.
Blissitt PA. Nutrition in acute spinal cord injury. Critical Care Nursing Clinics of North America. 2(3):375-84, 1990.
Bosch PR, Wells CL. Effect of immersion on residual volume of able-bodied and spinal cord injured males. Medicine and Science in Sports and Exercise 23:384-388, 1991.
Bibliography (Continued)
Bulbulian R, Johnson RE, Gruber JJ, Darabos B. Body composition in paraplegic male athletes. Medicine and Science in Sports and Exercise 12:195-201, 1987.
Buchholz AC. McGillivray CF. Pencharz PB. Differences in resting metabolic rate between paraplegic and able-bodied subjects are explained by differences in body composition. American Journal of Clinical Nutrition. 77(2):371-8, 2003.
Cardus D, McTaggart WG. Body composition in spinal cord injury. Archives of physical Medicine and Rehabilitation 66:257-259, 1985.
Duckworth WC, Jallepalli P, Solomon SS. Glucose intolerance in spinal cord injury. Archives of Physical Medicine and Rehabilitation 64:107-110, 1983.
Gass GC, Camp EM. Physiological characteristics of trained Australian paraplegic and tetraplegic subjects. Medicine and Science in Sports and Exercise 11:256-259, 1979.
George CM, Wells CL, Dugan NL, Hardison R. Hydrostatic weights of patients with spinal cord injury. Physical Therapy 67:921-925, 1987.
Bibliography (Continued)
Hjeltnes N et al. Improved body composition after 8 wk of electrically stimulated leg cycling in tetraplegic patients. In: Am J Phys (1997) 273(42): R1072-R1079
Jones LM. Legge M. Goulding A. Healthy body mass index values often underestimate body fat in men with spinal cord injury. Archives of Physical Medicine & Rehabilitation. 84(7):1068-71, 2003.
Kocina P. Body composition of spinal cord injured adults. Sports Medicine 23:48-60, 1997.
Mollinger LA, Sparr GB, El Ghatet AZ, et al. Daily energy expenditure and basal metabolic rates of patients with spinal cord injury. Archives of Physical Medicine and Rehabilitation 66:420-426.
Murphy RJL et al. Salbutamol effect in spinal cord injured individuals undergoing functional electrical stimulation training. In: Arch PM&R (1999) 80:1264-7
Olle MM, Pivarnik JM, Klish WJ, Morrow JR. Body composition and physically active spinal cord injured individuals estimated from total body electrical conductivity. Archives of Physical Medicine and Rehabilitation 74:706-710, 1993.
Bibliography (Continued)
Scremin AME et al. Increasing muscle mass in spinal cord injured persons with a functional electrical stimulation exercise program. In: Arch PM&R (1999) 80:1531-6
Sedlock DA, Laventure SJ. Body composition and resting energy expenditure in long term spinal cord injury. Paraplegia 28:448-454, 1990.
Tharion G. Prasad KR. Gopalan L. Bhattacharji S. Glucose intolerance and dyslipidaemias in persons with paraplegia and tetraplegia in south India. Spinal Cord. 36(4):228-30, 1998.
Zhong Y-G, Levy E, Bauman WA. The relationships among serum uric acid, plasma insulin, and serum lipoprotein levels in subjects with spinal cord injury. Hormone and Metabolism Research 27:283-286, 1995.
Zlotolow SP. Levy E. Bauman WA. The serum lipoprotein profile in veterans with paraplegia: the relationship to nutritional factors and body mass index. Journal of the American Paraplegia Society. 15(3):158-62, 1992.