
ALA Midwinter 2017: APA Style CENTRAL In-Booth Presentations
Upload
marcia-atkinsCategory
view
215download
1
OBE: Outcomes-Based Evaluation
ALA Midwinter Meeting
January 25th, 2013
Presented by Kit Keller

Workshop goals
Provide an understanding of outcomes-based planning and evaluation so grantees may refine Smart investing@your library® evaluation and marketing plans.
Set the stage for effective program implementation.
2

Part 1 – What is outcomes-based evaluation?
Part 2 – What data should I collect? When?
Workshop schedule
3

What are outcomes?
Will I know it when I see it?
How can I track them?
What is outcomes-based evaluation?
4

What are outcomes?
Outcomes are benefits to people.
Outcomes are changes in skills, knowledge, attitude, behavior, condition, or life status.
5

Like what?
Learned how to read a credit report. Knowledge
Learned how to compare mortgage loan offers. Knowledge and skill
Can balance my checkbook. Skill
Know how to safely pay bills online. Skill
Feel in control of finances. Attitude
6
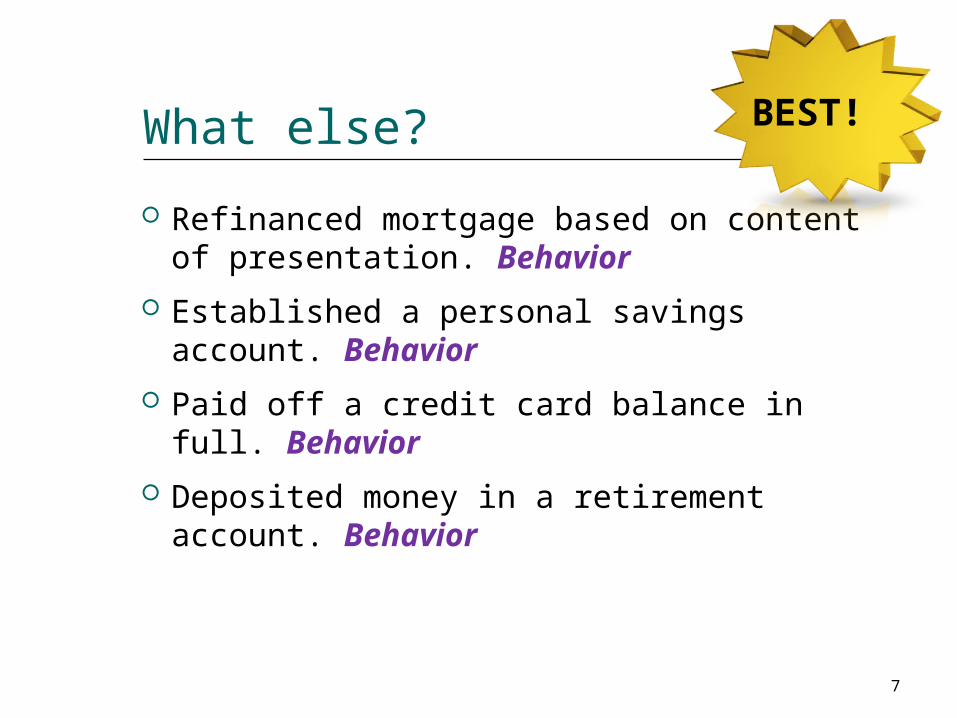
What else?
Refinanced mortgage based on content of presentation. Behavior
Established a personal savings account. Behavior
Paid off a credit card balance in full. Behavior
Deposited money in a retirement account. Behavior
BEST!
7

Behavior changes …
…lead to changes in life status.
8

See if programs really make a difference in the lives of people.
Improve programs.
Improve planning.
Improve accountability.
Ensure best use of funds.
Demonstrate impact.
Satisfy funders.
Why measure outcomes?
9

What can OBE do?
Improve program effectiveness.
Demonstrate success.
Facilitate program adjustment.
Inform future project planners.
10

Process and impact
Evaluating the process: allows you to see how efficient your program is.
Evaluating the impact: allows you to know if your program is making a difference.
11

Grant program elements
Inputs
Resources used by the program
Outcomes
Measures of participant change
Outputs
Counts of activities
Activities
Actions of the program
12

Examples of inputs, activities, services, and outputs
Inputs: Resources dedicated to or consumed by the program.
Activities: Program actions that are management related.
Services: Program actions that directly involve end users.
Outputs: Numbers of direct program products
Staff, time, computers, facilities, materials, money (source), consultants, website, software, Internet, instructors
Recruiting,coordinating, promoting,purchasing,scheduling, and evaluating activities.
Conducting workshops, mentoring, online offerings, following up with customers.
Number of participants served; materials developed and used; workshops offered; website usage counts.
13

Outputs and outcomes
Outputs are not outcomes.
Outputs tell us how much we’ve done.
Outcomes tell us how much difference we’ve made.
Outcomes do not replace outputs; they complement them.
Both are important to provide a full picture of a program’s results.
14

Programs and services
Workshops
Classes
Marketing
Collection development
Partnership development
15

Smart investing@your® library program goals
Community members will: view the library as a reliable place for
unbiased financial and investment information. [Attitude]
make increased use of library programs and resources. [Behavior]
be more knowledgeable about key financial and investment issues. [Knowledge]
16

Individual project goals – examples
Increase access to financial literacy materials.
Improve reference skills of staff in areas of finance and financial literacy.
Increase investment knowledge of target audience.
17

Project outputs – examples
18
o 250 participants attended 5 workshops
o 45 participants attended counseling sessions
o 1,200 children participated in kick-off program
o Purchased 38 eBooks and 41 audiobooks
o In 4 months each new book was borrowed an average of 8.78 times
o 2,600 brochures were distributed

Outputs vs. outcomes Three programs held
Website developed
Print, electronic materials increased 10%
100 PSAs run
Participants know about several types of investment vehicles.
Patrons regularly use investment website to help with personal finance decisions.
Patrons use materials from investment collection to inform decision-making.
Participants report PSA motivated attendance.
19
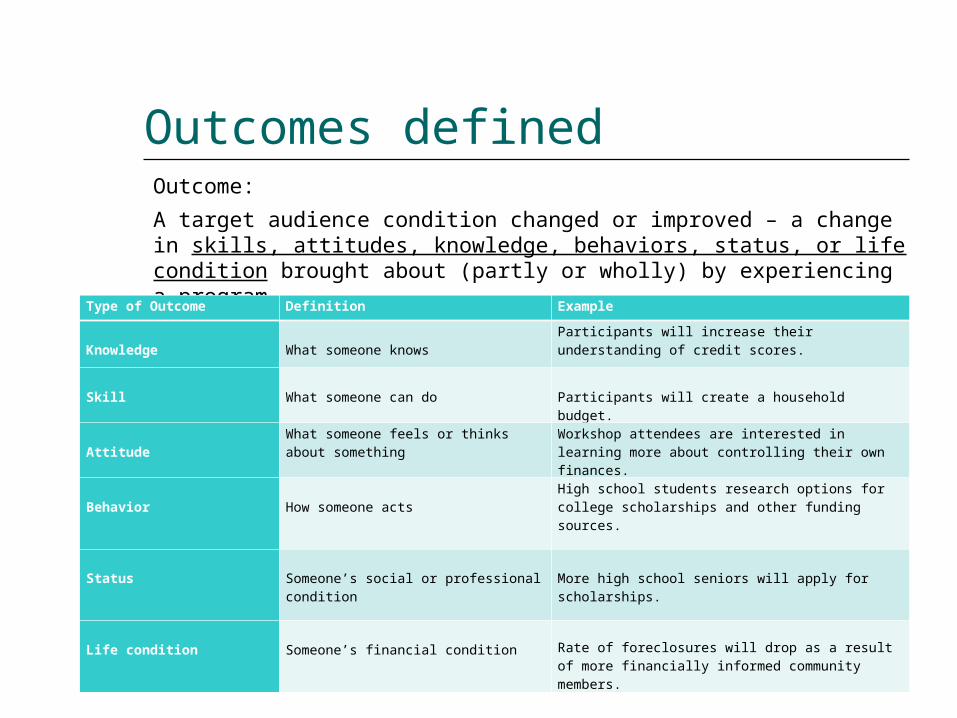
Outcomes definedOutcome:
A target audience condition changed or improved – a change in skills, attitudes, knowledge, behaviors, status, or life condition brought about (partly or wholly) by experiencing a program.
20
Type of Outcome Definition Example
Knowledge
What someone knows
Participants will increase their understanding of credit scores.
Skill
What someone can do
Participants will create a household budget.
Attitude
What someone feels or thinks about something
Workshop attendees are interested in learning more about controlling their own finances.
Behavior
How someone acts
High school students research options for college scholarships and other funding sources.
Status
Someone’s social or professional condition
More high school seniors will apply for scholarships.
Life condition
Someone’s financial condition Rate of foreclosures will drop as a result of more
financially informed community members.

Get ready
Smart investing goals at the library level: Increased requests for investment materials
Increased visits to library website
Increased awareness of library resources
Increased staff competencies
21

Sample outcome statements All reference staff can use key financial and
investment resources.
Staff coordinate financial literacy training for patrons.
Patrons know where to find credible, unbiased financial information online.
22

Outcomes categorized Immediate (short term)
Likely to be changes in attitudes, skills, and knowledge
Occur during program cycle
Intermediate (medium term) Likely to be changes in behavior or decision making Can occur a few months into program cycle and a few
months after program completion
Permanent (long term) Likely to be changes in life status or condition Occurs sometime after program cycle
23

Get ready
Smart investing program elements Classes/programs/training/exhibits
Staff training
Partnerships
Collection development and positioning in physical/virtual library
Web presence
Marketing/outreach
24
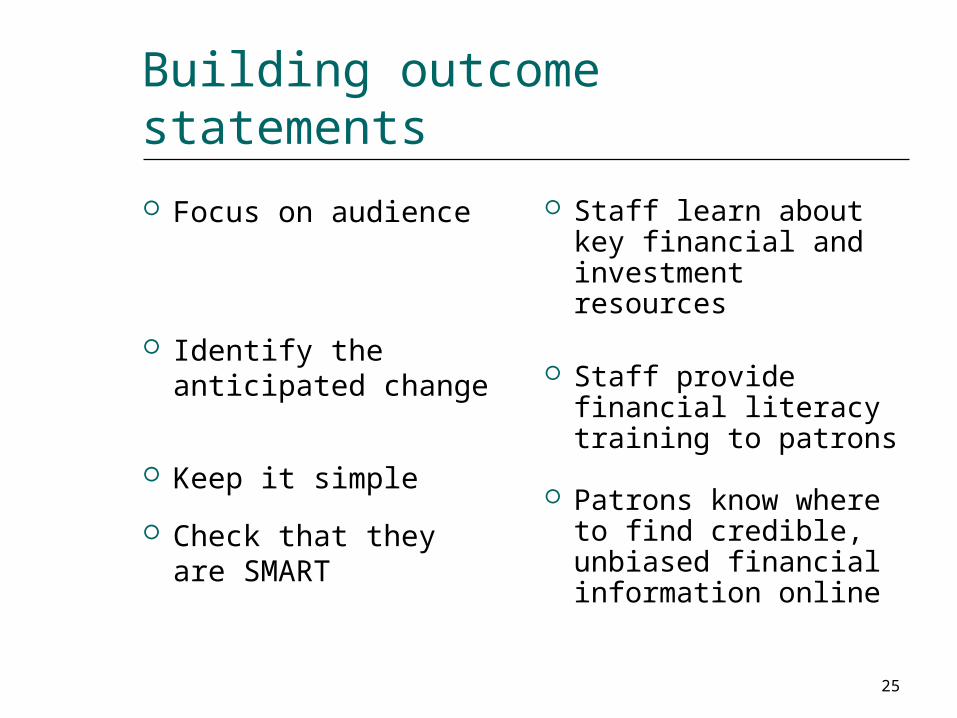
Building outcome statements
Focus on audience
Identify the anticipated change
Keep it simple
Check that they are SMART
Staff learn about key financial and investment resources
Staff provide financial literacy training to patrons
Patrons know where to find credible, unbiased financial information online
25

S – M – A – R – T ?
Specific
Measurable
Achievable
Relevant
Time-specific
26

Example…
Five members of reference team will increase their knowledge of Morningstar database by 20% after completing three training workshops offered in the spring.
27

How will you know?
Five members of reference team will increase their knowledge of Morningstar database by 20% after completing three training workshops offered in the spring.
In order to demonstrate change, you have to establish a starting point.
28

Hands-on During the break: Write an outcome for your target
audience.
Identify indicators and data sources for at least one outcome.
What baseline data do you need that you don’t yet have? How will you get it?
29

We will resume in 15 minutes.

Workshop schedule
Part 2 –What data should I collect? When?
31

Choose the outcomes you want to measure
Smart investing outcomes at the library level:
Users demonstrate increased skills and/or knowledge
Users take action with new skills (i.e. start investing, reduce debt)
Program partners report a positive experience working with the library
Users participate in programs as a result of PR/marketing activities
32

How do you know?
Outcomes Indicators Source/Method Participants know how to use financial databases (knowledge/skill)
Participants establish regular savings activities (behavior)
Data-usage statistics show 20% increase in four months
Increased number of participants with savings accounts
Establish baseline data use; measure use over four months following training
Pre/post-survey responses
33

Staff example
GOAL: Increase staff competency in providing financial/investor education information
Outcome: Reference staff will feel comfortable providing financial/investor information.
Outcome: Reference staff will know sources of accurate and unbiased information on investing.
34

Identify indicators for your outcomes
Indicators: measurable conditions or behaviors that show an outcome was achieved:
What you hoped or intended to see or know
Observable evidence of accomplishment, changes, gains
For each outcome generate a list of possible indicators and then narrow to at most three that best show the outcome was achieved
35

Outcomes Indicators Source/Method
Components of Data Collection Plan• Outcomes chosen to measure• Indicators• Sources and methods
35

Specify indicators for your outcomes Be SMART with indicators
Use the formula:
Number and/or percent of a specific target population who report, demonstrate, exhibit an attitude, skill, knowledge, behavior, status, or life condition in a specified quantity in a specified timeframe and/or circumstance
Examples:
Outcome: Reference staff will know sources of accurate and unbiased information on investing
25 or 50% of staff will be able to name 3 online resources that provide financial/investor education information after attending a training
Outcome: Users take action to better their personal finance
The # and % of users who report they made one or more life-style changes from a list of 10 key personal finance factors in the last six months
37

37
Prepare to collect data on your indicators Data Sources: Tools, documents, and locations
for information showing what happened to target audience.
Data source options:
Feedback forms/short surveys Point-of-use inquiry by staff Focus groups Interviews Skills tests Observation Instructor assessments Library use statistics

Prepare to collect dataon your indicators Pre-test and Post-test
You can’t measure success without a baseline.
What is the “current state of affairs” — what do people know, perceive and do before the program… and how does the program move the audience forward?
Include all stakeholders.
Retrospective testing
Post-observation interview to clarify learning that occurred during project activities.
39

Prepare to collect dataon your indicators
Other considerations:
When will you collect data?
How often will I collect data?
Include all participants or a sample?
Who will collect data?
Who will record/compile data?
How will confidentiality be protected?
How will participants be informed about the data collection process?
40

Test your measurement system
Pilot or “beta test” your surveys or questionnaires.
Clarity of questions
Ease of use
Are you measuring what you intended to measure? Are you asking the most appropriate questions?
REVISE instrument as needed!
41

Analyze and report findings
o Review feedback from participants
o Collect, input data at regular intervals
o Get familiar with the data
o Look for and note oddities in reporting
o Peruse the data and identify patterns
o Substantiate patterns — do data sources corroborate each other?
42

Analyze and report findings
Organize data logically (tables/charts)
Analyze and interpret data to develop narrative for final report
Document findings
Maintain files or database of outcomes and activities
Determine outcomes you want to continue monitoring
43

Use your findings
Tell your story!
Marketing
Accountability and long-term assessment
Improved services and/or programs
Resource (re)allocation
Include data and anecdotes
44

Additional resources
IMLSwww.imls.gov/applicants/outcome_based_evaluations.aspx
Shaping Outcomeswww.shapingoutcomes.org
United Way www.slideshare.net/lynnereed/united-way-logic-model-presentation
45

Questions?
402-450-4639
Special thanks to Kerwin Pilgrim, Brooklyn Public Library
46