OAO Gazprom Shareholders Meeting, June 29, 2007 Gazprom Shareholders Meeting, June 29, ... The...
36
OAO Gazprom Shareholders Meeting, June 29, 2007 OAO Gazprom Shareholders Meeting, June 29, 2007
Transcript of OAO Gazprom Shareholders Meeting, June 29, 2007 Gazprom Shareholders Meeting, June 29, ... The...

OAO Gazprom Shareholders Meeting, June 29, 2007OAO Gazprom Shareholders Meeting, June 29, 2007

22
Financial highlights
Net profit, RUR bln
Receipts from gas and other product sales, RUR bln
2006
343.7
1,632.7
2005
203.4
1,231.3
68.9 %
32.6 %
Changes
Dividends per share, RUR 2.541.50 69.3 %
12.31.2001
12.8
12.31.2002
18.5
12.31.2003
31.9
12.31.2004
66.2
12.31.2005
160.4
12.29.2006
272.2
Market capitalization, USD bln

33
Equity capital structure
including
2002 2003 2004 20062005
The share controlled by the Russian Federation 39.262%39.262% 39.262% 50.002%50.002%
ОАО Rosgazifikatsiya 0.889%0.889% 0.889% 0.889%0.889%
The Federal Agency for Federal Property Management 38.373%38.373% 38.373% 38.373%38.373%
ADR holders 4.422%4.422% 4.422% 13.200%4.422%
ОАО Rosneftegaz -- - 10.740%10.740%
Other registered persons and legal entities 56.316%56.316% 56.316% 36.798%45.576%

44
Share Market
2002 2003 2004 2005 2006
35.4524.0215.64
44.4538.521.1
84.776.5740.55
195194.369.6
350.38302.5215
2002 2003 2004 2005 2006
7.864.683.88
10.910.364.16
15.7614.210.5
31428.6811.92
52.6446.029.48
The closing price of GazpromThe closing price of Gazprom’’s shares at the s shares at the St. Petersburg stock exchangeSt. Petersburg stock exchange
The closing price of ADR on GazpromThe closing price of ADR on Gazprom’’s s shares at the London stock exchange*shares at the London stock exchange*
•The ADR price reflects a new Gazprom’s shares/one ADR ratio(one ADR = four shares)
RUR USD
ceiling
year-end
bottom
ceiling
year-end
bottom

55
Reserves
Siberian FD
Northwest FD
Volga FD Ural FD
Southern FD
Far East FD
Offshore
2929,854.1,854.1
11,,21217.07.0
11,,3386.986.9
Total
993.3.222121.3.313.513.5
4,114.54,114.5228.58.54747..44
22,594.8,594.839392.42.4
4.54.5
881100..66558.78.7
1134.334.3
221,937.1,937.2268689.79.7
11,146.,146.00295.0295.02626.3.3338.58.5
88.8.80.10.12.72.7
Gas, bcmGas, bcmCondensate, Condensate, mlnmln ttOil, Oil, mlnmln tt

66
Reserve buildup
Reserves as at 12.31.05
Geological exploration
Reservesas at 12.31.06
Natural gas, bcm 29,130.7 590.9 29,854.1
Oil, mln t 1,357.5 46.9 1,386.9
Condensate, mln t 1,216.3 11.9 1,217.0
Three gas condensate and one oil fields discovered
Chikanskoye – Eastern Siberia
Yuzhno-Noyabrskoye – Western Siberia
Akobinskoye – Orenburg Oblast
Karmalinovskoye – Stavropol Krai
30 hydrocarbon reservoirs discovered

77
License Acquisitions
32 subsoil use licenses obtained, including 9 licenses in Central Asia
Hydrocarbon prospecting and production licenses – 169
Geological survey licenses– 59
A total of 238 licenses held by Gazprom Group as at 12.31.2006

88
Audit
94% of gas
94% of oil
90% of condensate
182.5 USD bln
Gazprom’s reserves
26.1USD bln
Gazprom Neft’s reserves
Appraisal of Gazprom Appraisal of Gazprom GroupGroup’’s s АА++ВВ++СС11
reservesreservesCurrent valueCurrent value

99
by 2010 – no less than 560 bcm
by 2020 – no less than 580-590 bcm
630
590
560557556555552.5547.6
521.9
2002 2003 2004 2005 2006 2007 2010 2020 2030
by 2030 – no less than 610-630 bcm
Gas production
1010
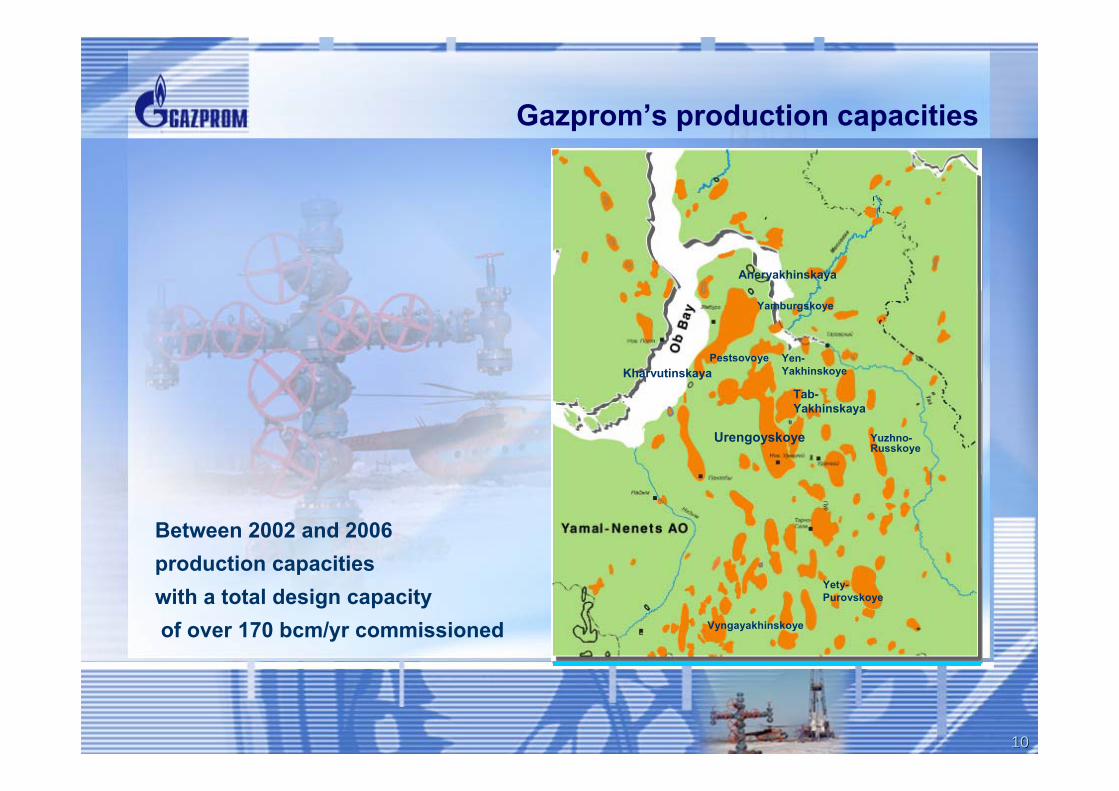
Gazprom’s production capacities
Between 2002 and 2006production capacities with a total design capacity of over 170 bcm/yr commissioned Vyngayakhinskoye
Yen-Yakhinskoye
Yety-Purovskoye
Pestsovoye
Aneryakhinskaya
Tab-Yakhinskaya
Kharvutinskaya
Yamburgskoye
Urengoyskoye Yuzhno-Russkoye

1111
New gas production provinces in Russia’s offshore
Fersman Rise
Sev. Kildinskoye
MurmanskoyeDolginskoye
Arkhangelsk
Kanin Peninsula
Murmansk
Narian-Mar
Teriberka
Kildin island
Rybachiy Peninsula
Amderma
Ludlovskoye
Varandey Sea
Sev. Kamennomysskoye
Kamennomysskoye Sea
Bely Island
PrirazlomnoyeObskoye
Antipayutinskaya
Gydan Peninsula
Nova
yaZe
mlya
Shtokman
Kruzenshternskoye
Kharasaveyskoye
Rusanovskoye
LeningradskoyeLedovoye
Medyn Sea
Ob and Ob and TazTaz BaysBays
Yamal offshore
Northeast Barents Sea Northeast Barents Sea offshoreoffshore
PechoraPechora Sea offshoreSea offshoreKolg
uev Isl
and
Kola Peninsula
Caspian Caspian SeaSea
SakhalinSakhalin
Yar-Sale
Salekhard
Promising structuresOil and gas fields
Vaigach Island

1212
Yamal - a new development stage for gas production and transportation
Rusanovskoye
Leningradskoye
Malyginskoye
Tambeyskaya group
Bovanenkovskoye
Kruzenshternskoye
The aggregate reserves in the Bovanenkovskoye, Kharasaveyskoye and Novoportovskoye fields –5.8 tcm of gas, 100.2 mln t of condensate, and 227 mln t of oil
The Bovanenkovskoye field –commissioning in 2011 of the first start-up complexes with a capacity of no less than 15 bcm per year and a gas trunkline between Bovanenkovoand Ukhta
Rostovtsevskoye
Novoportovskoye
Kharasaveyskoye
Yamal’s explored gas reserves – 10.4 tcm
1313
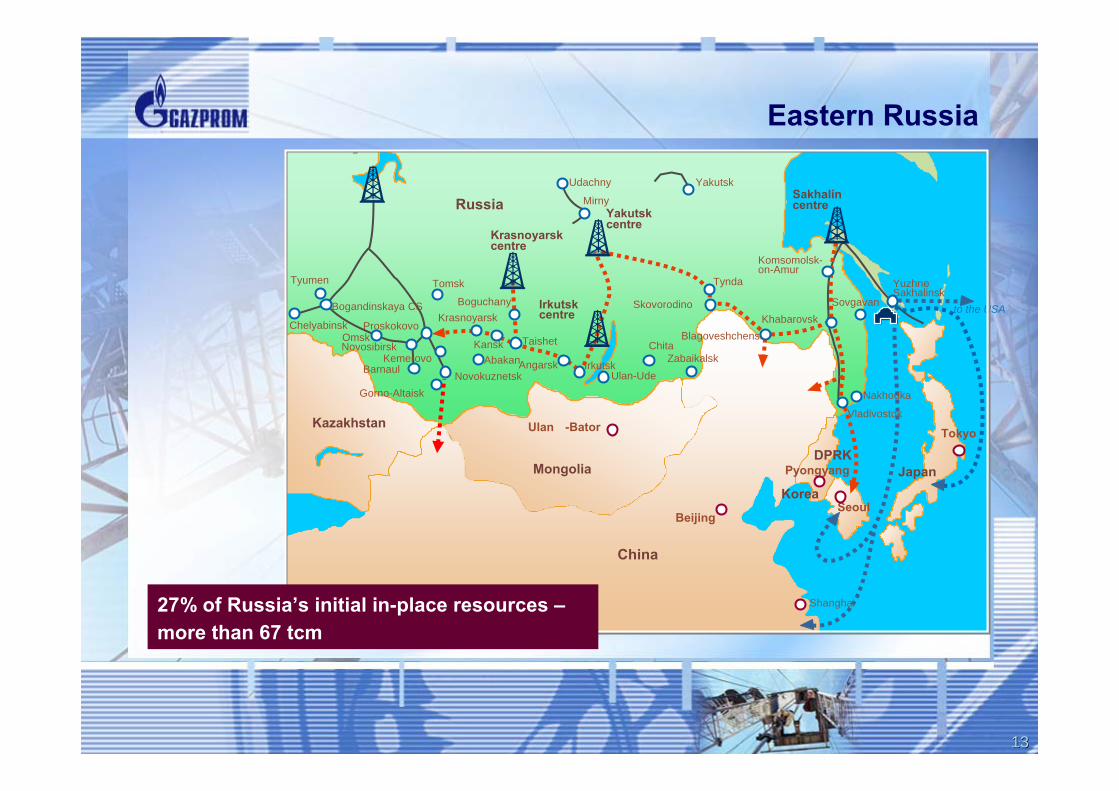
Eastern Russia
China
Mongolia
Kazakhstan
JapanKorea
Russia
Krasnoyarsk centre
Yakutskcentre
Sakhalincentre
Irkutskcentre
Novosibirsk
YakutskUdachny
Mirny
Chita
KhabarovskBlagoveshchensk
Shanghai
Yuzhno-Sakhalinsk
OmskProskokovo
Barnaul
Gorno-Altaisk
Pyongyang
Beijing
Ulan -Bator
Seoul
Tyumen Tynda
NovokuznetskAngarskAbakan
Krasnoyarsk
Tokyo
Boguchany
TaishetZabaikalsk
Vladivostok
Sovgavan
Komsomolsk-on-Amur
Kemerovo
Chelyabinsk
Bogandinskaya CS to the USA
Ulan-UdeIrkutsk
DPRK
Nakhodka
Skovorodino
Kansk
Tomsk
27% of Russia’s initial in-place resources –more than 67 tcm

1414
Oil business development
Developing the petrochemical sector, GTL technology
Expanding the resource base
Bringing onstream explored oil fields on a by-stage basis
Annual oil outputby 2020 - 80 mln t
oil, mln t
condensate, mln tOil and condensate reserves – 2.6 bln t
2005 2006
11.59.5
34
11.4

1515
Gazprom’s gas transmission system
The length of gas trunklines –156.9 thousand km
Current status
including spur lines –44.5 thousand km
Compressor stations – 217Gas pumping units – 3,629with a total installed capacity of 41,000 MW
In 2006 717.8 bcm of gas was fed intoGazprom’s gas transmission system,including 115 bcm injected by independent producers
1616
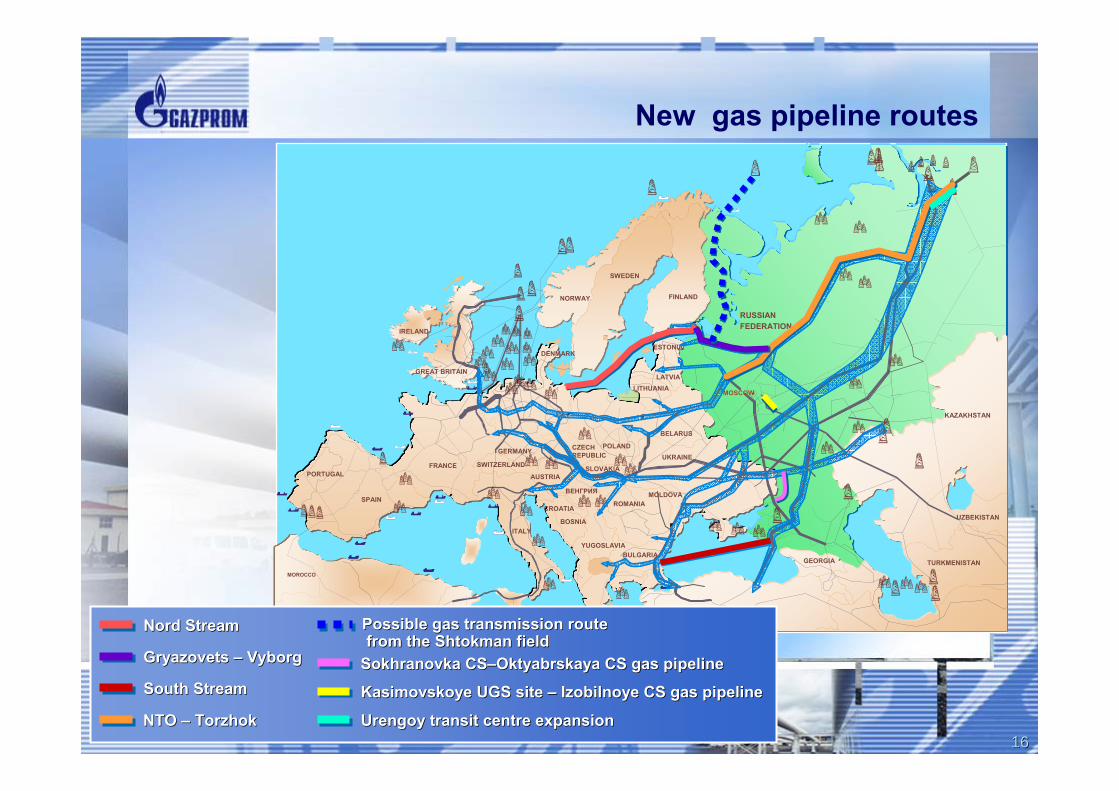
New gas pipeline routes
RUSSIANFEDERATION
FINLAND
LATVIALITHUANIA
BELARUS
UKRAINE
ESTONIA
SWEDEN
NORWAY
DENMARK
GERMANY CZECH REPUBLIC
POLAND
SLOVAKIA
ROMANIA
BULGARIAYUGOSLAVIA
ТУРЦИЯ
ВЕНГРИЯ
SWITZERLAND
AUSTRIA
CROATIA
BOSNIA
GEORGIA TURKMENISTAN
UZBEKISTAN
KAZAKHSTAN
FRANCE
ТУНИС
SPAIN
IRELAND
MOSCOW
АЛЖИР
MOROCCO
PORTUGAL
MOLDOVA
GREAT BRITAIN
Nord StreamNord Stream
GryazovetsGryazovets –– VyborgVyborg
South StreamSouth Stream
NTONTO –– TorzhokTorzhok UrengoyUrengoy transit centre expansiontransit centre expansion
SokhranovkaSokhranovka CSCS––OktyabrskayaOktyabrskaya CS gas pipelineCS gas pipeline
KasimovskoyeKasimovskoye UGSUGS site site –– IzobilnoyeIzobilnoye CS gas pipelineCS gas pipeline
Possible gas transmission routePossible gas transmission routefrom the from the ShtokmanShtokman fieldfield
ITALY

1717
CHINA
MONGOLIA
KAZAKHSTAN
JAPANKOREA
RUSSIA
Krasnoyarskcentre
Yakutskcentre
Sakhalin centre
Irkutskcentre
Novosibirsk
YakutskUdachny
Mirny
Chita
KhabarovskBlagoveshchensk
Shanghai
Yuzhno--Sakhalinsk
OmskProskokovo
Barnaul
Gorno-Altaisk
Pyongyang
Beijing
Ulan -Bator
Seoul
Tyumen Tynda
NovokuznetskAngarskAbakan
Krasnoyarsk
Tokyo
Boguchany
TaishetZabaikalsk
Vladivostok
Sovgavan
Komsomolsk-on-Amur
Kemerovo
Chelyabinsk
Bogandinskaya CS to the USA
Ulan-UdeIrkutsk
DPRK
Gas production Gas production centrescentresPipeline gasPipeline gasLNGLNG
Nakhodka
Skovorodino
Kansk
Tomsk
Shaping a gas pipeline system in eastern Russia
1818
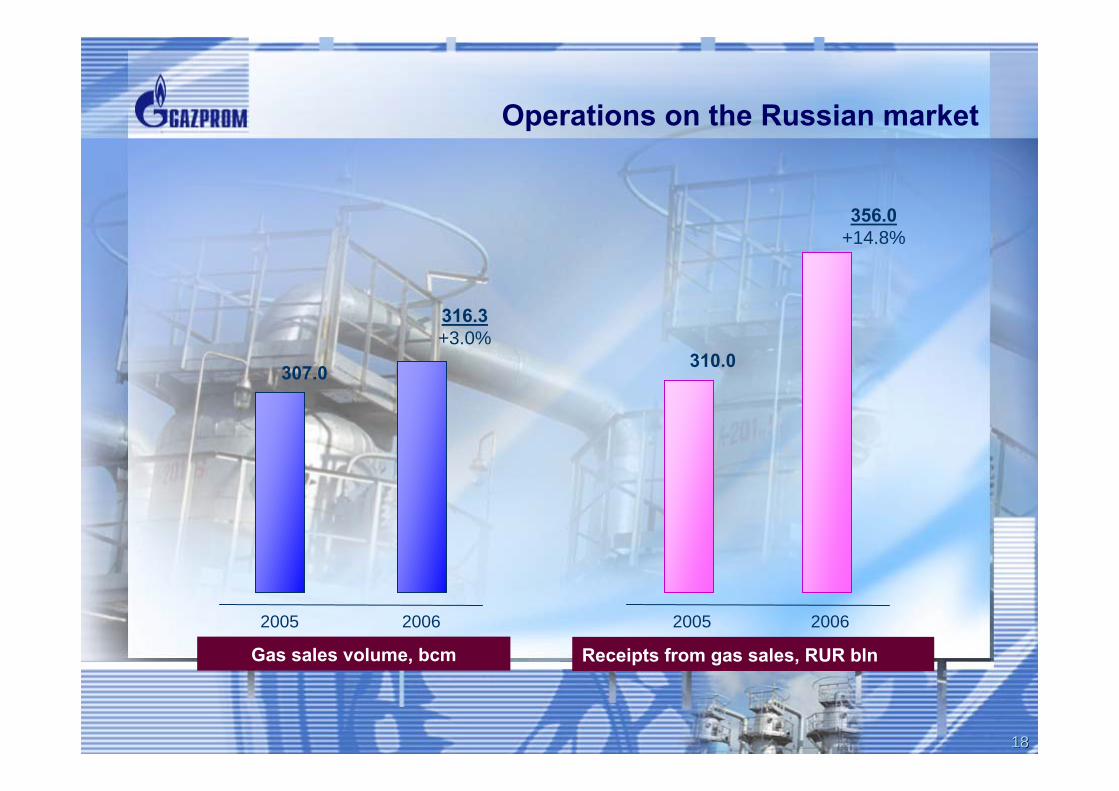
Operations on the Russian market
2005 2006 2005 2006
356.0+14.8%
310.0
316.3+3.0%
307.0
Gas sales volume, bcm Receipts from gas sales, RUR bln

1919
Regulated market sector reduction
Increasing the maximum level of changes in regulated gas prices:
to 15% in 2007
to 25% in 2008
to 20% in 2009
to 28% in 2010
By 2011 sales profitability on the domestic market is planned to be brought in line with the European level adjusted to transportation costs and charges
Introducing a pricing formula in long-term contracts

2020
Electronic trading dynamics
Independent producers Gazprom Group
mln m³
The prices at trading sessions exceeded the regulated ones by 30–40%
11.22. 06 12.15. 06 01.07.07 02.01.07 02.09.07 02.15.07 02.20.07 03.01.07 03.12.07 03.15.07 03.20.07
9029
235165.9
200254
221258
6491
13
25.124.3
2560
7330
13494.5
33.795
2121
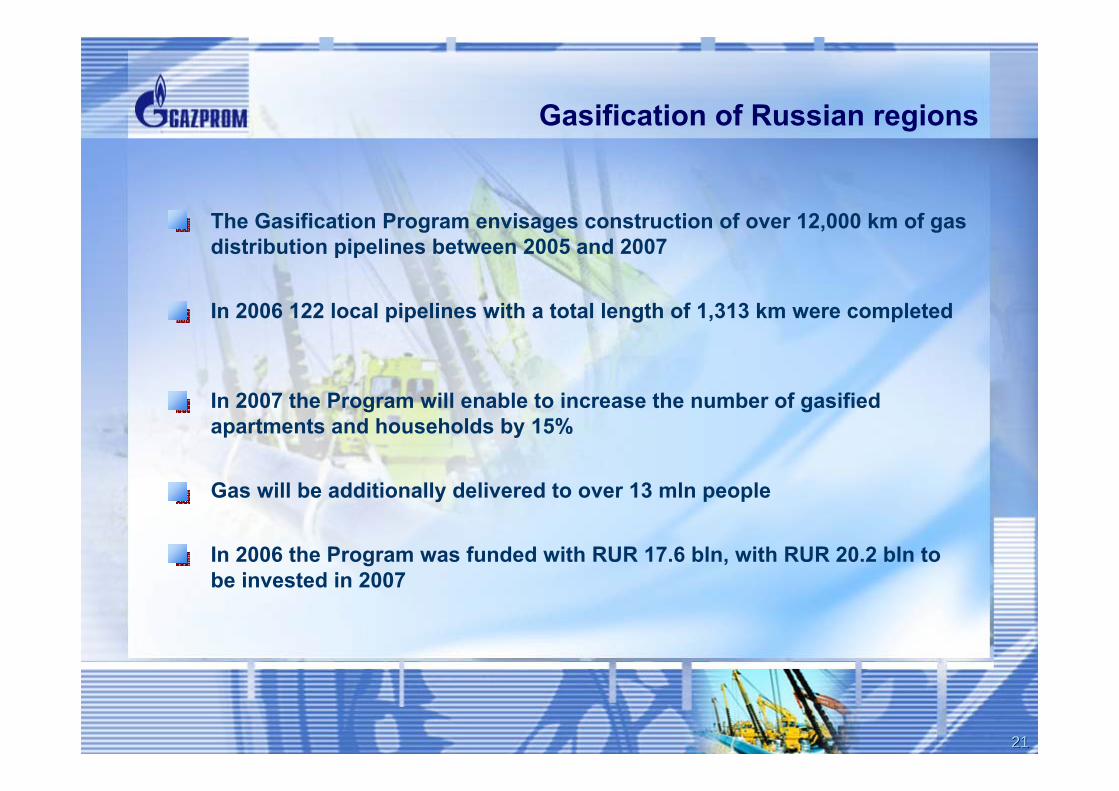
Gasification of Russian regions
In 2006 122 local pipelines with a total length of 1,313 km were completed
In 2007 the Program will enable to increase the number of gasified apartments and households by 15%
Gas will be additionally delivered to over 13 mln people
In 2006 the Program was funded with RUR 17.6 bln, with RUR 20.2 bln to be invested in 2007
The Gasification Program envisages construction of over 12,000 km of gas distribution pipelines between 2005 and 2007
2222
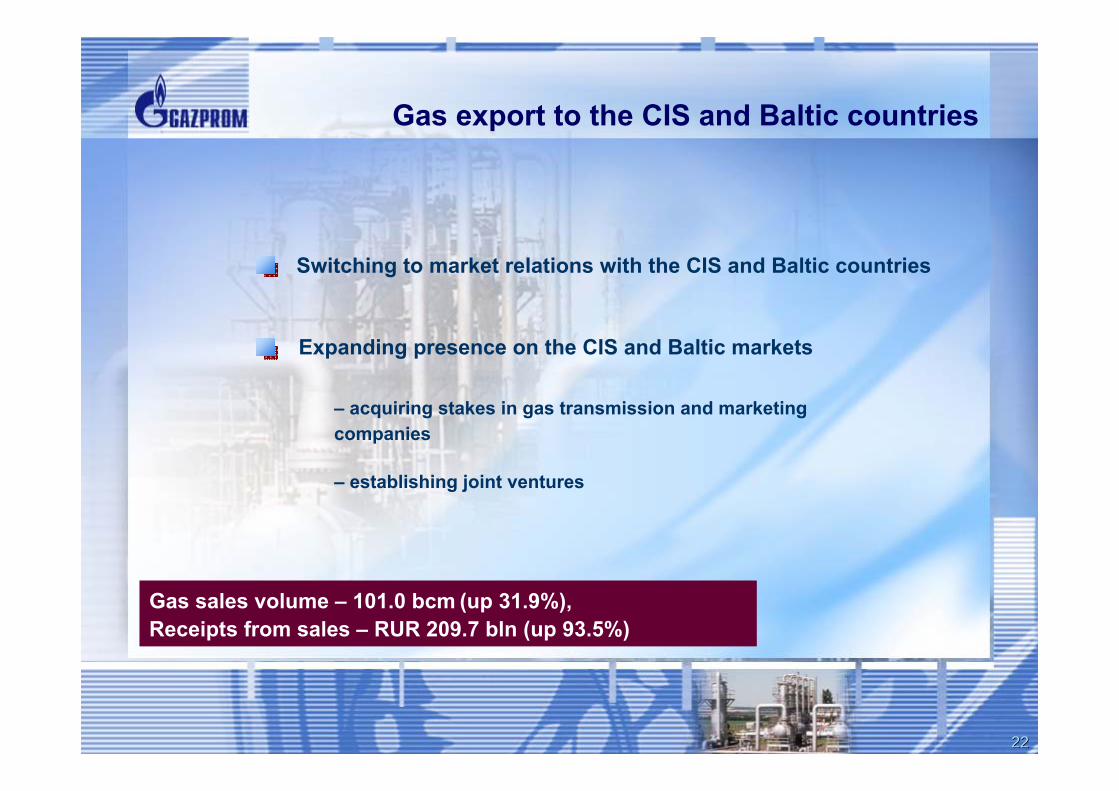
Gas export to the CIS and Baltic countries
Gas sales volume – 101.0 bcm (up 31.9%),Receipts from sales – RUR 209.7 bln (up 93.5%)
Expanding presence on the CIS and Baltic markets
– acquiring stakes in gas transmission and marketing companies
Switching to market relations with the CIS and Baltic countries
– establishing joint ventures

2323
European market
2005 2006 2005 2006
845.9+36.6%
619.1
161.5+3.5%
156.1
Gas sales volume, bcm Receipts from sales, RUR bln

2424
Long-term contracts and strategic agreements
Agreements signed
Contracts extended with
E.ON Ruhrgas – four contracts extended through 2035 for a total supply volume of up to 20 bcm per yearOMV – extensions agreed on till 2027 and new contracts signed for the supply of 6.9 bcm/yr to Austria Eni – extensions till 2035 for the supply of gas to Italy
Gaz de France – extensions till 2031 for the supply of gas to France
on the Main Terms & Conditions of >20 bcm/yr Gas Deliveriesthrough the Nord Stream Gas Pipeline with E.ON Ruhrgas, DONG Energy, Gazprom Marketing & Trading and Gas de France
with BASF and E.ON to swap assets
on the Strategic Partnership with Eni
RWE Transgas (Czech Republic) – till 2036. Deliveries will grow to 9 bcm starting 2010
2525
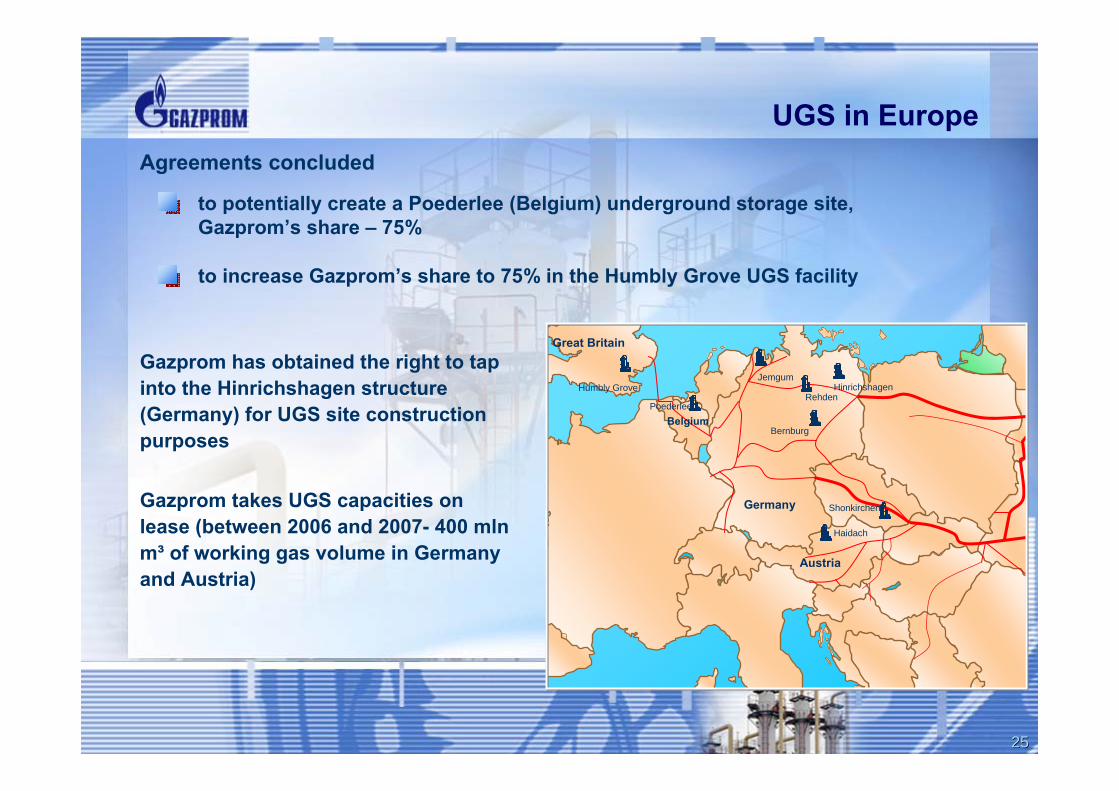
UGS in Europe
to potentially create a Poederlee (Belgium) underground storage site, Gazprom’s share – 75%
to increase Gazprom’s share to 75% in the Humbly Grove UGS facility
Agreements concluded
Gazprom has obtained the right to tap into the Hinrichshagen structure (Germany) for UGS site construction purposes
Gazprom takes UGS capacities on lease (between 2006 and 2007- 400 mlnm³ of working gas volume in Germany and Austria)
Great Britain
Humbly GroveRehden
Shonkirchen
HinrichshagenJemgum
Poederlee
Bernburg
Haidach
Belgium
Germany
Austria

2626
Diversification of markets and geography of supply
Strategy to build up presence on the LNG market
From 2005 Gazprom Marketing & Trading has effectuated LNG spot deliveries to the USA, the Great Britain, South Korea, Japan, India and Mexico. The total sales volume – around 0.6 mln t (0.9 bcm)
In December 2006, Sakhalin Energy’s stockholders and Gazprom signed the Protocol on Gazprom’s entry into the Sakhalin-2 project as a leading stockholder
Spot deals and LNG-for-pipeline gas swaps

2727
Sakhalin-2
Yuzhno-Sakhalinsk
Prigorodnoye
Dolinsk
Gastello
Smirnykh
Kril’on
Katangli
Val
Okha
Nyrovo
PogibiLazarev
De-Kasti
Nikolayevsk-on-Amur
Sakh
alin
Islan
d
Wakkanai
Sakhalin-2(Piltun-Astokhskoye)
Sakhalin-2(Lunskoye)
Gas pipeline
Oil pipeline
LNG plant
Hydrocarbon fields
The project is aimed at LNG supply to Asia-Pacific
The project contemplates developing the Piltun-Astokhskoye oil (reserves –around 600 mln t) and Lunskoye gas (reserves – 700 bcm) fields

2828
VIETNAM
Dong HA
Hai Nan
Mong Cai
HalongHalong
Hanoi
CHINA
Block 112Block 112
Exploration and production abroad
Venezuela
Aral Sea
UZBEKISTANKungrad
Nukus
Urgench
Buchara
Chardzhou
Nurata
Navoi
Chimkent
Tashkent
Samarkand
TermezKelif
Karshi
Mubarek
Almalyk
Charvak
Vietnam
India
ORISSA
Bhubaneshvar
JHARKHAND
Ranchi WESTERN BENGALIA
BANGLADESH
BlockBlock--2626(NEC(NEC--OSNOSN--9797/1/1))
HaldiaHaldiaCalcuttaCalcutta
ParadipParadip
VishakhapatnamVishakhapatnam
BAY OF BENGAL
Uzbekistan
Gulf of Coro
VENEZUELA
COLUMBIA
GULF OF VENEZUELA
Bay of La Vela
Curacao Curacao Island Island
((HollandHolland))
Aruba IslandAruba Island((NetherlandsNetherlands))
Coro
PARAGUANAPENINSULAPunto Fijo
GUAJIRA PENINSULA
El Tablazo
Maracaibo
CARRIBEAN SEA
URUMACOURUMACO--II
URUMACOURUMACO--IIIIII
URUMACOURUMACO--IIIIII
MORUY MORUY -- IIIIII
CARDONCARDON--IIIIII

2929
Power industry
Increasing profitability under the Russian power industry restructuring conditions
Diversifying tariff control risks
Optimizing the share of natural gas in Russia’s fuel balance
Achieving synergies with other business activities
Power generation activities abroadThe Agreement with the Armenian Government for ArmRosgazprom joint venture to acquire and complete the construction of the fifth 1,100 MW power generating unit at the Razdanskaya CHP

3030
Electric power and СО2 emission quotas trading
Gazprom Marketing & Trading joined the Code of Rules governing purchases, sales and transportation of electric power in the Great Britain
May 2006
First electric power trading deal
October 2006
Gazprom Marketing & Trading sealed its first deal to trade in СО2 emission quotas in Europe
November 2006

3131
New products and technologies
Synthetic liquid fuel (SLF) production
Intensive development of low pressure gas reserves, associated gas, gas fields located at long distances from gas transportation infrastructure
Coalbed methane extraction
Expansion of the hydrocarbon resource base and target markets
Gasification of the Kemerovo Oblast and southern Siberia

3232
Debt portfolio management
The share of long-term loans secured by export revenues
12.31.2004 12.31.2005 12.31.2006
14.1%
24.6%
56.6%Growth of Gazprom’s credit ratings confirms its status of a reliable borrower
3333
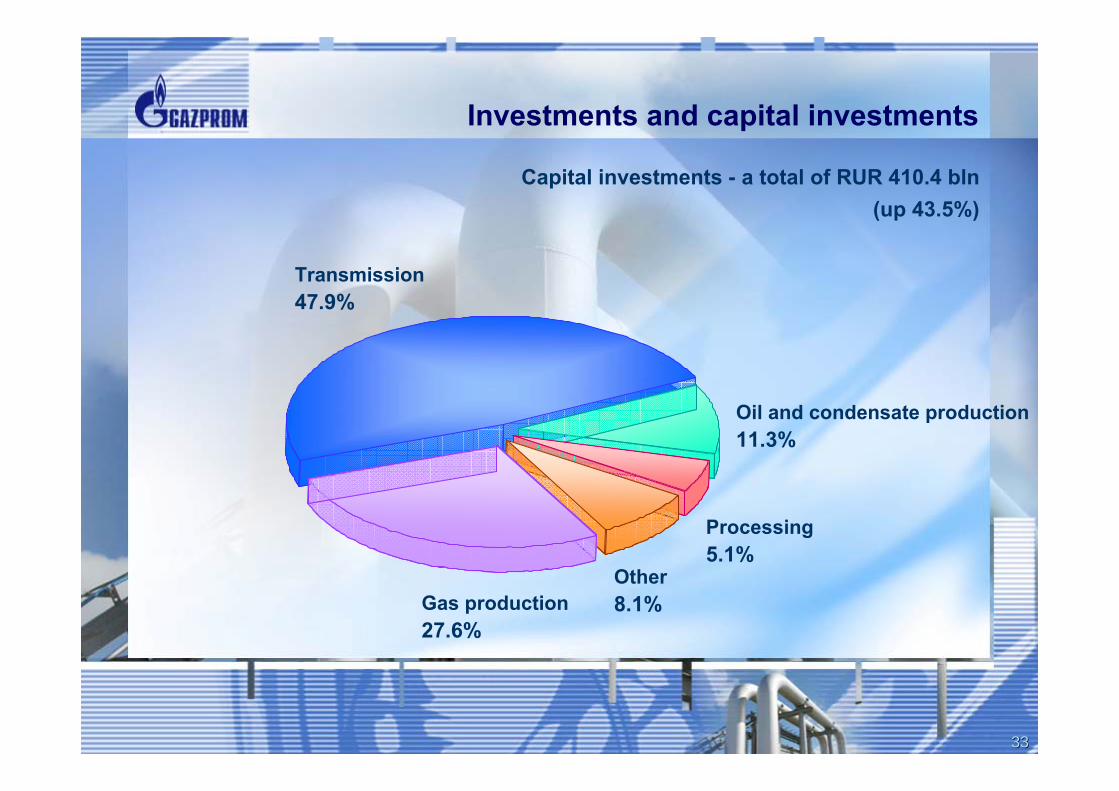
Investments and capital investments
Capital investments - a total of RUR 410.4 bln(up 43.5%)
Gas production27.6%
Transmission47.9%
Oil and condensate production11.3%
Processing5.1%
Other 8.1%

3434
Non core asset divestiture
excluding intra-Group transactions –RUR 9.4 bln
Deals worth RUR 31 bln executed

3535
Structure improvement
Optimizing business management at the subsidiary level
Setting up specialized subsidiaries on the platform of gas transmission and production companies, and consolidating assets according to a field of action
Enhancing performance efficiency
OAO Gazprom Shareholders Meeting, June 29, 2007OAO Gazprom Shareholders Meeting, June 29, 2007