Oaks 2040: The Status and Future of Oaks - US Forest Service
14
603 Oaks 2040: The Status and Future of Oaks in California 1 Tom Gaman 2 and Jeffrey Firman 2 Abstract California oaks are seriously threatened as a burgeoning state population makes ever more use of the wildland. Most California oaks are not covered by the Forest Practice Act, they are located on private lands, and are potentially at risk. The Oak Woodland Conservation Act of 2004 requires cities and counties to assess their oak resource and to adopt Oak Woodland Management Plans in order to meet their needs for healthy watersheds. Therefore, Oaks 2040 is designed to provide localized information for planners. This paper presents a forest and woodland map of the 10 oak types found in California. The most recent statewide forest survey data from the Forest Inventory and Analysis (FIA) program are compiled into an inventory. The inventory data are then merged to describe the mapped oak types. By merging this inventory with state urban growth projections, we examine which oak woodlands are most likely to face development between now and 2040. Findings are reported for each of six regions: North Coast, North Interior, Central Coast, Sacramento, San Joaquin, and Southern. Keywords: At-risk, Calveg, FIA, GIS, inventory, oak forest, oak habitat, oak woodland. Introduction Developing Planning Tools for Oak Futures in California Ecological functions, wildlife habitat, recreational opportunities, and scenic values are seriously impaired as population densities and other landscape use pressures increase. Managers of oak woodlands and forests need to balance the biological, sociological, and economic interests of private landowners, public agencies, businesses, universities, environmental groups, and concerned individuals. Planning must address the complexities of local, regional, and statewide oak issues within the context of practical on-the-ground land use decisions. Oaks 2040 is based on field data and is designed to serve decision makers who may develop local and regional Oak Woodlands Management Plans or advance other conservation strategies. A statewide map of oak distribution and current forest and woodland inventory tree plot data, created by state and federal researchers, were the starting points for Oaks 2040. From those, regional analyses of forest structure and oak types as well as region-specific oak inventory summaries have been developed. Previous work has provided information on the distribution and inventory of California’s oak woodlands. Bolsinger (1988) prepared a benchmark publication on the nature, extent, inventory and many uses of California’s oak woodlands. Waddell and Barrett (2005) provided a detailed inventory of California oak woodlands, based on data from the early 1990s. This paper is the first to use the new Forest Inventory 1 An abbreviated version of this paper was presented at the Sixth California Oak Symposium: Today's Challenges, Tomorrow's Opportunities, October 9-12, 2006, Rohnert Park, California. 2 Forest Data, P.O. Box 276, Inverness, CA 94937. e-mail: [email protected], [email protected].
Transcript of Oaks 2040: The Status and Future of Oaks - US Forest Service

603
Oaks 2040: The Status and Future of Oaks in California1 Tom Gaman2 and Jeffrey Firman2
Abstract California oaks are seriously threatened as a burgeoning state population makes ever more use of the wildland. Most California oaks are not covered by the Forest Practice Act, they are located on private lands, and are potentially at risk. The Oak Woodland Conservation Act of 2004 requires cities and counties to assess their oak resource and to adopt Oak Woodland Management Plans in order to meet their needs for healthy watersheds. Therefore, Oaks 2040 is designed to provide localized information for planners. This paper presents a forest and woodland map of the 10 oak types found in California. The most recent statewide forest survey data from the Forest Inventory and Analysis (FIA) program are compiled into an inventory. The inventory data are then merged to describe the mapped oak types. By merging this inventory with state urban growth projections, we examine which oak woodlands are most likely to face development between now and 2040. Findings are reported for each of six regions: North Coast, North Interior, Central Coast, Sacramento, San Joaquin, and Southern.
Keywords: At-risk, Calveg, FIA, GIS, inventory, oak forest, oak habitat, oak woodland.
Introduction
Developing Planning Tools for Oak Futures in California Ecological functions, wildlife habitat, recreational opportunities, and scenic values are seriously impaired as population densities and other landscape use pressures increase. Managers of oak woodlands and forests need to balance the biological, sociological, and economic interests of private landowners, public agencies, businesses, universities, environmental groups, and concerned individuals. Planning must address the complexities of local, regional, and statewide oak issues within the context of practical on-the-ground land use decisions.
Oaks 2040 is based on field data and is designed to serve decision makers who may develop local and regional Oak Woodlands Management Plans or advance other conservation strategies. A statewide map of oak distribution and current forest and woodland inventory tree plot data, created by state and federal researchers, were the starting points for Oaks 2040. From those, regional analyses of forest structure and oak types as well as region-specific oak inventory summaries have been developed.
Previous work has provided information on the distribution and inventory of California’s oak woodlands. Bolsinger (1988) prepared a benchmark publication on the nature, extent, inventory and many uses of California’s oak woodlands. Waddell and Barrett (2005) provided a detailed inventory of California oak woodlands, based on data from the early 1990s. This paper is the first to use the new Forest Inventory 1 An abbreviated version of this paper was presented at the Sixth California Oak Symposium: Today's Challenges, Tomorrow's Opportunities, October 9-12, 2006, Rohnert Park, California. 2 Forest Data, P.O. Box 276, Inverness, CA 94937. e-mail: [email protected], [email protected].
GENERAL TECHNICAL REPORT PSW-GTR-217
604
and Analysis program (FIA 2005) data and recent statewide GIS products, including the Fire and Resource Assessment Program (FRAP 1994-2005). Merenlender and others (2005) developed a complex model to evaluate exurban development threats to wildlands in Sonoma County. Because it relies on general planning information that varies among counties, their model would be difficult to apply statewide. We are not aware of any approach that evaluates urbanization threats to oaks statewide. We used a direct methodology that overlays the combined vegetation map with current state urban growth projections. Oaks 2040 identifies the location and extent of oaks most at risk of urban development statewide. We do not address other threats to oak woodlands, such as habitat fragmentation, very low residential development, and conversion of woodlands to intensive agriculture.
Methods
Mapping Oak Types A number of overall vegetation maps, maps of hardwoods in general, and oak-specific maps have been generated over the years. Currently, the most reliable statewide vegetation map available is the LCMMP Vegetation Map (FRAP map), produced by the California Department of Forestry and Fire Protection’s Fire and Resource Assessment Program (2003), in conjunction with the U.S. Forest Service Region 5 Remote Sensing Lab in Sacramento. While these maps do not focus specifically on oaks, oak habitat types can be extracted from mapped vegetation types. Using the FRAP map as a foundation (supplemented by other earlier mapping efforts), we have generated species-specific range maps of oak types throughout the state.
The FRAP map uses the Calveg classification system which first divides all vegetation into “covertype.” For finding wildland oak habitat, only two covertypes are relevant. All woodland classified as hardwood (HDW) or forest classified as conifer/hardwood mix (MIX) can potentially be oak habitat, provided it contains the relevant hardwood species. All other covertypes were eliminated from the analysis.
After covertype, the Calveg system also specifies “vegtype,” which identifies the dominant species association. For both HDW and MIX covertypes, the data were screened to ensure that the hardwood associations being mapped in a particular location are oaks. Nine such associations are dominated by a single species, each forming its own oak habitat type, or “oak type.” Three heterogeneous hardwood types were combined to generate a “mixed” oak type. The 10 resulting oak types, each potentially occurring in both “woodlands” and “forests,”3 are listed in table 1.
3 “Oak woodlands” are considered to be those mapped vegetation types where oaks dominate the landscape. “Oak forests” include oaks, but oaks may not necessarily be among the dominant species. By definition, forests and woodlands must have at least 10 percent canopy cover and be at least 1 hectare in extent.
Oaks 2040: The Status and Future of Oaks in California—Gaman
605
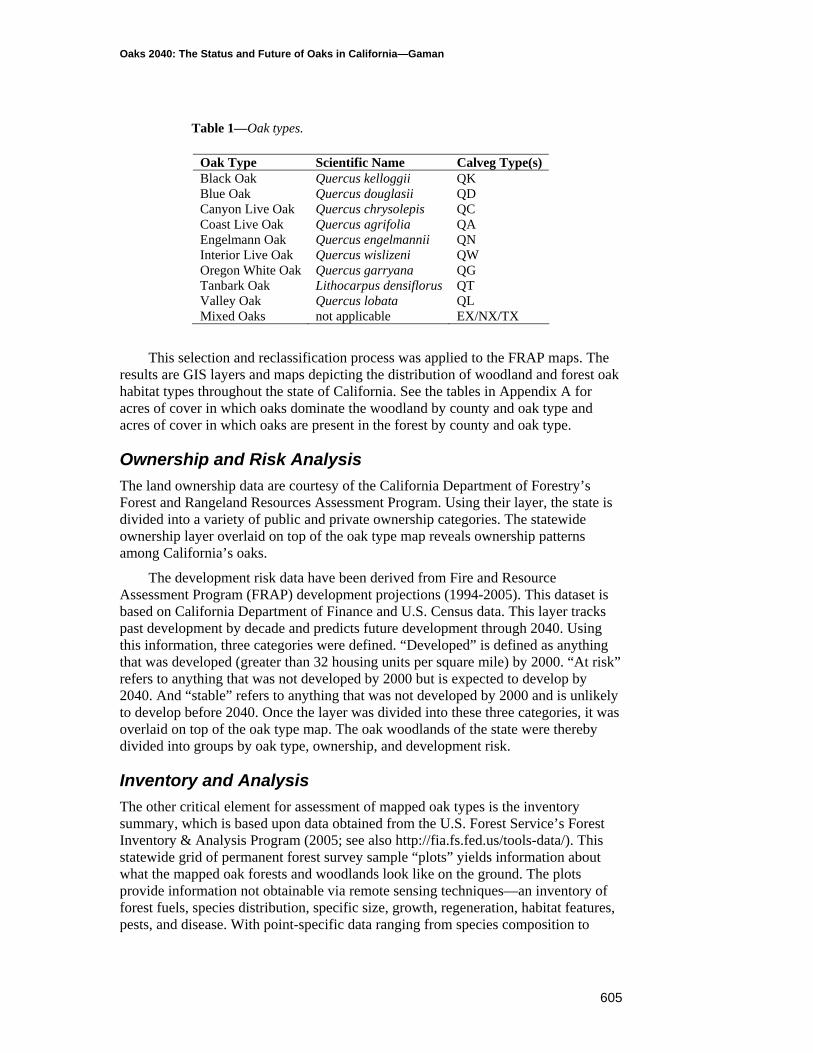
Table 1—Oak types.
Oak Type Scientific Name Calveg Type(s) Black Oak Quercus kelloggii QK Blue Oak Quercus douglasii QD Canyon Live Oak Quercus chrysolepis QC Coast Live Oak Quercus agrifolia QA Engelmann Oak Quercus engelmannii QN Interior Live Oak Quercus wislizeni QW Oregon White Oak Quercus garryana QG Tanbark Oak Lithocarpus densiflorus QT Valley Oak Quercus lobata QL Mixed Oaks not applicable EX/NX/TX
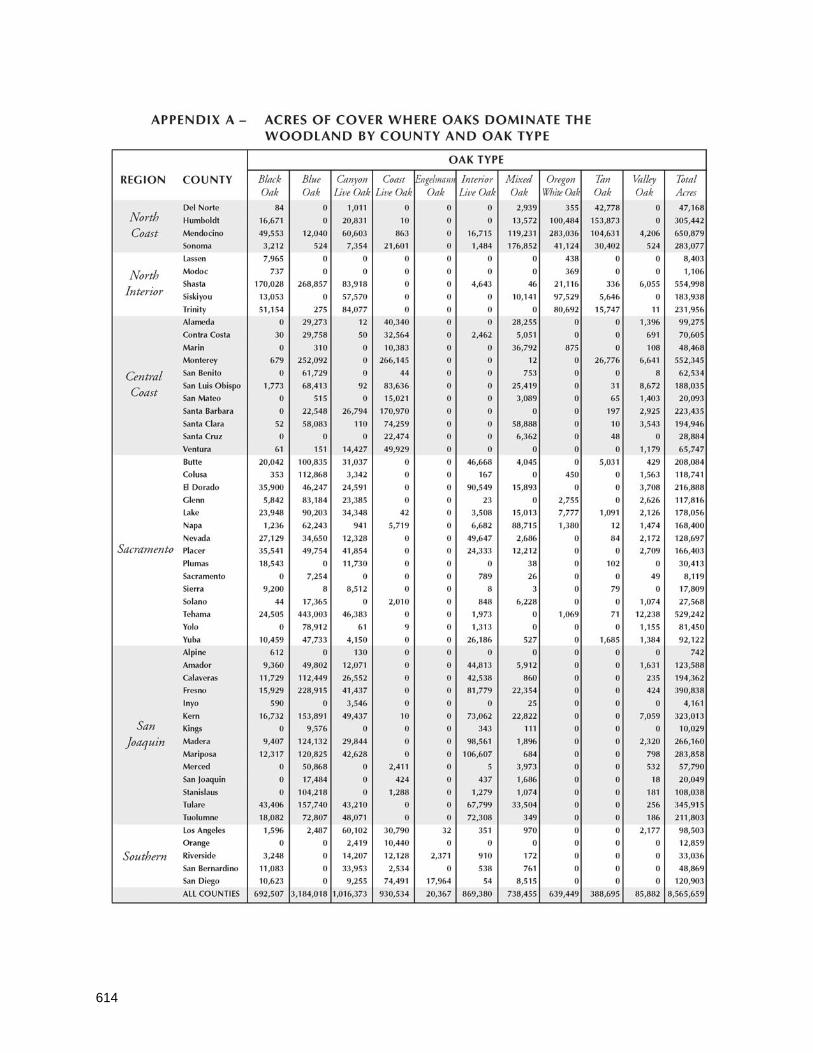
This selection and reclassification process was applied to the FRAP maps. The results are GIS layers and maps depicting the distribution of woodland and forest oak habitat types throughout the state of California. See the tables in Appendix A for acres of cover in which oaks dominate the woodland by county and oak type and acres of cover in which oaks are present in the forest by county and oak type.
Ownership and Risk Analysis The land ownership data are courtesy of the California Department of Forestry’s Forest and Rangeland Resources Assessment Program. Using their layer, the state is divided into a variety of public and private ownership categories. The statewide ownership layer overlaid on top of the oak type map reveals ownership patterns among California’s oaks.
The development risk data have been derived from Fire and Resource Assessment Program (FRAP) development projections (1994-2005). This dataset is based on California Department of Finance and U.S. Census data. This layer tracks past development by decade and predicts future development through 2040. Using this information, three categories were defined. “Developed” is defined as anything that was developed (greater than 32 housing units per square mile) by 2000. “At risk” refers to anything that was not developed by 2000 but is expected to develop by 2040. And “stable” refers to anything that was not developed by 2000 and is unlikely to develop before 2040. Once the layer was divided into these three categories, it was overlaid on top of the oak type map. The oak woodlands of the state were thereby divided into groups by oak type, ownership, and development risk.
Inventory and Analysis The other critical element for assessment of mapped oak types is the inventory summary, which is based upon data obtained from the U.S. Forest Service’s Forest Inventory & Analysis Program (2005; see also http://fia.fs.fed.us/tools-data/). This statewide grid of permanent forest survey sample “plots” yields information about what the mapped oak forests and woodlands look like on the ground. The plots provide information not obtainable via remote sensing techniques—an inventory of forest fuels, species distribution, specific size, growth, regeneration, habitat features, pests, and disease. With point-specific data ranging from species composition to
GENERAL TECHNICAL REPORT PSW-GTR-217
606
seedling regeneration to tree size and density, these plots help one understand the makeup of each of the 10 oak types.
The 2001-2004 FIA field data were obtained to provide an inventory of each of the oak types discussed above. Combining the ground-based survey data and the GIS mapping data enabled us to provide a new comprehensive oak inventory as shown in Appendix B.
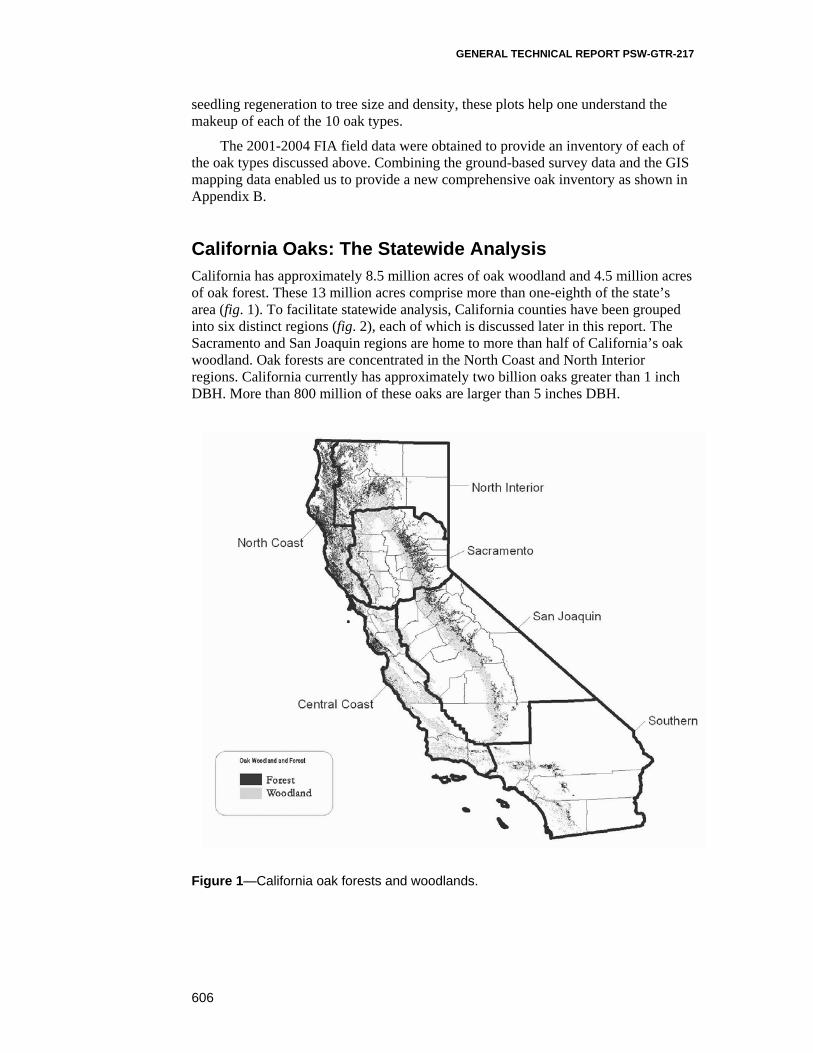
California Oaks: The Statewide Analysis California has approximately 8.5 million acres of oak woodland and 4.5 million acres of oak forest. These 13 million acres comprise more than one-eighth of the state’s area (fig. 1). To facilitate statewide analysis, California counties have been grouped into six distinct regions (fig. 2), each of which is discussed later in this report. The Sacramento and San Joaquin regions are home to more than half of California’s oak woodland. Oak forests are concentrated in the North Coast and North Interior regions. California currently has approximately two billion oaks greater than 1 inch DBH. More than 800 million of these oaks are larger than 5 inches DBH.
Figure 1—California oak forests and woodlands.

Oaks 2040: The Status and Future of Oaks in California—Gaman
607
Figure 2—California counties are grouped into six regions.
California oaks are diverse. Blue oak (see table 1 for scientific names of species) is California’s dominant oak species, representing more than one-third of the state’s oak woodlands. Canyon, coast and interior live oak woodlands comprise approximately one-third of California’s oak woodlands. Tanbark, black and canyon live oak forests account for more than 80 percent of California oak forests.
In oak woodland, oaks comprise 60 percent of the total tree basal area, 67 percent of trees greater than 5 inches DBH and 37 percent of trees greater than 24 inches DBH. In oak forest, oaks comprise 18 percent of the total tree basal area, less than 24 percent of trees greater than 5 inches DBH and 8 percent of trees greater than 24 inches DBH. Blue oak, Oregon white oak and, to a lesser extent, interior live oak, are regenerating poorly. Blue oak averages about one seedling per thousand square feet in woodlands, and less than one seedling (1 foot or more in height) per two established oak trees. Not a single Engelmann oak or valley oak seedling was tallied on any of the 932 FIA plots.

GENERAL TECHNICAL REPORT PSW-GTR-217
608
Oaks 2040: Future Prospects for California’s Oaks The FRAP development models forecast that more than one million acres of California’s oak woodlands are developed, and approximately 750,000 are at risk of urban development before 2040. Twenty percent of California’s oak woodlands are facing rapid and increasing urbanization by 2040. The oak woodlands of the Central Valley and Sierra Foothills face the most immediate threats. Eighty percent of California’s oak woodlands that are at risk of development are located in the Sacramento and San Joaquin regions. See figure 3.
Figure 3—California oak woodlands at risk of development.
California Oaks: The Regional Analyses This section provides regional summaries. Each describes oak distribution, oak woodland and oak forest diversity, and oaks at risk.4
4Appendix B summaries are further detailed by region in the full report online at http://www.californiaoaks.org/Oaks2040.
Oaks 2040: The Status and Future of Oaks in California—Gaman
609
North Coast Region Counties included in this region are Del Norte, Humboldt, Mendocino, and Sonoma.
Oak Distribution and Diversity The North Coast Region has 1.3 million acres of oak woodland and 1.5 million acres of oak forest. In fact 35 percent of California’s oak forest is found in the North Coast region, and oaks are present on 45 percent of the region’s land (more coverage than any other region). In the North Coast region, there are 245 million oaks greater than 5- inches DBH. Only the Central Coast tops the North Coast’s two million oaks with DBH greater than 24 inches.
The North Coast oak woodlands feature Oregon white oak, tanbark oak and mixed oak. Canyon live oaks and California black oaks are also present, mixing in with Douglas-fir (Pseudotsuga menziesii), Pacific madrone (Arbutus menziesii), and California bay (Umbellularia californica). Oaks comprise approximately one-half of the basal area, trees/acre, and trees greater than 5 inches DBH/acre in white oak woodlands. In tanbark oak woodlands, oaks comprise less than 20 percent of the basal area, trees/acre, and trees greater than 5 inches DBH/acre.
In the North Coast’s oak forests, tanbark oak is predominant. Associated species include Douglas-fir, redwood (Sequoia sempervirens), madrone, bay, canyon live oak and California black oak.
Oaks at Risk in the North Coast Region In terms of ownership, 84 percent of the North Coast’s oak woodlands are located on private property. Most of the remainder is owned by the U.S. Forest Service and various other federal government agencies. Private ownership of oak woodland increases moving southward, ranging from 40 percent in Del Norte County to 95 percent in Sonoma County.
A total of 8 percent of North Coast oak woodlands have already been developed and 4 percent are at risk of near-time urban development, according to the FRAP forecasting model.
North Interior Region Counties in this region are Lassen, Modoc, Shasta, Siskiyou, and Trinity.
Oak Distribution and Diversity Nearly 1 million acres of oak woodland and 1.1 million acres of oak forest reside within the North Interior. The North Interior and the North Coast are the only two regions with more oak forest than oak woodland. The North Interior has nearly 400 million oak trees, and 150 million of these oaks are greater than 5 inches DBH.
In this region, a balanced mixture of blue oak, California black oak, canyon live oak and Oregon white oak woodlands is found. Blue oak woodlands typically include gray pine (Pinus sabiniana) and either interior or coast live oak, and oaks comprise more than 80 percent of the basal area and more than 90 percent of the trees. Oregon white oak woodlands include black oak, Douglas-fir, and ponderosa pine (Pinus ponderosa), and oaks make up 40 percent of the basal area and more than half of the trees greater than 5 inches DBH. In black oak and canyon live oak woodlands, oaks
GENERAL TECHNICAL REPORT PSW-GTR-217
610
comprise 50 percent of the basal area and 70 percent of the trees greater than 5 inches DBH.
In the North Interior oak forests, canyon live oak and black oak are prominent. These two oak species mix in with the local conifer species, including Douglas-fir, ponderosa pine, sugar pine (Pinus labertiana) and madrone. In black oak forests, oaks comprise one-fifth of the basal area. One-third of the trees greater than 5 inches DBH are oaks.
Oaks at Risk in the North Interior Region In terms of ownership, 60 percent of North Interior oak woodlands are privately owned,and 10 percent of the region’s oak woodland has already been developed. A total of 3 percent is at risk for urban development by 2040. We project that 87 percent is unlikely to develop into urban and suburban uses before 2040. Shasta County oak woodland is most at risk, as 15 percent has been developed and 5 percent more may develop by 2040.
Central Coast Region Counties included in this region are Alameda, Contra Costa, Marin, Monterey, San Benito, San Francisco, San Luis Obispo, San Mateo, Santa Barbara, Santa Clara, Santa Cruz, Solano, and Ventura.
Oak Distribution and Diversity The Central Coast is home to 1.6 million acres of oak woodlands and 300,000 acres of oak forests. Oaks are present on 17.5 percent of the region’s area. There are 87 million oaks 5 inches DBH and larger within the region.
One-half of the Central Coast’s oak woodland is coast live oak, and one-third is blue oak. A total of 80 percent of California’s coast live oak woodland is in the Central Coast, and 30 percent of the state’s valley oak woodland is in the Central Coast. However, there is not adequate inventory data to confidently describe this critical oak type.
Tanbark oak and coast live oak account for three-quarters of the region’s oak forests. Redwood and Douglas-fir dominate in these forests, but 40 percent of the trees are oaks.
Oaks at Risk in the Central Coast Region A complex land ownership matrix covers the oak woodlands of the Central Coast. Private ownership of oak woodlands predominates, averaging 75 percent throughout the region and ranging from 65 percent in Santa Barbara County to 95 percent in Alameda County. The Los Padres National Forest includes much of the oak woodlands in Ventura, Santa Barbara, San Luis Obispo, and Monterey counties. Additionally, the Bureau of Land Management manages 20 percent of San Benito’s oak woodlands, and Fort Hunter-Liggett holds 12 percent of Monterey’s oak woodlands. The state owns approximately 10 percent of oak woodland in Santa Clara, Contra Costa, and Santa Cruz counties.
Almost 85 percent of the Central Coast oak woodlands are unlikely to be developed before 2040. Most of the remaining areas have already been developed. Less than 3 percent is at current risk for urban development.
Oaks 2040: The Status and Future of Oaks in California—Gaman
611
Sacramento Region Counties in this region include Butte, Colusa, El Dorado, Glenn, Lake, Napa, Nevada, Placer, Plumas, Sacramento, Sierra, Solano, Sutter, Tehama, Yolo, and Yuba.
Oak Distribution and Diversity The Sacramento region’s 2.1 million acres of oak woodlands provide nearly one-quarter of the state’s total. Oaks are present on 20 percent of the region’s land. There are more than 165 million oak trees >5 inches in diameter in this region.
More than half of the Sacramento region’s oak woodlands are blue oak. Gray pines mix in, but oaks comprise 70 percent of the basal area and 80 percent of the trees greater than 5 inches DBH. The region contains more than one-third of the state’s blue oak woodland.
Interior live oak woodland contains blue oak, valley oak, California black oak, gray pine, and ponderosa pine. Canyon live oak and black oak woodlands include Douglas-fir, ponderosa pine, and incense cedar (Calocedrus decurrens). In canyon and interior live oak woodland, oaks make up 80 percent of the basal area and 90 percent of the trees. The Sacramento region has more than one-third of California’s valley oak woodland.
Black oak and canyon live oak dominate the region’s oak forests. Canyon live oak forests are 60 percent oaks, mixing with ponderosa pines and Douglas-firs. Black oak forests are 25 percent oaks, along with Douglas-fir, ponderosa pine, white fir (Abies concolor), and incense cedar.
Oaks at Risk in the Sacramento Region More than 80 percent of the Sacramento region’s oak woodland is privately owned. The U.S. Forest Service owns about 60 percent of the remaining public lands.
The Sacramento region is more at risk for development than any other. Only two-thirds of the oak woodlands are considered “stable.” One-sixth is developed and one-sixth is at risk. More than 300,000 acres of oak woodland could be developed in the Sacramento region by 2040.
El Dorado County has more oak woodlands at risk than any other county in the state, but Tehama, Butte, and Yuba counties are not far behind. By 2040, 80 percent of El Dorado’s oak woodlands and more than half of the oak woodlands in Nevada, Yuba, and Placer counties may be developed.
San Joaquin Region Counties in this region are Alpine, Amador, Calaveras, Fresno, Inyo, Kern, Kings, Madera, Mariposa, Merced, Mono, San Joaquin, Stanislaus, Tulare, and Tuolumne.
Oak Distribution and Diversity The San Joaquin region has more than 2.3 million acres of oak woodlands and 500,000 acres of oak forests. Oaks are present on only 10 percent of the region’s land; however, certain portions of the region have far greater oak woodland density than others. Twenty-seven percent of the state’s oak woodland fall within these 15 counties. The San Joaquin region currently has 113 million oaks larger than 5 inches DBH.

GENERAL TECHNICAL REPORT PSW-GTR-217
612
More than half of the region’s oak woodlands are blue oak and another 25 percent are interior live oak. Associated species include gray pine and California buckeye (Aesculus californica), as well as valley oak, blue oak and canyon and interior live oaks. The San Joaquin region has more blue oak woodlands and interior live oak woodlands than any other region. In blue oak woodlands, oaks account for 70 percent of the trees, 80 percent of the basal area, and trees greater than 5 inches DBH. In interior live oak woodlands, oaks provide 70 percent of the tree basal area and more than 80 percent of the trees. In canyon live oak woodlands, oaks comprise 55 percent of the basal area, 62 percent of all trees, and 67 percent of trees greater than 5 inches DBH.
Canyon live oak and California black oak comprise almost 90 percent of the oak forests. Associated species in San Joaquin oak forests include incense cedar, ponderosa pine, sugar pine and white fir. In canyon live oak forests, oaks provide one-third of the basal area and nearly one-half of the trees. In black oak forest, oaks comprise more than half of the trees, but only one-third of the trees greater than 5 inches DBH and only one-quarter of the tree basal area.
Oaks at Risk in the San Joaquin Region Seventy-three percent of the San Joaquin region’s oak woodlands are privately owned. The U.S. Forest Service owns 18 percent and the Bureau of Land Management owns 5 percent. A total of 10 percent of the oak woodlands in the region have already been developed, and 10 percent are at high risk of development by 2040. Eighty percent are currently stable; however, targeted planning could ensure that a greater number of acres are conserved for the long-term. Nearly 250,000 acres of oak woodlands in the San Joaquin region are at risk of development by 2040. Only the Sacramento region contains more oak woodlands at risk. In Madera, Amador, and Calaveras counties combined, more than one-third of all oak woodland may be developed before 2040.
Southern Region Counties in this region are Imperial, Los Angeles, Orange, Riverside, San Bernardino, and San Diego.
Oak Distribution and Diversity The Southern region is home to more than 300,000 acres of oak woodlands and more than 200,000 acres of oak forests. Combined, these 500,000 acres comprise only 2 percent of the region. However, discounting urban areas and the desert, the oak woodland concentration is much higher.
Coast live oak and canyon live oak are most prevalent, but California black oak and Engelmann oak populations are also significant. Eighty-five percent of the basal area is comprised of oaks. The region has 23 million oak trees > 5 inches DBH. The rare Engelmann oak is found only within this region, mostly in San Diego County.
Canyon live oak and black oak dominate in the Southern region’s oak forests.
Oaks at Risk in the Southern Region The oak woodlands of the Southern region have the highest levels of public ownership found in the state. The U.S. Forest Service owns 44 percent of the region’s
Oaks 2040: The Status and Future of Oaks in California—Gaman
613
oak woodlands, 11 percent are owned by other government agencies, and 45 percent are privately owned.
A total of 20 percent of the Southern region’s oak woodlands have already been developed, and 10 percent are at risk of development by 2040. Development of the remaining 70 percent is not anticipated in the near future. Oak woodland development percentages are higher than in any other region in the state.
Summary The project presents an updated map and inventories of oak forests and woodlands. These data should be useful for conservation planning at the regional, county, and local levels. The FIA plots are also valuable for ongoing monitoring of thousands of individual trees and populations on a landscape scale over a long period of time.
We found that large oak trees are deceptively rare in California. Valley oak and Engelmann oak types need more intensive inventories. Blue oak woodland species have unsustainable rates of regeneration.
Oak woodlands in the Sacramento and San Joaquin regions are most at risk of development. California should plan for protection of its “stable” oak ecosystems now before these ecosystems are fragmented beyond repair.
A more-detailed version of this report, including regional inventories, is presented online at the Web site of the California Oak Foundation http://www.californiaoaks.org/Oaks2040.
References Bolsinger, C.L. 1988. The hardwoods of California’s timberlands, woodlands, and
savannas. USDA Forest Service Resource Bulletin PNW-RB-148. California Department of Forestry and Fire Protection Fire and Resource Assessment Program (FRAP). 2003. The Changing California Forest and Range 2003 Assessment. www.frap.cdf.ca.gov/assessment2003/
California Department of Forestry and Fire Protection Fire and Resource Assessment Program (FRAP). 2003. The changing California forest and range 2003 assessment. www.frap.cdf.ca.gov/assessment2003/
Fire and Resource Assessment Program (FRAP). 1994-2005. GIS layers: Hardwood rangeland vegetation; GovtownA; development projections; Land Cover Mapping and Monitoring Program (LCCMP) Vegetation Data; PCTL05. California Department of Forestry and Fire Protection. http://frap.cdf.ca.gov/data/frapgisdata/select.asp
Forest Inventory and Analysis Program (FIA). 2005. FIA Database Version 2.1 United States Forest Service. http://www.fia.fs.fed.us/tools-data/data/
Merenlender, A.M.; Brooks, C.; Shabazian, D.; Gao, S.;Johnston, R. 2005. Forecasting exurban development to evaluate the influence of land-use policies on wildland and farmland conservation. Journal of Conservation Planning 1(1):64-88.
Waddell, K.L.; Barrett, T.M. 2005. Oak woodlands and other hardwood forests of California, 1990s. PNW-RB-245. Portland, OR: U.S. Department of Agriculture, Forest Service, Pacific Northwest Research Station. 94 p.
614

Oaks 2040: The Status and Future of Oaks in California—Gaman
615

GENERAL TECHNICAL REPORT PSW-GTR-217
616
Continue