Oakland Schools Science Scopeflintsciencesource.weebly.com/uploads/5/0/6/6/... · Explain how a...
68
Oakland Schools Science Scope Grade 5 Dynamics of the Solar System
Transcript of Oakland Schools Science Scopeflintsciencesource.weebly.com/uploads/5/0/6/6/... · Explain how a...

Oakland Schools Science Scope
Grade 5
Dynamics of the Solar System

5th Grade EARTH SCIENCE Materials List Bound notebook for each student Balls-various sizes to include small white and large white (pool cues, ping pong, tennis, small rubber, etc) Sticks- Shadow stick (yardstick) to create a shadow Compasses Sidewalk chalk Masking tape Rulers Domed plastic bowls (domed slurpee lids, water bottles) Washers String Large glass jars Turntable/lazy Susan Pencils/dowels Flashlights Whiteboards Stellarium software on iPads or laptops (free) Moon phase cards (link) Small round balloons (white) Soda bottle caps Bright lamp/light source Graph paper Ropes cut in different lengths to represent differing orbits (8) Tape measure Scale sized sets of planet pictures Planet pictures Clay
Oakland Schools Curriculum Unit Plan
Fifth Grade: Dynamic Systems

Dynamics of the Solar System
Knowledge ● Use and describe a model that illustrates the path of the Earth around the sun. ● Describe how the Earth tilts on its axis as it travels around the sun. ● Explain how the tilt of the Earth as it travels around the sun causes an annual variation in the
intensity of the light reaching any specific spot on the Earth. ● Explain how the tilt of the Earth also results in an annual variation in the length of daylight. ● Explain how this change in light intensity and length of daylight results in seasons. ● Explain how a year is defined as the time it takes for the Earth to make one complete orbit
around the sun. ● Describe the location of the planets, dwarf planets and plutoids and their orbits in relationship to
the sun. ● Explain the motion of asteroids around the sun. ● Explain the motion of comets around the sun. ● Understand that all planets rotate on their axis as they revolve around the sun. ● Understand that moons rotate on their axis as the revolve around their planet. ● Explain how gravity is the force keeping the planets and moons in their orbits. ● Describe the orbit of the moon around the Earth. ● Understand that the angle between the Earth, sun and moon is constantly changing as the
moon orbits the Earth. ● Understand that the moon is visible because it reflects light from the sun. ● Explain that the lighted face of the moon changes as the angle of the moon changes between
the Earth and the sun. ● Explain how this change results in the observed phases of the moon. ● Identify stars in the night sky. ● Explain how stars form patterns that are called constellations. ● Explain how the sky appears to move due to the rotation of the Earth. ● Explain how if observations are made at the same time each night, the position of the observed
objects will have appeared to change. ● Explain how the apparent rising and setting of the sun are the result of the rotation of the Earth
on its axis. ● Explain how the Earth’s position changes as it revolves around the sun causing different
constellations to be seen at different times of the year and in different places in the sky. ● Explain how a lunar eclipse results from the moon passing through the shadow of the Earth. ● Explain how a solar eclipse results from the Earth passing through the shadow of the moon. ● Explain why some eclipses are total and some are partial. ● Explain the gravitation pull of the sun on the Earth. ● Explain the gravitational pull of the moon on the Earth. ● Explain how the water in the oceans responds to the gravitational pulls of the sun and the
moon. ● Explain how the daily cycle of tides is related to the Earth’s rotation ● Explain how the highest tides result from the gravitational forces of the sun and moon working
together. ● Explain how the lowest tides result from the gravitational pull of the sun and moon working in
opposition.

Skills ● Design a model that demonstrates the motion of the planets, dwarf planets, plutoids, asteroids
and comets.
Critically Important Vocabulary Instructionally Useful seasons tilt axis revolution rotation solar system planet dwarf planet asteroids comets gravity gravitational pull phases stars constellations lunar solar eclipse tides
latitude model circular elliptical apparent motion satellite celestial North Star Mars Venus Earth Neptune Uranus Saturn Mercury Jupiter
Grade 5
The Dynamics of the Solar System About Our Scope Unit/Lesson Template This template is designed to serve several teaching and learning principles considered as staples of state of the art science instruction. Here are the key principles in summary:
● It’s critical to elicit prior knowledge as a unit or lesson begins ● Key questions should drive student explorations and investigations ● Activity Before Concept – Student inquiry-based explorations which give personal experience with
phenomena and ideas should precede a presentation of science ideas. ● Evidence is the heart of the scientific enterprise. Students generate evidence and analyze patterns
in data that help to construct scientific explanations around key questions.

● Concept Before Vocabulary – attaching science vocabulary to concepts developed by student investigations yields more success than beginning a unit or lesson with a list of science vocabulary.
● Talk, argument and writing are central to scientific practice and are among the most important activities that develops understanding.
● Application of the ideas provides review, extends understanding and reveals relevance of important ideas.
● Assessment of knowledge, skill and reasoning should involve students throughout the learning process and be well aligned to the main objectives and activities of the unit.

The Scope Science template is designed to put these principles into practice through the design of the SCOPE LEARNING CYCLE FOR SCIENCE. Each unit has at least one cycle. The components are listed below:
The Key Question for the Unit
Each unit has one, open ended driving question that relates to all the content and skills of the unit. The Key Question is presented at the opening of the unit and revisited at the unit’s conclusion.
Engage and Elicit Each unit begins with an activity designed to elicit and reveal student understanding and skill prior to instruction. Teachers are to probe students for detailed and specific information while maintaining a non-evaluative stance. They also can record and manage student understanding which may change as instruction proceeds.
Explore A sequence of activities provides opportunities to explore phenomena and relationships related to the Key Question of the unit. They will develop their ideas about the topic of the unit and the Key Question as they proceed through the Explore and Investigate stage of the learning cycle. Each of the activities may have its own Key Question or central task that will be more focused than the unit question. The heart of these activities will be scientific investigations of various sorts. The results, data and patterns will be the topic of classroom discourse and/or student writing. A key goal of the teacher is to reference the Key Question of the unit, the Engage and Elicit of the students and to build a consensus especially on the results of the investigations.
Explain Each unit has at least one activity in the Explain portion of the unit when students reconcile ideas with the consensus ideas of science. Teachers ensure that students have had ample opportunity to full express their ideas and then to make sure accurate and comprehensible representations of the scientific explanations are presented. A teacher lecture, reading of science text or video would be appropriate ways to convey the consensus ideas of science. Relevant vocabulary, formal definitions and explanations are provided. It’s critical that the activity and supporting assessments develop a consensus around the Key Questions and concepts central to the unit.
Elaborate Each unit cycle has at least one activity or project where students discover the power of scientific ideas. Knowledge and skill in science are put to use in a variety of types of applications. They can be used to understand other scientific concepts or in societal applications of technology, engineering or problem solving. Some units may have a modest Elaboration stage where students explore the application of ideas by studying a research project over the course of a day or two. Other units may have more robust projects that take a few weeks.
Evaluation. While assessment of student learning occurs throughout the unit as formative assessment, each unit will have a summative assessment. Summative assessments are posted in a separate document.
Grade 5
The Dynamics of the Solar System

Contents
Unit Introduction 7 Learning Cycle 1: Earth’s Motion and the Sun 8 Learning Objectives 8 Key Question 8 Engage and Elicit Activity 1a – Are We Moving? 9 Activity 1b – Predicting the Sun’s Motion Today 11 Explore Activity 2 – Where the Sun Goes 13 Activity 3 – The Reasons for the Seasons 15 Activity 4 – Does Distance to the Sun Cause the Seasons? 16 Activity 5 – Analyzing Patterns in the Hours of Daylight 17
Explain Activity 6 – Proving the Earth Moves 18 Activity 7 –Testing Scientific Explanations of Earth’s Seasons 20 Activity 8 – Interactive Lecture using Starry Night 21 Elaborate Activity 9 – Time-lapse Photo Series of Sunrise/Sunset 22 Learning Cycle 2: The Earth-Moon-Sun System 23 Introduction 23 Learning Objectives 23 Key Question 23 Engage and Elicit Activity 1 – Direct Physical Modeling of Moon Phases Using the Sun 24 Activity 2 – Sequencing Phases of the Moon 25 Explore Activity 3 – Creating a Moon Phase Log 26 Activity 4 – Earth – Moon – Distance 27 Activity 5 – Physical Model of Moon Phases 1 29 Activity 6 – Physical Model of Moon Phases 2 30 Activity 7 – Analyzing Dramatic Tides and Tidal Data 31
Explain Activity 8 – Testing Scientific Explanations of Earth’s Seasons 34 Activity 9 – The Reason for the Seasons Web Quest 35 Elaborate Activity 10–Annotated Photo Series Project 36
Learning Cycle 3: Objects and Motion in the Solar System Introduction 37 Learning Objectives 37
Key Question 37 Engage and Elicit Activity 1: Grouping Planets by Characteristics 38 Explore Activity 2a – The Dance of the Planets 40 Activity 2b – The Pull of the Sun 41 Activity 3 – How Far to the Planets 43 Activity 4 – Scaling Size of the Planets 45
Explain Activity 5 – Testing Scientific Explanations of Planet Motions 48 Activity 6 – Solar System Presentation 50 Elaborate Activity 7 – Your Weight on Other Worlds 51
Administer the Unit Pretest prior to teaching the unit.
Save results for later comparison.

Earth Science Pre-Test - Grade 5 Multiple Choice Circle all of the answers that complete the statement or answer the question (more than one answer is possible).
1. Why would a person standing on the Moon be able to see the Earth? a The sunlight reflects off the Earth. b The Moon is close to the Earth. c The Earth is bigger than the moon.. d The Moon produces light. 2. Why does the Earth experience seasons?
a The Sun is hotter in the Spring and Summer b The angle of sunlight hitting the Earth changes c The Earth is tilted on its axis d The Earth gets less sun in the Fall and Winter 3. What type of path does the Earth take when orbiting the sun? a Clockwise – circular path b Counter clockwise – circular path c Clockwise – elliptical path d Counter clockwise – elliptical path 4. What keeps the Earth in its orbit? a The direction of the Earth’s rotation b The speed of the Sun’s rotation c The Earth’s location between other planets d The Sun’s gravitational pull 5. The Earth takes 365.25 days to orbit the Sun. Which of the following is a result of this fact? a February has 28 days instead of 30. b Leap Years are years when February 29th is added to the calendar. c All calendars have 365 days. d An extra day is added every four years. 6. A year on Jupiter is 4,333 days long. A year on Mercury is 88 days long. Why are the lengths of the years on these planets different? a Planets exert a gravitational force on other planets. b Some planets are larger than other planets. c Each planet has its own orbital period d A year is longer on larger planets. 7. What causes the phases of the Moon? a The pull of gravity between the Moon and the Earth
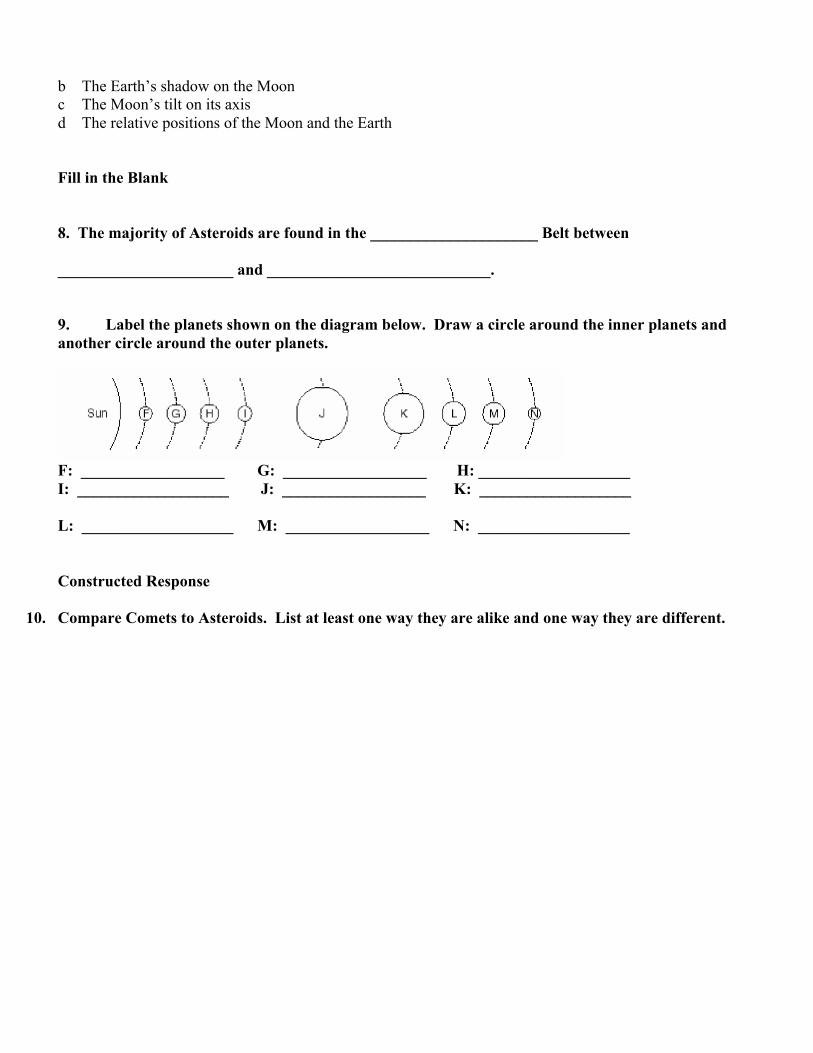
b The Earth’s shadow on the Moon c The Moon’s tilt on its axis d The relative positions of the Moon and the Earth Fill in the Blank 8. The majority of Asteroids are found in the _____________________ Belt between ______________________ and ____________________________. 9. Label the planets shown on the diagram below. Draw a circle around the inner planets and another circle around the outer planets.
F: __________________ G: __________________ H: ___________________ I: ___________________ J: __________________ K: ___________________ L: ___________________ M: __________________ N: ___________________ Constructed Response
10. Compare Comets to Asteroids. List at least one way they are alike and one way they are different.

Unit Introduction This is an astronomy unit that attends to the concepts related to the solar system, and the evidence we have that has allowed us to develop models of the motion of the Earth and moon, and other objects in solar system.
Earth Science Benchmark Post-Test 5th Grade Answer Document
Question Correct Answer(s) Points
1 A 1
2 B, C 2
3 D 1
4 D 1
5 B, D 2
6 C 1
7 D 1
8 Kuiper, Mars, Jupiter 3
9One circle around F, G, H, and I. One circle around J, K, L, M, and N. F -
Mercury, G - Venus, H - Earth, I - Mars, J - Jupiter, K - Saturn, L - Uranus, M - Neptune, N - Pluto
11
10Alike - Orbit the sun; part of our solar system; not stars, planets, or moons.
Different - Comets are made of ice and have a tail; Asteroids are made of rock do not have a tail.
2
Total Points 25

Topically, the unit addresses concepts within the disciplines of earth and space systems science, which is a very large topic. But the Oakland Schools Science Scope has established a good deal of coherence by organizing the unit into three cycles:
Cycle 1: Earth’s Motions and the Sun Cycle 2: The Earth-Moon-Sun System Cycle 3: Objects and Motion in the Solar System
The resources and opportunities to address these topics are of such abundance and quality that the unit has the tremendous potential to be a highly relevant, real world and investigation-rich experience for students. As teachers look for ways to have students use real world data, apply interactive technology to real world questions, and foster meaningful tasks for reading, writing, argumentation and mathematics and framed by the Common Core Curriculum Standards, the issues here provide abundant opportunity. The main limitation is the class time available given other content demands. On the Common Core State Standards for English Language Arts and Literacy in Science All science teachers will find the Common Core State Standards of ELA a tremendous asset for reaching learning objectives in science education. Reading, writing, argumentation and discourse are central proficiencies necessary for success in science. All teachers should become fluent with the document and are likely to find it validating.
http://www.corestandards.org/assets/CCSSI_ELA%20Standards.pdf These standards are best reached with science instruction that connects content to real world problems and experiments, complimented with scientific writing, challenging questions, processes for classroom discussion and debate and use of scientific text. It is recommended that teachers require students to use an interactive science notebook to support learning in this unit. Here are some features and policies to consider:
● Use a bound notebook, like a composition book – you can cut and paste or staple some other materials into it.
● The right facing page is for teacher content, the left is for student reflection ● Leave four pages for a table of contents ● Leave the notebooks in the room ● Quad ruled notebooks are very nice for the graphing activities.
Learning Cycle 1: Earth’s Motion and the Sun Introduction This portion of Unit 2 centers on the nature of Earth’s motion around the sun. It begins with the concepts of spin (rotation) and orbit (revolution) as they relate to seasons, length of day, and length of the year. Students use physical models and simulation software to develop an understanding of the motion of the Earth relative to the sun as well as the apparent (perceived from Earth) motion. Specific objectives in this unit address common student pre-conceptions, such as the contrast between rotation and revolution motions, which objects are actually moving, and how they are moving. Learning Objectives

Knowledge 1. Describe how the length of day changes with the seasons. 2. Describe how the sunrise and sunset changes through the year. 3. Explain the factors that cause Earth’s seasons. 4. Explain the motion of the Earth and its relationship to the sun.
Skills 5. Model the motion of the Earth and the causes of seasons. 6. Model the apparent motion of the sun through the year.
Key Question: How can we understand the movement of celestial bodies and how they affect us?

Engage and Elicit Activity 1a -- Are We Moving? Purpose To elicit discussion and ideas about the idea that the Earth is moving. Activity Description This elicitation activity should allow for an open, non-judgmental conversation between the teacher and students. If students debate conclusions, the teacher should carefully listen and probe with questions to get students to elaborate on their thinking. Students should be allowed to fully voice their opinions, and rules of respectful debate should be clearly set up as part of the unit introduction. Focus Question How do we know the Earth is moving? How could we tell? Duration Half a class period (20-25 minutes). Materials
● Astronomy journals (to be used throughout the unit) ● Classroom discussion rules ● Balls, sticks, or anything that might be used to show motion ● Whiteboards for discussion
Teacher Preparation Teacher may want to spend time thinking about possible discussion paths and prepare responses or redirects to help keep students on task. This open-ended discussion may leave students uneasy, but it is important to get them thinking about how science works and how we know what we know. Also, good classroom discussion procedures can be practiced and white boarding techniques used effectively. Classroom Procedure
1. If possible, take students outside on a sunny day. You may start the 1a activity by placing a shadow stick on the ground and marking where the shadow falls without any explanation. You may also do this activity indoors.
2. Tell students you are convinced the Earth is perfectly still and that the sun is going around us, or set up a situation where someone you know needs convincing, etc. If students protest, tell them you have absolutely no proof to give that the Earth is moving, but are pretty sure it is. Allow them to engage in finding proof to convince you, or set up teams to come up with evidence that the Earth is indeed moving.
3. Have students come together to present their best evidence that the Earth is moving on their whiteboards. If you are outside, they can do it orally or draw in their notebooks. If they come up with nothing, suggest clouds moving to spur the debate, or time zones. Have them throw a ball up in the air to predict where it will land. Most discussion will lead back to the fact that a non-moving Earth can explain everything we see.

4. The discussion can be left somewhat open, to be explored as the unit continues, but during the discussion some ideas could be introduced -- that up until 400 years ago, no one thought the Earth moved at all. How did this idea come to be at a time before modern technology and satellites? We will explore this question. The ideas of direction should be set up during the discussion, such as north, south, east and west. Overhead is called your zenith. Your meridian is an imaginary line from the north to the south passing directly through your zenith.

Engage and Elicit Activity 1b – Predicting the Sun’s Motion Today Purpose To elicit and begin to record student understanding about the sun’s apparent motion. Activity Description With journals and a shadow stick (gnomon) or any object with some height, the class steps outside to observe and make predictions about the sun’s movement during the day. Formative assessment takes place through discussion and through journal writing. Focus Question What happens to the shadow of the stick through the day? In which direction does the shadow shift? Duration One class period (45 minutes). Materials
● Astronomy journals ● Shadow Stick – anything with length that can be stood up to cast a straight, narrow shadow. ● Compass ● Sidewalk chalk or masking tape for marking directions.
Classroom Procedure
1. Go outside when there is sunshine. Lead students to an open area where the sun would be hitting the ground. Establish directions – students can form a circle and use the compass to mark the directions. Remind them of where their zenith is. Locate the sun in the sky and ask them to tell you its direction.
2. Assign students to two or three-member teams. Tell them they will be discussing questions together and will be asked to develop a consensus and answer as a group. It is okay if there is disagreement, but they should discuss things thoroughly to give members the chance to change their minds.
3. Start by showing the shadow stick and ask for predictions about how the shadow will look (length and direction).
4. Set it on the ground and immediately trace the shadow with a label of the current time to the minute. 5. Ask for predictions about the shadow. Will it change in any way? Choose a representative answer and
sketch its predicted movement on the ground with the chalk or other method. Have students sketch their predictions in their own Journals.
6. After Step 5, the class will return their attention to the stick. Mark the movement and begin discussion about what is going on.
7. The teacher asks a series of questions and collects thoughts: ● Where did the sun rise today? ● Where will it set? ● Point to a path in the sky where the sun will travel during the day. *
8. Have students answer the following questions in their journals. a. What does the motion of the stick’s shadow say about the motion of the sun? b. Do the terms clockwise and counterclockwise have any connection to the motion of the shadow
or the motion of the sun across the sky?

c. Can you think of a way to measure time by using the shadow of a stick in the sun? Teacher should record student notions as they keep an astronomy journal on key questions. *Note: Students will most likely not distinguish between sunrise and sunset occurring at positions other than due east and due west throughout the year, though in reality it changes position every day. Likewise, they will indicate that the sun is overhead at noon, which is another erroneous preconception. The sun is NEVER overhead in Michigan. These are difficult preconceptions to overcome, so teaches should be aware they exist.

Explore Activity 2 – Where the Sun Goes Purpose To gather data on the apparent motion of the sun throughout the day and through the unit. Activity Description Students will use the plastic sun domes to mark the appearance of the sun in the sky and chart it over a length of time. Focus Question How does the sun move through the day and does it change as the weeks go by? Duration Part 1: All day, five minutes at a time, every hour. Part 2: Ongoing, about 5-10 minutes a day. Materials ● Sun Dome Kits: these are small clear plastic hemispheres on which you can mark with erasable
markers, crayon, grease pencils the positions on the sun through a period of time. (Viable alternatives may include inverted bowls, tops of domed slushee lids, domed water bottles, etc. with permanent marker.)
● Sunny days Teacher Preparation
Teacher should read instructions that come with the Sun Domes Kit. Several activities can be done with the sun domes.
Alternative Instructions to Sun Domes Kit Follow the Sun below http://www.learner.org/jnorth/tm/monarch/SunFollowMonarch.html
Follow the Sun
A Model to Track the Sun's Apparent Movement Across the Sky
Background: Scientists say monarch butterflies use the sun as their clock and compass during migration. They have a mechanism called a "time-compensated Sun compass."
It’s hard to visualize this without a model, so try this activity. You'll need a sunny day, several trips outside, and a plastic dome. First find the direction to Mexico from your hometown. Draw an arrow on the dome to show the direction of flight to Mexico. Then, using the model, record how the sun appears to sweep across the sky during the day.
(Just think, monarchs know all of this by instinct! So even if you find this complicated, you’ll appreciate the challenges monarchs face when

using the sun as a clock and compass! )
Each time you go outside, describe the direction you’d need to fly south to Mexico, in relation to the position of the sun. This chart illustrates the “flight instructions” you can imagine monarchs following at each time of day in order to orient southward:
Local Time Flying Instructions (in order to fly SOUTH)
9:00 AM Fly with the sun on my left.
12:00 PM Fly straight toward the sun.
4:00 PM Fly with the sun on my right.
Materials:
● Clear 2-quart bowl ● Large sheet of white paper ● Sharp pencil ● Overhead marking pen ● Compass
Activity:
1. Take all the materials outside. Find a level surface for the paper. Make sure the location receives sunlight throughout the day.
2. Make an X in the center of the paper. This X will represent our Earth. 3. Place the bowl (our atmosphere) upside down on the paper. Mark an
x on the center of the bottom of the bowl with the overhead marker. Make sure the X on the paper is lined up under the x in the center of the bowl. Trace the edge of the bowl onto the paper to make it easier to line up.
4. Using the compass determine North for your location. Mark North on the paper and on the bowl.
5. Each hour, touch the side of the clear bowl with the tip of the pencil so that the shadow of the pencil's tip falls on the X on the paper.

(You can put a small 1,2,3 etc. beside each dot so you'll remember the order in which you made the observations). To get accurate results the bowl must sit in the same location and be lined up in the same way for each hourly (and monthly reading).
6. After making four or five marks determine which direction the sun is moving.
7. Extention: Repeat this activity each month to show the changes in the angle of the sun throughout the year. Use one color overhead marker from Sept through December and another color from January through June. If this is done on or about the 20th of each month you will see the results on the fall and spring equinox and the winter solstice.
Materials:
● Clear 2-quart bowl ● Large sheet of white paper ● Sharp pencil ● Overhead marking pen ● Compass
Activity: 1. Take all the materials outside. Find a level surface for the paper. Make sure the location receives sunlight
throughout the day. 2. Make an X in the center of the paper. This X will represent our Earth. 3. Place the bowl (our atmosphere) upside down on the paper. Mark an x on the center of the bottom of the
bowl with the overhead marker. Make sure the X on the paper is lined up under the x in the center of the bowl. Trace the edge of the bowl onto the paper to make it easier to line up.
4. Using the compass determine North for your location. Mark North on the paper and on the bowl. 5. Each hour, touch the side of the clear bowl with the tip of the pencil so that the shadow of the pencil's tip
falls on the X on the paper. (You can put a small 1,2,3 etc. beside each dot so you'll remember the order in which you made the observations). To get accurate results the bowl must sit in the same location and be lined up in the same way for each hourly (and monthly reading).
6. After making four or five marks determine which direction the sun is moving. 7. Extention: Repeat this activity each month to show the changes in the angle of the sun throughout the
year. Use one color overhead marker from Sept through December and another color from January through June. If this is done on or about the 20th of each month you will see the results on the fall and spring equinox and the winter solstice.

Classroom Procedure Part 1
1. Take students out on sunny days, or if you have a window facing south, southeast, or southwest, you can do it in the classroom. Use instructions with the Sun Dome Kit. Kit comes with procedures and all materials needed. (May use alternative instructions)
2. Mark the shadow of the pen tip on the dome where it meets the center of the base. 3. Continue this procedure every ten minutes for an hour. Different students can be in charge of the
marking, and it might be fun to have a special timer go off to remind them. 4. When students are done with their observations, connect the dots on the dome to show the path of the
sun through the day. Make sure to mark this line on the inside of the dome, and put the date and time range on it.
5. Have students answer these questions in their journals: ● Can you tell from what direction the sun rose? Predict where it will set. ● Where in the sky was the sun seen at noon? Is that what you expected? ● From the line drawn on the dome and the amount of time it represents, can you predict
(extrapolate) how many hours of sunlight there will be? Part 2
1. After completing the one-day activity, keep the dome without erasing the line drawn on it. 2. Take the dome outside on sunny days for a month or so. 3. Mark the shadow of the pen tip on the dome where it meets the center of the base as you did in Part 1,
only pick the same time of day. 4. Take data every sunny day that is available for two weeks. In September and October, the differences
will be larger than in December or January, at which times it will be difficult to get good results. Likewise, differences will be greatest in late February, March, and early April.
Begin Extension Project: Create a time-lapse record of sunrise or sunset with either a camera, cell phone cameras, or by student sketching. Make sure students take pictures/sketch at the same place and the same time every few days.

Explore Activity 3 – The Reasons for the Seasons Purpose To model the effect of the Earth’s tilt on the Earth, causing seasons. Activity Description For this activity, teachers use an overhead projector, a globe and a special transparency with dots that represent packets of solar energy. By setting the globe in a position that represents a certain season (e.g., winter), the energy dots can show how much sunlight the Earth gets in different seasons. Alternative Activity with flashlights link http://mrsharmonscience.weebly.com/uploads/1/3/2/2/13222665/seasonslab.pdf Alternative 2 Activity with flashlights explanation Classroom Demonstration Materials: LCD Projector Globe or blow up globe The light of the LCD projector models the light from the sun. Small Group Activity Materials: one set for each pair of students Flashlight or light source 4” Styrofoam ball (white or painted) rubber band that fits around the ball Turn off the lights so that the light can be seen reflecting off of the ball. (Painting the balls can help, as can placing a pen or pencil into the ball to hold it. ) 1. Begin the activity with a few questions. Then pass out the materials to each group. Explain what the materials represent. Ask students:
Where does Earth get its energy? Energy drives climate and life. (Sun) Does all of the light from the Sun reach the Earth? (no) What happens to light that doesn’t reach the Earth? (continues past Earth)
Tell students that they have been given a model Sun (the flashlight) and a model Earth (Styrofoam ball). 2. Tell students that their challenge is to think about how the Sun’s radiation hits the Earth.
Does the Earth get equal amounts of sunlight everywhere? (More at equator) What are the implications of unequal amount of sunlight? (Climate)
Allow students some time to play around with the flashlight and the ball and see what they come up with. After a few minutes, ask students to share their ideas. It isn’t necessary for all students to come up with a correct answer. It’s much more important that they realize the variables that are involved with the answer: distance from the Sun & size of the Earth.

3. Pass out a rubber band to each group. This represents the equator. Students should put the rubber band around the Earth where the equator is, and then hold the Earth model in the proper angel to the plane of rotation. Tell students that Earth’s axis of rotation (line from pole to pole) is tilted 23° from the plane about which Earth. The teacher should show what the correct orientation is. 4. Discuss with students the intensity of the radiation at various illuminated parts of the globe. A location at the equator will receive much more intense and direct sunlight at noon than it will at sunrise or sunset. This is effectively because one hemisphere is receiving only a circle’s area worth of radiation. Be sure students know what the word variable means. Ask students about quantifying the solar input to Earth. -‐ What factors would change the amount of energy (sunlight) reaching a planet? (size of planet, distance from Sun, sunspots). -‐ Would the rate of rotation or revolution or the tilt of a planet change the total solar energy (amount of sunlight) reaching a planet?
● The rate of rotating around the Sun will not change the amount of solar input on average, nor will the length of a day (revolution around Earth’s axis).
● The tilt of the axis does not change the total energy. Instead, the tilt of the axis changes when and where that solar energy is
Additional discussion and de-‐brief questions: 1) How often does the Earth make a full rotation? 2) What happens if you rotate the Earth? 3) What happens if you move the Sun farther away? How would this affect the Earth’s temperature? 4) Does the Earth get the same amount of sunlight in every place? If not, what part of Earth receives the brightest (most) sunlight? 5) Based on your observation, what part of the Earth would be the hottest? What part of the Earth would be the coldest? Focus Question How does the tilt of the Earth affect our climate? Duration Two class periods. Materials
● Energy Dot Model

● Atlas URL: ● Student handout ● 4 – 6 standard globes, ● 4 – 6 overhead projectors ● 4 – 6 Energy Dot Transparencies ● Graph paper ● Rulers ● Colored pencils
Teacher Preparation
1. For each team of four students, one globe and one overhead projector will be needed. Plan ahead to gather/borrow these resources.
2. Print a transparency of energy dots for each station. Classroom Procedure
1. Follow the procedures in the activity packet from the Atlas site. 2. During the set up, involve students in a deliberation on the experimental design. Their analysis relies
on data shared with other student teams. Challenge them to consider how holding variables constant is critical to produce strong data.
3. Make sure there is a good deal of whole class analysis on the data. 4. Use the opportunity to discuss the role of modeling in science; students are using this model to
generate evidence in the form of data.

Explore Activity 4 – Does Distance to the Sun Cause the Seasons? Purpose To provide direct evidence that the sun is further away in the summer. Activity Description Students use a year-long series of photographs of the sun to measure its size as observed from Earth. Focus Question What does the apparent size of the sun tell us about its distance? Duration One class period. Materials
● Sets of four pictures of the sun, for groups of 3-4 students ● Rulers ● Astronomy journals
Teacher Preparation
1. Print pictures of the sun found here: 2. http://solar.physics.montana.edu/ypop/Classroom/Lessons/Eccentricity/sunpix.html. 3. Lesson is from http://solar.physics.montana.edu/ypop/Classroom/Lessons/Eccentricity/.
Classroom Procedure
1. Teacher uses the images from the website to measure the sun at four different times through the year. If you don’t have the image software, you can just print them out.
2. Students will make two columns in their notebooks. List the date on the left, and the apparent diameter of the sun on the right.
3. In their small groups and their journals, students should answer the following questions: ● On what date does the sun appear to be biggest? ● When does it look smallest? ● Will it be closer to us when it looks bigger or smaller? ● When is the sun closest to us? ● Does the sun’s distance cause the seasons?

Explore Activity 5 – Analyzing Patterns in the Hours of Daylight Purpose To analyze data of daylight and draw conclusions from it. Activity Description Students analyze hours of daylight from data provided from varying latitudes (equator vs. 45° N) and seasons (spring/fall vs. winter vs. summer). Focus Question How does the amount of daylight change throughout the year? Duration One class period (45 minutes). Materials
● Data on length of day: http://www.orchidculture.com/COD/daylength.html (For Michigan choose 45° N )
● Astronomy journals Teacher Preparation
1. Teacher may want to provide data on a separate sheet if students don’t have access to computers. (Project on Promethean Board for classroom display.)
Classroom Procedure
1. Share data with students. 2. Have them plot the date on the x-axis of a graph and the amount of daylight on the y-axis. What
pattern emerges? 3. Have students answer these questions in their journals: ● When is the number of daylight hours longest? ● When is it shortest? ● What seasons do these dates correspond to? ● When are the daylight hours about equal (about 12 hours)? ● What are the seasons that correspond to these dates?

Explain Activity 6 – Proving the Earth Moves Purpose To revisit the Elicit activity and discussion about the proof of Earth’s movement. Activity Description Students will see a model of a Foucault pendulum and continue the discussion of the Earth’s movement. Focus Question Is there a way to prove that the Earth actually is moving? Duration One class period (45 minutes) with opening dialogue and historical introduction. * Materials
● One weight (washer) on a string (to make a pendulum) ● Large glass jar ● Turntable or lazy susan. ● Pencil or small dowel ● Tape
Teacher Preparation For a good animation, use the following website: http://www.animations.physics.unsw.edu.au//jw/foucault_pendulum.html. This activity came from: http://www.education.com/science-fair/article/rotation-spinning-earth-axis/.
To make the Foucault (foo-kōh) pendulum:
1. Tie one end of the string to the washer. 2. Tie the free end of the string to the center of the pencil. 3. Center the pencil across the mouth of the jar so that the washer is suspended inside the jar. 4. Set the jar on the turntable. 5. Spin the turntable counterclockwise and adjust the position of the jar and/or pencil so that the string
hangs straight down as the turntable spins. 6. Stop the turntable and secure the pencil to the jar with tape. 7. Tilt the jar to start the washer moving back and forth in one direction. Set the jar back in place on the
turntable.

8. While the washer is swinging, spin the turntable in a counterclockwise direction as before. Classroom Procedure
1. Open the discussion of this topic by reminding students of the discussion about proof that the Earth moves. One of the few proofs that we have is called a Foucault (foo-kōh) Pendulum. In this activity, students can see a miniature version they may have seen in a science museum (The Detroit Science Center has one).
2. Show the students a simple pendulum (example: a string and a weight hanging from a pencil). The weight goes back and forth once you start it moving. You can talk about inertia -- a body in motion tends to stay in motion. Ask why the pendulum eventually stops. Students may come up with friction, either with the air or with the string on the pencil.
3. If the Earth were moving, the pendulum wouldn’t keep swinging in the same direction. In the demonstration, the turntable represents the Earth. You don’t even need a turntable; you can show this by having a student hold it and slowly turn.
4. Follow this step up by showing a clip from a real Foucault pendulum so students can see that the pendulum does actually seem to change direction over a period of time. If the Earth weren’t moving, this would not happen! This website provides a good explanation: http://www.youtube.com/watch?v=aMxLVDuf4VY&feature=related and here is a time lapse pendulum: http://www.youtube.com/watch?v=b14l3-A8iUQ&feature=related.
* In 1851, Leon Foucault (1819-1868) was made famous when he devised an experiment with a pendulum that demonstrated the rotation of the Earth. Inside the dome of the Pantheon of Paris, he suspended an iron ball about one foot in diameter from a wire more than 200 feet long. The ball could easily swing back and forth more than 12 feet. Just under it, he built a circular ring on which he placed a ridge of sand. A pin attached to the ball would scrape sand away each time the ball passed by. The ball was drawn to the side and held in place by a cord until it was absolutely still. The cord was burned to start the pendulum swinging in a perfect plane. Swing after swing, the plane of the pendulum turned slowly because the floor of the Pantheon was moving under the pendulum. This was visible proof that Galileo was right. We will speak to Galileo’s proof of the moving earth in Cycle 3.

Explain Activity 7 –Testing Scientific Explanations of Earth’s Seasons Purpose To develop strong conceptual mastery of the cycles content, as students use scientific explanations in text and simulation software. Activity Description Students use text that describes the model that accounts for seasons and daylight hours, and they test ideas using interactive simulation software such as Starry Night. Focus Question How can we describe the causes of Earth’s seasons? Duration Two class periods. Materials
● http://www.windows2universe.org/the_universe/uts/seasons1.html ● Atlas URL: http://oaklandk12.rubiconatlas.org/public
Teacher Preparation
1. Have the web address handy for the students, or print out the article and the related links so they can read the material.
2. Load computers with a planetarium-type software, either freeware Stellarium or Starry Night. Classroom Procedure
1. Allow students time to familiarize themselves with Starry Night (or a free product Stellarium*) Stellarium for laptops use the windows choice at top of page http://www.stellarium.org/
Stellarium for iPads, iPhones, smart phones etc. information http://www.ifreeware.net/download-stellarium.html
2. Provide the article on seasons and have students read it over, making notes in the margins that summarize the ideas with pictures or paraphrases.
3. Have students bring the article to the software, and ask them to use Starry Night to validate the explanations in the article.
4. Instruct students to make a story board with sketches made from the images of Starry Night. Sketches should have annotations that provide sound explanations.
5. Have a whole class discussion where student share their annotations. Prompt students to critique one another’s annotations.

Explain Activity 8 – Interactive Lecture using Starry Night Purpose To develop a whole-class consensus on the key question and focus question. Activity Description Teacher presents all questions, instigates small to whole group discussions, and clarifies concepts through lecture and demonstration, having students using whiteboards for explanations and illustrations. Focus Question Cycle 1 focus questions:
● What is the path of the sun across the sky? ● Does the path of the sun ever change? ● What characteristics of the Earth and sun cause the seasons? ● How do we know the Earth is moving?
Duration: One or more class periods. Materials:
● Whiteboards ● PowerPoint, Starry Night, or Stellarium
Teacher Preparation Prepare sets of questions to ask and discussion prompts. Classroom Procedure Students use whiteboards and other illustration methods to discuss answers to the focus questions of this cycle. Extention: Bill Nye the Science Guy “Seasons” https://www.youtube.com/watch?v=XuJoh8gi05g

Elaborate Activity 9 – Time-lapse Photo Series of Sunrise/Sunset Purpose To allow students to use technology to illustrate what they’ve learned. Activity Description Students will take photos or sketch the sunrise or sunset once a week for eight weeks. Focus Question Does the position of sunrise or sunset change at all? Duration Ongoing, for 4-8 weeks. Materials Students can use cameras or cell phone to take pictures or they can sketch in their astronomy journals. Teacher Preparation None Classroom Procedure
1. Teacher explains project early in unit so students can have time to accomplish this project. 2. Students can use any technology they wish to create a photo/image journal of where the sun rises
and/or sets for a number of weeks.

Learning Cycle 2: The Earth - Moon - Sun System Introduction This portion of Unit 2 centers on three aspects of the Earth-Moon-Sun system: moon phases, eclipses, and tides. Like the previous cycle, it depends heavily on physical modeling and data analysis. HIGHLY RECOMMENDED Teachers may want to visit the following site before beginning the unit for a reflection of their own ideas and what student misconceptions may be. Site: http://www.learner.org/teacherslab/pup/surveys.html Learning Objectives Knowledge
● Describe the different phases of the moon. ● Explain the different kinds of eclipses and what causes them. ● Describe the causes of tides. ● Describe the amount of time for the moon cycle
Skills
● Identify the causes of moon phases. ● Correlate the moon phases with the tides on earth.
Key Question: How can observations from Earth (related to the moon and the sun) be explained using physical models?

Engage and Elicit Activity 1 – Direct Physical Modeling of Moon Phases Using the Sun Purpose To amaze students and elicit and record their thinking about moon phases. Activity Description This activity requires careful monitoring of the moon cycle and the weather because students will go outside during a daytime moon (a third-quarter, waning crescent moon), which can be seen in the morning, and throughout the afternoon to the west of the sun. Teachers should consult a moon calendar to select the first optimal day and time after school begins in September to conduct this activity. Focus Question Why can we see the moon in the daytime? Duration 10-15 minutes. Materials A cue ball or other whitish-grey smooth ball to represent the moon. Teacher Preparation Gather materials. Classroom Procedure
1. During a clear morning with a daytime moon, students go outside to make observations. Since many will be surprised to see a moon in the daytime, the activity begins with small and whole group discussions on how that can happen.
2. The teacher will produce a smooth hard ball (pool ball, painted wooded ball, or golf ball) and hold it up in the direction of the moon. Amazingly, the exact moon phase as evident on the moon will be replicated on the ball.
3. Elicit discussion about why students are seeing the moon while the sun is out.

Engage and Elicit Activity 2 – Sequencing Phases of the Moon Purpose To elicit student understanding about changes and causes in phases in the moon. Activity Description Students will sequence pictures of the moon’s phases in order from new moon to full moon and back to new moon. Focus Question What is the pattern of moon phases? Duration 15-20 minutes. Materials
● Classroom set of moon phases ● Whiteboards
Teacher Preparation Find or make a classroom set of pictures of the moon in all phases. Here is a good website: http://www.classbrain.com/artaskcb/publish/article_51.shtml. Classroom Procedure
1. Teacher gives sets of small photographs of the moon throughout its cycle to teams of two or three students to sequence in the correct order.
2. Have students whiteboard their pattern of moon phases. 3. Let students compare their order with other groups. 4. Encourage discussion about the order. As this is an elicitation activity, teachers should not correct
students when they mis-order the photos. Rather, the teacher should initiate a robust discussion and debate. Students should record their thoughts in their astronomy journals. Later in this cycle, students will have evidence from the physical models they explore, which will refine their thinking and reflect in their journals.

Explore Activity 3 –Creating a Moon Phase Log Purpose To have students actively look at the sky and observe and sketch moon phases. Activity Description Observing and recording moon phases throughout a cycle. This activity should begin with students observing the moon at a distinctive phase (full, quarter) and making predictions about its return. Focus Question How does the moon change through the month? Duration Ongoing, for at least four weeks. Materials Astronomy journals Teacher Preparation None. Classroom Procedure
1. Teacher explains the long-term project to students. 2. Students will begin drawing or photographing the moon at a distinctive phase, such as full moon or
first quarter. Look up the date of the full moon or first quarter at this website: http://aa.usno.navy.mil/data/docs/MoonPhase.php.
3. It is helpful to remind students about the project throughout the month, especially if it will be a clear night or if the moon will be up in the morning. It is also helpful to take them out during a morning phase (last quarter) to see the moon in the sky.
4. Make sure to have an ending deadline and to remind students of when their moon phase project is due. It cannot be left until the last moment.

Explore Activity 4 – Earth - Moon Distance Purpose Students will be able to state the size of and distance between Earth and the Moon and to demonstrate this relationship with spherical objects. Activity Description This activity helps students understand the size of and distance between Earth and the moon. Students work in pairs using different-sized spherical objects to represent Earth and the moon. They use the diameter of the objects to establish this scale. Printed materials are from the Annenberg Media Math and Science Project Teachers' Lab at http://www.learner.org/teacherslab/pup/earthmoon_print.html. Focus Question Ask students what size they think the moon is relative to Earth and how far away it is. Duration This activity requires one to two class periods. Materials
● A box containing spheres of differing diameters, such as softballs, golf balls, marbles, tennis balls, table tennis balls, and beads
● Small round balloons, not inflated (optional) ● Paper and pencil
Teacher Preparation
1. Explain that students will use spherical objects to represent the size of and the distance between Earth and the moon.
2. Be sure that students understand the term "diameter": the length of a straight line through the center of an object.
Classroom Procedure
1. Hand out the spheres (or the balloons) so each student has one object. 2. Tell students that the object (or balloon) they are holding can represent either Earth or the moon. Tell
them to find partners so they can make what they believe is an accurate scale model of Earth and the moon. (Students with balloons can blow them up to whatever size they think will accurately represent the size of Earth or the moon.)
3. Once each student has found a partner, look around to see how similar the pairings are. Did students pair correctly? (one earth and one moon)
4. Ask students how many moons they need to place in a straight line to equal the diameter of one Earth. After several guesses, tell the class that four moons laid in a straight line equal the diameter of one Earth. With this new information, have the students select different partners, pick other objects from the box, or adjust the size of their balloons until in each pairing four moon diameters equal one Earth diameter. (Suggest students use paper and pencils to mark a scale of the diameters.)

5. When each pair of students has the correct set of Earth and moon objects (you will need to check each pairing), have all the "Earths" line up in the front of the classroom. Ask them to lift their objects above their heads so that others can see them.
6. Have the "Moons" stand facing their partners. Tell the partners to separate the two objects until they believe they are accurately displaying the distance between Earth and the moon.
7. Have the students estimate how many of their Earth objects when laid in a straight line would be necessary to reach their moon object. Write their guesses on the board.
8. Tell students that 30 Earth objects laid in a straight line represent the actual distance between Earth and the moon. Have the partners separate their objects so that the distance between their Earth and moon objects is correct. Are they surprised?
9. Lead a class discussion in which students can express their new understandings about the moon's size and its distance from Earth. Then give students the opportunity to record their new understandings in their journal or, if they wish to be more creative, in a story, poem, or artwork.
Explore Activity 5 – Physical Model of Moon Phases 1 Purpose To physically model moon phases. Activity Description Students use materials for Boreal Lab with paper template for data collection for moon phases and eclipses. Focus Question What is the pattern of moon phases, and how do they occur? Duration One class period (45 minutes). Materials
● Boreal moon phase kit (from science supply stores) ● Alternatively, use a pool ball (painted yellow) for the sun, a smaller ball (rubber or bouncy ball) for
Earth (half green, half black), and a ping pong ball, (half white, half black) for the moon. Use bottle cap stabilizers to set them in so they stay still.
Teacher Preparation
1. Read instructions that come with kit, and put models in separate kit bags. 2. OR gather materials and make your own sets of the moon-sun-earth models. Large sheets of paper
(11x14) can be used to set them on, with a space for the sun at one end and the moon going around the earth on the other.
Classroom Procedure
1. Pass out kits to small groups: 3-4 students. 2. Have students set up their templates under their models. 3. Have students in groups come to a consensus about the positions of the Earth, moon, and sun for the
different phases of the moon: start with new moon, then waxing crescent, first quarter, waxing gibbous, then full. Continue with waning gibbous, last quarter, waning crescent, and back to new moon.
4. Have students fill in a chart drawn in their journals where they can sketch the positions of the sun, moon and earth, and label the phase of the moon.

Explore Activity 6 – Physical Modeling of Moon Phases 2 Purpose To physically model moon phases. Activity Description Use a lamp and a white ball (styrofoam, pool ball) to model moon phases and eclipses. Focus Question What is the pattern of moon phases, and how do they occur? Duration One class period (45 minutes).
Materials
● A bright lamp ● Smooth, small balls (pool balls are excellent). ● Styrofoam balls are acceptable, but very rough.
Teacher Preparation Gather materials:
● This website is helpful in explaining this activity. http://www.jpl.nasa.gov/education/index.cfm?page=123
● Teachers can also use this resource: http://www.learner.org/teacherslab/pup/index.html Classroom Procedure
1. Use the lamp as the sun and have students hold their “moons” in front of them. 2. Model the different phases of the moon. In order to properly model new and full moon, students will
hold their “moons” either under or over the plane of the Earth-sun orbit (basically out of the shadow of their head).
3. Have students draw and label the different phases in their astronomy journals. Make sure they can draw what the moon looks like, as well as its position relative to the Earth and sun.
4. It would be helpful to have the students say in words why the moon goes through phases. They may have difficulty with the description, but it is important to aid in their understanding. Preconceptions about the causes of moon phases are very difficult to modify. Try to avoid the use of the word “shadow” when describing phases, as students often think that moon phases are caused by Earth’s shadow. Save the word for discussion of eclipses.
Explore Activity 7 – Analyzing Dramatic Tides and Tidal Data Purpose To analyze actual data on tides and the moon, and have students make connections between them.

Activity Description In this activity, students will use five days of actual ocean tidal data from Boothbay Harbor, Maine and compare it to observations of the moon at the same times of day. Focus Question People have noticed a regular pattern to ocean tides, just as there is a regular pattern of moon phases. Do they relate to each other? If so, how? Duration One class period (45 minutes). Materials
● Astronomy Journals ● Graphing program or graph paper ● Tide data, moon data
Teacher Preparation
● Have a graphing program or graph paper available. ● Have copies of the moon/tide data available.
Classroom Procedure Part 1: Tide Patterns
1. On the next page is a data table of ocean tide and moon data. Have students make a graph that has Time in hours along the x-axis. It should range from 0-130. Have them make the y-axis Water Depth in feet. It should range from 0-14. Plot the tide data (the two columns in blue) on the graph. Connect all the data points.
2. Using the graphs and data tables, discuss these questions: ● Do tides happen at the same time each day? ● How many low tides are there per day? ● How many high tides are there per day? ● How many hours between a low tide and the next high tide? ● How many hours between two high tides? ● Is a low tide (or a high tide) always at the same water depth? ● What other patterns do you notice in the tides?
Part 2: Moon Patterns
1. Have students use the data table to add the positions of the moon to their graphs. Using a different color or symbols, have students plot the moon’s position as either 0 or 12 for each time listed (these are the numbers in the green columns). A “0” means the Moon is either rising or setting so it is at the horizon. A “12” means the moon is at its highest position in the sky.
2. Connect all the data points. 3. Using the graphs and data tables, discuss these questions: ● Does the moon rise at the same time each day? Does it set at the same times? ● Is the moon ever visible in the daytime sky during this period of days? ● When the moon is at the horizon (either rising or setting), what do you notice about the tides?

● When the moon is at its highest point, what do you notice about the tides? ● Does there seem to be a relationship between the moon’s position in the sky and the tides? If so,
how would you describe it? ● Every day, there seems to be one high tide when the moon cannot be seen in the sky. Where is the
moon when this high tide is happening?
Date Tide Time Water depth (ft)
Hours Moon Time Hours Moon's Position
15 Low 1:00 AM 3.3 1 15 High 7:21 AM 10.9 7.3 15 Low 1:48 PM 2.4 13.8 rise 2:28pm 12.5 0 15 High 8:07 PM 10.1 20.1 high 7:29pm 17.5 12 16 Low 2:04 AM 2.8 26.1 set 12:31am 24.5 0 16 High 8:24 AM 11.4 32.4 16 Low 2:47 PM 1.9 38.8 rise 2:55pm 38.9 0 16 High 9:04 PM 10.8 45.1 high 8:13pm 44.2 12 17 Low 3:05 AM 2.1 51.1 set 1:33am 49.6 0 17 High 9:23 AM 11.9 57.4 17 Low 3:41 PM 1.3 63.7 rise 3:18pm 63.3 0 17 High 9:57 PM 11.6 70 high 8:55pm 68.9 12

18 Low 4:01 AM 1.4 76 set 2:34am 74.6 0 18 High 10:18 AM 12.4 82.3 18 Low 4:31 PM 0.8 88.5 rise 3:40pm 87.7 0 18 High 10:47 PM 12.3 94.8 high 9:36pm 93.6 12 19 Low 4:54 AM 0.7 100.9 set 3:34am 99.6 0 19 High 11:11 AM 12.8 107.2 19 Low 5:20 PM 0.5 113.3 rise 4:00pm 112 0 19 High 11:35 PM 12.9 119.6 high 10:16pm 118.3 12 20 Low 5:46 AM 0.3 125.8 set 4:35am 124.6 0
Going Further The moon’s position in the sky does not exactly agree with high and low tides. Ask students if they can think of some reasons for this? Many cities do not show the same pattern of tides as Boothbay Harbor. What other factors besides the moon may affect the pattern of the tides? During these days (15-20 October 2010), the moon was a waxing gibbous. Full moon occurred on October 22. What do students notice about the tidal patterns as the moon was getting closer to full phase?

Explain Activity 8 – Testing Scientific Explanations of Earth’s Seasons Purpose To develop strong conceptual mastery of the cycles content, as students use scientific explanations in text and simulation software. Activity Description Students read text that describes the model that accounts for Earth’s seasons and they illustrate it with their own images and explanations. Focus Question How can Earth’s seasons be illustrated? Duration Two class periods. Materials
● Articles on seasons (several websites below): http://www.learninghaven.com/science/articles/seasons.htm http://imagine.gsfc.nasa.gov/docs/ask_astro/answers/980211f.html http://www.windows2universe.org/the_universe/uts/seasons3.html
● Whiteboards or some other form of illustration Teacher Preparation
1. Have articles available to students either printed or on computers. 2. Have whiteboards available or other means of illustration.
Classroom Procedure
1. Teacher passes out article on seasons or has it available through media. 2. Students read the text and in small collaborative groups come up with illustrations or models to
explain the seasons on Earth. 3. Students and teachers give feedback to enable class to come to a consensus about the explanations
and answers to focus questions.

Explain Activity 9 – The Reasons for the Seasons Web Quest Purpose To reinforce student knowledge about seasons. Activity Description Students read text and see images on a website. Focus Question Can we identify the position of the Earth around the sun and know the seasons by its tilt? Duration One class period.
● Materials Website link for the webquest: http://www.nationalgeographic.com/xpeditions/activities/07/season.html
● Moon phases images http://visual.merriam-webster.com/astronomy/celestial-bodies/moon/phases-moon.php
Teacher Preparation
1. Have computers available for students. Classroom Procedure

After students go to the website and read the text, have them answer these questions in their journals: ● What did the Greeks think the seasons were caused by? ● What did the ancient Navaho Indians think caused the seasons? ● What are two changes on Earth caused by the tilt of Earth’s axis? ● What is the summer solstice? ● What is the winter solstice? ● What are the equinoxes? ● How did you do on the cosmic map activity?
Bill Nye the Science Guy “Moon Phases” http://www.youtube.com/watch?v=qFtFHwyS0mQ

Elaborate Activity 10 – Create Annotated Photo Series on Past Month’s Moon Cycle. Purpose To create a predictive project on the moon’s cycle. Activity Description Discuss and explain the prediction of when the moon returned to its prior phase. Use a real world audience to convey findings. Focus Question How can we illustrate and predict the phases of the moon? Duration One class period (45 minutes) for work, and one class period or more for presentations. Materials
● Computers ● Images of the moon phases ● Any other image technology such as Elmos (document camera)
Teacher Preparation
1. Provide students with moon phase images. Classroom Procedure
1. As a one-day or more project, students will put together a photo journal of the moon’s phases, starting with one phase and predicting when that phase will be seen again, or start with today’s phase and work back to when that phase was seen last.
2. Students will use images and explanations to present to the class their evidence of their prediction. 3. Teacher may want to have students work in collaborative groups.

Learning Cycle 3: Objects and Motion in the Solar System Introduction This cycle explores the nuts and bolts of the solar system: what it contains, how it moves, what informs the movement. Students will use physical models to explore the size and distance and motions of the planets. Students also use physical models to explore the ideas of gravity and inertia as the shapers of these motions. Many students have preconceptions about gravity and inertia, so the activities connected to these ideas use physical models to help students internalize these ideas. Learning Objectives Knowledge
1. Describe the characteristics of the planets close to the sun. 2. Describe the characteristics of the planets farthest from the sun. 3. Describe the motions of the planets around the sun
Skills
1. Identify the forces that keep the planets in motion around the sun. Key Question: What are the characteristics of the planets and what is their motion?

Engage and Elicit Activity 1 – Grouping Planets by Characteristics Purpose To differentiate between two (or three) different types of planets. Activity Description Using photographs of the planets or scale size models, students will divide the planets into logical groups. Focus Question What are similar and different characteristics of the planets? Duration One class period. Materials
● Scaled images of the planets Link 1 https://planetary.s3.amazonaws.com/assets/images/z_changeover/scale-solar-system-for-powerpoint-widescreen1920-planetsonly.jpg Link 2 http://btc.montana.edu/ceres/html/PlanetSizes/images/solars0.gif Link 3 http://btc.montana.edu/ceres/html/PlanetSizes/images/saturn0.gif ● Journals
Teacher Preparation
1. Have materials ready for students. Classroom Procedure
1. Have small groups of students try to classify the planets into two main types. 2. If you want, include the dwarf planets like Pluto, Sedna, Quaoar and others for students to classify. 3. When students have made their choices, have a class discussion to come to a consensus. 4. Have the students answer these questions in their journals: ● What might cause the small, rocky planets to form close to the sun, and the big, gassy giant
planets form far from the sun? ● What is the difference between rocks and gas? ● Do you think it is a coincidence that the small, dense, rocky planets formed near the sun, and the
big, fluffy, gas giant planets formed far from the sun? ● If you see a pattern, what is it? ● What about the dwarf planets? They are cold, small and icy. Do you think they would form close
or far from the sun? ● The first four planets are Terrestrial planets, named after Terra or Earth. The second four planets
were named Jovian, after Jupiter or Jove to the Romans. So we have Terrestrial planets close to the sun and Jovian planets far from the sun.
● If we discovered a new planet between Venus and Mercury, which would it be?

5. If we discovered a new planet beyond the orbit of Neptune, what would it be, most likely?

Explore Activity 2a – The Dance of the Planets Purpose Modeling motion of the planets around the sun. Activity Description Students will model the motion of the planets around the sun by using different paths around the center of a circle. Focus Question Do the planets go around the sun in the same amount of time? Which take longer? Duration 15 minutes – together with Part Two, it can take a class period with travel and set-up time. Materials Three ropes, somewhat different in length, to make three concentric circles. You can also use sidewalk chalk outside to draw circles. (Slightly elliptical) Teacher Preparation Gather the ropes or mark the sidewalk, using chalk. Classroom Procedure
1. Choose three students to represent three planets. The one in the middle can be Earth, the one closer to the center either Venus or Mercury, and the one further out can be Mars. They will all start on the same “starting line.”
2. On teacher command, each student takes one step. Then another, and another. 3. Students notice that some “planets” go around the sun in fewer steps than others. Their observations
can lead to a discussion of relative motion: RxT=D. 4. Students can answer the following questions in their journals: ● Which planet took longest to go around the “sun”? ● Which planet took the shortest amount of time? ● Which planet in the solar system do you think has the longest path to orbit the sun? ● If the planets were all going the same speed (they are not), and all had different lengths to travel
(which they do), what happens to the amount of time it takes to go around the sun? Does it depend on their orbit? How?

Explore Activity 2b – The Pull of the Sun Purpose Modeling motion of the planets around the sun. Activity Description Students will model the motion of the planets around the sun by using different lengths of rope. Focus Question What is the motion of the planets around the sun? What shapes this motion? Duration 15 minutes. Materials Eight ropes, all different in length, to make a representative solar system. You may use jump ropes tied together for the longer lengths. Teacher Preparation
1. Gather the ropes.
Classroom Procedure 1. Have eight students volunteer to be the planets. One student can be the sun. The rest of the students
can be the stars in a circle around the solar system. 2. Each student “planet” will take a position at the end of the rope; the sun will hold the other end. The
sun will end up holding the ends of eight ropes, and each “planet” will be holding one rope. 3. The planets spread out at different distances so they are holding the end of the rope. They can all start
in a line, and start walking. If they start with the ropes in front of them but behind the planets closer to the sun, they won’t get tangled.
4. After a few steps, it should become clear that the farther-away planets will start to fall behind. They have a longer distance to travel, and this point should become clear to students.
5. Students should work in their astronomy journals to describe what they discovered from this activity. 6. Students can answer the following questions in their journal: ● Which planets have the longest year? Why? ● Which planets have the shortest year? Why? ● Does it seem likely that the planets will ever end up in a straight line from the sun? Why or why
not? ● What do the ropes represent in this activity? What would happen to the planets if there were no
ropes? ● What would happen to the planets if they were not “walking” and only the ropes were pulling
them?

Explore Activity 3 – How Far to the Planets? Purpose To physically model the scales of the solar system, either size, distance, or travel time. Activity Description Students will use data and physical objects to model the distances to the planets. Focus Question How far away are the planets from the sun? Duration One class period (45 minutes) or the remainder of the period after Activity 3a. Materials
● Pictures of the planets Link http://www.sciencekids.co.nz/pictures/space.html
● A large model of the sun (a sphere) ● Tape measure ● Flags or stakes if you go outside
Teacher Preparation 1. Once you know the scaling factors, you can use many objects to come up with a solar system scale
activity. 2. You can use: toilet paper rolls, adding machine rolls, paper towel rolls, gym floors, football fields
(especially effective), and even time scales (how long it takes to get to the planets traveling at the speed of a rocket or the speed of light).
Classroom Procedure
1. Use the scaling data to come up with a way to make a distance scale of the planets. If possible, use a football field -- it is especially effective to have the students stand on the different yard lines and hold a picture of their planet.
2. If possible, have students predict where they think the planets will be by standing at different distances from the sun before they actually see the scale of the solar system.

Scaling Data For our scale, we'll choose the round number of 1: 6,000,000,000. Thus, in pacing between the planets, 1 meter (pace) represents 6,000,000 kilometers. In the sizes of the bodies, 1 centimeter represents 60,000 kilometers.
km m cm
Diameter of sun 1,400,000 23 (ball)
Distance from sun to Mercury
58,000,000 10
Diameter of Mercury 5,000 0.08 (pinhead)
Distance from orbit of Mercury to Venus
50,000,000 8
Diameter of Venus 12,000 0.20 (peppercorn)
Distance from orbit of Venus to Earth
41,000,000 7
Diameter of Earth 13,000 0.20 (peppercorn)
Distance from orbit of Earth to Mars
78,000,000 13
Diameter of Mars 7,000 0.10 (pinhead)
Distance from orbit of Mars to Jupiter
550,000,000 92
Diameter of Jupiter 143,000 2.40 (chestnut)
Distance from orbit of Jupiter to Saturn
649,000,000 108
Diameter of Saturn 120,00 2.00 (filbert)
Distance from orbit of Saturn to Uranus
1,443,000,000 240
Diameter of Uranus 51,000 0.90 (peanut)
Distance from orbit of Uranus to Neptune
1,627,000,000 271

Diameter of Neptune 49,000 0.80 (peanut)
Distance from orbit of Neptune to Pluto
1,404,000,000 234
Diameter of Pluto 2,300 0.04 (pinhead)
Total of distances 5,900,000,000 983
Distance from Earth to moon
384,000 6.40
Diameter of moon 3,500 0.06 (pinhead)

Explore Activity 4 – Scaling Size of the Planets Purpose To gain an understanding of the size differences in our solar system. Activity Description Students will use clay to make lumps in the scale of the planets sizes. Focus Question How do the sizes of the planets compare? Duration One class period, 45 minutes. Materials
● Sets of eight cards named for the planets ● Sets of clay balls – about the size of an adult fist
Teacher Preparation
1. Acquire enough clay for the activity. Groups of 3-4 will work well. 2. Make eight cards, each with a different planet’s name on it for each group.
Classroom Procedure Students can work in small groups, taking turns dividing the clay.
1. Divide the clay into ten equal pieces. 2. Put six lumps on the Jupiter card. 3. Put three lumps on the Saturn card. 4. Divide the remaining lump into ten equal pieces. 5. Put five of these on the Saturn card. 6. Put two of them on the Neptune card. 7. Put two on the Uranus card. 8. Divide the last piece into four equal pieces. 9. Put three of these on the Saturn card. 10. Divide the last piece into five equal pieces. 11. Put two pieces on the Uranus card. 12. Put one piece on the Earth card. 13. Put one piece on the Venus card. 14. Divide the remaining piece into ten equal pieces. 15. Put four pieces on the Neptune card. 16. Put four pieces on the Uranus card. 17. Put one piece on the Mars card. 18. Divide the remaining piece into ten equal pieces. 19. Put six pieces on the Mercury card. 20. Put three pieces on the Uranus card. 21. Put the last piece on the Mars card.

22. Now, form all the lumps on each card into a ball. Those are the relative sizes of the planets. Any surprises?

Explain Activity 5 – Testing Scientific Explanations of Planet Motions Purpose To develop strong conceptual mastery of the cycles content, as student finds the relationship between a planet’s orbit time and its distance from the sun. Activity Description Students will plot the distances and orbit times of the planets on a graph. Focus Question What is the relationship between a planet’s distance from the sun and how long it takes to orbit? Duration One class period (45 minutes). Materials
● Numerical data ● Graphing program like Excel or Notebook ● Calculator
Teacher Preparation
1. Teacher may want to give a little historical background of Johannes Kepler and his struggle to discover a relationship between a planet’s motion and its distance from the sun. This website gives good background on this topic: http://www-istp.gsfc.nasa.gov/stargaze/Skeplaws.htm.
2. This website gives a good description of the relationship and has an image of the graph students should replicate: http://www.windows2universe.org/the_universe/uts/kepler3.html.
Classroom Procedure As a graphing exercise, have students graph the distance from the sun vs. period of orbit. These numbers have already been linearized. The relationship is period squared equals the distance cubed. If students understand squared and cubed relationships, you can talk about this. The scale will have to be discussed as well; increments are in powers of ten. Students will discover what it took years for Kepler to discover.

Data: Planet Semi-major axis
cubed (AU) Period squared (years)
Mercury
.058 .058
Venus
.378 .378
Earth
1.00 1.00
Mars
3.58 3.53
Jupiter
140.6 141.6
Saturn
868.3 870.25
Uranus
7066.8 7056
Neptune
27271 27160

Explain Activity 6 – Solar System Presentation Purpose To allow students to show what they know, they will present information in a project format. Activity Description Students will give presentation projects on the Planets. Focus Question What are some characteristics of each planet in the solar system? Duration One class period (45 minutes). Materials
● Computer access in teams to the following website: http://www.bbc.co.uk/science/space/solarsystem/
Teacher Preparation 1. Review and prepare materials from BBC website: http://www.bbc.co.uk/science/space/solarsystem/
Classroom Procedure
1. Teacher introduces website, rubric and project to students. 2. Teacher assigns planets to teams of students. 3. Students use images from website but develop text in a PowerPoint presentation. 4. Students present in small teams. 5. Teacher grades student projects on a rubric.
Bill Nye the Science Guy “Space” http://www.youtube.com/watch?v=a47GU14I_ak Bill Nye the Science Guy “Planets” http://www.youtube.com/watch?v=grYRIyzZ1bw

Elaborate Activity 7 – Your Weight on Other Worlds Purpose To give students an idea of weight as a result of gravitational force. Activity Description Students explore their weights on other planets. Focus Question Does your weight change on other planets? Duration 15-20 minutes. Materials
● Exploratorium website: http://www.exploratorium.edu/ronh/weight/ ● Worksheet from the website:
http://www.teachervision.fen.com/planets/lesson-plan/353.html Teacher Preparation
1. Practice navigating Exploratorium website. 2. Prepare worksheet for use with students.
Classroom Procedure
1. Teacher passes out worksheet found at http://www.teachervision.fen.com/planets/lesson-plan/353.html2.
2. Students fill in their weights on other worlds.
Elaborate

Activity 8 – Lunch in Outer Space 5th Grade Earth Science Engineering Task ‘Lunch in Outer Space’ link http://www.teachengineering.org/view_activity.php?url=collection/cub_/activities/cub_human/cub_human_lesson04_activity1.xml Summary Students learn about the unique challenges astronauts face while eating in outer space. They explore different food choices and food packaging. Students learn about the engineering design process, and then, as NASA engineering teams, they design and build original model devices to help astronauts eat in a microgravity environment --- their own creative devices for food storage and meal preparation. Engineering Connection
Relating science and/or math concept(s) to engineering Engineers are involved in all aspects of space travel and living. Many astronauts are engineers! Because of the microgravity environment, eating in space is a great challenge, so NASA engineers develop creative devices to help astronauts eat while traveling in away from the Earth's gravity.
Administer the
Unit Posttest
Compare results to Pretest.

Earth Science Benchmark Post-Test - Grade 5 Multiple Choice Circle all of the answers that complete the statement or answer the question (more than one answer is possible). 1. Why does the Earth experience seasons? (Choose all that apply)
a. The Earth is tilted on its axis b. The Sun is hotter in the Spring and Summer c. The Earth gets less sun in the Fall and Winter d. The angle of sunlight hitting the Earth changes
2. The Earth takes 365.25 days to orbit the Sun. Which of the following is a result of this fact? (Choose all that apply)
a. Leap Years are years when February 29th is added to the calendar. b. February has 28 days instead of 30. c. An extra day is added every four years. d. All calendars have 365 days
3. What type of path does Mars take when orbiting the sun? (Choose the best answer) Draw it’s orbit on the model and show the shape and direction arrows.
a. Clockwise – circular path b. Clockwise – elliptical path c. Counter clockwise – circular path d. Counter clockwise – elliptical path
4. The majority of Asteroids are found in the Kuiper Belt. Which other facts are also true about Asteroids? (Choose all that apply)
a. Are located between Earth and Mars b. Are made of dirty ice and leave a trail c. Are located between Mars and Jupiter d. Are rocks caught in Sun’s gravitational pull and orbit the Sun

5. What keeps the Earth in its orbit? (Choose the best answer) a. The speed of the Sun’s rotation b. The Sun’s gravitational pull c. The direction of the Earth’s rotation d. The Earth’s location between other planets 6. A year on Jupiter is 4,333 days long. A year on Mercury is 88 days long. Why are the lengths of the years on these planets different? (Choose the best answer) a. A year is longer on larger planets. b. Each planet has its own orbital period. c. Some planets are larger than other planets. d. Planets exert a gravitational force on other planets. 7. What causes the phases of the Moon? (Choose the best answer) a. The Moon’s tilt on its axis b. The Earth’s shadow on the Moon c. The relative positions of the Moon and the Earth d. The pull of gravity between the Moon and the Earth 8. When standing on the Earth, the Moon and Sun appear to move in the sky from East to West. What is responsible for this apparent movement? (Choose the best answer) a. The Earth revolves around the Sun. b. The Earth rotates counter clockwise. c. The Moon and Sun rotate on their axis. d. The Sun and Moon move from East to West in Space. 9. Why would a person standing on the Moon be able to see the Earth? (Choose the best answer) a. The Moon produces light. b. The Moon is close to the Earth. c. Sunlight reflects off the Earth. d. The Earth is bigger than the moon. 10. Why do we always see the same side of the Moon from Earth? (Choose the best answer) a. The Earth is tilted on its axis. b. The light is blocked by the Earth. c. The moon rotates and revolves at exactly the same rate as the Earth. d. The Earth’s Southern Hemisphere sees the other side of the moon.

The diagrams below represent relative positions of the Earth, Moon and Sun at different times.
11. Which of diagrams above represents a solar eclipse? A lunar eclipse?
Solar Eclipse ______________________
Lunar Eclipse ______________________
The chart below contains data on planets of the Solar System
Planet Diameter Average Period of Average Distance
(kilometers) Orbital Speed Rotation from (km/sec) (Earth days) the Sun (kilometers) Mercury 4,878 47.9 59 58,000,000
Mars 6,794 24.1 1.03 228,000,000 X 12,104 35.0 243 108,000,000
Jupiter 142,800 13.0 0.47 778,000,000 Earth 12,756 29.0 1 150,000,000
12. Based on the chart above, what is the real name of planet X? (Choose the best answer)
a. Neptune b. Pluto c. Saturn d. Venus
13. Which of the following is supported by evidence in the chart above? (Choose the best answer)
a. The larger a planet is, the slower it rotates. b. The faster a planet rotates, the faster it orbits. c. The closer a planet is to the Sun, the faster it orbits. d. The larger a planet is, the larger it’s gravitational pull.

14. The diagram below represents the Sun and planets of our solar system Which planet on the above diagram represents Earth? (Choose the best answer) a. G b. H c. K d. L 15. The diagram below represents the Earth. Label the point that shows the hemisphere that is experience the season winter on the diagram.
North Pole
A
Earth
B
Sunlight
Equator
16. During summer camp you went out at night and studied the night sky. Now that you are back home and in school, you want to continue to look for your favorite constellations but you can’ t find them. Which of the following explains why you are having this problem? (Choose the best answer) a. The Earth has changed position in its orbit. b. The Moon is blocking your view. c. The Sun’s light is not being reflected. d. The Constellation has moved its location. 17. In Michigan we have more hours of daylight in the summer than in the winter. What would you experience if you lived in a country at the Earth’s Equator? (Choose the best answer) a. The same hours of daylight all year long. b. The most hours of daylight in the summer. c. The most hours of daylight in the winter. d. The most hours of daylight in the spring and fall.

Oakland Schools Science Scope
Earth Science Grade 5 The Dynamics of the Solar System 66
Constructed Response 18. Explain what causes high and low tide cycles in the oceans. Include the following in your answer. 1. How many high and low tide cycles occur every day. 2. Why don’t they happen at the same time every day? 19. You want to make an accurate model of the solar system that will fit in your classroom for a school science project. 1. Explain why this will be difficult to do. 2. How will you solve this problem? 20. Compare Comets to Asteroids. List one way they are alike and one way they are different.

Oakland Schools Science Scope
Earth Science Grade 5 The Dynamics of the Solar System 67
Earth Science Benchmark Post-‐Test 5th Grade Answer Document
Earth Science Benchmark Post-‐Test 5th Grade Answer Document
Question Points & Correct Answer(s)
& Standard
DOK Level
1 2 A, D E.ES.05.61 DOK 1
2 2 A, C E.ES.05.62 DOK 1
3 3 D, arrows should be in a counter clockwise motion in a slightly elliptical shape. E.ST.05.11 DOK 2
4 2 C, D E.ST.05.11 DOK 1
5 1 B E.ST.05.21 DOK 1
6 1 B E.ST.05.21 DOK 2
7 1 C E.ST.05.22 DOK 2
8 1 B E.ST.05.23 DOK 1
9 1 C E.ST.05.11 DOK 2
10 1 C E.ST.05.22 DOK 1
11 2 Solar Eclipse -‐ C, Lunar Eclipse -‐ A E.ST.05.24 DOK 1
12 1 D E.ST.05.11 DOK 1
13 1 C S.RS.05.13 DOK 2
14 1 B E.ST.05.11 DOK 1
15 1 A -‐ Winter E.ES.05.61 DOK 2
16 1 A E.ST.05.23 DOK 2
17 1 A E.ES.05.61 DOK 2

Oakland Schools Science Scope
Earth Science Grade 5 The Dynamics of the Solar System 68
1. The moon's pull of gravity on the side of the Earth facing the moon makes
waters of the oceans on that side bulge out toward the moon. This bulge is
called a high tide. At the same time, another high tide is formed on the
opposite side because this is the furthest point from the moon, where
gravitational pull is the weakest on the Earth. The water that is drawn in to 18 3 make the bulge at these two points comes from the remaining water at the
E.ST.05.25 opposite points on Earth. These lower levels are called law tides. DOK 2
2. Because of the Earth's rotation every 24 hours, the Earth has two high tides
and two low tides every 24 hours at different points on Earth.
3. Because the moon rises about 50 minutes later each day, the high tide and
low tide times change each day.
1. It is not possible to make a model that represents both accurate sizes and
distance that will fit in a classroom.
2. Create either a model that shows only sizes or one that shows scaled 19 2 distance. Or make the model outside for students to see. S.IP.05.13 DOK 3
2 points -‐ includes both problem and solution.
1 point -‐ explains problem
0 points -‐ neither problem nor solution explained
20 Alike -‐ Orit the sun: part of our solar system. Different -‐ 2
E.ST.05.11 Comets are made of ice; Asteroids are made of rock DOK 2
Total Points
30