Oak Park Public Schools District 97 - Amazon Web Services€¦ · Measures of Academic Progress ......
18
Oak Park Public Schools District 97 Oak Park, Illinois 2012 STATE SCHOOL REPORT CARD Julian School
Transcript of Oak Park Public Schools District 97 - Amazon Web Services€¦ · Measures of Academic Progress ......

Oak Park Public Schools District 97 Oak Park, Illinois
2012 STATE SCHOOL REPORT CARD
Julian School

Percy Julian Middle School 416 South Ridgeland Avenue • Oak Park, Illinois • 60302
708-524-3040 • Fax 708-524-3035
Todd T. Fitzgerald, Principal
October 2012
Dear Parent/Guardian,
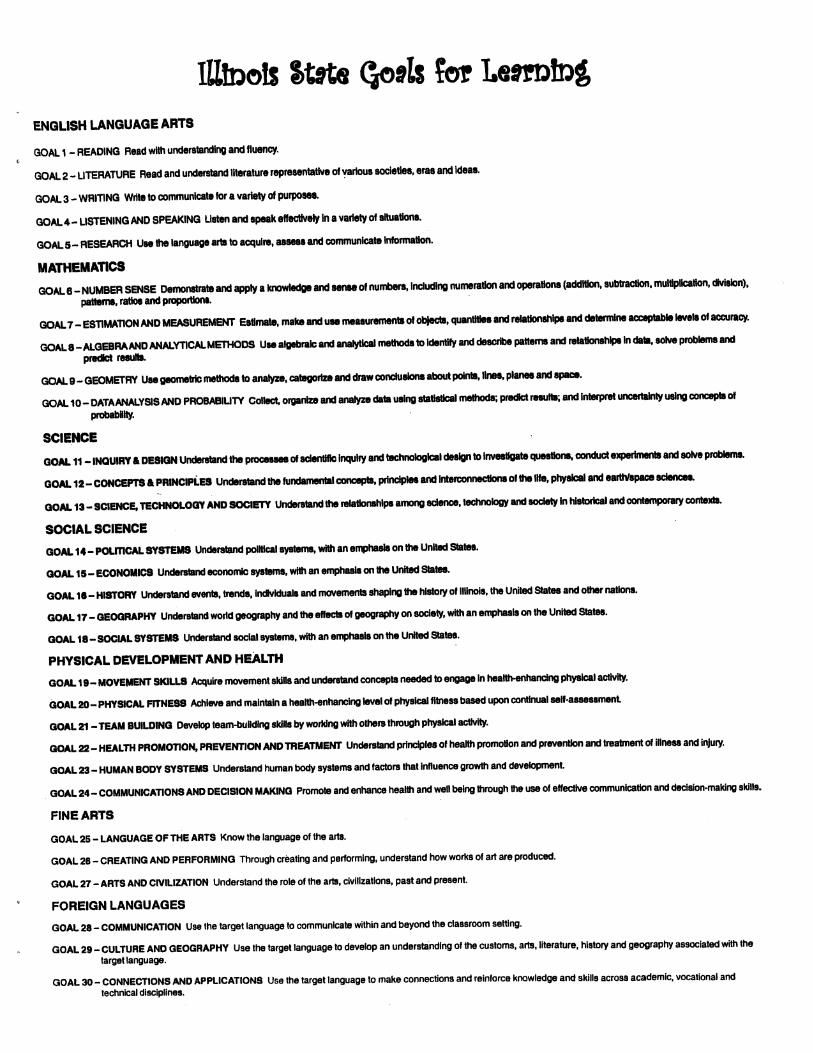
Each year students across the state are required to complete the Illinois Standard Achievement Tests
(ISAT). These assessments are administered for the purpose of evaluating district and school growth.
Tests in reading and mathematics are given to all sixth, seventh, and eighth grade students. In addition,
seventh grade students are assessed in science.
ISATs are one of several measures that assist us in determining the academic needs of our students. In
addition to these standardized tests, classroom assessments are also an integral part of program
evaluation. Measures of Academic Progress (MAP) tests for reading and math are also administered three
times a year and provide important information regarding student academic progress. Analysis of this
data guides us as we implement additional changes to improve student achievement.
Given our goal of continuous progress, we are in the process of implementing a number of initiatives here
at Julian. Teachers are working on developing a curriculum that is aligned with the Common Core State
Standards. These standards are being adopted by most states in our country. We have also started work
toward implementing the International Baccalaureate program. We are confident that these initiatives
will result in improved student achievement. A variety of academic interventions, including Fast
Forward, Read 180, and SLANT, are being used to provide additional support for our students. We
continue to focus on best practice as related to instructional strategies in order to provide our students
with optimal learning opportunities.
Our goal is to ensure that every child is well prepared for a lifetime of learning and future success.
Sincerely,
Todd T. Fitzgerald Todd T. Fitzgerald
Principal
Be Responsible, Be Respectful, Be Caring of Others

Percy Julian Middle School 106-016-0970-02-1004
6 7 8
Percy Julian Middle School
13.718.9
181.411.615.6
21.522.4
16.315.9
15.715.2
95.3
99.9
100.0
2,066,69294.413.19.449.00.34.223.618.051.0
5,62595.54.51.721.00.14.65.223.057.3
88795.13.20.526.30.03.24.330.453.1
Oak Park, ILLINOIS
GRADES :
--------
State and federal laws require public school districts to release report cards to the public each year.
RACIAL/ETHNIC BACKGROUND AND OTHER INFORMATION
White Black Hispanic AsianAmerican
Indian
PercentLow-
Income
PercentLimited-English-
Proficient
High Sch.
DropoutRate
ChronicTruancy
Rate
MobilityRate
Attendance Rate
TotalEnrollment
School
District
State
Limited-English-proficient students are those students eligible for transitional bilingual programs.Mobility rate is based on the number of times students enroll in or leave a school during the school year.Chronic truants are students who are absent from school without valid cause for 9 or more of the last 180 school days. Total Enrollment is based on Home School.
Low-income students come from families receiving public aid; live in institutions for neglected or delinquent children; are supported in foster homes with public funds; or are eligible to receive free or reduced-price lunches.IEP Students are those students eligible to receive special education services.
STUDENT-TO-STAFF RATIOS
AVERAGE CLASS SIZE (as of the first school day in May)
PARENTAL CONTACT*
1 3 6 8 9 - 12
Pupil-Administrator
Pupil-Certified
Staff
Pupil-Teacher
Secondary
Pupil-Teacher
ElementaryPercent
School
District
State
K
* Parental contact includes parent-teacher conferences, parental visits to school, school visits to home, telephone conversations, and written correspondence.
205.0
ILLINOISSCHOOLREPORTCARD
STUDENTS
INSTRUCTIONAL SETTING
Oak Park ESD 97
0.3
0.1
8.6
2012
Two or More Races
9.0
9.7
2.8
7542
State
District
School 16.8
18.0
21.3
Grades
School
Starting in 2009, charter school information is included in district statistics.
Percent IEP
18.7
15.5
13.6
Native Hawaiian /Pacific Islander
0.0
0.0
0.1
Grades 3 6 8 3 6 8 3 6 8
Mathematics Science English/Language Arts
State
District
School 50 50 50 50 50 50
50 50 50 50 50 50
56 54 44 46 103 92
TIME DEVOTED TO TEACHING CORE SUBJECTS (Minutes Per Day)
3 6 8
Social Science
50 50
50 50
43 44

Percy Julian Middle School 206-016-0970-02-1004
State
District
Asian
TotalNumberFemale Male
American IndianHispanicBlackWhite
TEACHER INFORMATION (Full-Time Equivalents)
78.6 12.4 3.7 2.7 0.2 21.1 78.9 403
83.3 7.1 5.3 1.3 0.2 23.1 76.9 127,830
Two or More Races Unknown
2.0
0.8
0.0
2.00.1
0.2
Native Hawaiian/
Pacific islander
State
% of Teachers withEmergency or
ProvisionalCredentials
% ofTeachers
with Master's & Above
% ofTeachers
withBachelor's
Degrees
% ofClasses NotTaught by
Highly QualifiedTeachers
District
AverageTeaching
Experience(Years)
School -- -- --
TEACHER INFORMATION ( Continued )
12.2 25.9 74.1 0.0 0.0
12.9 37.8 61.7 0.6 0.7
0.0 0.0
SCHOOL DISTRICT FINANCES
Some teacher/administrator data are not collected at the school level.
Salaries and counts of staff are summed across a district based on the percentage of time that each individual is employed as a teacher or an administrator and may or may not reflect the actual paid salaries for the district.
TEACHER/ADMINISTRATOR SALARIES (Full-Time Equivalents)
Average Teacher Salary Average Administrator Salary
State
District
$0
$40,000
$80,000
$120,000
$160,000
$200,000
$70,302 $66,614
$120,155$110,870
EXPENDITURE BY FUNCTION 2010-11 (Percentages)
0.0
10.0
20.0
30.0
40.0
50.0
60.052.1
48.3
2.4 3.3
32.4 30.7
13.217.7
Instruction General Administration
Supporting Services
Other Expenditures
District
State

Percy Julian Middle School 306-016-0970-02-1004
REVENUE BY SOURCE 2010-11
State %District %District
TOTAL
Federal Funding
Other State Funding
General State Aid
Other Local Funding
Local Property Taxes
State %District %District
EXPENDITURE BY FUND 2010-11
TOTAL
Capital Projects
Fire Prevention & Safety
Social SecurityMunicipal Retirement/
Tort
Debt Service
Transportation
Operations & Maintenance
Education$49,716,875
$4,808,082
$9,230,467
$5,818,316
$3,906,019
$55,962,128
$5,643,800
$3,143,878
$9,058,259
$0
$1,949,971
$112,147
$2,196,128
$78,066,311
67.7
6.5
12.6
7.9
5.3
$73,479,759
71.7
7.2
4.0
11.6
0.0
2.5
0.1
2.8
58.2
5.1
17.1
9.5
10.1
73.7
5.9
3.8
7.4
1.2
2.0
0.8
5.1
OTHER FINANCIAL INDICATORS
2009 EqualizedAssessed Valuation
per Pupil
2010-11 OperatingExpenditure
per Pupil
2010-11 InstructionalExpenditure
per Pupil
State
District
** Due to the way Illinois school districts are configured, state averages for equalized assessed valuation per pupil and total school tax rate per $100 are not provided.Equalized assessed valuation includes all computed property values upon which a district's local tax rate is calculated.Total school tax rate is a district's total tax rate as it appears on local property tax bills.Instructional expenditure per pupil includes the direct costs of teaching pupils or the interaction between teachers and pupils.Operating expenditure per pupil includes the gross operating cost of a school district excluding summer school, adult education, bond principal retired, and capital expenditures.
** **
$359,507 2.66
2009 Total SchoolTax Rateper $100
$7,929
$6,824 $13,412 $11,664
ACADEMIC PERFORMANCE
OVERALL STUDENT PERFORMANCE
These charts present the overall percentages of state test scores categorized as meeting or exceeding the Illinois Learning Standards for your school, district, and the state. They respresent your school's performance in reading, mathematics, and science.
OVERALL PERFORMANCE - ALL STATE TESTS
0
20
40
60
80
10089.0 89.4 89.5 90.8
76.5 76.7
School District State
2010-11
2011-12

Percy Julian Middle School 406-016-0970-02-1004
0
20
40
60
80
10089.3 89.6 89.8 91.1
82.0 82.1
OVERALL ILLINOIS STANDARDS ACHIEVEMENT TEST (ISAT) PERFORMANCE
School District State
2010-11
2011-12
OVERALL ILLINOIS ALTERNATE ASSESSMENT (IAA) PERFORMANCE
0
20
40
60
80
100
69.0
81.0
68.776.0
66.2 66.3
School District State
2010-11
2011-12
IAA scores in the Progressing and Attaining performance levels count the same, respectfully, as scores on other state assessments that meet or exceed Standards.

Percy Julian Middle School 506-016-0970-02-1004
These charts provide information on attainment of the Illinois Learning Standards. They show the percents of student scores meeting or exceeding Standards for the grades and subjects tested on ISAT.
ISAT PERFORMANCE
0
20
40
60
80
100 93.5 91.1 92.7 90.384.1 81.7
89.4 90.4 90.5 89.084.0 85.0
ISAT Grade 6
MathematicsReading
School StateDistrict School StateDistrict
2010-11
2011-12
0
20
40
60
80
10087.5 89.3 88.1 89.8
78.8 78.1
88.8 90.0 90.2 91.784.3 84.6 86.0 83.7
88.3 86.881.9 79.9
ISAT Grade 7
Reading
School District State
2010-11
2011-12
District
Mathematics
School State
Science
StateDistrictSchool
0
20
40
60
80
10089.4 91.5 88.3 91.2
85.0 86.289.7 91.2 88.5 90.0
86.3 85.0
ISAT Grade 8
MathematicsReading
School District State School District State
2010-11
2011-12

Percy Julian Middle School 606-016-0970-02-1004
PERFORMANCE ON STATE ASSESSMENTS
Federal law requires that student achievement results for reading, mathematics, and science for schools providing Title I services be reported to the general public.
The Illinois Standards Achievement Test (ISAT) is administered to students in grades 3 through 8. The Prairie State Achievement Examination (PSAE) is administered to students in grade 11. The Illinois Alternate Assessment (IAA) is administered to students with disabilities whose Individualized Education Programs (IEPs) indicate that participation in the ISAT or PSAE would not be appropriate.
Students with disabilities have an IEP (No Child Left Behind Act). An IEP is a written plan for a child with a disability who is eligible to receive special education services under the Individuals with Disabilities Education Act.
Reading and Mathematics are tested in grades 3 through 8 and 11. Science is tested in grades 4, 7, and 11.
In order to protect students' identities, test data for groups of fewer than ten students are not reported.
PERCENTAGE OF STUDENTS NOT TESTED IN STATE TESTING PROGRAMS FOR READING
State
District
School*Enrollment
*Enrollment
*Enrollment
Reading
Racial/Ethnic BackgroundGender
FemaleMale
Two or More Races
American IndianAsianHispanicBlackWhite
Studentswith
DisabilitiesMigrantLEPAll
Econo-micallyDisadv-antaged
Native Hawaiian/Pacific islander
* Enrollment as reported during the testing windows for grades 3 - 8 and 11.
Reading
Reading
Number of LEP Students who have attended schools in the U.S. for less than 12 months and are not assessed on the State's reading/language arts test:
890
3,606
1,072,304
0.9
0.4
0.4
457
1,801
0.9
548,690
0.4
0.5
433
1,805
523,352
0.9
0.4
0.3
472
1,993
547,900
0.6
0.3
0.3
270
938
192,977
1.1
0.5
0.7
38
173
251,440
0.0
1.2
0.4
27
151
45,188
0.0
0.7
0.3
0
0
977
0.6
0
2
3,177
0.6
83
349
29,968
2.4
0.4
0.6
3
33
75,031
0.0
0.6
0
0
261
2.3
167
628
146,113
1.8
1.0
0.9
210
788
531,157
1.4
0.6
0.5
1
PERCENTAGE OF STUDENTS NOT TESTED IN STATE TESTING PROGRAMS FOR MATHEMATICS
State
District
School*Enrollment
*Enrollment
*Enrollment
Mathematics
Racial/Ethnic BackgroundGender
FemaleMale
Two or More Races
American IndianAsianHispanicBlackWhite
Studentswith
DisabilitiesMigrantLEPAll
Econo-micallyDisadv-antaged
Native Hawaiian/Pacific islander
Mathematics
Mathematics
* Enrollment as reported during the testing windows for grades 3 - 8 and 11.
891
3,608
1,073,764
0.9
0.4
0.4
458
1,803
549,462
0.9
0.4
0.4
433
1,805
524,040
0.9
0.4
0.3
472
1,993
548,234
0.6
0.3
0.3
270
938
193,064
1.1
0.5
0.7
38
173
252,013
0.0
1.2
0.4
28
153
45,638
0.0
0.7
0.2
0
0
983
0.5
0 83
349
0.4
4
35
76,502
2
3,180
0.5
0.0
0.3
0
0
271
1.1
167
2.4
0.6
29,975
628
146,133
1.8
1.0
0.9
210
789
532,214
1.4
0.6
0.5

Percy Julian Middle School 706-016-0970-02-1004
* Enrollment as reported during the testing windows for grades 4, 7, and 11.
PERCENTAGE OF STUDENTS NOT TESTED IN STATE TESTING PROGRAMS FOR SCIENCE
State
District
School*Enrollment
*Enrollment
*Enrollment
Science
Science
Science
Racial/Ethnic BackgroundGender
FemaleMale
Two or More Races
American IndianAsianHispanicBlackWhite
Studentswith
DisabilitiesMigrantLEPAll
Econo-micallyDisadv-antaged
169
611
232,992
303
1,189
456,721
1.7
0.8
0.7
0.6
0.5
0.8
134
578
223,651
3.0
1.0
0.6
163
655
237,912
2.5
0.9
0.5
92
302
81,780
1.1
0.3
1.4
12
56
103,594
0.0
1.8
0.7
9
56
19,211
1.8
0.3
0
1
1,359
0.9
27
119
12,254
0.0
0.0
0.7
2
12
25,859
0.0
0.8
0
0
107
0.9
56
198
61,941
1.8
1.5
1.6
72
265
217,988
1.4
0.8
1.0
Native Hawaiian/Pacific islander
0
0
393
1.0
ILLINOIS STANDARDS ACHIEVEMENT TEST (ISAT)
The following tables show the percentages of student scores in each of four performance levels. These levels were established with the help of Illinois educators who teach the grade levels and learning areas tested. Due to rounding, the sum of the percentages in the four performance levels may not always equal 100.
Level 1 -- Academic Warning - Student work demonstrates limited knowledge and skills in the subject. Because of major gaps in learning, students apply knowledge and skills ineffectively.
Level 2 -- Below Standards - Student work demonstrates basic knowledge and skills in the subject. However, because of gaps in learning, students apply knowledge and skills in limited ways.
Level 3 -- Meets Standards - Student work demonstrates proficient knowledge and skills in the subject. Students effectively apply knowledge and skills to solve problems.
Level 4 -- Exceeds Standards - Student work demonstrates advanced knowledge and skills in the subject. Students creatively apply knowledge and skills to solve problems and evaluate the results.
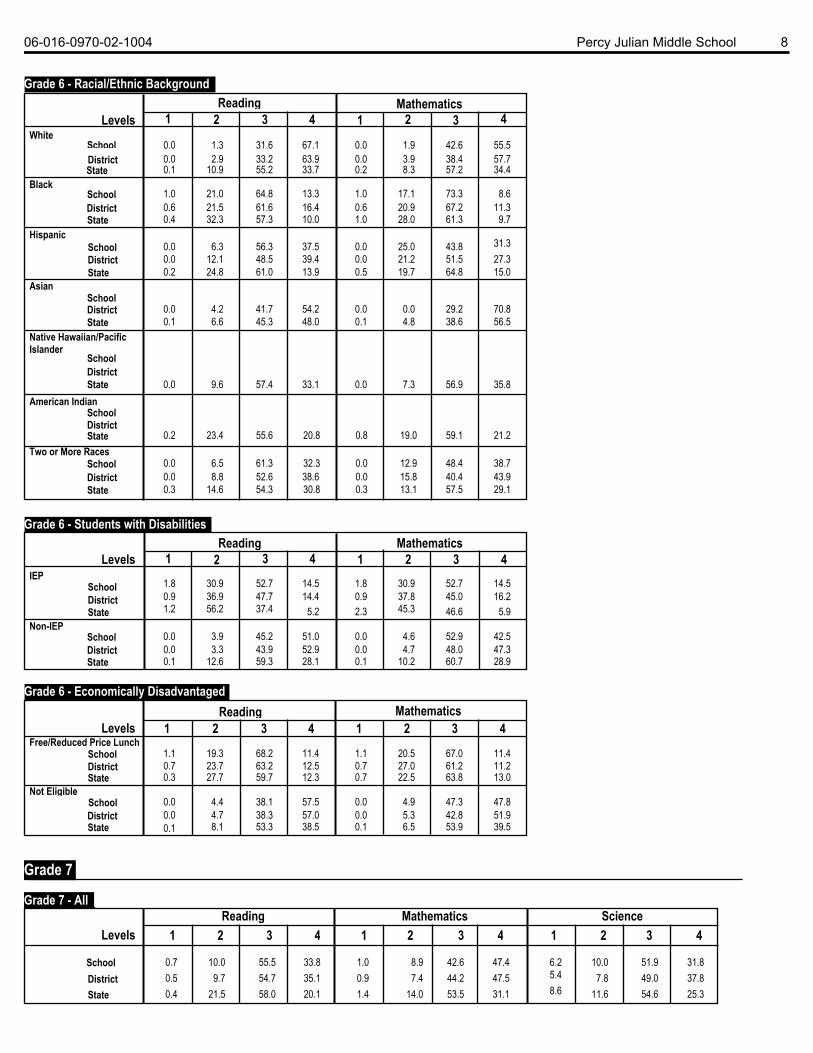
Grade 6
School
MathematicsReading
43214321Levels
DistrictState
Grade 6 - All
0.3 8.6 46.5 44.6
0.2 9.5 44.6 45.8 0.2 18.1 56.5 25.2
0.3 9.2 52.9 37.6
10.8 0.2 47.4 41.6 0.4 14.6 58.9 26.0
StateDistrict
FemaleSchool
Reading1 2 3 4 1 2 3 4
Mathematics
Levels
Grade 6 - Gender
SchoolMale
DistrictState
0.6 7.8 53.9 37.7 0.3 9.8 52.5 37.3 0.3 21.2 55.3 23.1
0.6 7.8 56.5 35.1 0.3 10.8 51.2 37.6 0.5 15.8 56.8 26.9
0.0 9.4 39.4 51.3 0.0 9.2 36.9 53.9 0.1 14.8 57.8 27.3
0.0 0.0 10.8 43.8 45.4 0.3 13.4 61.2 25.1
10.6 49.4 40.0
Percy Julian Middle School 806-016-0970-02-1004
SchoolTwo or More Races
StateDistrict
DistrictState
American IndianSchool
DistrictState
AsianSchool
SchoolHispanic
StateDistrict
SchoolWhite
LevelsMathematics
43214321Reading
Grade 6 - Racial/Ethnic Background
SchoolBlack
StateDistrict
StateDistrict
0.0 1.3 31.6 67.1
0.0 2.9 33.2 63.9 0.1 10.9 55.2 33.7
0.0 1.9 42.6 55.5
0.0 3.9 38.4 57.7 0.2 8.3 57.2 34.4
1.0 21.0 64.8 13.3
0.6 21.5 61.6 16.4 0.4 32.3 57.3 10.0
1.0 17.1 73.3 8.6
0.6 20.9 67.2 11.3 1.0 28.0 61.3 9.7
0.0 6.3 56.3 37.5 0.0 12.1 48.5 39.4 0.2 24.8 61.0 13.9
0.0 25.0 43.8 31.3
0.0 21.2 51.5 27.3 64.8 19.7 15.0 0.5
0.0 4.2 41.7 54.2 0.1 6.6 45.3 48.0
0.0 0.0 29.2 70.8 0.1 4.8 38.6 56.5
0.2 23.4 55.6 20.8 0.8 19.0 59.1 21.2
0.0 6.5 61.3 32.3
0.0 8.8 52.6 38.6 0.3 14.6 54.3 30.8
0.0 12.9 48.4 38.7
0.0 15.8 40.4 43.9 0.3 13.1 57.5 29.1
Native Hawaiian/Pacific Islander
School
StateDistrict
0.0 9.6 57.4 33.1 0.0 7.3 56.9 35.8
DistrictState
Non-IEPSchool
Grade 6 - Students with Disabilities
Reading1 2 3 4 1 2 3 4
MathematicsLevels
IEPSchool
DistrictState
1.8 30.9 52.7 14.5 0.9 36.9 47.7 14.4 1.2 56.2 37.4 5.2
1.8 30.9 52.7 14.5 0.9 37.8 45.0 16.2
2.3 45.3 46.6 5.9
0.0 3.9 45.2 51.0 0.0 3.3 43.9 52.9 0.1 12.6 59.3 28.1
0.0 4.6 52.9 42.5 0.0 4.7 48.0 47.3 0.1 10.2 60.7 28.9
DistrictState
Not EligibleSchool
Grade 6 - Economically Disadvantaged
Reading1 2 3 4 1 2 3 4
Mathematics
LevelsFree/Reduced Price Lunch
School
DistrictState
19.3 1.1 68.2 11.4 0.7 23.7 63.2 12.5 0.3 27.7 59.7 12.3
1.1 20.5 67.0 11.4 0.7 27.0 61.2 11.2 0.7 22.5 63.8 13.0
0.0 4.4 38.1 57.5 0.0 4.7 38.3 57.0 0.1 8.1 53.3 38.5
0.0 4.9 47.3 47.8 0.0 5.3 42.8 51.9 0.1 6.5 53.9 39.5
Grade 7
Grade 7 - All
State
District
Levels 1 2 3 4
Reading
School
Science
1 2 3 4
Mathematics
4321
0.7 10.0 55.5 33.8
0.5 9.7 54.7 35.1
0.4 21.5 58.0 20.1
1.0 8.9 42.6 47.4
0.9 7.4 44.2 47.5
1.4 14.0 53.5 31.1
6.2 10.0 51.9 31.8 5.4 7.8 49.0 37.8 8.6 11.6 54.6 25.3

Percy Julian Middle School 906-016-0970-02-1004
FemaleSchool
State
District
1 2 3 4Levels
Grade 7 - GenderReading
SchoolMale
District
State
21 3 4
Mathematics
1 2 3 4
Science
0.6 12.8 54.3 32.3
0.3 12.4 52.2 35.1
0.6 25.0 56.9 17.5
0.6 9.1 41.2 49.1
0.7 9.0 41.5 48.8
1.8 15.6 51.6 31.0
6.7 13.3 42.4 37.6
5.7 9.1 43.0 42.3
10.0 11.7 51.3 26.9
0.8 6.3 57.1 35.7
0.7 6.8 57.3 35.1
0.2 17.8 59.3 22.7
1.6 8.7 44.4 45.2
1.1 5.7 47.1 46.1
1.0 12.3 55.6 31.1
5.6 5.6 64.5 24.2
5.0 6.5 55.4 33.1
7.0 11.4 58.1 23.5
SchoolTwo or More Races
StateDistrict
SchoolAsian
StateDistrict
SchoolBlack
State
District
Grade 7 - Racial/Ethnic BackgroundReading
1 2 3 4Levels
SchoolWhite
SchoolHispanic
StateDistrict
SchoolAmerican Indian
StateDistrict
StateDistrict
Mathematics Science4321 4321
0.0 4.5 47.8 47.8
0.0 4.8 47.4 47.8
0.2 13.9 58.9 27.0
0.0 4.5 31.2 64.3
0.3 3.8 31.6 64.2
0.8 9.0 50.8 39.4
1.3 3.2 49.7 45.8
1.9 2.6 41.6 53.9
4.4 7.1 53.1 35.5
1.1 23.0 60.9 14.9 1.2 23.5 60.5 14.8 0.9 36.6 54.6 7.9
3.4 20.7 57.5 18.4 2.5 17.9 63.6 16.0 2.9 25.9 57.1 14.1
16.1 23.0 46.0 14.9 14.4 19.4 53.8 12.5 17.4 20.4 54.5 7.7
8.3 8.3 66.7 16.7 4.0 4.0 76.0 16.0 0.5 29.2 59.7 10.7
0.0 8.3 66.7 25.0 0.0 3.8 69.2 26.9 1.6 17.9 60.7 19.8
8.3 16.7 58.3 16.7 3.8 11.5 69.2 15.4
12.1 16.1 59.7 12.1
0.0 0.0 68.0 32.0 0.2 8.5 53.6 37.7
0.0 0.0 30.8 69.2 0.7 3.6 32.0 63.8
3.8 0.0 61.5 34.6 3.3 4.6 47.0 45.1
0.0 23.6 60.1 16.2 1.5 16.2 56.0 26.3 9.1 12.7 58.1 20.1
0.0 3.8 76.9 19.2 0.0 3.7 63.0 33.3 0.2 18.4 57.4 24.0
0.0 0.0 61.5 38.5 0.0 1.9 53.7 44.4 1.2 12.6 52.3 33.9
0.0 7.7 73.1 19.2 0.0 5.6 61.1 33.3 7.1 10.5 51.6 30.8
Native Hawaiian/Pacific Islander
School
StateDistrict
0.0 17.1 57.7 25.2 0.9 4.5 55.4 39.3 8.0 6.3 59.8 25.9
District
State
SchoolNon-IEP
Grade 7 - Students with Disabilities
Reading
1 2 3 4LevelsIEP
School
State
District
Mathematics
4321 4321
Science
4.3 34.0 46.8 14.9
2.3 35.6 48.3 13.8
2.4 61.0 33.3 3.3
6.4 31.9 44.7 17.0
4.6 32.2 46.0 17.2
7.7 44.0 42.2 6.1
21.3 27.7 40.4 10.6
20.2 22.6 45.2 11.9
28.6 24.5 40.8 6.1
0.0 5.3 57.2 37.4
0.2 5.1 55.8 38.9
0.1 15.8 61.6 22.5
0.0 4.5 42.2 53.3
0.2 3.0 43.9 52.8
0.5 9.7 55.2 34.7
3.3 6.6 54.1 36.0
2.8 5.3 49.6 42.3
5.7 9.7 56.6 28.0

Percy Julian Middle School 1006-016-0970-02-1004
DistrictState
Not EligibleSchool
Grade 7 - Economically DisadvantagedReading
1 2 3 4Levels
Free/Reduced Price Lunch
School
DistrictState
1
Science
2 3 4
Mathematics
4321
1.5 23.5 69.1 5.9
0.8 24.6 69.2 5.4 0.7 32.2 57.8 9.4
4.4 25.0 61.8 8.8
3.1 20.6 60.3 16.0 2.2 21.3 59.2 17.2
11.9 31.3 49.3 7.5
11.8 23.6 54.3 10.2 13.7 17.3 57.4 11.6
0.5 5.9 51.4 42.3
0.4 5.4 50.4 43.8 0.1 11.1 58.3 30.5
0.0 4.0 36.8 59.2
0.2 3.6 39.6 56.7 0.6 6.8 47.9 44.6
4.5 3.6 52.7 39.2
3.6 3.3 47.4 45.7 3.5 6.0 51.9 38.6
Grade 8
41.2 50.0 8.5 0.4 23.1 68.5 8.5 0.0School
MathematicsReading
43214321Levels
46.9 43.1 9.5 0.5 21.0 70.3 8.6 0.2District 32.6 52.4 14.7 0.3 10.1 76.1 13.6 0.1State
Grade 8 - All
State 0.2 17.2 74.3 8.3 0.4 16.8 50.1 32.7District 0.4 11.1 71.2 17.3 1.1 11.8 41.5 45.6
Female 51.5 42.6 5.9 0.0 24.3 70.6 5.1 0.0School
Reading
1 2 3 4 1 2 3 4
Mathematics
Levels
Grade 8 - Gender
School 0.0 12.1 66.1 21.8 0.8 11.3 39.5 48.4Male
48.2 44.6 7.2 0.0 24.5 69.3 6.1 0.0District 32.5 54.7 12.5 0.2 12.0 78.0 10.0 0.1State
56.5 34.8 8.7 0.0 13.0 78.3 8.7 0.0SchoolTwo or More Races
State 0.2 19.0 73.4 7.4 1.1 21.0 53.2 24.8District
57.9 31.6 10.5 0.0 11.1 77.8 11.1 0.0District 63.2 32.0 4.7 0.1 24.7 70.1 5.2 0.0State
American IndianSchool
31.4 57.1 8.6 2.9 22.9 65.7 11.4 0.0District 21.9 59.7 18.1 0.3 4.9 77.6 17.3 0.1State
Asian 66.7 33.3 0.0 0.0 16.7 75.0 8.3 0.0School
School 0.0 20.0 40.0 40.0 0.0 20.0 30.0 50.0Hispanic
State 0.3 23.6 73.3 2.8 0.7 27.6 58.1 13.7District 0.0 24.8 69.0 6.2 1.4 24.8 57.9 15.9
School 0.0 0.7 66.7 32.7 1.3 35.3 63.3 0.0White
LevelsMathematics
43214321
Reading
Grade 8 - Racial/Ethnic Background
School 0.0 24.6 72.3 3.1 1.5 24.6 60.0 13.8Black
State 0.1 9.1 77.0 13.8 0.2 9.4 48.8 41.5District 0.3 1.0 71.0 27.7 0.0 2.6 36.0 61.4
33.9 51.0 14.9 0.3 55.0 37.5 7.5 0.0
11.9 74.5 13.5 0.1 25.0 70.0 5.0 0.0
StateDistrict
Native Hawaiian/Pacific Islander
School
StateDistrict
0.0 9.6 78.1 12.4 0.6 7.3 50.0 42.1

Percy Julian Middle School 1106-016-0970-02-1004
18.0 47.2 32.6 2.2 11.2 53.9 34.8 0.0District 5.9 41.6 50.6 2.0 1.1 47.2 50.8 0.9State
Non-IEP 56.7 38.6 4.7 0.0 25.6 70.7 3.7 0.0School
Grade 8 - Students with Disabilities
Reading1 2 3 4 1 2 3 4
MathematicsLevels
IEP 17.8 53.3 26.7 2.2 11.1 57.8 31.1 0.0School
52.5 42.3 5.0 0.2 22.9 73.4 3.5 0.2District 36.4 53.9 9.6 0.1 11.4 80.3 8.3 0.0State
14.3 57.1 27.6 1.0 5.1 69.4 25.5 0.0District 18.1 59.0 22.5 0.5 3.9 75.1 20.8 0.2State
Not Eligible 58.1 37.7 4.2 0.0 27.4 68.4 4.2 0.0School
Grade 8 - Economically Disadvantaged
Reading1 2 3 4 1 2 3 4
Mathematics
LevelsFree/Reduced Price Lunch
11.1 57.8 28.9 2.2 2.2 68.9 28.9 0.0School
54.0 40.0 5.5 0.4 24.4 70.4 4.9 0.2District 46.2 46.2 7.5 0.2 15.9 77.0 7.0 0.1State

Percy Julian Middle School 1206-016-0970-02-1004
2012 ADEQUATE YEARLY PROGRESS (AYP) STATUS REPORT
Has this school been identified for School Improvement according to the AYP specifications of the federal No Child Left Behind Act?
Safe Harbor Target **
Safe Harbor Target **
% % % % %%
Met AYP
Met AYP
Met AYP
Met AYP
Met AYP
Mathematics MathematicsReadingReading5-YEAR
Graduation RateAttendance Rate
Percent Meeting/Exceeding Standards *Percent Tested on State Tests
Other Indicators
Met AYP
State AYP Minimum Target
All
White
Black
Hispanic
Asian
American Indian
99.1
99.4
98.9
Yes
Yes
Yes
99.1
99.4
98.9
Yes
Yes
Yes
91.4
97.8
78.3 79.6
Yes
Yes
Yes
91.4
97.3
79.6 76.1
Yes
Yes
95.1
95.4
Is this school making Adequate Yearly Progress (AYP)?
YesYes
Two or More Races
95.0 95.0 85.0 85.0 91.0 82.0
97.6 Yes 97.6 Yes 94.7 Yes 92.1 Yes
Yes
* Includes only students enrolled as of 05/01/2011.
** Safe Harbor Targets of 85% or above are not printed.
*** Subgroups with fewer than 45 students are not reported. Safe Harbor only applies to subgroups of 45 or more. In order for Safe Harbor to apply, a subgroup must decrease by 10% the percentage of scores that did not meet state standards from the previous year plus meet the other indicators (attendance rate for non-high schools and graduation rate for high schools) for the subgroup. For subgroups that do not meet their Safe Harbor Targets, a 75% confidence interval is applied. Safe Harbor allows schools an alternate method to meet subgroup minimum targets on achievement.
Four Conditions Are Required For Making Adequate Yearly Progress (AYP):
1. At least 95% tested in reading and mathematics for every student group. If the current year participation rate is less than 95%, this condition may be met if the average of the current and preceding year rates is at least 95%, or if the average of the current and two preceding years is at least 95%. Only actual participation rates are printed. If the participation rate printed is less than 95% and yet this school makes AYP, it means that the 95% condition was met by averaging.
2. At least 85% meeting/exceeding standards in reading and mathematics for every group. For any group with less than 85% meeting/exceeding standards, a 95% confidence interval was applied. Subgroups may meet this condition through Safe Harbor provisions. ***
3. At least 91% attendance rate for non-high schools and at least 82% graduation rate for high schools.
94.4
94.0
Yes
Yes
77.0
68.2
74.6
72.2Yes
79.5
70.6
76.9
69.5
Yes
Yes
98.6
98.2
Yes
Yes
98.6
98.2
Economically Disadvantaged
Students with Disabilities
LEP
Is this school making AYP in Reading?
Is this school making AYP in Mathematics?
Yes
Yes
Yes
No
2012-13 State Improvement Status
2012-13 Federal Improvement Status
Academic Early Warning Year 1
Native Hawaiian/ Pacific Islander

Oak Park Elementary School District 97
On-Going District Goals
2012-2013
Oak Park Elementary School District 97 is dedicated to providing its students with an
exemplary education that is administered in a rigorous academic environment and
supported by highly qualified staff members. The Board of Education and district
administration are committed to:
1. Establishing and maintaining an environment that fosters excellence in every
student we serve
2. Promoting best practices and the strategic use of data
3. Engaging in effective communications
4. Dealing with critical issues in a consistent manner and with high expectations
5. Attracting and retaining high performing staff members
Administrators in the elementary and middle schools are working collaboratively with
staff and parents/guardians to develop school improvement plans that result in:
1. Strong achievement for all students
2. A safe, orderly climate that fosters high expectations
3. Exceptional home-school communication
District 97 has also identified the essential elements that are critical for preparing
students for success in a global society. These elements include:
1. Excellent teachers in every classroom
2. Differentiation and project-based learning
3. Strong data analysis and usage
4. 21st century technology and learning tools
5. Foreign language and global understanding
6. Coordinated school improvement efforts
In addition, district employees are encouraged to develop goals that relate to their
professional responsibilities. District 97 strongly supports opportunities for professional
development, and believes lifelong learning is a key component of a growing, vital
educational institution.

Complying with the Law
Public Act 84-126 requires that the public school districts disseminate a school report card to the public by October 31st each year. In addition, Public Act 92-0604 reflects the changes in the methods school report cards may be released:
Illinois public school districts are required to release the school report cards to their local school boards, taxpayers, parents, and Regional Superintendent by October 31st each year.
The school report card(s) is required by law to be presented at a regular school board meeting subject to applicable notice requirements as stated in the Open Meetings Act. The school report card(s) shall be posted on the school district’s Internet web site, if the district maintains an Internet web site.
The school report card(s) must be made available to a newspaper of general circulation serving the school district. If the district posts the report card(s) on its Internet web site, the district shall send a written notice home to parents stating (i) that the report card(s) is available on the web site, (ii) the address of the web site, (iii) that a printed copy of the report card(s) will be sent to parents upon request, and (iv) the telephone number that parents may call to request a printed copy of the report card(s).
The school district must maintain all school report cards in the district office for review on request by parents, taxpayers, and other members of the public. Copies must be made available to requesters according to the provisions of the Freedom of Information Act. A fee may be charged for copies to recover the actual cost of duplication.
Each school district is required to submit the completed report card to the office of the appropriate Regional Superintendent, where copies must be made available to anyone requesting them. A fee may be charged for copies to reimburse for the actual cost of duplication.