Oahu Regional Transportation Plan 2030 Regional Transportation Plan 2030 What is the ORTP? Looking...
19
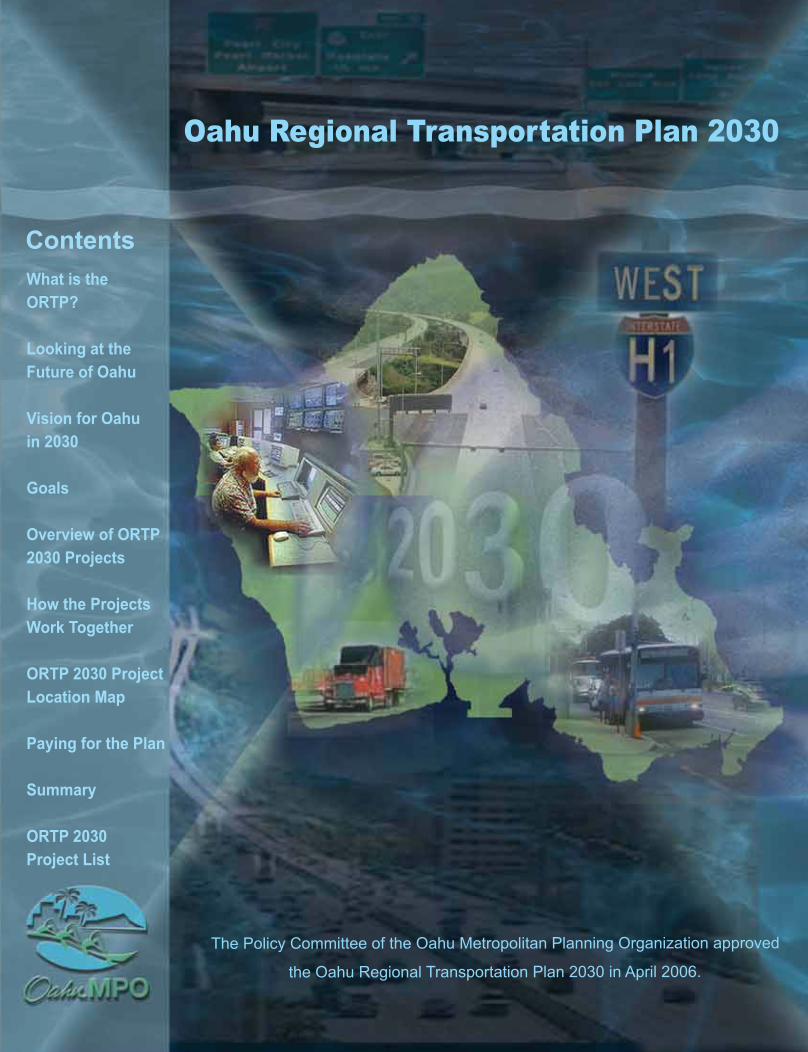
Oahu Regional Transportation Plan 2030 What is the ORTP? Looking at the Future of Oahu Vision for Oahu in 2030 Goals Overview of ORTP 2030 Projects How the Projects Work Together ORTP 2030 Project Location Map Paying for the Plan Summary ORTP 2030 Project List Contents The Policy Committee of the Oahu Metropolitan Planning Organization approved the Oahu Regional Transportation Plan 2030 in April 2006.
Transcript of Oahu Regional Transportation Plan 2030 Regional Transportation Plan 2030 What is the ORTP? Looking...
Oahu Regional Transportation Plan 2030
What is the
ORTP?
Looking at the
Future of Oahu
Vision for Oahu
in 2030
Goals
Overview of ORTP
2030 Projects
How the Projects
Work Together
ORTP 2030 Project
Location Map
Paying for the Plan
Summary
ORTP 2030
Project List
Contents
The preparation of this document was financed in part through grants from the U.S. Department of Transportation, Federal TransitAdministration and Federal Highway Administration, under Chapter 53 of 49 U.S.C. and 23 U.S.C. The contents of this document do
not necessarily reflect the official views or policies of the U.S. Department of Transportation.
The Policy Committee of the Oahu Metropolitan Planning Organization approved
the Oahu Regional Transportation Plan 2030 in April 2006.
Additional copies of this document can bedownloaded from
www.OahuMPO.org/ortp.For more information, contact:
707 Richards Street, Suite 200Honolulu, Hawaii 96813-4623Telephone: (808) 587-2015
Fax: (808) 587-2018Email: [email protected]
Oahu Metropolitan Planning Organization
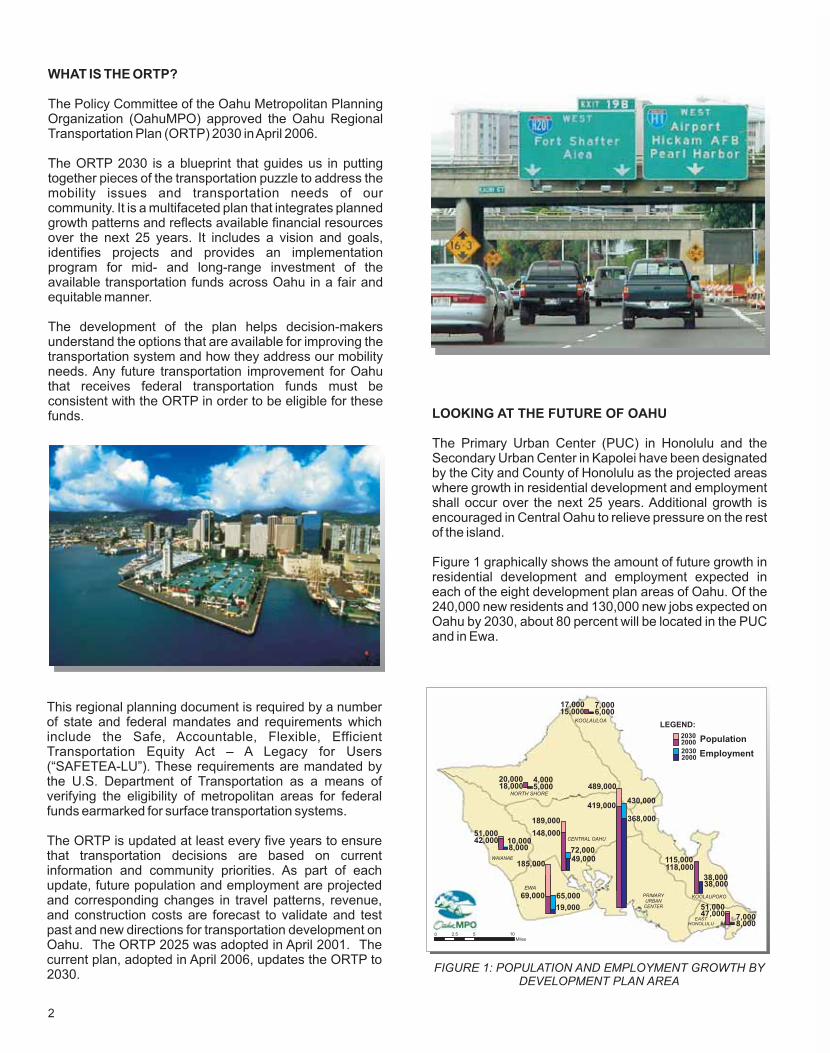
FIGURE 1: POPULATION AND EMPLOYMENT GROWTH BY
DEVELOPMENT PLAN AREA
192
WHAT IS THE ORTP?
The Policy Committee of the Oahu Metropolitan PlanningOrganization (OahuMPO) approved the Oahu RegionalTransportation Plan (ORTP) 2030 inApril 2006.
The ORTP 2030 is a blueprint that guides us in puttingtogether pieces of the transportation puzzle to address themobility issues and transportation needs of ourcommunity. It is a multifaceted plan that integrates plannedgrowth patterns and reflects available financial resourcesover the next 25 years. It includes a vision and goals,identifies projects and provides an implementationprogram for mid- and long-range investment of theavailable transportation funds across Oahu in a fair andequitable manner.
The development of the plan helps decision-makersunderstand the options that are available for improving thetransportation system and how they address our mobilityneeds. Any future transportation improvement for Oahuthat receives federal transportation funds must beconsistent with the ORTP in order to be eligible for thesefunds.
This regional planning document is required by a numberof state and federal mandates and requirements whichinclude the Safe, Accountable, Flexible, EfficientTransportation Equity Act – A Legacy for Users(“SAFETEA-LU”). These requirements are mandated bythe U.S. Department of Transportation as a means ofverifying the eligibility of metropolitan areas for federalfunds earmarked for surface transportation systems.
The ORTP is updated at least every five years to ensurethat transportation decisions are based on currentinformation and community priorities. As part of eachupdate, future population and employment are projectedand corresponding changes in travel patterns, revenue,and construction costs are forecast to validate and testpast and new directions for transportation development onOahu. The ORTP 2025 was adopted in April 2001. Thecurrent plan, adopted in April 2006, updates the ORTP to2030.
LOOKING AT THE FUTURE OF OAHU
The Primary Urban Center (PUC) in Honolulu and theSecondary Urban Center in Kapolei have been designatedby the City and County of Honolulu as the projected areaswhere growth in residential development and employmentshall occur over the next 25 years. Additional growth isencouraged in Central Oahu to relieve pressure on the restof the island.
Figure 1 graphically shows the amount of future growth inresidential development and employment expected ineach of the eight development plan areas of Oahu. Of the240,000 new residents and 130,000 new jobs expected onOahu by 2030, about 80 percent will be located in the PUCand in Ewa.
7,0008,000
Employment
LEGEND:
Population
Employment
2030
4,000
72,000
38,000
7,0008,000
65,000
430,000
17,000
20,000
189,000
115,000
51,000
185,000
489,000
2030
2000
5,000
49,000
38,000
10,0008,000
19,000
15,000
18,000
148,000
118,000
42,000
69,000
419,000
KOOLAULOA
NORTH SHORE
CENTRAL OAHU
KOOLAUPOKO
EAST
HONOLULU
PRIMARY
URBAN
CENTER
EWA
WAIANAE
2000
7,0006,000
51,00047,000
368,000
0 2.5 5 10
Miles
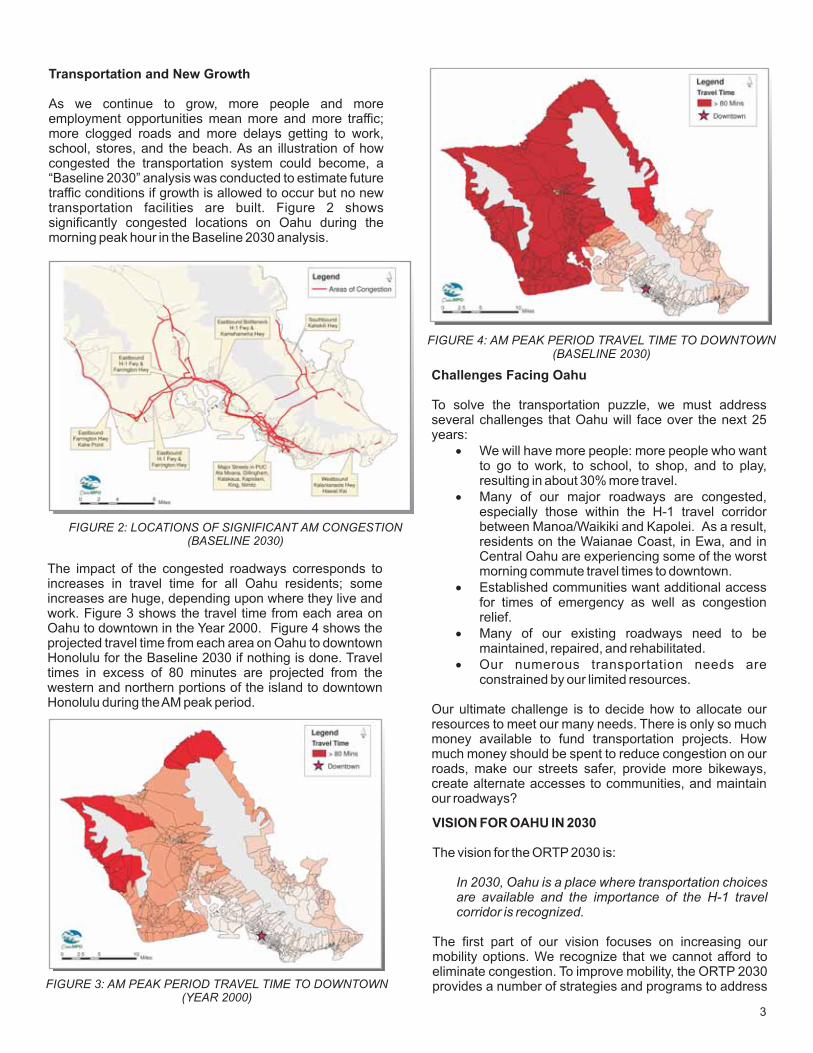
FIGURE 2: LOCATIONS OF SIGNIFICANT AM CONGESTION
(BASELINE 2030)
FIGURE 3: AM PEAK PERIOD TRAVEL TIME TO DOWNTOWN
(YEAR 2000)
3
The impact of the congested roadways corresponds toincreases in travel time for all Oahu residents; someincreases are huge, depending upon where they live andwork. Figure 3 shows the travel time from each area onOahu to downtown in the Year 2000. Figure 4 shows theprojected travel time from each area on Oahu to downtownHonolulu for the Baseline 2030 if nothing is done. Traveltimes in excess of 80 minutes are projected from thewestern and northern portions of the island to downtownHonolulu during theAM peak period.
Transportation and New Growth
As we continue to grow, more people and moreemployment opportunities mean more and more traffic;more clogged roads and more delays getting to work,school, stores, and the beach. As an illustration of howcongested the transportation system could become, a“Baseline 2030” analysis was conducted to estimate futuretraffic conditions if growth is allowed to occur but no newtransportation facilities are built. Figure 2 showssignificantly congested locations on Oahu during themorning peak hour in the Baseline 2030 analysis.
Challenges Facing Oahu
To solve the transportation puzzle, we must addressseveral challenges that Oahu will face over the next 25years:
We will have more people: more people who wantto go to work, to school, to shop, and to play,resulting in about 30% more travel.
Many of our major roadways are congested,especially those within the H-1 travel corridorbetween Manoa/Waikiki and Kapolei. As a result,residents on the Waianae Coast, in Ewa, and inCentral Oahu are experiencing some of the worstmorning commute travel times to downtown.
Established communities want additional accessfor times of emergency as well as congestionrelief.
Many of our existing roadways need to bemaintained, repaired, and rehabilitated.
Our numerous transportation needs areconstrained by our limited resources.
Our ultimate challenge is to decide how to allocate ourresources to meet our many needs. There is only so muchmoney available to fund transportation projects. Howmuch money should be spent to reduce congestion on ourroads, make our streets safer, provide more bikeways,create alternate accesses to communities, and maintainour roadways?
�
�
�
�
�
18
FIGURE 4: AM PEAK PERIOD TRAVEL TIME TO DOWNTOWN
(BASELINE 2030)
VISION FOR OAHU IN 2030
The vision for the ORTP 2030 is:
The first part of our vision focuses on increasing ourmobility options. We recognize that we cannot afford toeliminate congestion. To improve mobility, the ORTP 2030provides a number of strategies and programs to address
In 2030, Oahu is a place where transportation choices
are available and the importance of the H-1 travel
corridor is recognized.

4
the island's future transportation needs. These includemajor capital improvement projects that add to thesystem's person-carrying and vehicular capacities,projects that expand on the existing systems and servicesto optimize their use, increased focus on operational,management and preservation strategies, and programsthat help integrate the transportation system into the landuses of each community.
This vision also acknowledges the importance of the H-1travel corridor. The projects included in the transportationplan propose numerous ways to address the additionaltraffic congestion expected to increase along this travelcorridor:
A major component of the ORTP 2030 is a railt r ans i t sys tem be tween Kapo le i andManoa/Waikiki.Also included in the plan are projects to increasethe capacity of H-1 itself with new interchanges,additional High Occupancy Vehicle (HOV) lanes,freeway widening, and operational improvementsat key locations. These major H-1 travel corridorprojects are supplemented with two projects thatprovide alternatives to H-1: the intra-islandcommuter ferry from Ewa to downtown Honoluluand the Nimitz flyover HOV facility.The ORTP 2030 implements the island's bikewayplan, expands the bus system, includes severalsecond access/emergency access roadways andprojects to maximize the use of existing facilities,and other measures to reduce the need for autotravel.
The ORTP 2030 will advance us toward the vision foraddressing future growth and traffic on Oahu. To meet ourvision, the island-wide transportation plan for Oahu isdefined by three overarching goals.
The objectives guiding this goal include increasing capacityof the system, providing an efficient and convenient transitsystem, providing access to all important destinations,serving all intermodal terminals, ensuring that projects aredistributed equitably, ensuring that safety and security isprovided, integrating the entire system, supportingeconomic development and providing for systempreservation.
The objectives associated with this goal are directed atdeveloping a plan that satisfies noise, air and water qualitystandards; encourages energy conservation; preservescultural integrity and natural resources; developsalternative transportation modes that are environmentally
�
�
�
GOALS
Transportation Services System:
Environment and Quality of Life:
Develop and maintain
Oahu's islandwide transportation system to ensure
efficient, safe, convenient and economical movement of
people and goods.
Develop and maintain
Oahu's transportation system in a manner that maintains
environmental quality and community cohesiveness.
friendly, including pedestrian walkways and bicycle routes;optimizes use of transportation resources; minimizesdisruption of neighborhoods; ensures compatibility with thephysical and social character of existing development;incorporates landscaping and public safety; and plans foremergencies.
The objectives that support this goal reinforce plannedpopulation distribution and land use development policies,encourage innovation, and encourage implementation ofland use policies
The following provides descriptions of specific elements ofthe plan. Individual projects are listed on pages 15 through19.
Land Use and Transportation Integration SystemGoal: Develop and maintain Oahu's transportation system
in a manner that integrates land uses and transportation
that support efficient use of transportationsystems.
The ORTP 2030 is a financially-constrained plan thatprovides $6.07 billion for capital projects and $7.47 billionto operate, maintain, and preserve the highway and transitsystems. The projects contained in the ORTP 2030attempt to balance our need for mobility options,congestion relief, safety, second access, and bicycling andpedestrian facilities.
To improve mobility, a number of strategies and programsare proposed. These include new travel options such as railtransit and ferry systems that add to the system's person-carrying capacities; projects that expand upon the existingsystems and services to optimize their use; increasedfocus on operational, management and preservationstrategies; and programs that help integrate thetransportation system into the land uses of eachcommunity.
With regard to congestion relief, the technical analysis andpublic input received during this effort highlighted the needto focus on the H-1 travel corridor and the Ewa and CentralOahu areas. Preliminary analysis indicated that island-wide congestion could be significantly addressed byfocusing on the H-1 travel corridor. The need fortransportation infrastructure in the Ewa area is alreadyapparent and will increase in the future as population andemployment are projected to grow substantially. Additionalpopulation and employment increases are also projected inCentral Oahu.
OVERVIEW OF ORTP 2030 PROJECTS
Rail Transit System
A key component of the ORTP 2030 is a rail transit systemthat will serve the H-1 travel corridor. It is important to notethat building a rail system will not eliminate congestion.We will also not be able to eliminate congestion by buildingmore highways, for we do not have the resources to keepup with the demand. The rail transit system will givepriority to moving people rather than cars, will be a majorfactor in providing mobility options, and will work togetherwith our land use policies in shaping our city.
17
516
Transit System Expansion
While rail transit is the backbone of the transit system in theORTP 2030, the existing bus system will continue to be animportant element of public transportation. Many railsystem passengers are expected to access the systemusing City buses traveling to and from their destination.Expansion of the bus system will be focused primarily inEwa, with moderate increases in other parts of Oahu,including express bus service to rural areas. Purchasingand replacing new buses to support service increases areincluded in the plan.
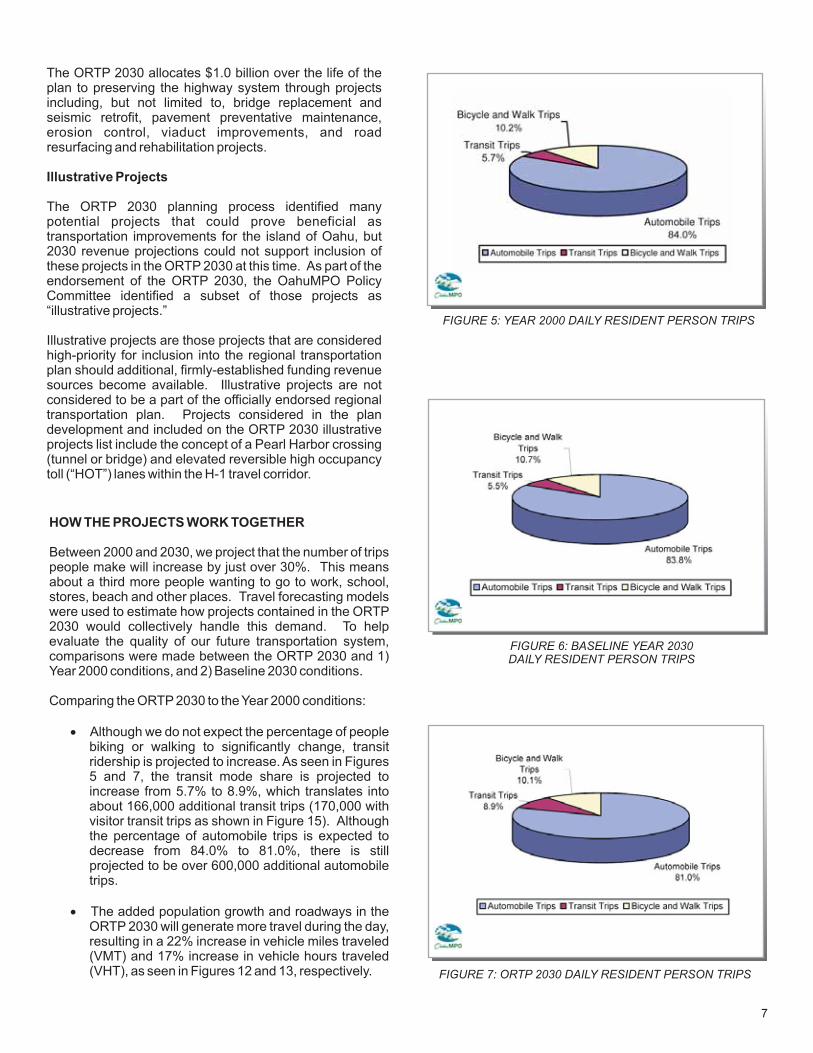
An additional element of future transit service implementsan intra-island express ferry service from Ewa to HonoluluHarbor.
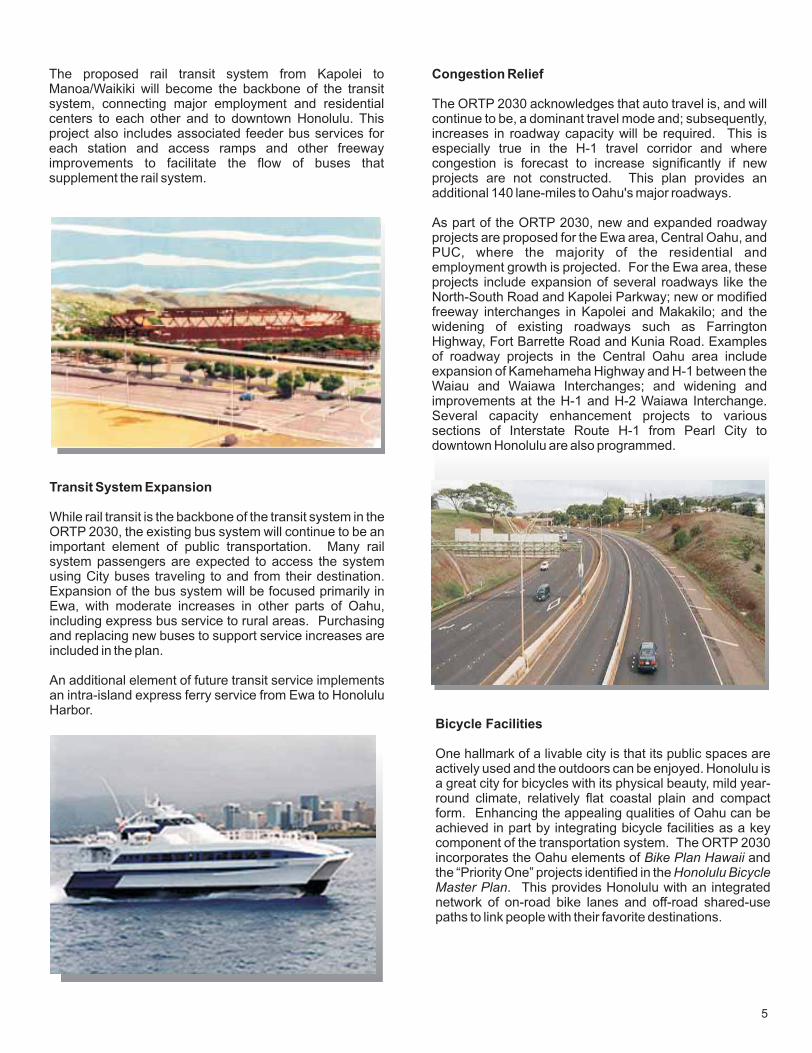
The proposed rail transit system from Kapolei toManoa/Waikiki will become the backbone of the transitsystem, connecting major employment and residentialcenters to each other and to downtown Honolulu. Thisproject also includes associated feeder bus services foreach station and access ramps and other freewayimprovements to facilitate the flow of buses thatsupplement the rail system.
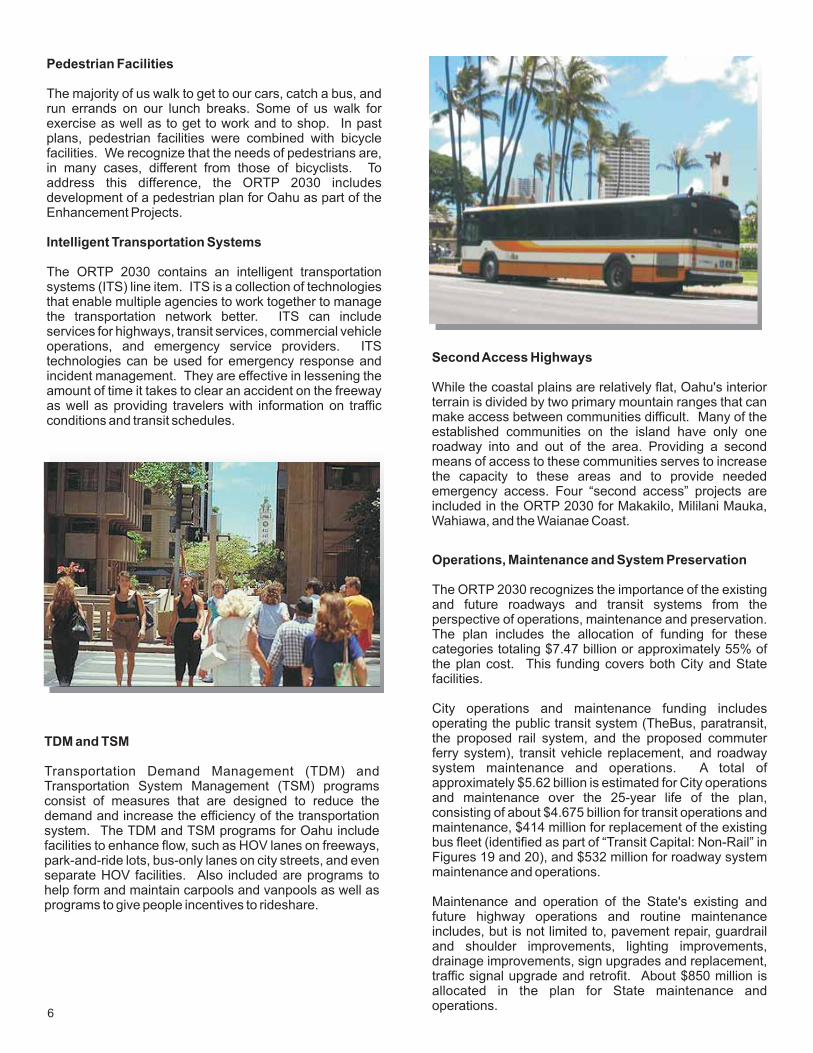
Congestion Relief
The ORTP 2030 acknowledges that auto travel is, and willcontinue to be, a dominant travel mode and; subsequently,increases in roadway capacity will be required. This isespecially true in the H-1 travel corridor and wherecongestion is forecast to increase significantly if newprojects are not constructed. This plan provides anadditional 140 lane-miles to Oahu's major roadways.
As part of the ORTP 2030, new and expanded roadwayprojects are proposed for the Ewa area, Central Oahu, andPUC, where the majority of the residential andemployment growth is projected. For the Ewa area, theseprojects include expansion of several roadways like theNorth-South Road and Kapolei Parkway; new or modifiedfreeway interchanges in Kapolei and Makakilo; and thewidening of existing roadways such as FarringtonHighway, Fort Barrette Road and Kunia Road. Examplesof roadway projects in the Central Oahu area includeexpansion of Kamehameha Highway and H-1 between theWaiau and Waiawa Interchanges; and widening andimprovements at the H-1 and H-2 Waiawa Interchange.Several capacity enhancement projects to varioussections of Interstate Route H-1 from Pearl City todowntown Honolulu are also programmed.
Bicycle Facilities
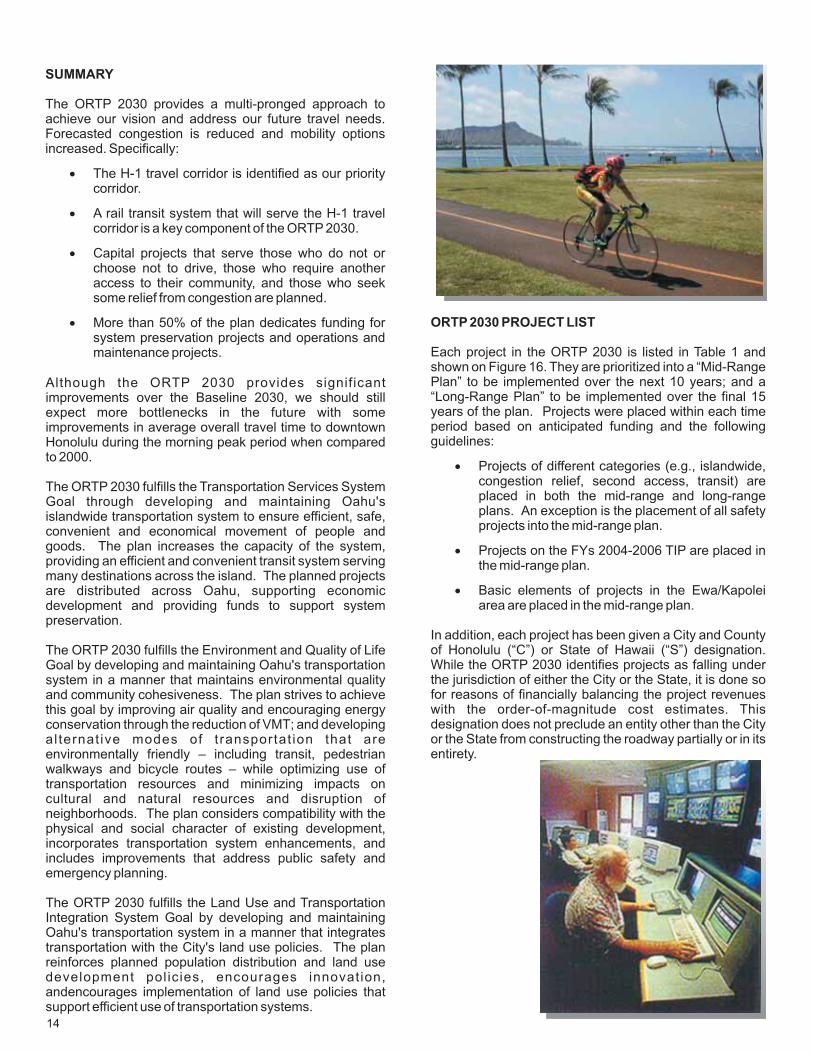
One hallmark of a livable city is that its public spaces areactively used and the outdoors can be enjoyed. Honolulu isa great city for bicycles with its physical beauty, mild year-round climate, relatively flat coastal plain and compactform. Enhancing the appealing qualities of Oahu can beachieved in part by integrating bicycle facilities as a keycomponent of the transportation system. The ORTP 2030incorporates the Oahu elements of andthe “Priority One” projects identified in the
. This provides Honolulu with an integratednetwork of on-road bike lanes and off-road shared-usepaths to link people with their favorite destinations.
Bike Plan Hawaii
Honolulu Bicycle
Master Plan
TDM and TSM
Transportation Demand Management (TDM) andTransportation System Management (TSM) programsconsist of measures that are designed to reduce thedemand and increase the efficiency of the transportationsystem. The TDM and TSM programs for Oahu includefacilities to enhance flow, such as HOV lanes on freeways,park-and-ride lots, bus-only lanes on city streets, and evenseparate HOV facilities. Also included are programs tohelp form and maintain carpools and vanpools as well asprograms to give people incentives to rideshare.
Pedestrian Facilities
The majority of us walk to get to our cars, catch a bus, andrun errands on our lunch breaks. Some of us walk forexercise as well as to get to work and to shop. In pastplans, pedestrian facilities were combined with bicyclefacilities. We recognize that the needs of pedestrians are,in many cases, different from those of bicyclists. Toaddress this difference, the ORTP 2030 includesdevelopment of a pedestrian plan for Oahu as part of theEnhancement Projects.
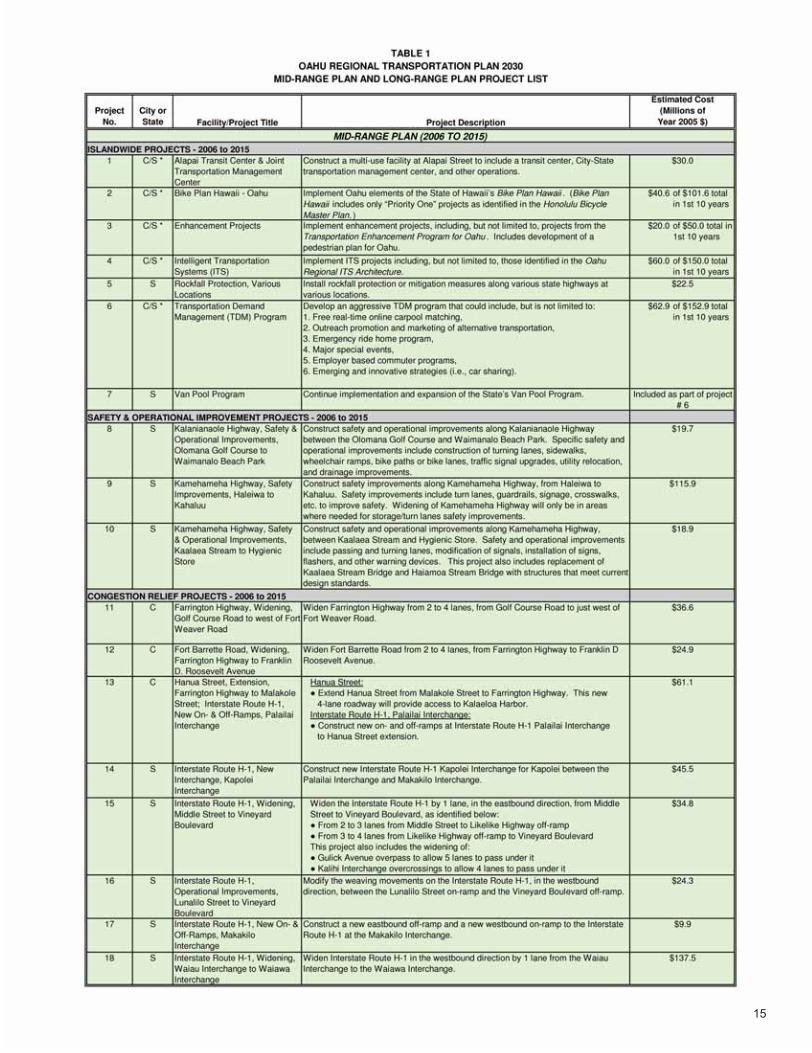
Intelligent Transportation Systems
The ORTP 2030 contains an intelligent transportationsystems (ITS) line item. ITS is a collection of technologiesthat enable multiple agencies to work together to managethe transportation network better. ITS can includeservices for highways, transit services, commercial vehicleoperations, and emergency service providers. ITStechnologies can be used for emergency response andincident management. They are effective in lessening theamount of time it takes to clear an accident on the freewayas well as providing travelers with information on trafficconditions and transit schedules.
156
SecondAccess Highways
While the coastal plains are relatively flat, Oahu's interiorterrain is divided by two primary mountain ranges that canmake access between communities difficult. Many of theestablished communities on the island have only oneroadway into and out of the area. Providing a secondmeans of access to these communities serves to increasethe capacity to these areas and to provide neededemergency access. Four “second access” projects areincluded in the ORTP 2030 for Makakilo, Mililani Mauka,Wahiawa, and the Waianae Coast.
Operations, Maintenance and System Preservation
The ORTP 2030 recognizes the importance of the existingand future roadways and transit systems from theperspective of operations, maintenance and preservation.The plan includes the allocation of funding for thesecategories totaling $7.47 billion or approximately 55% ofthe plan cost. This funding covers both City and Statefacilities.
City operations and maintenance funding includesoperating the public transit system (TheBus, paratransit,the proposed rail system, and the proposed commuterferry system), transit vehicle replacement, and roadwaysystem maintenance and operations. A total ofapproximately $5.62 billion is estimated for City operationsand maintenance over the 25-year life of the plan,consisting of about $4.675 billion for transit operations andmaintenance, $414 million for replacement of the existingbus fleet (identified as part of “Transit Capital: Non-Rail” inFigures 19 and 20), and $532 million for roadway systemmaintenance and operations.
Maintenance and operation of the State's existing andfuture highway operations and routine maintenanceincludes, but is not limited to, pavement repair, guardrailand shoulder improvements, lighting improvements,drainage improvements, sign upgrades and replacement,traffic signal upgrade and retrofit. About $850 million isallocated in the plan for State maintenance andoperations.
714
The ORTP 2030 allocates $1.0 billion over the life of theplan to preserving the highway system through projectsincluding, but not limited to, bridge replacement andseismic retrofit, pavement preventative maintenance,erosion control, viaduct improvements, and roadresurfacing and rehabilitation projects.
The ORTP 2030 planning process identified manypotential projects that could prove beneficial astransportation improvements for the island of Oahu, but2030 revenue projections could not support inclusion ofthese projects in the ORTP 2030 at this time. As part of theendorsement of the ORTP 2030, the OahuMPO PolicyCommittee identified a subset of those projects as“illustrative projects.”
Illustrative projects are those projects that are consideredhigh-priority for inclusion into the regional transportationplan should additional, firmly-established funding revenuesources become available. Illustrative projects are notconsidered to be a part of the officially endorsed regionaltransportation plan. Projects considered in the plandevelopment and included on the ORTP 2030 illustrativeprojects list include the concept of a Pearl Harbor crossing(tunnel or bridge) and elevated reversible high occupancytoll (“HOT”) lanes within the H-1 travel corridor.
Illustrative Projects
SUMMARY
The ORTP 2030 provides a multi-pronged approach toachieve our vision and address our future travel needs.Forecasted congestion is reduced and mobility optionsincreased. Specifically:
The H-1 travel corridor is identified as our prioritycorridor.
A rail transit system that will serve the H-1 travelcorridor is a key component of the ORTP 2030.
Capital projects that serve those who do not orchoose not to drive, those who require anotheraccess to their community, and those who seeksome relief from congestion are planned.
More than 50% of the plan dedicates funding forsystem preservation projects and operations andmaintenance projects.
�
�
�
�
Although the ORTP 2030 provides significantimprovements over the Baseline 2030, we should stillexpect more bottlenecks in the future with someimprovements in average overall travel time to downtownHonolulu during the morning peak period when comparedto 2000.
The ORTP 2030 fulfills the Transportation Services SystemGoal through developing and maintaining Oahu'sislandwide transportation system to ensure efficient, safe,convenient and economical movement of people andgoods. The plan increases the capacity of the system,providing an efficient and convenient transit system servingmany destinations across the island. The planned projectsare distributed across Oahu, supporting economicdevelopment and providing funds to support systempreservation.
The ORTP 2030 fulfills the Environment and Quality of LifeGoal by developing and maintaining Oahu's transportationsystem in a manner that maintains environmental qualityand community cohesiveness. The plan strives to achievethis goal by improving air quality and encouraging energyconservation through the reduction of VMT; and developingalternat ive modes of transportat ion that areenvironmentally friendly – including transit, pedestrianwalkways and bicycle routes – while optimizing use oftransportation resources and minimizing impacts oncultural and natural resources and disruption ofneighborhoods. The plan considers compatibility with thephysical and social character of existing development,incorporates transportation system enhancements, andincludes improvements that address public safety andemergency planning.
The ORTP 2030 fulfills the Land Use and TransportationIntegration System Goal by developing and maintainingOahu's transportation system in a manner that integratestransportation with the City's land use policies. The planreinforces planned population distribution and land usedevelopment pol icies, encourages innovation,andencourages implementation of land use policies thatsupport efficient use of transportation systems.
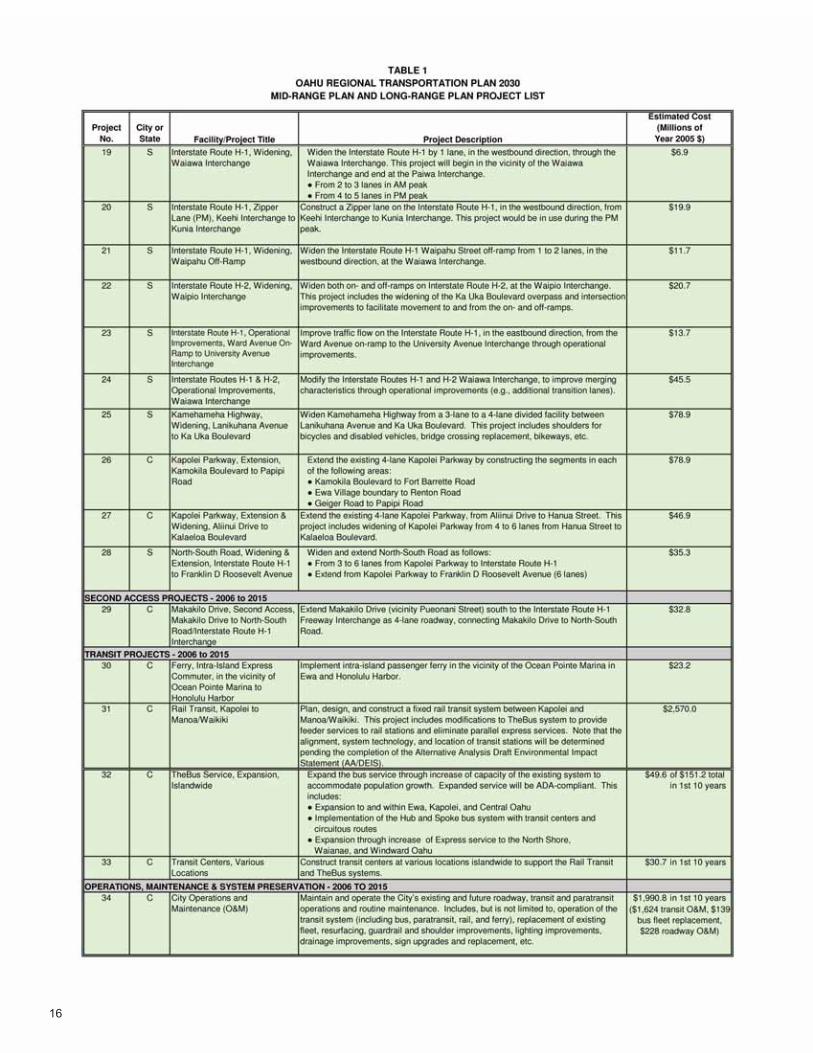
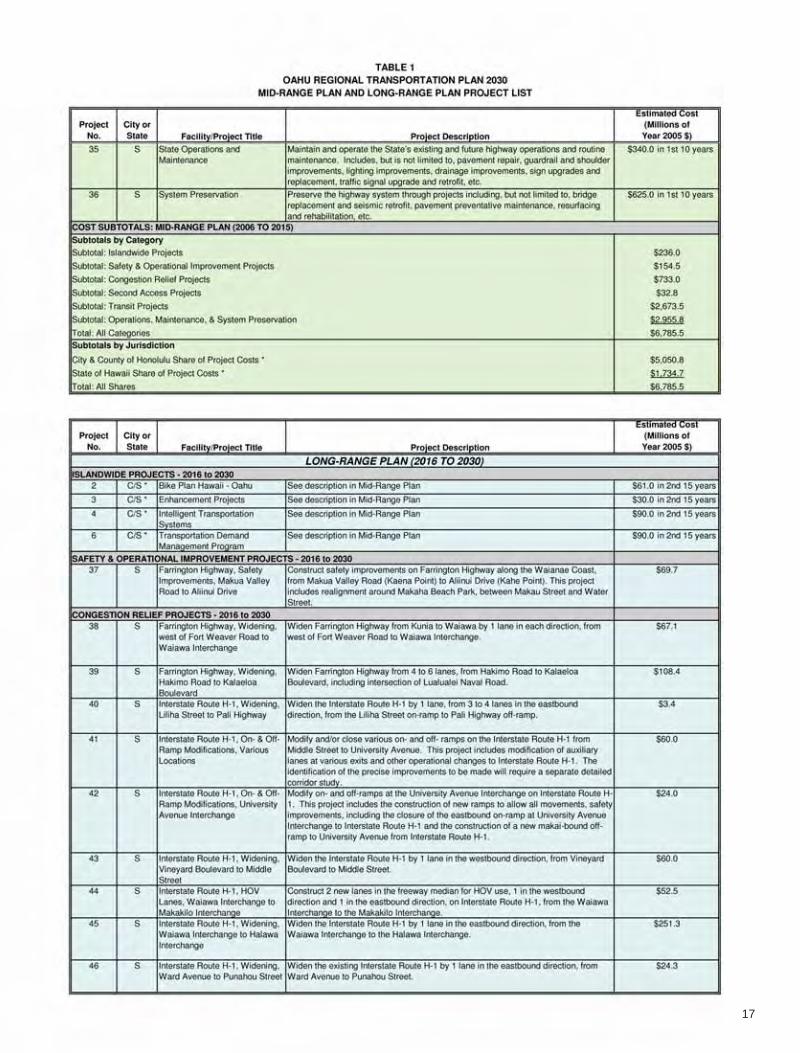
ORTP 2030 PROJECT LIST
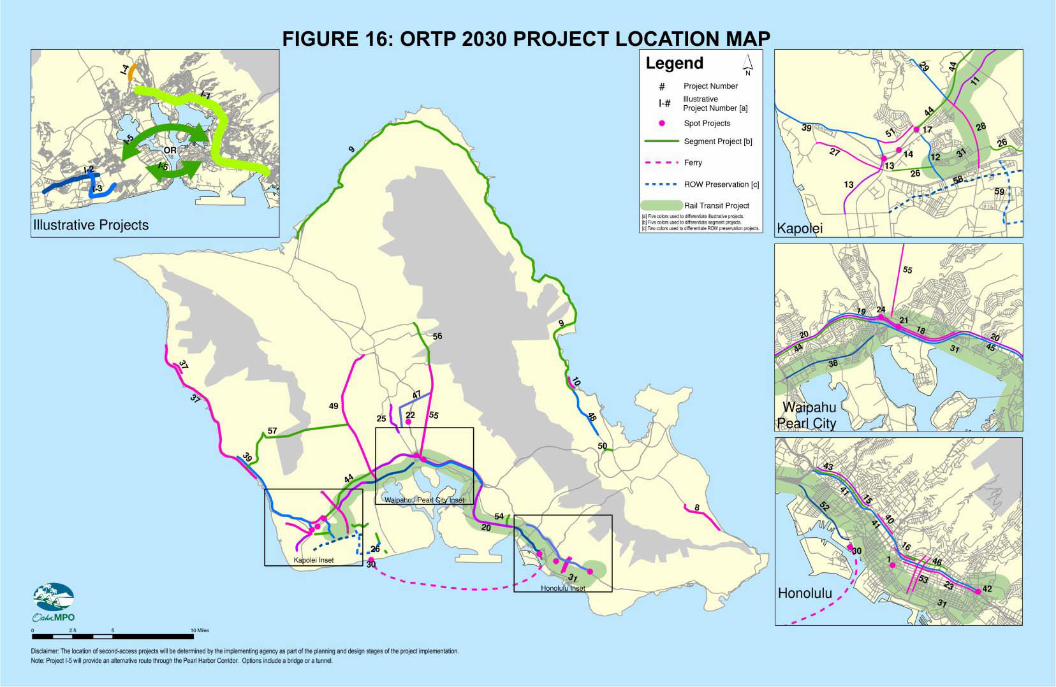
Each project in the ORTP 2030 is listed in Table 1 andshown on Figure 16. They are prioritized into a “Mid-RangePlan” to be implemented over the next 10 years; and a“Long-Range Plan” to be implemented over the final 15years of the plan. Projects were placed within each timeperiod based on anticipated funding and the followingguidelines:
Projects of different categories (e.g., islandwide,congestion relief, second access, transit) areplaced in both the mid-range and long-rangeplans. An exception is the placement of all safetyprojects into the mid-range plan.
Projects on the FYs 2004-2006 TIP are placed inthe mid-range plan.
Basic elements of projects in the Ewa/Kapoleiarea are placed in the mid-range plan.
In addition, each project has been given a City and Countyof Honolulu (“C”) or State of Hawaii (“S”) designation.While the ORTP 2030 identifies projects as falling underthe jurisdiction of either the City or the State, it is done sofor reasons of financially balancing the project revenueswith the order-of-magnitude cost estimates. Thisdesignation does not preclude an entity other than the Cityor the State from constructing the roadway partially or in itsentirety.
�
�
�
FIGURE 5: YEAR 2000 DAILY RESIDENT PERSON TRIPS
FIGURE 6: BASELINE YEAR 2030
DAILY RESIDENT PERSON TRIPS
FIGURE 7: ORTP 2030 DAILY RESIDENT PERSON TRIPS
HOW THE PROJECTS WORK TOGETHER
Between 2000 and 2030, we project that the number of tripspeople make will increase by just over 30%. This meansabout a third more people wanting to go to work, school,stores, beach and other places. Travel forecasting modelswere used to estimate how projects contained in the ORTP2030 would collectively handle this demand. To helpevaluate the quality of our future transportation system,comparisons were made between the ORTP 2030 and 1)Year 2000 conditions, and 2) Baseline 2030 conditions.
Comparing the ORTP 2030 to the Year 2000 conditions:
Although we do not expect the percentage of peoplebiking or walking to significantly change, transitridership is projected to increase. As seen in Figures5 and 7, the transit mode share is projected toincrease from 5.7% to 8.9%, which translates intoabout 166,000 additional transit trips (170,000 withvisitor transit trips as shown in Figure 15). Althoughthe percentage of automobile trips is expected todecrease from 84.0% to 81.0%, there is stillprojected to be over 600,000 additional automobiletrips.
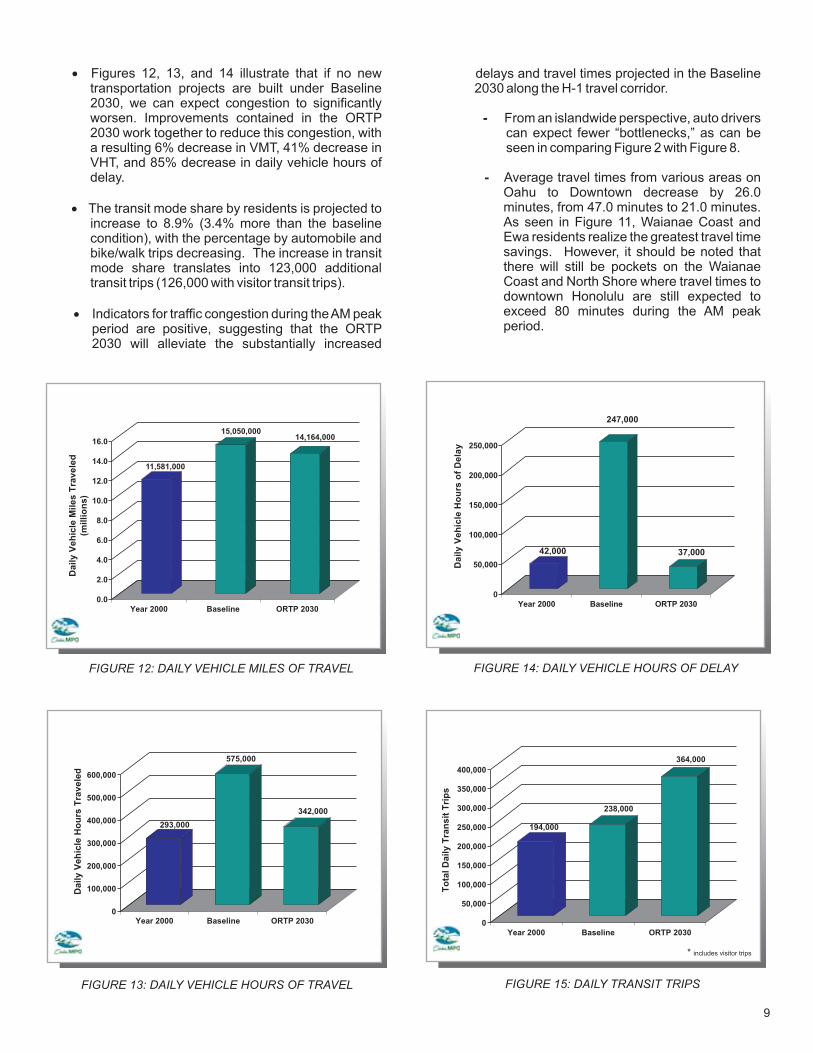
The added population growth and roadways in theORTP 2030 will generate more travel during the day,resulting in a 22% increase in vehicle miles traveled(VMT) and 17% increase in vehicle hours traveled(VHT), as seen in Figures 12 and 13, respectively.
�
�
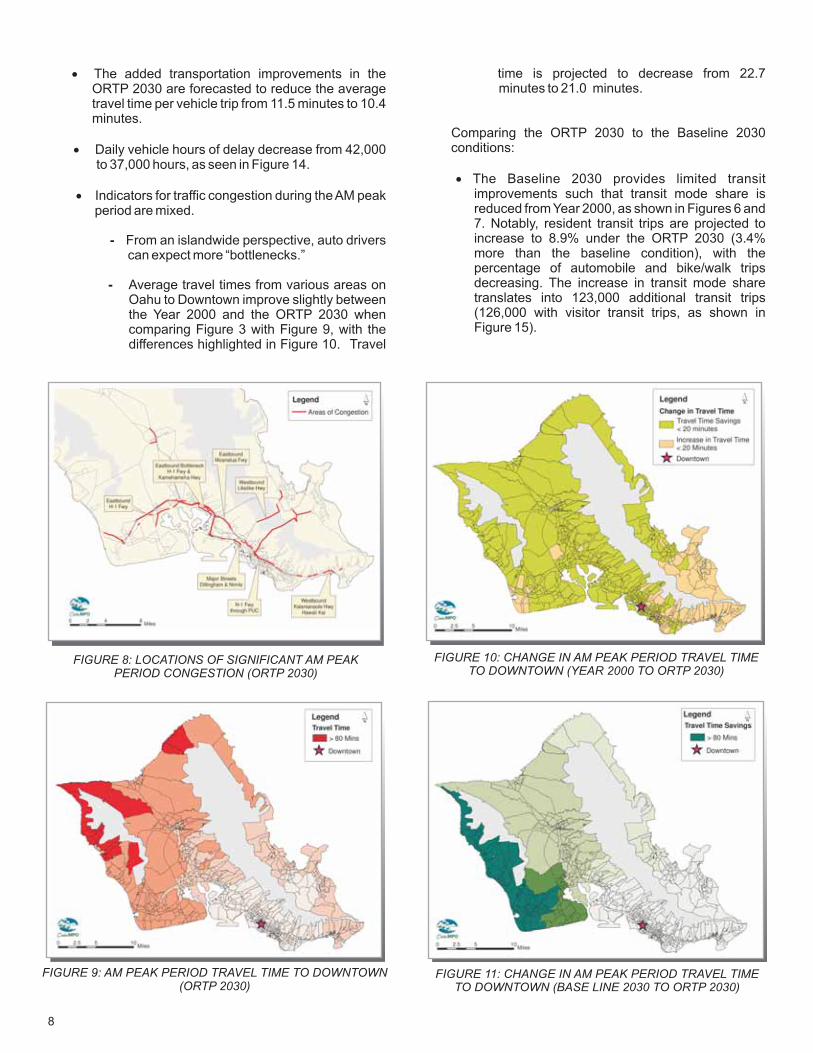
FIGURE 8: LOCATIONS OF SIGNIFICANT AM PEAK
PERIOD CONGESTION (ORTP 2030)
13
FIGURE 9: AM PEAK PERIOD TRAVEL TIME TO DOWNTOWN
(ORTP 2030)
FIGURE 10: CHANGE IN AM PEAK PERIOD TRAVEL TIME
TO DOWNTOWN (YEAR 2000 TO ORTP 2030)
The plan provides $1.0 billion for highway systempreservation. Maintenance and preservation of thetransportation system is important because it provides asafe and efficient system for Oahu's roadway users.Without timely maintenance, the life of the transportationsystem would be shortened, leading to more expensivereplacement costs as the system fails prematurely. Theplan also sets aside $1.38 billion for highway operations
FIGURE 20: PROJECT CAPITAL COSTS BY TYPE
(Millions of Constant 2005 Dollars)
$680
(10%)
$1,870
(29%)
$224
(3%)
$507
(8%)$628
(10%)
$2,570
(40%)
$6,480 Million Total
Islandwide
CongestionRelief
2ndAccess
Transit Capital:(Rail)
TransitCapital:
(Non Rail)
Safety & Operations
FIGURE 19: ESTIMATED PLAN COSTS:2006-2030
(Millions of Constant 2005 Dollars)
Cost of Plan
The ORTP is a financially balanced plan; the total cost forthe 25-year plan is limited to $13.54 billion. The costestimates for the plan include capital improvementprojects, costs to operate and maintain the current andexpanded transit system, and costs to maintain andpreserve the highway system, as identified in Figure 19.
Revenue projections are used to estimate the level oftransportation “supply” Oahu can reasonably afford andare based on the best available information. The primarypurpose of these projections is to ensure the financialviability of the ORTP 2030 from a regional perspective. Asprojects move from the ORTP 2030 to the development ofindividual projects, funding assumptions (e.g., source offunds, level of funding, etc.) may be modified. Generally,these modifications should not substantially affect theORTP 2030 financial plan. Revisions to the ORTP and itsfinancial plan can be made during its regular five-yearupdate cycle or when an action triggers the need for suchan adjustment. Amendments to the ORTP 2030 financialplan may be made if major changes are made to thefunding assumptions that would affect the plan's financialviability.
FIGURE 21: SYSTEM PRESERVATION COSTS
(Millions of Constant 2005 Dollars)
$0
$50
$100
$150
$200
$250
$300
$350
$400
5-Year Period
5-Y
ear
Esti
mate
dC
ost
2006-2010 2011-2015 2016-2020 2021-2025 2026-2030
and routine maintenance ($0.85 billion for State and $0.53billion for City & County), and $4.68 billion to operate thetransit system (bus, paratransit, ferry, and rail), of which$144 million is to operate and maintain the commuter ferry.
The ORTP 2030 includes more than $6.48 billion in capitalcosts, as seen in Figure 20: $3.28 billion for highwayconstruction, $0.63 billion to implement a ferry system,purchase new buses and construct transit centers, and$2.57 billion to build the rail system.
In order to counter some of the neglect of the past, the planincreases spending for system preservation in the earlyyears, then reduces the amount of spending in later yearsback to traditional levels, as shown in Figure 21.
The financial plan for the ORTP 2030 is balanced, withprojected revenues and estimated costs matched at$13.54 billion over the 25-year period of the plan.
FIGURE 11: CHANGE IN AM PEAK PERIOD TRAVEL TIME
TO DOWNTOWN (BASE LINE 2030 TO ORTP 2030)
8
* O&M = Operations and Maintenances
Note: Individual numbers may not sum to totals due to rounding
$680(10%)
�
�
�
The added transportation improvements in theORTP 2030 are forecasted to reduce the averagetravel time per vehicle trip from 11.5 minutes to 10.4minutes.
Daily vehicle hours of delay decrease from 42,000to 37,000 hours, as seen in Figure 14.
Indicators for traffic congestion during theAM peakperiod are mixed.
From an islandwide perspective, auto driverscan expect more “bottlenecks.”
Average travel times from various areas onOahu to Downtown improve slightly betweenthe Year 2000 and the ORTP 2030 whencomparing Figure 3 with Figure 9, with thedifferences highlighted in Figure 10. Travel
-
-
time is projected to decrease from 22.7minutes to 21.0 minutes.
Comparing the ORTP 2030 to the Baseline 2030conditions:
The Baseline 2030 provides limited transitimprovements such that transit mode share isreduced from Year 2000, as shown in Figures 6 and7. Notably, resident transit trips are projected toincrease to 8.9% under the ORTP 2030 (3.4%more than the baseline condition), with thepercentage of automobile and bike/walk tripsdecreasing. The increase in transit mode sharetranslates into 123,000 additional transit trips(126,000 with visitor transit trips, as shown inFigure 15).
�
12
FIGURE 12: DAILY VEHICLE MILES OF TRAVEL
11,581,000
15,050,00014,164,000
FIGURE 14: DAILY VEHICLE HOURS OF DELAY
42,000
247,000
37,000
9
FIGURE 15: DAILY TRANSIT TRIPSFIGURE 13: DAILY VEHICLE HOURS OF TRAVEL
0.0
2.0
4.0
6.0
8.0
10.0
12.0
14.0
16.0
Da
ily
Ve
hic
leM
ile
sT
rav
ele
d
(mil
lio
ns
)
Year 2000 Baseline ORTP 2030
0
100,000
200,000
300,000
400,000
500,000
600,000
Da
ily
Ve
hic
leH
ou
rsT
rav
ele
d
Year 2000 Baseline ORTP 2030
0
50,000
100,000
150,000
200,000
250,000
Da
ily
Ve
hic
leH
ou
rso
fD
ela
y
Year 2000 Baseline ORTP 2030
0
50,000
100,000
150,000
200,000
250,000
300,000
350,000
400,000
To
tal
Da
ily
Tra
ns
itT
rip
s
Year 2000 Baseline ORTP 2030
575,000
342,000
293,000
238,000
364,000
194,000
* includes visitor trips
$2,891
(21%)
$6,158
(45%)
$1,404
(10%)
$429
(3%)
Developer
Funding
$2,654
(20%)
$2,041
(15%)
$1,329
(10%)
$665
(5%)
$2,123
(16%)
TransitFares
GeneralFund
Highway Fund
GETSurchargefor Transit
StateRevenues Improvement Funds*
* General Improvement Bond Fund,Highway Improvement Bond Fund &Capital Projects Fund
FederalRevenues
City & CountyRevenues
$13,537 Million Total
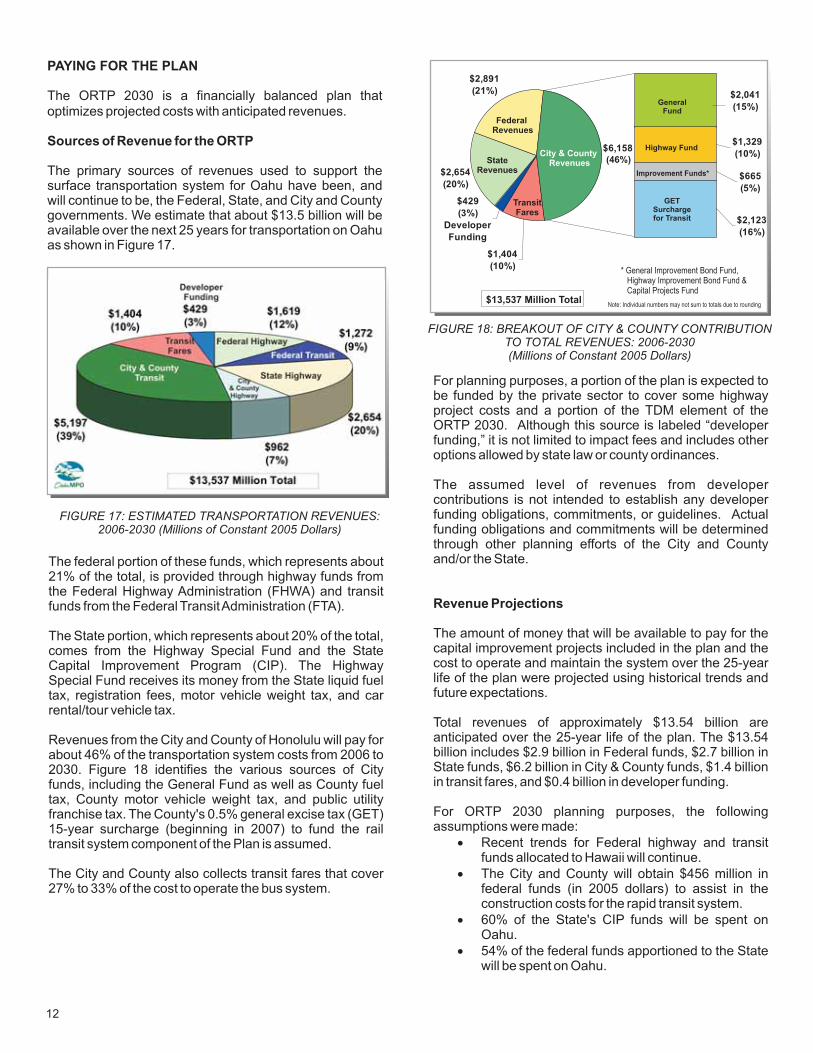
The federal portion of these funds, which represents about21% of the total, is provided through highway funds fromthe Federal Highway Administration (FHWA) and transitfunds from the Federal TransitAdministration (FTA).
The State portion, which represents about 20% of the total,comes from the Highway Special Fund and the StateCapital Improvement Program (CIP). The HighwaySpecial Fund receives its money from the State liquid fueltax, registration fees, motor vehicle weight tax, and carrental/tour vehicle tax.
Revenues from the City and County of Honolulu will pay forabout 46% of the transportation system costs from 2006 to2030. Figure 18 identifies the various sources of Cityfunds, including the General Fund as well as County fueltax, County motor vehicle weight tax, and public utilityfranchise tax. The County's 0.5% general excise tax (GET)15-year surcharge (beginning in 2007) to fund the railtransit system component of the Plan is assumed.
The City and County also collects transit fares that cover27% to 33% of the cost to operate the bus system.
For planning purposes, a portion of the plan is expected tobe funded by the private sector to cover some highwayproject costs and a portion of the TDM element of theORTP 2030. Although this source is labeled “developerfunding,” it is not limited to impact fees and includes otheroptions allowed by state law or county ordinances.
funding obligations, commitments, or guidelines. Actualfunding obligations and commitments will be determinedthrough other planning efforts of the City and Countyand/or the State.
The amount of money that will be available to pay for thecapital improvement projects included in the plan and thecost to operate and maintain the system over the 25-yearlife of the plan were projected using historical trends andfuture expectations.
Total revenues of approximately $13.54 billion areanticipated over the 25-year life of the plan. The $13.54billion includes $2.9 billion in Federal funds, $2.7 billion inState funds, $6.2 billion in City & County funds, $1.4 billionin transit fares, and $0.4 billion in developer funding.
For ORTP 2030 planning purposes, the followingassumptions were made:
Recent trends for Federal highway and transitfunds allocated to Hawaii will continue.
The City and County will obtain $456 million infederal funds (in 2005 dollars) to assist in theconstruction costs for the rapid transit system.
60% of the State's CIP funds will be spent onOahu.
54% of the federal funds apportioned to the Statewill be spent on Oahu.
The assumed level of revenues from developercontributions is not intended to establish any developer
Revenue Projections
�
�
�
�
PAYING FOR THE PLAN
Sources of Revenue for the ORTP
The ORTP 2030 is a financially balanced plan thatoptimizes projected costs with anticipated revenues.
The primary sources of revenues used to support thesurface transportation system for Oahu have been, andwill continue to be, the Federal, State, and City and Countygovernments. We estimate that about $13.5 billion will beavailable over the next 25 years for transportation on Oahuas shown in Figure 17.
FIGURE 18: BREAKOUT OF CITY & COUNTY CONTRIBUTION
TO TOTAL REVENUES: 2006-2030
(Millions of Constant 2005 Dollars)
FIGURE 17: ESTIMATED TRANSPORTATION REVENUES:
2006-2030 (Millions of Constant 2005 Dollars)
delays and travel times projected in the Baseline2030 along the H-1 travel corridor.
From an islandwide perspective, auto driverscan expect fewer “bottlenecks,” as can beseen in comparing Figure 2 with Figure 8.
Average travel times from various areas onOahu to Downtown decrease by 26.0minutes, from 47.0 minutes to 21.0 minutes.As seen in Figure 11, Waianae Coast andEwa residents realize the greatest travel timesavings. However, it should be noted thatthere will still be pockets on the WaianaeCoast and North Shore where travel times todowntown Honolulu are still expected toexceed 80 minutes during the AM peakperiod.
-
-
Figures 12, 13, and 14 illustrate that if no newtransportation projects are built under Baseline2030, we can expect congestion to significantlyworsen. Improvements contained in the ORTP2030 work together to reduce this congestion, witha resulting 6% decrease in VMT, 41% decrease inVHT, and 85% decrease in daily vehicle hours ofdelay.
mode share translates into 123,000 additionaltransit trips (126,000 with visitor transit trips).
Indicators for traffic congestion during theAM peakperiod are positive, suggesting that the ORTP2030 will alleviate the substantially increased
�
�
� The transit mode share by residents is projected toincrease to 8.9% (3.4% more than the baselinecondition), with the percentage by automobile andbike/walk trips decreasing. The increase in transit
Note: Individual numbers may not sum to totals due to rounding
(46%)
12
FIGURE 12: DAILY VEHICLE MILES OF TRAVEL
11,581,000
15,050,00014,164,000
FIGURE 14: DAILY VEHICLE HOURS OF DELAY
42,000
247,000
37,000
9
FIGURE 15: DAILY TRANSIT TRIPSFIGURE 13: DAILY VEHICLE HOURS OF TRAVEL
0.0
2.0
4.0
6.0
8.0
10.0
12.0
14.0
16.0
Da
ily
Ve
hic
leM
ile
sT
rav
ele
d
(mil
lio
ns
)
Year 2000 Baseline ORTP 2030
0
100,000
200,000
300,000
400,000
500,000
600,000
Da
ily
Ve
hic
leH
ou
rsT
rav
ele
d
Year 2000 Baseline ORTP 2030
0
50,000
100,000
150,000
200,000
250,000
Da
ily
Ve
hic
leH
ou
rso
fD
ela
y
Year 2000 Baseline ORTP 2030
0
50,000
100,000
150,000
200,000
250,000
300,000
350,000
400,000
To
tal
Da
ily
Tra
ns
itT
rip
s
Year 2000 Baseline ORTP 2030
575,000
342,000
293,000
238,000
364,000
194,000
* includes visitor trips
$2,891
(21%)
$6,158
(45%)
$1,404
(10%)
$429
(3%)
Developer
Funding
$2,654
(20%)
$2,041
(15%)
$1,329
(10%)
$665
(5%)
$2,123
(16%)
TransitFares
GeneralFund
Highway Fund
GETSurchargefor Transit
StateRevenues Improvement Funds*
* General Improvement Bond Fund,Highway Improvement Bond Fund &Capital Projects Fund
FederalRevenues
City & CountyRevenues
$13,537 Million Total
The federal portion of these funds, which represents about21% of the total, is provided through highway funds fromthe Federal Highway Administration (FHWA) and transitfunds from the Federal TransitAdministration (FTA).
The State portion, which represents about 20% of the total,comes from the Highway Special Fund and the StateCapital Improvement Program (CIP). The HighwaySpecial Fund receives its money from the State liquid fueltax, registration fees, motor vehicle weight tax, and carrental/tour vehicle tax.
Revenues from the City and County of Honolulu will pay forabout 46% of the transportation system costs from 2006 to2030. Figure 18 identifies the various sources of Cityfunds, including the General Fund as well as County fueltax, County motor vehicle weight tax, and public utilityfranchise tax. The County's 0.5% general excise tax (GET)15-year surcharge (beginning in 2007) to fund the railtransit system component of the Plan is assumed.
The City and County also collects transit fares that cover27% to 33% of the cost to operate the bus system.
For planning purposes, a portion of the plan is expected tobe funded by the private sector to cover some highwayproject costs and a portion of the TDM element of theORTP 2030. Although this source is labeled “developerfunding,” it is not limited to impact fees and includes otheroptions allowed by state law or county ordinances.
funding obligations, commitments, or guidelines. Actualfunding obligations and commitments will be determinedthrough other planning efforts of the City and Countyand/or the State.
The amount of money that will be available to pay for thecapital improvement projects included in the plan and thecost to operate and maintain the system over the 25-yearlife of the plan were projected using historical trends andfuture expectations.
Total revenues of approximately $13.54 billion areanticipated over the 25-year life of the plan. The $13.54billion includes $2.9 billion in Federal funds, $2.7 billion inState funds, $6.2 billion in City & County funds, $1.4 billionin transit fares, and $0.4 billion in developer funding.
For ORTP 2030 planning purposes, the followingassumptions were made:
Recent trends for Federal highway and transitfunds allocated to Hawaii will continue.
The City and County will obtain $456 million infederal funds (in 2005 dollars) to assist in theconstruction costs for the rapid transit system.
60% of the State's CIP funds will be spent onOahu.
54% of the federal funds apportioned to the Statewill be spent on Oahu.
The assumed level of revenues from developercontributions is not intended to establish any developer
Revenue Projections
�
�
�
�
PAYING FOR THE PLAN
Sources of Revenue for the ORTP
The ORTP 2030 is a financially balanced plan thatoptimizes projected costs with anticipated revenues.
The primary sources of revenues used to support thesurface transportation system for Oahu have been, andwill continue to be, the Federal, State, and City and Countygovernments. We estimate that about $13.5 billion will beavailable over the next 25 years for transportation on Oahuas shown in Figure 17.
FIGURE 18: BREAKOUT OF CITY & COUNTY CONTRIBUTION
TO TOTAL REVENUES: 2006-2030
(Millions of Constant 2005 Dollars)
FIGURE 17: ESTIMATED TRANSPORTATION REVENUES:
2006-2030 (Millions of Constant 2005 Dollars)
delays and travel times projected in the Baseline2030 along the H-1 travel corridor.
From an islandwide perspective, auto driverscan expect fewer “bottlenecks,” as can beseen in comparing Figure 2 with Figure 8.
Average travel times from various areas onOahu to Downtown decrease by 26.0minutes, from 47.0 minutes to 21.0 minutes.As seen in Figure 11, Waianae Coast andEwa residents realize the greatest travel timesavings. However, it should be noted thatthere will still be pockets on the WaianaeCoast and North Shore where travel times todowntown Honolulu are still expected toexceed 80 minutes during the AM peakperiod.
-
-
Figures 12, 13, and 14 illustrate that if no newtransportation projects are built under Baseline2030, we can expect congestion to significantlyworsen. Improvements contained in the ORTP2030 work together to reduce this congestion, witha resulting 6% decrease in VMT, 41% decrease inVHT, and 85% decrease in daily vehicle hours ofdelay.
mode share translates into 123,000 additionaltransit trips (126,000 with visitor transit trips).
Indicators for traffic congestion during theAM peakperiod are positive, suggesting that the ORTP2030 will alleviate the substantially increased
�
�
� The transit mode share by residents is projected toincrease to 8.9% (3.4% more than the baselinecondition), with the percentage by automobile andbike/walk trips decreasing. The increase in transit
Note: Individual numbers may not sum to totals due to rounding
(46%)
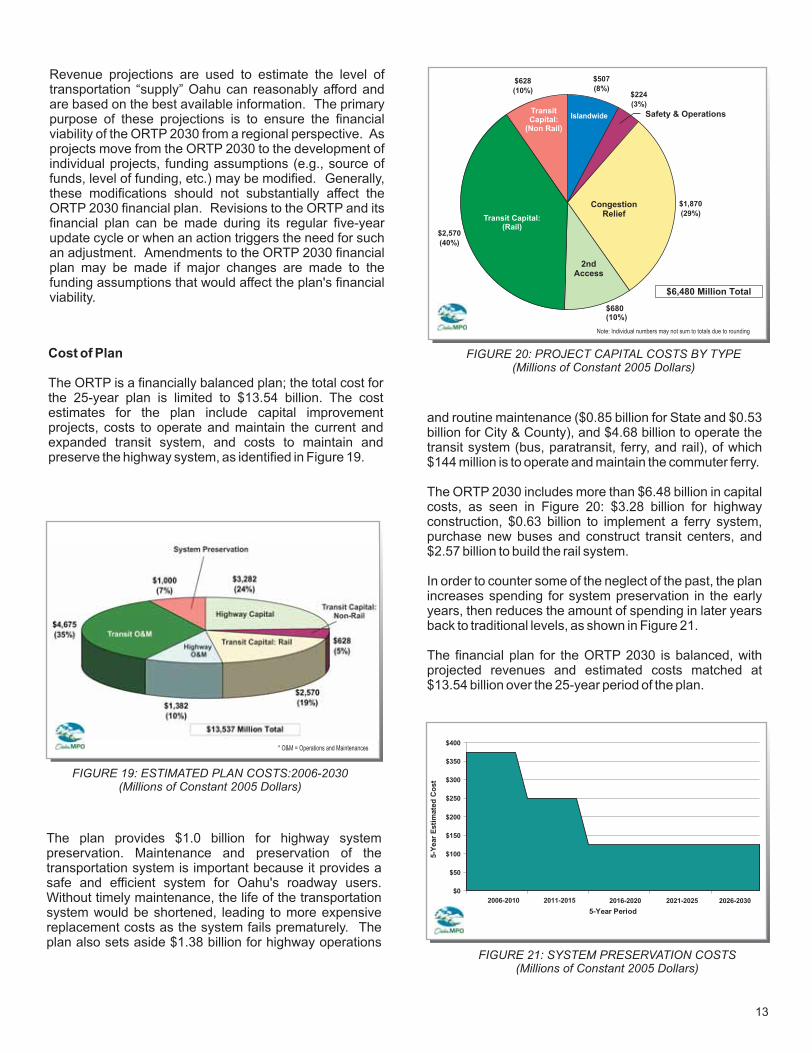
FIGURE 8: LOCATIONS OF SIGNIFICANT AM PEAK
PERIOD CONGESTION (ORTP 2030)
13
FIGURE 9: AM PEAK PERIOD TRAVEL TIME TO DOWNTOWN
(ORTP 2030)
FIGURE 10: CHANGE IN AM PEAK PERIOD TRAVEL TIME
TO DOWNTOWN (YEAR 2000 TO ORTP 2030)
The plan provides $1.0 billion for highway systempreservation. Maintenance and preservation of thetransportation system is important because it provides asafe and efficient system for Oahu's roadway users.Without timely maintenance, the life of the transportationsystem would be shortened, leading to more expensivereplacement costs as the system fails prematurely. Theplan also sets aside $1.38 billion for highway operations
FIGURE 20: PROJECT CAPITAL COSTS BY TYPE
(Millions of Constant 2005 Dollars)
$680
(10%)
$1,870
(29%)
$224
(3%)
$507
(8%)$628
(10%)
$2,570
(40%)
$6,480 Million Total
Islandwide
CongestionRelief
2ndAccess
Transit Capital:(Rail)
TransitCapital:
(Non Rail)
Safety & Operations
FIGURE 19: ESTIMATED PLAN COSTS:2006-2030
(Millions of Constant 2005 Dollars)
Cost of Plan
The ORTP is a financially balanced plan; the total cost forthe 25-year plan is limited to $13.54 billion. The costestimates for the plan include capital improvementprojects, costs to operate and maintain the current andexpanded transit system, and costs to maintain andpreserve the highway system, as identified in Figure 19.
Revenue projections are used to estimate the level oftransportation “supply” Oahu can reasonably afford andare based on the best available information. The primarypurpose of these projections is to ensure the financialviability of the ORTP 2030 from a regional perspective. Asprojects move from the ORTP 2030 to the development ofindividual projects, funding assumptions (e.g., source offunds, level of funding, etc.) may be modified. Generally,these modifications should not substantially affect theORTP 2030 financial plan. Revisions to the ORTP and itsfinancial plan can be made during its regular five-yearupdate cycle or when an action triggers the need for suchan adjustment. Amendments to the ORTP 2030 financialplan may be made if major changes are made to thefunding assumptions that would affect the plan's financialviability.
FIGURE 21: SYSTEM PRESERVATION COSTS
(Millions of Constant 2005 Dollars)
$0
$50
$100
$150
$200
$250
$300
$350
$400
5-Year Period
5-Y
ear
Esti
mate
dC
ost
2006-2010 2011-2015 2016-2020 2021-2025 2026-2030
and routine maintenance ($0.85 billion for State and $0.53billion for City & County), and $4.68 billion to operate thetransit system (bus, paratransit, ferry, and rail), of which$144 million is to operate and maintain the commuter ferry.
The ORTP 2030 includes more than $6.48 billion in capitalcosts, as seen in Figure 20: $3.28 billion for highwayconstruction, $0.63 billion to implement a ferry system,purchase new buses and construct transit centers, and$2.57 billion to build the rail system.
In order to counter some of the neglect of the past, the planincreases spending for system preservation in the earlyyears, then reduces the amount of spending in later yearsback to traditional levels, as shown in Figure 21.
The financial plan for the ORTP 2030 is balanced, withprojected revenues and estimated costs matched at$13.54 billion over the 25-year period of the plan.
FIGURE 11: CHANGE IN AM PEAK PERIOD TRAVEL TIME
TO DOWNTOWN (BASE LINE 2030 TO ORTP 2030)
8
* O&M = Operations and Maintenances
Note: Individual numbers may not sum to totals due to rounding
$680(10%)
�
�
�
The added transportation improvements in theORTP 2030 are forecasted to reduce the averagetravel time per vehicle trip from 11.5 minutes to 10.4minutes.
Daily vehicle hours of delay decrease from 42,000to 37,000 hours, as seen in Figure 14.
Indicators for traffic congestion during theAM peakperiod are mixed.
From an islandwide perspective, auto driverscan expect more “bottlenecks.”
Average travel times from various areas onOahu to Downtown improve slightly betweenthe Year 2000 and the ORTP 2030 whencomparing Figure 3 with Figure 9, with thedifferences highlighted in Figure 10. Travel
-
-
time is projected to decrease from 22.7minutes to 21.0 minutes.
Comparing the ORTP 2030 to the Baseline 2030conditions:
The Baseline 2030 provides limited transitimprovements such that transit mode share isreduced from Year 2000, as shown in Figures 6 and7. Notably, resident transit trips are projected toincrease to 8.9% under the ORTP 2030 (3.4%more than the baseline condition), with thepercentage of automobile and bike/walk tripsdecreasing. The increase in transit mode sharetranslates into 123,000 additional transit trips(126,000 with visitor transit trips, as shown inFigure 15).
�
714
The ORTP 2030 allocates $1.0 billion over the life of theplan to preserving the highway system through projectsincluding, but not limited to, bridge replacement andseismic retrofit, pavement preventative maintenance,erosion control, viaduct improvements, and roadresurfacing and rehabilitation projects.
The ORTP 2030 planning process identified manypotential projects that could prove beneficial astransportation improvements for the island of Oahu, but2030 revenue projections could not support inclusion ofthese projects in the ORTP 2030 at this time. As part of theendorsement of the ORTP 2030, the OahuMPO PolicyCommittee identified a subset of those projects as“illustrative projects.”
Illustrative projects are those projects that are consideredhigh-priority for inclusion into the regional transportationplan should additional, firmly-established funding revenuesources become available. Illustrative projects are notconsidered to be a part of the officially endorsed regionaltransportation plan. Projects considered in the plandevelopment and included on the ORTP 2030 illustrativeprojects list include the concept of a Pearl Harbor crossing(tunnel or bridge) and elevated reversible high occupancytoll (“HOT”) lanes within the H-1 travel corridor.
Illustrative Projects
SUMMARY
The ORTP 2030 provides a multi-pronged approach toachieve our vision and address our future travel needs.Forecasted congestion is reduced and mobility optionsincreased. Specifically:
The H-1 travel corridor is identified as our prioritycorridor.
A rail transit system that will serve the H-1 travelcorridor is a key component of the ORTP 2030.
Capital projects that serve those who do not orchoose not to drive, those who require anotheraccess to their community, and those who seeksome relief from congestion are planned.
More than 50% of the plan dedicates funding forsystem preservation projects and operations andmaintenance projects.
�
�
�
�
Although the ORTP 2030 provides significantimprovements over the Baseline 2030, we should stillexpect more bottlenecks in the future with someimprovements in average overall travel time to downtownHonolulu during the morning peak period when comparedto 2000.
The ORTP 2030 fulfills the Transportation Services SystemGoal through developing and maintaining Oahu'sislandwide transportation system to ensure efficient, safe,convenient and economical movement of people andgoods. The plan increases the capacity of the system,providing an efficient and convenient transit system servingmany destinations across the island. The planned projectsare distributed across Oahu, supporting economicdevelopment and providing funds to support systempreservation.
The ORTP 2030 fulfills the Environment and Quality of LifeGoal by developing and maintaining Oahu's transportationsystem in a manner that maintains environmental qualityand community cohesiveness. The plan strives to achievethis goal by improving air quality and encouraging energyconservation through the reduction of VMT; and developingalternat ive modes of transportat ion that areenvironmentally friendly – including transit, pedestrianwalkways and bicycle routes – while optimizing use oftransportation resources and minimizing impacts oncultural and natural resources and disruption ofneighborhoods. The plan considers compatibility with thephysical and social character of existing development,incorporates transportation system enhancements, andincludes improvements that address public safety andemergency planning.
The ORTP 2030 fulfills the Land Use and TransportationIntegration System Goal by developing and maintainingOahu's transportation system in a manner that integratestransportation with the City's land use policies. The planreinforces planned population distribution and land usedevelopment pol icies, encourages innovation,andencourages implementation of land use policies thatsupport efficient use of transportation systems.
ORTP 2030 PROJECT LIST
Each project in the ORTP 2030 is listed in Table 1 andshown on Figure 16. They are prioritized into a “Mid-RangePlan” to be implemented over the next 10 years; and a“Long-Range Plan” to be implemented over the final 15years of the plan. Projects were placed within each timeperiod based on anticipated funding and the followingguidelines:
Projects of different categories (e.g., islandwide,congestion relief, second access, transit) areplaced in both the mid-range and long-rangeplans. An exception is the placement of all safetyprojects into the mid-range plan.
Projects on the FYs 2004-2006 TIP are placed inthe mid-range plan.
Basic elements of projects in the Ewa/Kapoleiarea are placed in the mid-range plan.
In addition, each project has been given a City and Countyof Honolulu (“C”) or State of Hawaii (“S”) designation.While the ORTP 2030 identifies projects as falling underthe jurisdiction of either the City or the State, it is done sofor reasons of financially balancing the project revenueswith the order-of-magnitude cost estimates. Thisdesignation does not preclude an entity other than the Cityor the State from constructing the roadway partially or in itsentirety.
�
�
�
FIGURE 5: YEAR 2000 DAILY RESIDENT PERSON TRIPS
FIGURE 6: BASELINE YEAR 2030
DAILY RESIDENT PERSON TRIPS
FIGURE 7: ORTP 2030 DAILY RESIDENT PERSON TRIPS
HOW THE PROJECTS WORK TOGETHER
Between 2000 and 2030, we project that the number of tripspeople make will increase by just over 30%. This meansabout a third more people wanting to go to work, school,stores, beach and other places. Travel forecasting modelswere used to estimate how projects contained in the ORTP2030 would collectively handle this demand. To helpevaluate the quality of our future transportation system,comparisons were made between the ORTP 2030 and 1)Year 2000 conditions, and 2) Baseline 2030 conditions.
Comparing the ORTP 2030 to the Year 2000 conditions:
Although we do not expect the percentage of peoplebiking or walking to significantly change, transitridership is projected to increase. As seen in Figures5 and 7, the transit mode share is projected toincrease from 5.7% to 8.9%, which translates intoabout 166,000 additional transit trips (170,000 withvisitor transit trips as shown in Figure 15). Althoughthe percentage of automobile trips is expected todecrease from 84.0% to 81.0%, there is stillprojected to be over 600,000 additional automobiletrips.
The added population growth and roadways in theORTP 2030 will generate more travel during the day,resulting in a 22% increase in vehicle miles traveled(VMT) and 17% increase in vehicle hours traveled(VHT), as seen in Figures 12 and 13, respectively.
�
�
TDM and TSM
Transportation Demand Management (TDM) andTransportation System Management (TSM) programsconsist of measures that are designed to reduce thedemand and increase the efficiency of the transportationsystem. The TDM and TSM programs for Oahu includefacilities to enhance flow, such as HOV lanes on freeways,park-and-ride lots, bus-only lanes on city streets, and evenseparate HOV facilities. Also included are programs tohelp form and maintain carpools and vanpools as well asprograms to give people incentives to rideshare.
Pedestrian Facilities
The majority of us walk to get to our cars, catch a bus, andrun errands on our lunch breaks. Some of us walk forexercise as well as to get to work and to shop. In pastplans, pedestrian facilities were combined with bicyclefacilities. We recognize that the needs of pedestrians are,in many cases, different from those of bicyclists. Toaddress this difference, the ORTP 2030 includesdevelopment of a pedestrian plan for Oahu as part of theEnhancement Projects.
Intelligent Transportation Systems
The ORTP 2030 contains an intelligent transportationsystems (ITS) line item. ITS is a collection of technologiesthat enable multiple agencies to work together to managethe transportation network better. ITS can includeservices for highways, transit services, commercial vehicleoperations, and emergency service providers. ITStechnologies can be used for emergency response andincident management. They are effective in lessening theamount of time it takes to clear an accident on the freewayas well as providing travelers with information on trafficconditions and transit schedules.
156
SecondAccess Highways
While the coastal plains are relatively flat, Oahu's interiorterrain is divided by two primary mountain ranges that canmake access between communities difficult. Many of theestablished communities on the island have only oneroadway into and out of the area. Providing a secondmeans of access to these communities serves to increasethe capacity to these areas and to provide neededemergency access. Four “second access” projects areincluded in the ORTP 2030 for Makakilo, Mililani Mauka,Wahiawa, and the Waianae Coast.
Operations, Maintenance and System Preservation
The ORTP 2030 recognizes the importance of the existingand future roadways and transit systems from theperspective of operations, maintenance and preservation.The plan includes the allocation of funding for thesecategories totaling $7.47 billion or approximately 55% ofthe plan cost. This funding covers both City and Statefacilities.
City operations and maintenance funding includesoperating the public transit system (TheBus, paratransit,the proposed rail system, and the proposed commuterferry system), transit vehicle replacement, and roadwaysystem maintenance and operations. A total ofapproximately $5.62 billion is estimated for City operationsand maintenance over the 25-year life of the plan,consisting of about $4.675 billion for transit operations andmaintenance, $414 million for replacement of the existingbus fleet (identified as part of “Transit Capital: Non-Rail” inFigures 19 and 20), and $532 million for roadway systemmaintenance and operations.
Maintenance and operation of the State's existing andfuture highway operations and routine maintenanceincludes, but is not limited to, pavement repair, guardrailand shoulder improvements, lighting improvements,drainage improvements, sign upgrades and replacement,traffic signal upgrade and retrofit. About $850 million isallocated in the plan for State maintenance andoperations.
516
Transit System Expansion
While rail transit is the backbone of the transit system in theORTP 2030, the existing bus system will continue to be animportant element of public transportation. Many railsystem passengers are expected to access the systemusing City buses traveling to and from their destination.Expansion of the bus system will be focused primarily inEwa, with moderate increases in other parts of Oahu,including express bus service to rural areas. Purchasingand replacing new buses to support service increases areincluded in the plan.
An additional element of future transit service implementsan intra-island express ferry service from Ewa to HonoluluHarbor.
The proposed rail transit system from Kapolei toManoa/Waikiki will become the backbone of the transitsystem, connecting major employment and residentialcenters to each other and to downtown Honolulu. Thisproject also includes associated feeder bus services foreach station and access ramps and other freewayimprovements to facilitate the flow of buses thatsupplement the rail system.
Congestion Relief
The ORTP 2030 acknowledges that auto travel is, and willcontinue to be, a dominant travel mode and; subsequently,increases in roadway capacity will be required. This isespecially true in the H-1 travel corridor and wherecongestion is forecast to increase significantly if newprojects are not constructed. This plan provides anadditional 140 lane-miles to Oahu's major roadways.
As part of the ORTP 2030, new and expanded roadwayprojects are proposed for the Ewa area, Central Oahu, andPUC, where the majority of the residential andemployment growth is projected. For the Ewa area, theseprojects include expansion of several roadways like theNorth-South Road and Kapolei Parkway; new or modifiedfreeway interchanges in Kapolei and Makakilo; and thewidening of existing roadways such as FarringtonHighway, Fort Barrette Road and Kunia Road. Examplesof roadway projects in the Central Oahu area includeexpansion of Kamehameha Highway and H-1 between theWaiau and Waiawa Interchanges; and widening andimprovements at the H-1 and H-2 Waiawa Interchange.Several capacity enhancement projects to varioussections of Interstate Route H-1 from Pearl City todowntown Honolulu are also programmed.
Bicycle Facilities
One hallmark of a livable city is that its public spaces areactively used and the outdoors can be enjoyed. Honolulu isa great city for bicycles with its physical beauty, mild year-round climate, relatively flat coastal plain and compactform. Enhancing the appealing qualities of Oahu can beachieved in part by integrating bicycle facilities as a keycomponent of the transportation system. The ORTP 2030incorporates the Oahu elements of andthe “Priority One” projects identified in the
. This provides Honolulu with an integratednetwork of on-road bike lanes and off-road shared-usepaths to link people with their favorite destinations.
Bike Plan Hawaii
Honolulu Bicycle
Master Plan
4
the island's future transportation needs. These includemajor capital improvement projects that add to thesystem's person-carrying and vehicular capacities,projects that expand on the existing systems and servicesto optimize their use, increased focus on operational,management and preservation strategies, and programsthat help integrate the transportation system into the landuses of each community.
This vision also acknowledges the importance of the H-1travel corridor. The projects included in the transportationplan propose numerous ways to address the additionaltraffic congestion expected to increase along this travelcorridor:
A major component of the ORTP 2030 is a railt r ans i t sys tem be tween Kapo le i andManoa/Waikiki.Also included in the plan are projects to increasethe capacity of H-1 itself with new interchanges,additional High Occupancy Vehicle (HOV) lanes,freeway widening, and operational improvementsat key locations. These major H-1 travel corridorprojects are supplemented with two projects thatprovide alternatives to H-1: the intra-islandcommuter ferry from Ewa to downtown Honoluluand the Nimitz flyover HOV facility.The ORTP 2030 implements the island's bikewayplan, expands the bus system, includes severalsecond access/emergency access roadways andprojects to maximize the use of existing facilities,and other measures to reduce the need for autotravel.
The ORTP 2030 will advance us toward the vision foraddressing future growth and traffic on Oahu. To meet ourvision, the island-wide transportation plan for Oahu isdefined by three overarching goals.
The objectives guiding this goal include increasing capacityof the system, providing an efficient and convenient transitsystem, providing access to all important destinations,serving all intermodal terminals, ensuring that projects aredistributed equitably, ensuring that safety and security isprovided, integrating the entire system, supportingeconomic development and providing for systempreservation.
The objectives associated with this goal are directed atdeveloping a plan that satisfies noise, air and water qualitystandards; encourages energy conservation; preservescultural integrity and natural resources; developsalternative transportation modes that are environmentally
�
�
�
GOALS
Transportation Services System:
Environment and Quality of Life:
Develop and maintain
Oahu's islandwide transportation system to ensure
efficient, safe, convenient and economical movement of
people and goods.
Develop and maintain
Oahu's transportation system in a manner that maintains
environmental quality and community cohesiveness.
friendly, including pedestrian walkways and bicycle routes;optimizes use of transportation resources; minimizesdisruption of neighborhoods; ensures compatibility with thephysical and social character of existing development;incorporates landscaping and public safety; and plans foremergencies.
The objectives that support this goal reinforce plannedpopulation distribution and land use development policies,encourage innovation, and encourage implementation ofland use policies
The following provides descriptions of specific elements ofthe plan. Individual projects are listed on pages 15 through19.
Land Use and Transportation Integration SystemGoal: Develop and maintain Oahu's transportation system
in a manner that integrates land uses and transportation
that support efficient use of transportationsystems.
The ORTP 2030 is a financially-constrained plan thatprovides $6.07 billion for capital projects and $7.47 billionto operate, maintain, and preserve the highway and transitsystems. The projects contained in the ORTP 2030attempt to balance our need for mobility options,congestion relief, safety, second access, and bicycling andpedestrian facilities.
To improve mobility, a number of strategies and programsare proposed. These include new travel options such as railtransit and ferry systems that add to the system's person-carrying capacities; projects that expand upon the existingsystems and services to optimize their use; increasedfocus on operational, management and preservationstrategies; and programs that help integrate thetransportation system into the land uses of eachcommunity.
With regard to congestion relief, the technical analysis andpublic input received during this effort highlighted the needto focus on the H-1 travel corridor and the Ewa and CentralOahu areas. Preliminary analysis indicated that island-wide congestion could be significantly addressed byfocusing on the H-1 travel corridor. The need fortransportation infrastructure in the Ewa area is alreadyapparent and will increase in the future as population andemployment are projected to grow substantially. Additionalpopulation and employment increases are also projected inCentral Oahu.
OVERVIEW OF ORTP 2030 PROJECTS
Rail Transit System
A key component of the ORTP 2030 is a rail transit systemthat will serve the H-1 travel corridor. It is important to notethat building a rail system will not eliminate congestion.We will also not be able to eliminate congestion by buildingmore highways, for we do not have the resources to keepup with the demand. The rail transit system will givepriority to moving people rather than cars, will be a majorfactor in providing mobility options, and will work togetherwith our land use policies in shaping our city.
17
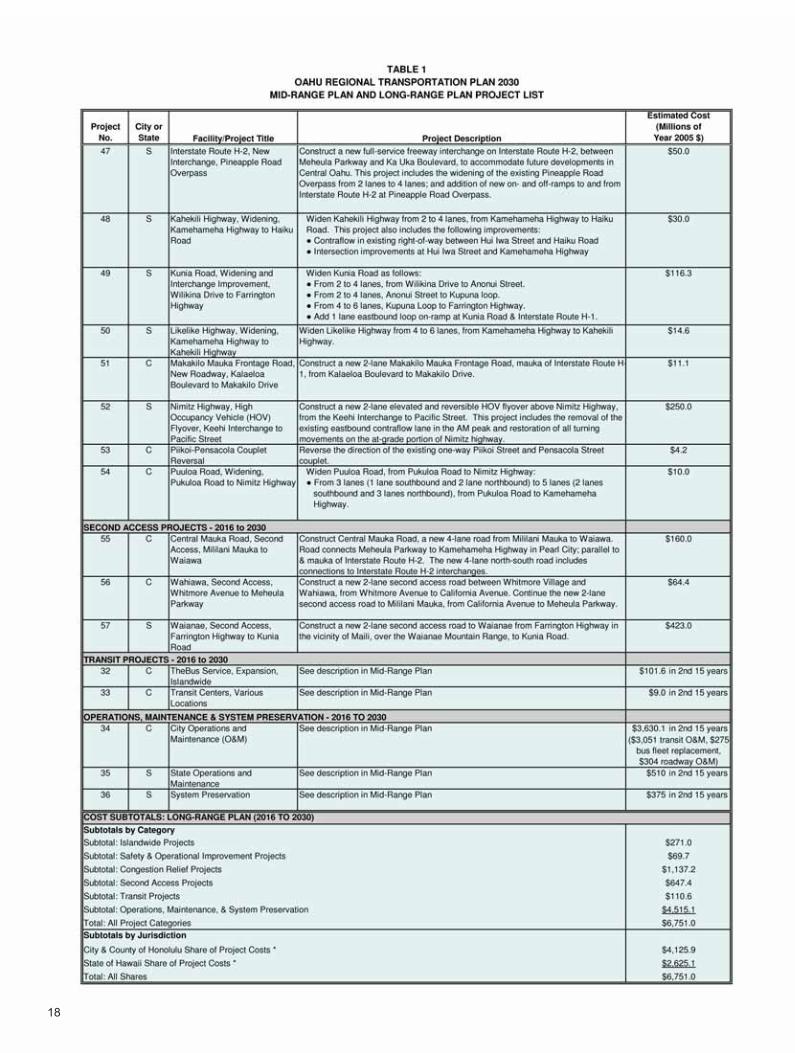
FIGURE 2: LOCATIONS OF SIGNIFICANT AM CONGESTION
(BASELINE 2030)
FIGURE 3: AM PEAK PERIOD TRAVEL TIME TO DOWNTOWN
(YEAR 2000)
3
The impact of the congested roadways corresponds toincreases in travel time for all Oahu residents; someincreases are huge, depending upon where they live andwork. Figure 3 shows the travel time from each area onOahu to downtown in the Year 2000. Figure 4 shows theprojected travel time from each area on Oahu to downtownHonolulu for the Baseline 2030 if nothing is done. Traveltimes in excess of 80 minutes are projected from thewestern and northern portions of the island to downtownHonolulu during theAM peak period.
Transportation and New Growth
As we continue to grow, more people and moreemployment opportunities mean more and more traffic;more clogged roads and more delays getting to work,school, stores, and the beach. As an illustration of howcongested the transportation system could become, a“Baseline 2030” analysis was conducted to estimate futuretraffic conditions if growth is allowed to occur but no newtransportation facilities are built. Figure 2 showssignificantly congested locations on Oahu during themorning peak hour in the Baseline 2030 analysis.
Challenges Facing Oahu
To solve the transportation puzzle, we must addressseveral challenges that Oahu will face over the next 25years:
We will have more people: more people who wantto go to work, to school, to shop, and to play,resulting in about 30% more travel.
Many of our major roadways are congested,especially those within the H-1 travel corridorbetween Manoa/Waikiki and Kapolei. As a result,residents on the Waianae Coast, in Ewa, and inCentral Oahu are experiencing some of the worstmorning commute travel times to downtown.
Established communities want additional accessfor times of emergency as well as congestionrelief.
Many of our existing roadways need to bemaintained, repaired, and rehabilitated.
Our numerous transportation needs areconstrained by our limited resources.
Our ultimate challenge is to decide how to allocate ourresources to meet our many needs. There is only so muchmoney available to fund transportation projects. Howmuch money should be spent to reduce congestion on ourroads, make our streets safer, provide more bikeways,create alternate accesses to communities, and maintainour roadways?
�
�
�
�
�
18
FIGURE 4: AM PEAK PERIOD TRAVEL TIME TO DOWNTOWN
(BASELINE 2030)
VISION FOR OAHU IN 2030
The vision for the ORTP 2030 is:
The first part of our vision focuses on increasing ourmobility options. We recognize that we cannot afford toeliminate congestion. To improve mobility, the ORTP 2030provides a number of strategies and programs to address
In 2030, Oahu is a place where transportation choices
are available and the importance of the H-1 travel
corridor is recognized.
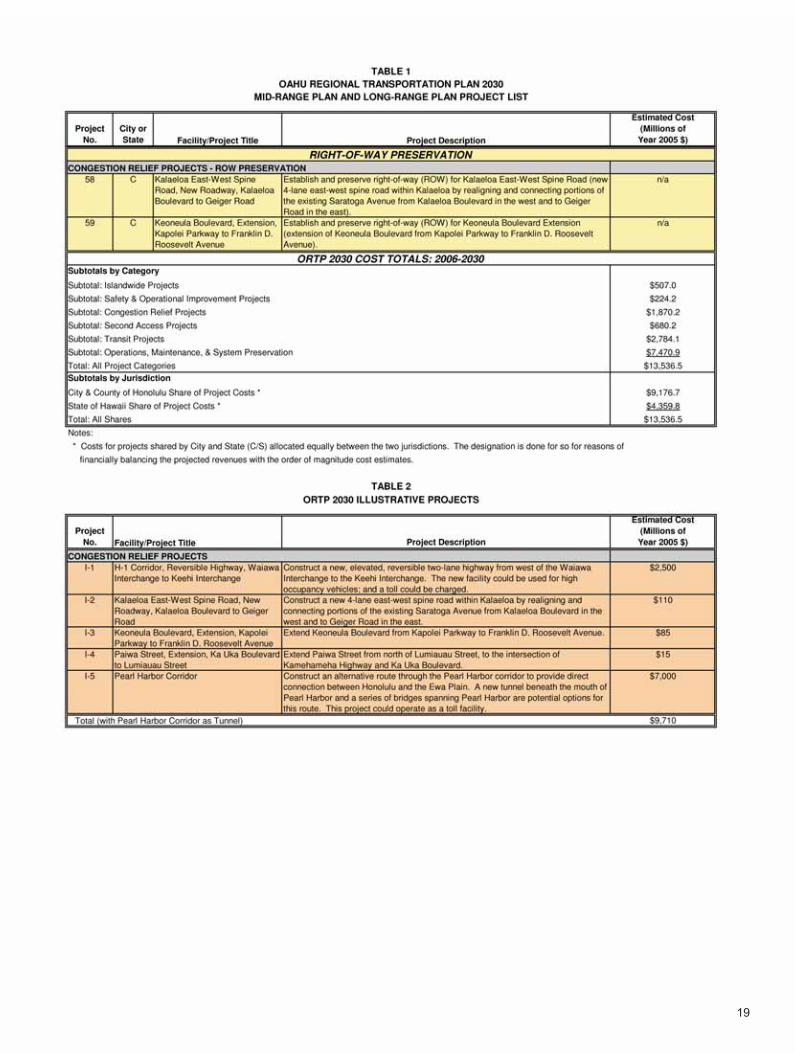
FIGURE 1: POPULATION AND EMPLOYMENT GROWTH BY
DEVELOPMENT PLAN AREA
192
WHAT IS THE ORTP?
The Policy Committee of the Oahu Metropolitan PlanningOrganization (OahuMPO) approved the Oahu RegionalTransportation Plan (ORTP) 2030 inApril 2006.
The ORTP 2030 is a blueprint that guides us in puttingtogether pieces of the transportation puzzle to address themobility issues and transportation needs of ourcommunity. It is a multifaceted plan that integrates plannedgrowth patterns and reflects available financial resourcesover the next 25 years. It includes a vision and goals,identifies projects and provides an implementationprogram for mid- and long-range investment of theavailable transportation funds across Oahu in a fair andequitable manner.
The development of the plan helps decision-makersunderstand the options that are available for improving thetransportation system and how they address our mobilityneeds. Any future transportation improvement for Oahuthat receives federal transportation funds must beconsistent with the ORTP in order to be eligible for thesefunds.
This regional planning document is required by a numberof state and federal mandates and requirements whichinclude the Safe, Accountable, Flexible, EfficientTransportation Equity Act – A Legacy for Users(“SAFETEA-LU”). These requirements are mandated bythe U.S. Department of Transportation as a means ofverifying the eligibility of metropolitan areas for federalfunds earmarked for surface transportation systems.
The ORTP is updated at least every five years to ensurethat transportation decisions are based on currentinformation and community priorities. As part of eachupdate, future population and employment are projectedand corresponding changes in travel patterns, revenue,and construction costs are forecast to validate and testpast and new directions for transportation development onOahu. The ORTP 2025 was adopted in April 2001. Thecurrent plan, adopted in April 2006, updates the ORTP to2030.
LOOKING AT THE FUTURE OF OAHU
The Primary Urban Center (PUC) in Honolulu and theSecondary Urban Center in Kapolei have been designatedby the City and County of Honolulu as the projected areaswhere growth in residential development and employmentshall occur over the next 25 years. Additional growth isencouraged in Central Oahu to relieve pressure on the restof the island.
Figure 1 graphically shows the amount of future growth inresidential development and employment expected ineach of the eight development plan areas of Oahu. Of the240,000 new residents and 130,000 new jobs expected onOahu by 2030, about 80 percent will be located in the PUCand in Ewa.
7,0008,000
Employment
LEGEND:
Population
Employment
2030
4,000
72,000
38,000
7,0008,000
65,000
430,000
17,000
20,000
189,000
115,000
51,000
185,000
489,000
2030
2000
5,000
49,000
38,000
10,0008,000
19,000
15,000
18,000
148,000
118,000
42,000
69,000
419,000
KOOLAULOA
NORTH SHORE
CENTRAL OAHU
KOOLAUPOKO
EAST
HONOLULU
PRIMARY
URBAN
CENTER
EWA
WAIANAE
2000
7,0006,000
51,00047,000
368,000
0 2.5 5 10
Miles
Oahu Regional Transportation Plan 2030
What is the
ORTP?
Looking at the
Future of Oahu
Vision for Oahu
in 2030
Goals
Overview of ORTP
2030 Projects
How the Projects
Work Together
ORTP 2030 Project
Location Map
Paying for the Plan
Summary
ORTP 2030
Project List
Contents
The preparation of this document was financed in part through grants from the U.S. Department of Transportation, Federal TransitAdministration and Federal Highway Administration, under Chapter 53 of 49 U.S.C. and 23 U.S.C. The contents of this document do
not necessarily reflect the official views or policies of the U.S. Department of Transportation.
The Policy Committee of the Oahu Metropolitan Planning Organization approved
the Oahu Regional Transportation Plan 2030 in April 2006.
Additional copies of this document can bedownloaded from
www.OahuMPO.org/ortp.For more information, contact:
707 Richards Street, Suite 200Honolulu, Hawaii 96813-4623Telephone: (808) 587-2015
Fax: (808) 587-2018Email: [email protected]
Oahu Metropolitan Planning Organization