O• o1,a;...tions (Aws) built by Stanford University were installed in Antarctica to investigate...
3
o1, O• bj p a; .—-- OU(;..• :..- -. •-- L ., -.v --- - - • *AMERY ICE 5HE1F ot. t '. iJ'd * .- b . • - - GILLOCK MAWSON ISLAND -: ESCARPMENT ot PRYDZ BAYW \ j Figure 5. N0AA-6 AVHRR near- 00 IR visible image (channel 4P 1 2) of the Amery Ice Shelf. Pa k Ii ce I MAE KE.N7E BAY The authors wish to acknowledge Charles Liddick of the National Earth Satellite Service Office of Operations Sup- port Branch for calculating the satellite reception circles from McMurdo; William Kosco of the U.S. Geological Survey for his support of the project; and Olivia Smith for her preparation of the manuscript. This research was supported by National Science Foun- dation grants, DPP 79-06412 and DPP 77-27010. References Hussey, W. J . 1979. The TIROS-N/NOAA operational satellite system. Washington, D.C.: U.S. Department of Commerce/Noi, National Environmental Satellite Service. Schwalb, A. 1979. The TIROS-N/NOAA A-G satellite series (NoAA Technical Memorandum, NESS 95). Washington, D.C.: U.S. De- partment of Commerce/No. Measurements of the katabatic wind in Antarctica Giw WENDLER Geophysical Institute University of Alaska Fairbanks, Alaska 99702 A. Pocci Laboratoire de Glaciologie Universite de Grenoble Grenoble, France During the austral summer 1979-80, as a part of the U.S.-French joint experiment, three automatic weather sta- tions (Aws) built by Stanford University were installed in Antarctica to investigate the katabatic wind in the French sector. One was placed on Dome Charlie (3,215 meters), the other two at D17 (438 meters) and D10 (267 meters) near Dumont d'Urville Station (66°4('S 140°01'E). Measure- ments from these stations, together with those obtained by the French scientists, are increasing our data base rapidly, giving hope for a better understanding of this wind phenomenon. This joint French-U.S. experiment will estab- lish additional stations between Dome Charlie and D17, as well as some stations around Dumont d'Urville, during the coming season. Stations at D10 and D17 were installed in January 1980 and at Dome Charlie in February; March 1980 was the first month during which we obtained a full set of data from all three stations. The wind velocities for the three stations are given in figure 1. D10 and D17 have very similar wind conditions, a result to be expected. The winds are steadily downslope, changing their SSE direction very little. Winds are strong, up to 128 kilometers per hour, and are expected 1980 REVIEW 193
Transcript of O• o1,a;...tions (Aws) built by Stanford University were installed in Antarctica to investigate...

o1,O•bjpa; .—--
OU(;..•:..- -.
•--L
., -.v--- - -• *AMERY ICE 5HE1F
ot. t '.iJ'd* .-
b .
• - - GILLOCKMAWSON ISLAND
-:ESCARPMENT
ot
PRYDZ BAYW
\ j Figure 5. N0AA-6 AVHRR near-00 IR visible image (channel
4P 1 2) of the Amery Ice Shelf.
Pa kIi ce I
MAE KE.N7E BAY
The authors wish to acknowledge Charles Liddick of theNational Earth Satellite Service Office of Operations Sup-port Branch for calculating the satellite reception circlesfrom McMurdo; William Kosco of the U.S. GeologicalSurvey for his support of the project; and Olivia Smith forher preparation of the manuscript.
This research was supported by National Science Foun-dation grants, DPP 79-06412 and DPP 77-27010.
References
Hussey, W. J . 1979. The TIROS-N/NOAA operational satellite system.Washington, D.C.: U.S. Department of Commerce/Noi,National Environmental Satellite Service.
Schwalb, A. 1979. The TIROS-N/NOAA A-G satellite series (NoAATechnical Memorandum, NESS 95). Washington, D.C.: U.S. De-partment of Commerce/No.
Measurements of the katabaticwind in Antarctica
Giw WENDLER
Geophysical InstituteUniversity of Alaska
Fairbanks, Alaska 99702
A. Pocci
Laboratoire de GlaciologieUniversite de Grenoble
Grenoble, France
During the austral summer 1979-80, as a part of theU.S.-French joint experiment, three automatic weather sta-tions (Aws) built by Stanford University were installed in
Antarctica to investigate the katabatic wind in the Frenchsector. One was placed on Dome Charlie (3,215 meters), theother two at D17 (438 meters) and D10 (267 meters) nearDumont d'Urville Station (66°4('S 140°01'E). Measure-ments from these stations, together with those obtained bythe French scientists, are increasing our data base rapidly,giving hope for a better understanding of this windphenomenon. This joint French-U.S. experiment will estab-lish additional stations between Dome Charlie and D17, aswell as some stations around Dumont d'Urville, during thecoming season.
Stations at D10 and D17 were installed in January 1980and at Dome Charlie in February; March 1980 was the firstmonth during which we obtained a full set of data from allthree stations. The wind velocities for the three stations aregiven in figure 1. D10 and D17 have very similar windconditions, a result to be expected. The winds are steadilydownslope, changing their SSE direction very little. Windsare strong, up to 128 kilometers per hour, and are expected
1980 REVIEW 193

AWS8901March 1980AWS8900March 1980AWS8904March 1980
80 mph
80 mph
40 mph
40 mph7 40 mph \I ( \
)I,1
7
.:.
\\
Figure 1. Wind velocities for the three automatic weather stations (Aws) during March 1980. A dot indicates a wind vectorcoming from the center of the graph. Note the steady, strong downslope winds for D10 (Aws 8901) and D17 (Aws 8900); at DomeCharlie (Aws 8904) the winds are lighter (scale Is different) and more variable.
E
to increase during winter. In April 1980 winds up to 140kilometers per hour were measured at 017, and an absolutemaximum in wind speed at Dumont d'Urville was recordedat 314 kilometers per hour in midwinter (June)—a speedthat will challenge the design of any station. Dome Charlieexperiences much lighter winds and the direction is morevariable. This is understandable as there is no gravity windand the wind regime is more like that of the free atmos-phere. Temperatures drop to very low values at this high-altitude station. March had a minimum of — 66.1°C, with amean of — 51.8°C. In April the mean temperature droppedto — 60.3°C, with a minimum of — 73.4°C. An absoluteminimum for Antarctica might be measured in the nextfew months, assuming, of course, that our station staysoperational at these low temperatures.
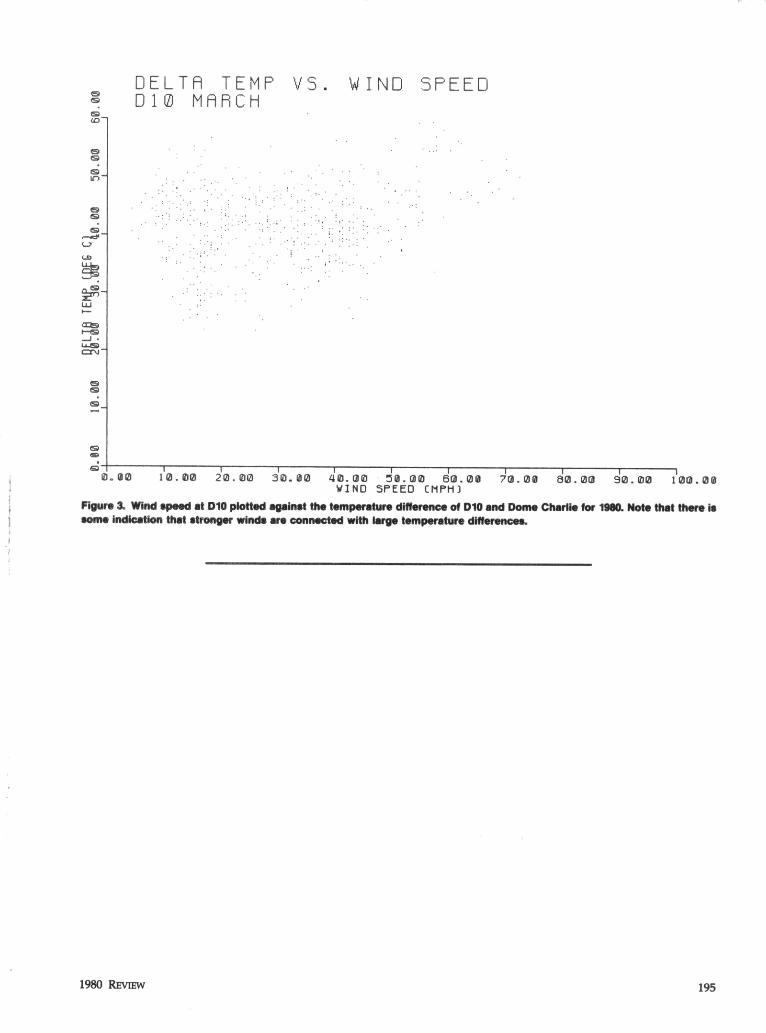
The diurnal variation in the wind speed at D10 duringMarch is given in figure 2. 017 showed a very similarcourse. The maximum is observed during the night, and theminimum at noon. Note that local noon is around 3 a.m.Greenwich mean time. Furthermore, data were used onlywhen Dome Charlie had wind speeds below 8 kilometersper hour, that is, in the absence of strong cyclonic activities.These results are expected for a gravity wind and werepreviously reported from French observations. In figure 3the wind speed at D10 is plotted against the temperaturedifference between D10 and Dome C, the assumption beingthat the greater the temperature difference, the stronger thegravity wind. Some indication of this effect can be seen, atleast for stronger wind speeds. it is also interesting to note
the very large temperature differences which, most of thetime, are far above the adiabatic rate. Since the surfacewinds are always offshore, this can be explained by rela-tively warm maritime air, which is moved at a somewhatelevated level inland and is mixed into the surface layer,hence warming the coastal stations. This large temperaturedifference is, of course, the driving force of a gravity wind.
This work is being supported by National Science Foun-dation grant DPP 77-26379. Allen Peterson's group of Stan-ford University designed the stations. They were installedby Robert Flint (010 and 017) and Glenn Rosenberger andCal Teague (Dome Charlie). Programming was carried outby K. Chen (Stanford University) and Coert Olmsted (Uni-versity of Alaska). Our thanks to all these people.
40
Eli
20
E
30
In
GMT
Figure 2. Diurnal variation of wind speed for D10 duringMarch 1980. Note that the wind speed has Its minimum atlocal noon, around 3 a.m. Greenwich mean time, at a timewhen the temperature Is at the maximum.
N
194 ANTARcTIC JOURNAL
ILM
LLJ
(0
DELTA TEMP VS. WIND SPEEDD 10 MARCH
ui..woi,j.ujvjz W.jjj4j. wia4W. Lo MW.(jBbEJ. 0 070. 00 QI.QU290.0WINO SPEED C1'1P1)
Figure 3. Wind speed at 010 plotted against the temperature difference of D10 and Dome Charlie for 1980. Note that there issome indication that stronger winds are connected with large temperature difference..
1980 REVIEW 195