O VITRIFYING WASTES USING A PLASMA ARC TORCH · ON VITRIFYING WASTES USING A PLASMA ARC T ... Rusty...
78
ON VITRIFYING WASTES USING A PLASMA ARC TORCH Marie C. Johnson August 2002 AEPI-IFP-0802E Army Environmental Policy Institute
Transcript of O VITRIFYING WASTES USING A PLASMA ARC TORCH · ON VITRIFYING WASTES USING A PLASMA ARC T ... Rusty...
ON VITRIFYING WASTES USING A PLASMA ARC TORCH Marie C. Johnson August 2002 AEPI-IFP-0802E
Army Environmental Policy Institute


ON VITRIFYING WASTES USING A PLASMA ARC TORCh Marie C. Johnson August 2002 AEPI-IFP-0802E
Army Environmental Policy Institute

The views expressed in this paper are those of the authors and do not necessarily reflect the official policy or position of the U.S. government, the Department of Defense, or any of its agencies.
Army Environmental Policy Institute 101 Marietta Street, Suite 3120 Atlanta, Georgia 30303-2711

iii
ABSTRACT This study reviews the state of the art regarding plasma arc torch vitrification of waste. It provides background by describing the history and environmental benefits of vitrification and the history and design of plasma arc torches. It reviews current uses of a plasma torch to heat ex-situ furnaces, and develops a case study showing how such a furnace could be used by the Army to pyrolyze scrap tires. This pyrolysis process would benefit the Army by providing an additional source of revenue and ensuring an environmental solution to the destruction of the 16 million scrap tires the Army collects each year. An immediate research product is a computer model, which allows in-situ heat transfer to be investigated. These model results provide important constraints on in-situ applications of plasma arc technology. Finally, laboratory scale experiments and associated analytical work allowed direct study of in-situ vitrification using a plasma arc torch. These research results fill gaps in theoretical knowledge and inform general understanding of the thermal and geochemical changes caused by vitrification. The United States Army is actively seeking innovative and effective methods of treating the wastes associated with producing and using the technology today’s Army requires. Plasma arc torch vitrification offers one potential solution. Before the Army can adapt this solution to its requirements, significant research directed at understanding the vitrification process must still be accomplished.

iv

v
ACKNOWLEDGMENTS This work was undertaken while on sabbatical from the United States Military Academy (USMA). The author is grateful to Dick Wright, Dan Uyesugi, and Ken Johnson for supporting her efforts on this project; Lou Circeo and Bob Martin for introducing her to plasma arc technology; the generosity and genuine goodwill of Mohammad Ghazi and Rusty Malchow Jr. as they taught her rock digestion procedures and ICP-MS analytical techniques; and Jim Clark, who tutored her with great patience in finite element analysis and heat conduction. The Army Environmental Policy Institute (AEPI) congratulates Dr. Johnson for successful completion of a very complex research project that could eventually produce far-reaching policy implications in the fields of Army environmental research and waste management policy. She labored in a milieu of resource shortage, severe time constraints and borrowed facilities. That she accomplished so much with so little is a tribute to her expertise, dedication, and project management skills. Commendations and thanks also go the Georgia Institute of Technology Research Institute for sharing its plasma arc staff and lab and to Georgia State University for lending analytical laboratory support. Both institutions’ contributions were complementary and critical. This collaboration between USMA and AEPI has been highly fruitful. Dr. Johnson not only conducted her own project, but also lent her knowledge of geology and education to other AEPI projects and activities. AEPI looks forward to similar synergistic benefits through relationships with additional sabbatical fellows from USMA.

vi

vii
EXECUTIVE SUMMARY One potential solution to the pressing environmental problem of waste treatment and disposal is to vitrify wastes using a plasma arc torch. Vitrification is flexible, produces an extremely durable product greatly reduced in volume and surface area, and is appropriate for both ex-situ and in-situ applications. Potential ex-situ applications include pyrolysis of scrap tires. If the Army pyrolyzed all the scrap tires it collected in FY99, it would have generated $823,000 worth of fuel beyond the fuel needed to power the torch itself. In in-situ plasma applications, melting occurs from the bottom of the contaminated area towards the surface, greatly reducing the likelihood of unexpected melt expulsion events. A thermal model was constructed to study in-situ heat transfer. The model successfully predicts the presence of a 100°C temperature plateau and the size of the vitrified zone formed using kilowatt-size torches. This model indicates that the majority of melting occurs in the first 30 minutes after the torch is turned on, suggesting that powering the torch for long periods of time is inefficient. The model also shows that melting below the groundwater table is energy inefficient. Laboratory experiments were conducted by filling a 4-foot tall, 4-foot diameter cylinder with soil and inserting a plasma torch in a centrally located borehole. Thermal information collected by installing thermocouples at various distances from the torch revealed extremely steep thermal gradients. These experiments also investigated geochemical changes in the soil caused by vitrification. Soil and glass samples were analyzed using x-ray fluorescence and inductively coupled plasma mass spectrometry. The glasses produced were more homogenous than the starting soil, indicating that convection within the molten zone is vigorous. Major elements were decoupled from trace elements, suggesting that the melting process is non-equilibrium. Lead had the highest volatility of all elements studied, and cesium volatility was found to be low. A preliminary economic analysis of this technology shows that it is cost competitive.

viii

ix
TABLE OF CONTENTS Abstract …………………………………………………………………………………….… iii Acknowledgments ……………………………………………………………………….….. v Executive Summary ……………………………………………………………………..… vii List of Tables and Figures …………………………………………………………………. x
1. Introduction …………………………………………………...…………………………… 1 1.1 Plasma Arc Torches As Alternative Energy Sources for Vitrification ………...….. 3 2. Ex-situ Plasma Arc Torch Applications …………………………………………….… 7 3. In-situ Plasma Arc Torch Applications ……………………………………………… 11 4. Thermal Modeling Methodology ……………………………………………………… 13 4.1 Thermal Modeling Results ………………………………………..………………… 18 5. Laboratory-scale Experimental Methods ……………………...………………….… 23
5.1 Analytical Procedures ………………………………………………………….....… 27 5.2 Thermal Results From Experimental Work ………………………………..……… 29 5.3 Geochemical Results From Experimental Work ………………..……………...… 32
6. In-situ Plasma Arc Vitrification Costs …………..………………………………..… 39
7. Conclusions ……………...…………………………………………………………….… 43
8. Recommendations For Future Plasma Arc Research …...……………………..… 45
References ………………………………………………………………………………...… 47
Appendix A Plasma Arc Torch Supply Companies ………………………………… A-1 Appendix B Fortran Heat Transfer Computer Model …………………………..…... B-1

x
LIST OF TABLES
1.1 Vitrification Is Not Incineration ……………………………….………………………. 2
5.1 Size of Vitrified Materials ………………………………………………………..….. 30
5.2 Major Element Analytical Data ……………………………...………………..……. 32
5.3 Trace Element Analytical Data ……………………………...………………..……. 34
6.1 Economic Calculations ……………………………………...…………………..….. 40
LIST OF FIGURES 1.1 Field configuration to enable in-situ vitrification of contaminated soils …..…...…. 3
1.2 Schematic view of a plasma arc torch …………………………………………….… 4
2.1 Schematic depiction of the pyrolysis of a ton of municipal solid waste …………. 7
2.2 Pounds of scrap tires (divided by 1,000,000) collected in state DRMOs ……….. 9
4.1 Finite element mesh for Fortran thermal model ………………………………..… 16
4.2 Temperatures at a distance of 3, 6,9, 12, and 15 inches from the borehole ..… 19
4.3 The temperature in each cell in the finite element mesh ………………….….…. 21
4.4 Temperatures calculated at 4 specific locations as a function of time ……….… 22
5.1 Experimental configuration for (a) experiment one and (b) experiment two …... 24
5.2 Photograph of 4-foot tall – 4-foot diameter vessel loaded with soil …………….. 25
5.3 (a) The five thermal zones …………………………………...……….…………….. 30
5.4 Recorded thermocouple temperatures versus time for experiment two ……….. 31
5.5 Trace element ICP-MS data for the two plasma torch experiments …………… 33
5.6 Trace elements versus SiO2 content normalized 100% anhydrous ………….... 36
5.7 The average concentration of each trace element in the glass …………..…….. 37

1
1. Introduction We generate wastes, ranging from simple garbage to high-level radioactive waste, on a daily basis. Our need to reduce or render harmless these wastes is well recognized. Technologically feasible, effective solutions to treating these wastes, however, have lagged well behind our recognition of the magnitude of the challenge. A truly ideal solution would be equally applicable to all wastes from low to high-tech. This ideal solution could treat existing, stockpiled wastes in landfills and other storage facilities as well as wastes currently being generated. Moreover, such a solution could remediate the associated polluted soils and groundwater systems at our current trash dumps. One potential solution, which has many of these attributes, is vitrification. Identified in the 1970s, vitrification involves converting contaminated material into a stable glassy product typically via a thermal process. The input material tends to be porous and leachable while the vitrified final product is monolithic, impermeable and virtually unleachable. Vitrification was identified as a promising tool for waste treatment for four reasons (EPA Handbook, 1992): (1) Vitrification is a flexible process. Unlike competing technologies that require the waste stream to be separated into its component parts, vitrification can simultaneously process organic, inorganic, and radioactive mixed waste contaminants; (2) The vitrified product is extremely durable. Essentially the glass-like material resulting from vitrification has unequalled chemical, physical, and weathering properties. These properties suggest a life expectancy of geological timescale proportions unlike typical human engineered solutions; (3) Vitrification reduces both the volume and surface area of the waste. Volume reduction means that any secondary disposal of the vitrified product is on a much smaller scale than disposal of the initial waste. Surface area reduction insures that the vitrified product is less susceptible to contaminant migration via weathering and leaching; and (4) Vitrification is possible in both in-situ and ex-situ situations. If used as an in-situ treatment technology, vitrification promises permanent, in-place treatment of contaminated soils and may reduce long-term liability issues. In ex-situ applications, vitrification may be accomplished in a mobile furnace, offering great control as the furnace can be tailored to the specific waste requiring disposal. Vitrification, a thermal process that causes melting, should not be confused with incineration, a thermal process resulting in combustion of oxidizable components. Although both technologies employ heat to destroy wastes, vitrification differs from incineration in several important ways (Table 1.1, p.2). For example, incineration is a combustion process (requiring oxygen) while vitrification involves pyrolysis (no oxygen required). Since vitrification requires no air, the amount of off-gas requiring additional treatment is markedly reduced compared to incineration. Secondly, vitrification is independent of the fuel value of the waste being treated, while most incinerators require a mix of wastes with appropriate fuel values for efficient incineration. Also, incinerators are plagued by potential dioxin and furan formation (toxic polychlorinated organic compounds) because heat is unevenly distributed and incomplete combustion occurs. Vitrification avoids the formation of these compounds because temperatures are much higher and combustion is not the main destruction process. Incinerators typically require

2
a warm-up and cool down period while vitrification is simply an on-off process; no energy needs to be expended ramping system temperature up or down prior to or after vitrification. Finally, incineration produces an ashy byproduct, which often cannot pass leaching tests and thus requires disposal in an engineered landfill, while vitrification produces a glassy byproduct, which may require no further treatment.
Table 1.1 Vitrification Is Not Incineration
incineration vitrification
destruction of waste via combustion destruction of waste via pyrolysis increased gas volume requiring secondary
treatment reduced gas volume requiring secondary
treatment great potential for dioxin and furan
formation little potential for dioxin and furan
formation dependent on fuel potential of waste independent of fuel potential of waste warm-up and cool down periods required no warm-up or cool down periods required ashy byproduct glassy byproduct In general, a waste requiring treatment contains some type of contaminant; the contaminant may be a radionuclide, a heavy metal, an organic pollutant, a cancer-causing compound or something else. During vitrification, this contaminant will experience one of five possible fates. The contaminant may be destroyed through either combustion or pyrolysis (chemical breakdown in the absence of oxygen). This fate is typical for organic pollutants. The contaminant may become air-borne and thus require removal through an off-gas treatment system. This fate is typical for easily volatilized compounds. A third possibility is that the contaminant is chemically broken down into its constituent atoms or molecules and these constituents are incorporated into the melt. This fate usually applies to inorganics such as asbestos. Another possible outcome is that the contaminant becomes physically immobilized in the vitrified product, which is highly resistant to leaching. Heavy metals and radionuclides generally behave in this manner. A fifth potential fate is that the contaminant escapes into the environment either by migrating into adjacent clean soil or by escaping in untreated off-gas. Of these five possible fates, four render the contaminant completely harmless; only the fifth requires additional remediation. Determining the likelihood of this fifth possibility is an important research area. Based on the enormous potential for vitrification to treat wastes in an environmentally sound manner, basic research has been conducted to investigate all aspects of the vitrification process. Workers at Oak Ridge National Laboratory (ORNL) and Pacific Northwest National Laboratory (PNNL) focused primarily on developing the technology as an in-situ remediation tool (Dunbar et al. 1993; Jacobs et al. 1992; Jacobs et al. 1988). The technology they developed involves inserting four carbon electrodes in a square pattern at the surface (Figure 1.1, p. 3). A voltage is applied to the electrodes to induce current to flow between them. As current flows between the electrodes, the

3
temperature of the surrounding soil is raised through Joule heating. Eventually, the temperature exceeds the soil melting point. Soil near the surface melts first and with time the electrodes are pushed down into the melt, which penetrates to depths equal to the bottom of the electrodes. When the desired melting depth is reached, power to the electrodes is terminated and cooling begins. The melted material solidifies to a glassy end product. The transformation from solid to melt to glass is generally accompanied by a large volume reduction and considerable surface subsidence. This subsidence may be offset by backfilling with clean overburden. Since soil is normally not electrically conductive, a chemical frit must initially be emplaced in a criss-cross pattern between all the electrodes. This frit acts as a starter path for current flow. A hood also must be placed over the electrodes to capture any off-gases and direct them to a secondary off-gas treatment system.
(c)
vitrified product
backfill
to off-gas treatment system
electrode
frit
off-gas hood
(a)
contaminated soil
(b)
molten zone
Figure 1.1 Field configuration to enable in-situ vitrification of contaminated soils through Joule heating. In (a), four electrodes are inserted into the ground in a square arrangement. An off-gas hood is placed over the electrodes and a frit is placed in small channels between each electrode. In (b), power is applied to the electrodes to introduce melting first in the frit and then in the surrounding soil. As the mass of melted soil increases, the voltage and current are adjusted to maintain a constant power level and the electrodes are pushed farther into the ground. In (c), power to the electrodes is terminated, the electrodes and off-gas hood are removed, and backfill material is emplaced to negate soil subsidence. Figure modified after Buelt et al. (1987).
1.1 Plasma Arc Torches As Alternative Energy Sources For Vitrification Joule heating is not the only method capable of inducing in-situ melting. An alternative method involves using a plasma arc torch as an energy source. Basically, the torch acts as a high-powered candle that transmits heat into the surrounding soil. For in-situ applications, a borehole can be emplaced in the contaminated soil and the torch lowered to the bottom of the hole. As melting begins, the torch is slowly raised toward the surface. The promise of this technique derives from the power of the plasma itself. Plasma is the fourth state of matter― with increasing heat, solids become liquids then gases then plasmas. In particular, plasmas are electrically-neutral, ionized gases capable of conducting electricity. Our sun is a natural plasma but the sun has a much higher proportion of ionized atoms than a typical plasma arc torch. In a typical torch,

4
only 1-2 percent of the gas is ionized. Lightning, the Northern and Southern Lights, and the solar wind are natural examples of such weakly ionized plasmas. Fluorescent lights and neon tubes are examples of engineered plasma devices. In principal, a plasma arc torch is extremely simple. Essentially, it converts electrical energy to heat energy, which can then be used to induce melting. The conversion from electrical to heat energy is 98 percent efficient (Camacho 1988). The torch requires electricity and gas inputs. The electricity is used to ionize the gas, creating a plasma “flame” that emits heat (Figure 1.2). Virtually any gas can be used depending on the application, but air is the cheapest and easiest to supply. In addition, most torches are constructed with a cooling jacket to reduce the temperature of the included electrodes. For these torches, water connections are also required. The electrical arc required to generate the plasma can be created in two ways (Fox et al. 2001). In a non-transferred arc, the arc is created between a front and a rear electrode located inside the torch housing. The electrodes are typically made of a copper alloy. In a transferred arc torch, one electrode is located inside the torch housing and the material being vitrified acts as the second electrode. Because the plasma itself acts as a resistive heating element, no solid elements susceptible to melting and failure exist. Thus, this design allows super-high temperatures and energy densities to be achieved. For example, the plasma “flame” reaches temperatures of 4000 – 7000°C, much higher than typical combustion temperatures (< 1000°C). To put these temperatures in perspective, the surface of the sun is about 6000°C while the center of the Earth is thought to be less than 5000°C.
(b)
el ec t r ic it y
hea t
ga s
plasma arc t
orch(a)
water cooled
Figure 1.2 (a) Schematic view of a plasma arc torch, a very simple device that converts electric energy to heat energy in a highly efficient manner. (b) A commercial plasma arc torch ~4 feet in length. Note that both water and electrical connectors are visible. The water is recirculated within the torch housing for cooling purposes. The durability of the glass-like byproduct (whether produced via Joule heating or plasma arc torch) is well demonstrated. This durability has been measured by tests such as the
5
Soxhlet corrosion rate. This test involves determining how many grams of material are dissolved per square centimeter of surface area per unit time. In this test, vitrified material has been shown to have a durability similar to Pyrex laboratory glassware, greater than granite and marble, and approximately five times greater than regular bottle glass (Buelt et al. 1987). In addition to being physically durable, the vitrified waste is chemically inert. Carter and Tsangaris (1995a) performed Toxic Characteristic Leachability Procedure tests on vitrified municipal solid waste. They tested for arsenic, barium, cadmium, chromium, lead, mercury, selenium, and silver and found that the measured concentrations of these elements in the leached fluids were at least an order of magnitude less than existing environmental regulations require. This result suggests that the vitrified glass may be delisted and thus can be landfilled in a non-engineered landfill. Potentially, this delisting could result in a significant cost reduction to a company charged with the ultimate disposal of the waste. Although both Joule heating via electrodes in the ground and melting via a plasma arc torch result in a vitrified final product, the torch presents several promising advantages relative to the Joule heating method. For example, Joule heating requires a frit and often an additional fluxing agent to initiate melting. Secondly, the energy efficiency of Joule heating strongly depends upon soil properties — highly weathered soils may simply be too refractory to melt without significant fluxing additions. In contrast, the high temperatures and energy densities of a plasma arc torch allow it to melt any material without need for a frit or additional flux. Furthermore, if the soil is contaminated with a high content of metals, short circuits may develop circumventing the Joule heating process. Again, this concern does not apply to torches. Finally, and probably most difficult to overcome, Joule heating efforts have been plagued by “melt expulsion” incidents. These melt expulsion incidents occur when organic material is gasified or when groundwater flashes to steam and ejects through the molten pool rather than escaping into the surrounding soil. These events are extremely dangerous and inherently unpredictable. The potential for such explosive events is heightened by the design, which requires melting to begin at the top of the soil and proceed downward toward the water table. In contrast to this “top down” melting style, melting induced via plasma arc torch occurs in a “bottom up” style. Thus, gasified organic material or groundwater flashed to steam can escape through overlying soil or be funneled up the borehole. In either case, the chance of a melt expulsion is greatly reduced compared to Joule heating. Plasma arc torches represent equipment that can be bought off the shelf. The design is very standard and is based on a technology dating back to the 1960s. NASA workers first developed plasma arc torches because they needed to generate the high heat necessary to test heat shield materials for spaceship reentry vehicles. The commercial applications of such a heating device were quickly realized, and torches were adopted by the steel-making and specialty metallurgy industries in the 1970s. Environmental applications of torches were recognized in the 1980s and research to develop torches as a waste remediation solution has been actively pursued ever since (Cohn 1993).

6

7
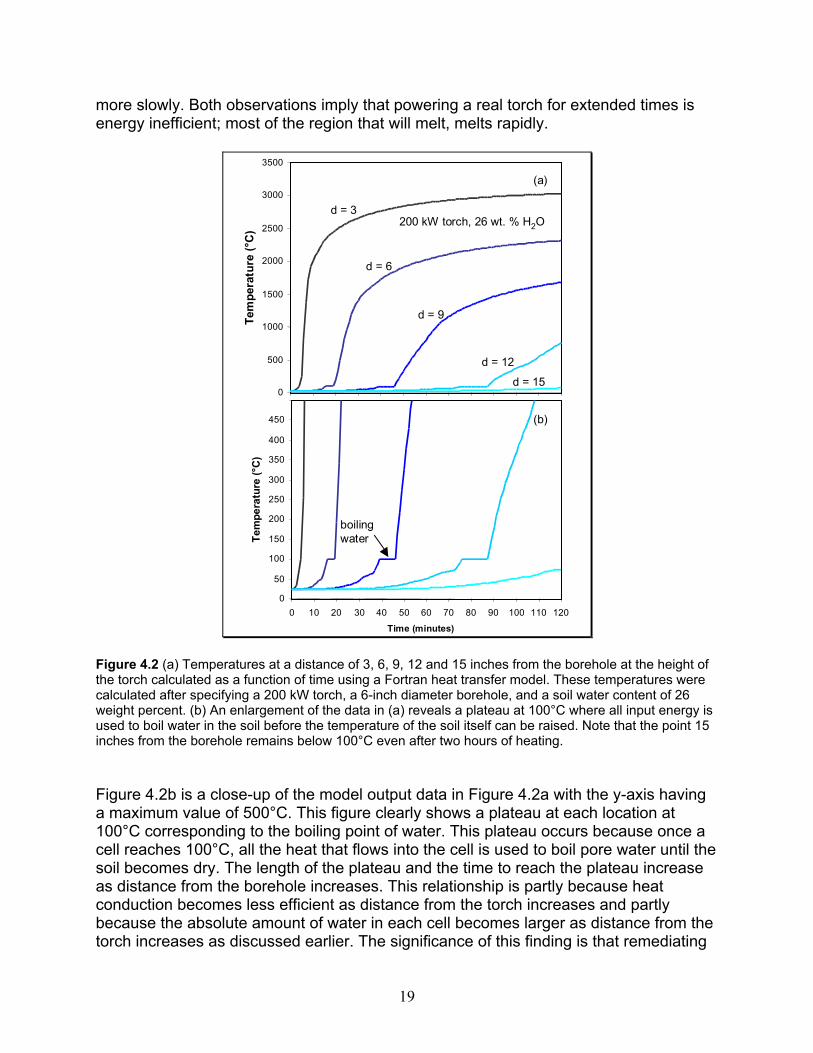
2. Ex-situ Plasma Arc Torch Applications Several companies in the United States are currently marketing plasma arc torches (Appendix 1). Of these companies, Westinghouse Plasma Corporation is acknowledged to build some of the most reliable torches. Most of the torches being manufactured are designed for ex-situ applications, and most of this work is being conducted overseas. For example, France has developed a facility that vitrifies incinerator ash. This facility reduces the environmental consequences of landfilling hazardous incinerator ash and provides a considerable cost savings by reducing tipping fees. Carter and Tsangaris (1995a) took this idea one step further and investigated directly pyrolyzing municipal solid waste (Figure 2.1). After all, roughly 80 percent of the municipal solid waste generated annually in the United States is some type of hydrocarbon, and plasma vitrification can be used as a waste-to-energy concept (Camacho 1990). Carter and Tsangaris determined that to vitrify one ton of municipal solid waste in a furnace heated by a plasma arc torch would require 500 kWh of electricity but would generate 800 kWh in fuel gas value. Thus, 300 kWh would be available to sell back to the grid. They also reported that one ton of municipal solid waste occupies about 75 ft3 but the glassy residue after vitrification occupies only 2 ft3 and weighs 400 pounds, representing a 97 percent volume reduction and an 80 percent weight reduction. Furthermore, this glass could be used for gravel or aggregate for concrete manufacture, thus providing a second possible revenue-generating service.
1 ton MSW75 ft3
plasma arc torch
500 kWh
gas treatment
fuel gas800 kWhplasma furnace
rock residue400 lbs, 2 ft3
gravelaggregate
brick
3
Figure 2.1 Schematic depiction of the pyrolysis of a ton of municipal solid waste. Note that 500 kWh are required to run the plasma arch torch furnace but 800 kWh of electricity would be generated from the waste pyrolysis process. Data are from Carter and Tsangaris (1995a).

8
France is also a leader in applying plasma arc technology to asbestos destruction (Zaghloul and Circeo 1993). A facility is currently operating near Bordeaux. This plant processes municipal solid waste as well, and destroys an average of about 20 tons of material per day. Japan also has a facility operational that processes 100 tons of garbage per day. Examples of plasma arc furnaces currently operational in the United States include a facility built by Integrated Environmental Technologies to dispose of medical waste in Hawaii (Carter and Tsangaris 1995b). This facility opened in May 2000 after a lengthy permitting period. The United States Navy has also invested time and money in determining whether plasma arc torches are suitable for destroying wastes under the unique conditions of shipboard life. Specifically, any waste treatment technology must be able to withstand marine conditions and constant motion. It must also be compact as space at sea is a premium, especially on Navy ships whose primary mission is national defense. Results of studies to date have been positive and the Navy has built a prototype system (Baker 2001; Nolting 2001a; Nolting 2001b; Sartwell 1999). The Navy is now reviewing whether to adopt this technology. As part of this work, a case study of a specific waste stream generated by the Department of the Army was undertaken to investigate the potential benefits of an ex-situ plasma arc torch furnace. The waste stream investigated was scrap tires (Blumenthal 1997a; Blumenthal 1997b; Blumenthal and Weatherhead 1997; Teng et al. 1995). Scrap tires are a two-fold environmental hazard in addition to being unsightly (Makansi 1992). First, scrap tire piles are disease vector habitats. The tires attract vermin and can hold stagnant water thus becoming perfect breeding grounds for mosquitoes. This concern is of heightened importance given the recent outbreaks of West Nile fever. Secondly, scrap tires represent a significant fire hazard. Scrap tire fires are difficult to extinguish, can burn underground with little to no oxygen, and generate toxic emissions from the burning rubber, which cause severe air pollution problems. To combat these problems, uses for scrap tires have been developed that include using the tires as road fill material to prevent frost heaves (Amirkhanian 2000) and in civil engineering works such as playgrounds and slope buttressing projects (Serumgard 1997). These applications, however, ignore the high BTU content of tires; landfilling or disposing of tires is essentially burying a potential energy resource. Statistics on the number of scrap tires collected at regional Defense Reutilization and Marketing Service Offices (DRMO) both in the continental United States (CONUS) and overseas (OCONUS) were sought. The data showed that in fiscal year (FY) 1999, 15.9 million pounds of scrap tires were collected in the CONUS; over 2 million pounds of tires were collected in Texas alone, while Georgia, California, North Carolina and New Jersey DRMO offices collected over 1 million pounds of tires each (Figure 2.2, p. 9). If OCONUS statistics are included, 21.5 million pounds in total scrap tires were collected. The Army sold 16.3 million pounds of scrap tires in FY98, suggesting little fluctuation in collection amounts from year to year. Currently, the DRMOs sell these tires to collection companies and the end use of the sold tires is not tracked. Selling these tires in FY99 produced $340,000 in revenue.

9
0.0
0.5
1.0
1.5
2.0
TX GA
CA
NC NJ
LA VA FL KY SC AZ NM
MS
CO NY
OH
NV AL UT
KS IL NH MI
OK
PA MN
ND W ID MD IN AK MT
AR CT
poun
ds s
crap
tire
s*1,
000,
000
total = 15.9 million
Figure 2.2 Pounds of scrap tires (divided by 1,000,000) collected in state DRMOs in FY99. The total pounds of tires collected is 15.9 million; FY98 data are very similar and suggest little fluctuation from year to year in scrap tire collection. Alternatively, the tires could be pyrolyzed on site at the DRMO collection points. On average, a one-pound tire contains 15,000 BTUs; thus, pyrolyzing 21.5 million pounds of tires would generate 320,000 mBTUs. Assuming 50 percent of this generated energy is needed to power the torch and a 35 percent conversion efficiency, the pyrolysis process would still generate 16.5 million kWh of energy beyond that needed to power the furnace. If this extra energy were sold for a conservative 5 cents per kWh, $823,000 in revenue would be generated. If hydrogen fuel cells were to be co-located with plasma arc furnaces, even greater energy and economic benefits can be imagined. In any event, this revenue represents nearly half a million more dollars than the Army currently realizes from the sale of these same tires. Additionally, the Army would ensure that the tires are destroyed in an environmentally sensitive and energy efficient manner. Note that neither price estimate (the $340,000 or the $823,000) considers the transportation costs involved in getting the tires to the DRMO sites; the comparison strictly involves what happens to the tires once they are collected on site.

10

11
3. In-situ Plasma Arc Torch Applications The scrap tire case study and other examples to date of applications of plasma arc technology have a common denominator: they are all ex-situ applications. In-situ applications have trailed well behind these furnace-type applications despite the inherent promise of in-situ to reduce worker exposure as well as the long-term cost and liability associated with a contaminated site (Circeo et al. 1996). In-situ techniques are potentially ideal to remediate large-scale problems such as contaminated soils associated with leaking landfills or previous waste disposal sites. In-situ techniques would avoid the difficult problem of excavating and handling all the soil at such sites. In-situ plasma arc torch technology could also be applied to small-scale problems requiring pinpoint accuracy. These types of problems include leaking underground storage tanks or perforated buried pipes. A strength of the plasma arc principle is this potential ability to remediate both small and large-scale wastes. An additional strength of in-situ plasma arc technology is that vitrification can solve geotechnical problems (Beles and Stanculescu 1958). For example, vitrification increases soil stability by decreasing water content and increasing density, compressive strength, and shear strength (Celes and Mayne 2000; Mayne et al. 2000; Jankiewicz 1972). Thus, vitrifying a region of unstable soil may reduce the potential for landslides or the chance of soil liquefaction during an earthquake. Another potential application of in-situ vitrification technology is the potential to recover energy from oil shale by applying in-situ heating. Melting would not be required to extract this energy. Instead, the objective would be to heat the rock hot enough to cause the organic material to transform into a gas or liquid (called kerogen), which could then be collected. Whether remediating contaminated soils, stabilizing unstable slopes, or extracting energy from oil shale, the first step in applying in-situ technology would be to emplace a grid of boreholes at the selected site. A mobile plasma torch could then be lowered to the bottom of a borehole, turned on, and slowly withdrawn, thus treating one column of material at a time. Following this procedure, eventually the entire site would be treated. A moveable hood would also need to be placed over each borehole during processing and the off-gases directed to a suitable secondary treatment system. Clearly, vitrification offers many potential positive solutions to our pressing waste disposal issues. Vitrification can be achieved by either Joule heating using electrodes in the ground or by inserting a plasma arc torch into boreholes. Much basic research on vitrification via Joule heating has been conducted, but practical employment of this technique currently faces the difficult challenge of reducing the risk of explosive melt expulsion events. Plasma arc technology is a newer, less well-researched option. Ex-situ furnace-type applications are being marketed, but in-situ applications lag well behind. Before this technology can be considered well characterized and mature enough for marketing and widespread use in the field, basic scientific questions regarding the chemical and thermal processes occurring during vitrification need to be addressed. Answers to these questions require both modeling studies and laboratory experiments. Both types of studies were undertaken as part of the present investigation.

12
A simple thermal model was developed to predict soil temperatures and the extent of melting as a function of time, torch power level, and soil water content. Experimental and analytical work was undertaken to investigate soil geochemical changes and vertical and lateral migration of contaminants during vitrification. Finally, a preliminary economic analysis of remediating an in-situ site using plasma arc technology was also undertaken as part of this work.

13
4. Thermal Modeling Methodology At its simplest, in-situ remediation using a plasma arc torch involves lowering a high-powered candle (the torch) into the ground and transferring heat energy from this candle to the surrounding soil. The temperature of the nearby soil is raised, perhaps to its melting point, with the magnitude of this temperature increase depending primarily on distance from the candle. To design an efficient borehole drilling plan and to evaluate the economic cost of this remediation method, this simplistic picture must be quantified. Namely, how does soil temperature vary with distance from the torch? What radius of vitrification can be expected for a given torch power? Answers to these questions can be explored by modeling the heat transfer process under a variety of conditions and then using these model results to design experiments to test and improve the accuracy of the model. To this end, a simple two-dimensional finite element heat transfer computer model was developed. The code was written in Fortran (Appendix 2) and run on a standard Windows operating system desktop computer. Several simplifying assumptions were made. In particular, heat is assumed to be transmitted from the torch to the soil by radiation with no associated heat loss. Heat is then assumed to be transmitted through the soil by conduction only. Convective heat transport and radiation within the soil are ignored. Furthermore, the soil is assumed to be isotropic and homogenous, except for water content which is initially uniform but varies as the soil is heated. Finally, the conduction of heat is assumed to be radial from the borehole to the edge of the container and axial. Since the soil is assumed to be isotropic with identical thermal properties everywhere, it is only necessary to calculate temperatures in a single vertical plane from the center of the borehole out. These temperatures are representative of any vertical plane through the center and can be applied to any corresponding point within the cylinder. Heat transfer results from temperature differences. Heat will flow from the hotter object to the cooler object until both objects reach the same temperature. Conduction specifically applies to heat transfer through a stationary medium whether solid or liquid. If no phase change occurs, the heat energy that flows out of or into an object can be expressed as
TCmq p ∆∗∗= (1)
where q is the heat flow in kJ, m is the mass in grams, Cp is the specific heat of the medium in question in kJ/g/°C, and ∆T is the temperature difference between the two objects. If a phase change occurs, equation (1) is not applicable. Instead, the heat flow depends on the latent heat of fusion (solid to liquid) or the latent heat of vaporization (liquid to gas) rather than the temperature difference. In the case of in-situ vitrification, the phase change of most significance is the conversion of pore water in the soil to steam. During such a phase change, the heat flow can be expressed as
Hmolesq ∆∗= (2) where moles is the moles of water and ∆H is the heat of vaporization of water (40.7 kJ/mole). Thus, in terms of the computer model, the mass of water in each cell must be

14
tracked as a function of time. Heat flowing into a cell is initially used to raise the temperature to 100°C via (1). If the temperature reaches 100°C and the cell contains water, then (2) is used to calculate the change in the mass of water as vaporization occurs. If the mass of water goes to zero (i.e., the soil is completely dried), then (1) again becomes the appropriate equation to track temperature changes resulting from heat flow. Thus, for the model to function properly, the mass of water (and soil) in each cell must be initially calculated and, in the case of the water, tracked as a function of time. The mass of the soil is calculated from
vmass soilsoil ∗= ρ (3) where ρ soil is soil density, a user specified constant, and v is the volume of a specific cell. The volume of a cell is computed as
( )hrrv innerouter22 −= π (4)
where router and rinner refer to the distances from the borehole center to the outer and inner walls of an individual cell and h is the cell height. Note that for a fixed ∆r = router – rinner, the difference between r2outer and r2inner increases as the distance from the borehole increases. Therefore, the volume (and thus mass) of each cell is a function of distance from the borehole. The initial mass of water in each cell can be calculated from the percent water in the soil once the mass of soil in a cell is known. Equation (1) requires knowing the specific heat of the material. The specific heat of water is a standard thermodynamic quantity (0.00418 kJ/g/°C). The specific heat of soil is much less well known, as it varies with the composition of the specific soil considered. At ambient temperature, the specific heat of soil is reported to be 0.00071 kJ/g/°C (Mitchell 1993). The specific heat increases with temperature and becomes relatively constant in molten materials at 0.00117 kJ/g/°C. Since the soil near the borehole primarily exists in the molten state, a value of 0.00117 kJ/g/°C for the specific heat of soil was adopted. In the case of a cell containing wet soil, the specific heat required in (1) is an arithmetic average of the specific heats of both water and soil.
watersoil
waterpwatersoilpsoiltotalp massmass
CmassCmassC
++
=)*()*( ,,
, (5)
Thus, given the appropriate mass, specific heat, and q, the temperature increase at any given time step for any cell can be calculated. The heat flow into a cell resulting from conduction can be described in one dimension by Fourier’s law:
wTaq ∆= **κ (6)
where κ is the thermal conductivity, a is the area normal to the heat conduction, and w is the distance over which the ∆T exists. Thermal conductivity is related to thermal diffusivity (α) by

15
pC** ρακ = (7) where ρ is density. Thermal diffusivity is a function of temperature. Few studies of soil thermal diffusivity at temperatures relevant to vitrification have been reported. To overcome this problem, literature values for the thermal diffusivity of crystalline SiO2 from 0 to 861°C (Touloukian 1973) were plotted as a function of temperature and a second order equation regressed through the data. This fit-to-literature data yielded:
( ) ( ) 0231.0*10*4*10*4 528 +−= −− TTα (8) Substitution into (7) yields the thermal conductivity at any given temperature, though the conductivities above 861°C are unverified extrapolations. Note that density and specific heat are also temperature-dependent terms but these effects were ignored in this model. The model involves constructing a finite element mesh by subdividing a vertical plane from the center of the borehole out into individual elements or cells (Figure 4.1a, p. 16). In this model, each finite element or cell represents a ring r distance from the borehole, w units wide, h units high, and d units thick where d is a function of 2πr. The user defines cell width and height, the total number of vertical and horizontal cells, borehole diameter, and the initial height of the torch above the borehole bottom. The ambient temperature in each cell is initially set to 25°C, and a 25°C boundary condition is adopted for all sides of the finite element mesh. An input file specifies torch power and the water content of the soil. This file can also require that the torch be moved vertically after a given amount of time at a given vertical position. Because this movement is incorporated into a looping structure, the torch can be moved as many times as the user desires. Calculating the temperature change in a cell requires calculating the total heat flux (q) into a cell. For cells not adjacent to the borehole, the total heat flux is the sum of the heat fluxes from each of the cell’s four nearest neighbors (q1, q2, q3 and q4) or
4321 qqqqqtotal +++= (9) Once the total heat flux is known, any associated temperature change is calculated in one of three ways. If the temperature of the cell is less than 100°C, (1) is used to calculate the temperature increase. If the temperature of the cell is equal to 100°C and water is present, (2) is used to determine how much water is transformed to steam. The mass of water in the cell is decremented accordingly and the temperature is held constant at 100°C. Once the mass of water reaches zero, (1) is again applied to compute the temperature increase. In the first case, the specific heat in (1) is calculated using (5); in the third case, this specific heat is simply the specific heat of soil. For cells adjacent to the borehole, a different strategy is required. Specifically, the boundary conditions for these cells need to be determined. For cells horizontally adjacent to the borehole, determining this boundary condition involves calculating q1 as a function of radiation from the torch. For the cell vertically below the borehole, determining this boundary condition involves calculating q4 as a function of this radiation. In both cases, radiation from the torch is assumed to be specular; that is, heat

16
is assumed to radiate identically in all directions. Therefore, the appropriate boundary condition is only a function of the fraction of total radiation that strikes the edge of a particular cell.
(a) (b)
z
14
012318192021-6-5-4
0-1-2-3
54321
9876
13121110
q1q2
q3
q4
n = -6
n = -5
n = -4
n = -3
n = -2
n = -1
n = 0
n = 1
n = 2
n = 3
n = 4
n = 5
n = 6
n = 7
n = 8
n = 9
n = 10
n = 11
n = 12
n = 13
n = 14
m = 21m = 20m = 19 m = 18 m = 3 m = 2 m = 1 m = 0
15n = 15
x…
…
rbore
TC3
TC4
TC2
TC1
z
14
012318192021-6-5-4
0-1-2-3
54321
9876
13121110
q1q2
q3
q4
n = -6
n = -5
n = -4
n = -3
n = -2
n = -1
n = 0
n = 1
n = 2
n = 3
n = 4
n = 5
n = 6
n = 7
n = 8
n = 9
n = 10
n = 11
n = 12
n = 13
n = 14
m = 21m = 20m = 19 m = 18 m = 3 m = 2 m = 1 m = 0
15n = 15
x…
…
rbore
TC3
TC4
TC2
TC1
z = 1
z = 0
x = 0x = 1m = 1
θn = angle to top of nth cell
z = -1n = -1
n = 0
n = 1
Lr
θ1
θ0
m = 0
β
z = 1
z = 0
x = 0x = 1m = 1
θn = angle to top of nth cell
z = -1n = -1
n = 0
n = 1
Lr
θ1
θ0
m = 0
β
Figure 4.1 (a) Finite element mesh for Fortran thermal model. The mesh extends 20 cells in the x dimension and 21 cells in the z dimension. Boundary conditions are set to 25°C along the top, bottom and left hand side of the mesh (gray cells). The borehole is defined to be at x = 0 and z ≥ 0 (black cells) with a radius equal to rbore. The user defines the width and height of each cell. The heat flux into any cell is the sum of the fluxes from the cells of the four nearest neighbors (i.e., the sum of q1, q2, q3, and q4). TC1-TC4 are coordinate locations whose thermal data was written to output files. (b) Close-up of the geometry adjacent to the borehole. The circle represents a sphere of radius r. The torch is located in the center of this sphere. Heat radiates identically in all directions from this source. θn is the angle to the top of the nth cell. β is the angle between 2 lines extending from the center of the circle to the top and bottom of cell n. The two gray circles represent parallel circles of latitude on a sphere. The radiation into any cell n is equal to the radiation through the arc labeled β. Thus, to determine the boundary condition for cells adjacent to the borehole, it is necessary to determine the surface area of the band between these two latitudes.

17
The fractional flux into any cell adjacent to the borehole can be computed by defining θn as the angle to the top of the cell in layer n (Figure 4.1b, p. 16). Thus,
nrL θcos= (10) where L, r and n are defined as in Figure 4.1b. The white “circle” in Figure 4.1b is actually a sphere or globe whose center is the torch. The two gray circles represent two parallel circles of latitude around this globe. The top circle is located at the latitude where a line extending from the center of the globe to the top of cell n pierces the globe’s surface; the bottom circle is located at the latitude where a line extending from the center of the globe to the bottom of cell n pierces the globe’s surface. The radiation into cell n is equal to the radiation through the surface area between these two circles. For an infinitesimal angle dβ between two adjacent parallels of latitude, this surface area is equal to
βcrddA = (11) where c is the circumference of the parallels (radius L), and β is the angle defined in Figure 4.1b. We also know that
θππ cos22 rLc == (12) Since β and θ are angles of the same circle, dβ = dθ, so
θθπβθπβπ drrdrrdLdA cos2)cos(2)2( 2=== (13) For values of n ≥ 0, the angle to the top of cell n is
+= −
rnh
n 2)12(tan 1θ (14)
For values of n < 0,
1−−−= nθθ (15) Integrating (13) from n-1 to n yields the surface area between the parallels of latitude that bound cell n
∫∫ == θθπ drdAA cos2 2 (16) n
nn rA1
2 sin2−
= θπ (17) The total surface area of a sphere is 4πr2. Thus, the fraction of the radiation from the torch entering any given cell at height n is
[ ] [ ]112
2
2 sinsin21sinsin
42
4 −− −=−== nnnnn
n rr
rA
F θθθθππ
π (18)
For cells adjacent to the borehole, the boundary condition for q1 is 1 nQFq = (19)
where Q is torch power in kJ/second and n refers to the vertical level of the cell. If n ≥ 0,
−−
+= −−
rnh
rnhFn 2
)12(tansin2
)12(tansin21 11 (20)

18
For the cell directly below the borehole,
nn FF −−= (21)
which is numerically identical to (20). For this cell, the integration is performed from θ to –(π/2) yielding
+
+= − 1
2)12(tansin
21 1
rnhFn (22)
because sin –(π/2) is –1. For this cell, the boundary condition is 4 nQFq = (23)
where Fn is defined by (22). Once the boundary conditions for the cells adjacent to and immediately below the borehole are calculated, the thermal conductivity coefficient for each cell is determined using (7). Then q2, q3, and q4 are calculated for the cells adjacent to the borehole, and q2 and q3 for the cell below the borehole (q1 is zero for all cells directly below the borehole). Next, the individual heat fluxes (q1, q2, q3 and q4) for the non-adjacent cells are determined using (6) as discussed above. The total heat flux is then used to calculate any associated temperature change. The model concludes by writing output files that show the temperature in chosen cells as a function of each time step, and the temperature in all cells at discrete time steps. Two preliminary tests were conducted to check if the model is working appropriately. In the first test, all the fractional fluxes into the cells adjacent to and directly below the borehole were summed. These fractional fluxes should sum to the total torch power if the boundary conditions are properly calculated. In the second test, the energy input into the model (i.e., torch power multiplied by seconds of operation) was compared to the sum of all heat fluxes into each cell at each time step. If the heat fluxes are calculated correctly, energy conservation requires that these energies balance. Both tests yielded satisfactory results suggesting that the model contains no coding errors and is an appropriate description of heat transfer via conduction in one dimension.
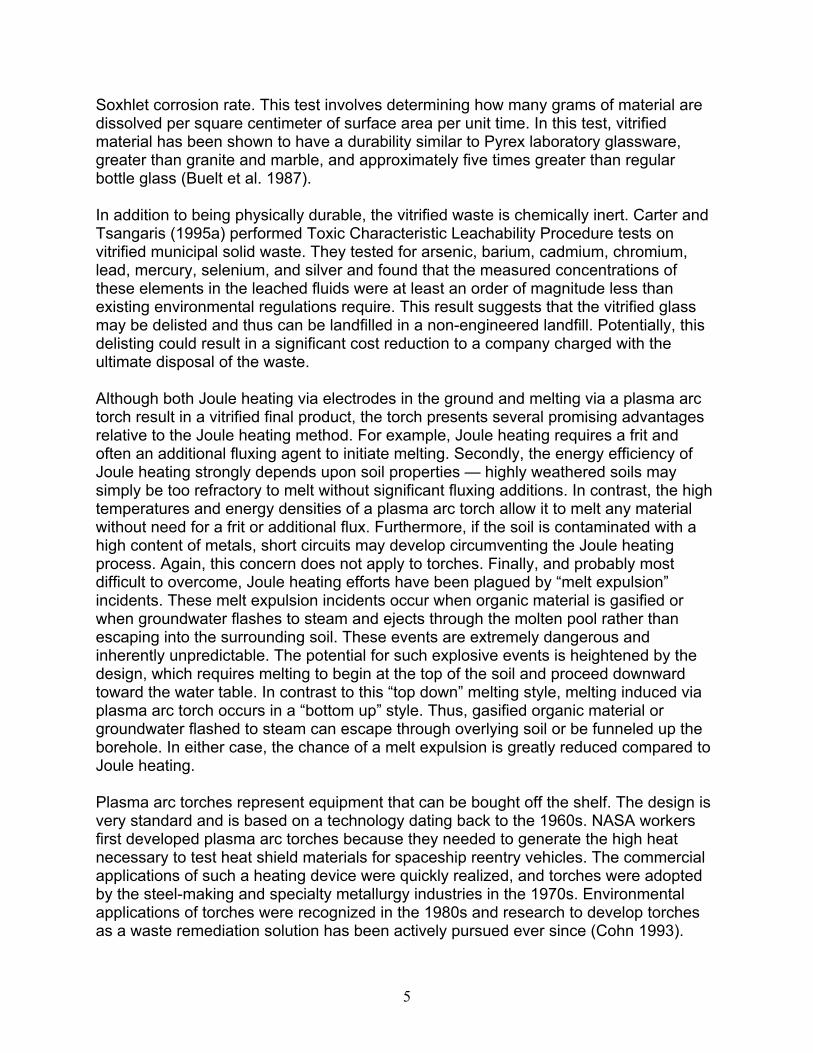
4.1 Thermal Modeling Results Temperatures generated by this model can be examined in two ways. First, the temperature in particular cells can be examined at every time step. Alternatively, the temperature in all cells can be examined at one particular time step. Figure 4.2a (p. 19) shows temperature variation as a function of time for cells located at the same vertical height as the torch but at distances of 3, 6, 9, 12, and 15 inches horizontally away from the borehole. Input conditions are a 200 kW torch, 26 weight percent water in the soil, and a 6-inch diameter borehole. Assuming a 1600°C soil melting point, these model results indicate that the maximum radius of vitrification is only ~6 inches even after two hours. Indeed, for locations close to the borehole, temperature appears to increase quickly within the first 30 minutes, then asymptotically approaches a maximum level. For locations more than a foot away from the borehole, temperature increases much
19
more slowly. Both observations imply that powering a real torch for extended times is energy inefficient; most of the region that will melt, melts rapidly.
0
500
1000
1500
2000
2500
3000
3500
Tem
pera
ture
(°C
)
0
50
100
150
200
250
300
350
400
450
0 10 20 30 40 50 60 70 80 90 100 110 120
Time (minutes)
Tem
pera
ture
(°C
)
(b)
boiling water
d = 3
(a)
200 kW torch, 26 wt. % H2O
d = 6
d = 9
d = 12
d = 15
Figure 4.2 (a) Temperatures at a distance of 3, 6, 9, 12 and 15 inches from the borehole at the height of the torch calculated as a function of time using a Fortran heat transfer model. These temperatures were calculated after specifying a 200 kW torch, a 6-inch diameter borehole, and a soil water content of 26 weight percent. (b) An enlargement of the data in (a) reveals a plateau at 100°C where all input energy is used to boil water in the soil before the temperature of the soil itself can be raised. Note that the point 15 inches from the borehole remains below 100°C even after two hours of heating. Figure 4.2b is a close-up of the model output data in Figure 4.2a with the y-axis having a maximum value of 500°C. This figure clearly shows a plateau at each location at 100°C corresponding to the boiling point of water. This plateau occurs because once a cell reaches 100°C, all the heat that flows into the cell is used to boil pore water until the soil becomes dry. The length of the plateau and the time to reach the plateau increase as distance from the borehole increases. This relationship is partly because heat conduction becomes less efficient as distance from the torch increases and partly because the absolute amount of water in each cell becomes larger as distance from the torch increases as discussed earlier. The significance of this finding is that remediating

20
sites below the water table will be energy inefficient. Much of the energy input into the soil will be expended boiling ground water rather than raising soil temperature to its melting point. If water recharges into the area faster than it is boiled away, in fact, plasma arc technology will fail to cause vitrification, as temperatures will never exceed 100°C. Alternatively, the temperature in each cell at a single instant in time can be examined (Figure 4.3, p. 21). Again, these results were calculated after specifying a 200 kW torch, a soil with 26 weight percent water, and a 6-inch diameter borehole. The finite element mesh is 20 cells wide and 21 cells high with each cell being one inch in height and width. The borehole is represented in Figure 4.3 by the black cells. Model temperatures are shown for time steps of 30, 60, 90 and 120 minutes. Cells colored gray have reached the soil melting point of 1600°C. Again, these model results clearly show that the rate of melting is greatest in the first 30 minutes (5 inch radius) and the melt grows radially very slowly after that. After 120 minutes the melt is 9 inches at its maximum radius. Melting also occurs directly below the torch but is not as significant as the melting that occurs laterally away from the torch; after 120 minutes, the depth of melting below the borehole is projected to be only 4 inches. So far, these model results all assumed a stationary torch. In an actual field setting, the torch would initially be lowered nearly to the bottom of the borehole and then slowly raised as melting began until the entire column of contaminated media was vitrified. Looping the program and specifying how far to raise the torch at the start of each loop models this field situation. Example results for such a moving torch are shown in Figure 4.4 (p. 22). The temperatures at four different locations are shown as a function of time. These locations are (1, -2), (2,2), (1,5) and (2,8), where the first digit corresponds to the distance in inches horizontally away from the borehole and the second digit corresponds to vertical height above (positive) or below (negative) the bottom of the borehole. The torch started at z = 5 (5 inches above the bottom of the borehole) and was raised one inch every 20 minutes for 120 minutes. The initial conditions were specified as 26 weight percent water and a 200 kW torch. The cells located 3 inches above and below the torch, (2,2) and (2,8), have identical temperatures until the torch is raised. Indeed, this top cell reaches the highest temperatures by the end of the model run. These model results are simply an introductory look at the important question of how temperature varies with distance from the borehole. Several key parameters that influence the calculated results (principally soil thermal conductivity and specific heat) are poorly known. In addition, once temperatures have reached the melting point, a dramatic volume change will occur as solid becomes liquid. This volume change will cause collapse and cavity formation in a field setting. These physical changes are difficult to model in a finite element model, which requires that each cell remains a physical entity. Thus, although this model provides a useful preliminary reference point, experimental data are strongly needed. Thermal data collected from laboratory experiments can then be compared to the model results to determine how accurately the model predicts the experimental data.

21
25 25 25 25 25 25 25 25 25 25 25 26 27 29 34 45 64 100 480 932 025 25 25 25 25 25 25 25 25 25 26 26 29 34 47 69 100 657 1194 1475 0
25 25 25 25 25 25 25 25 25 25 26 28 32 43 66 100 672 1286 1614 1844 0
25 25 25 25 25 25 25 25 25 26 27 30 37 57 100 522 1264 1656 1939 2161 025 25 25 25 25 25 25 25 25 26 28 32 45 76 221 1084 1595 1941 2220 2456 0
25 25 25 25 25 25 25 25 25 26 29 36 55 100 609 1416 1842 2177 2471 2739 0
25 25 25 25 25 25 25 25 26 27 30 39 61 100 1009 1626 2030 2373 2695 3010 0
25 25 25 25 25 25 25 25 26 27 31 43 79 265 1251 1772 2168 2526 2880 3254 025 25 25 25 25 25 25 25 26 27 32 46 99 391 1371 1858 2254 2625 3008 3437 0
25 25 25 25 25 25 25 25 26 27 33 48 100 440 1407 1887 2283 2660 3055 3507 0
25 25 25 25 25 25 25 25 26 27 32 46 99 391 1371 1858 2253 2625 3008 3436 0
25 25 25 25 25 25 25 25 26 27 31 43 79 265 1250 1771 2167 2525 2880 3254 025 25 25 25 25 25 25 25 26 27 30 39 61 100 1008 1626 2029 2372 2694 3009 0
25 25 25 25 25 25 25 25 25 26 29 36 55 100 607 1415 1840 2176 2470 2738 0
25 25 25 25 25 25 25 25 25 26 28 32 44 76 217 1080 1592 1938 2217 2455 025 25 25 25 25 25 25 25 25 26 27 30 37 56 100 514 1255 1649 1933 2161 2350
25 25 25 25 25 25 25 25 25 25 26 28 32 43 66 100 646 1265 1594 1826 1994
25 25 25 25 25 25 25 25 25 25 26 26 29 34 46 68 100 584 1128 1416 1595
25 25 25 25 25 25 25 25 25 25 25 26 27 30 35 47 67 100 362 723 102025 25 25 25 25 25 25 25 25 25 25 25 26 27 29 34 43 58 98 100 160
25 25 25 25 25 25 26 26 27 30 34 43 62 100 261 558 937 1203 1392 1541 025 25 25 25 25 25 26 27 30 35 44 62 100 294 709 1127 1400 1606 1772 1909 0
25 25 25 25 25 26 27 29 33 40 55 85 199 625 1132 1449 1688 1885 2053 2196 0
25 25 25 25 25 26 27 30 36 47 68 100 427 1018 1403 1683 1914 2116 2295 2453 025 25 25 25 26 26 28 32 39 55 89 220 738 1266 1602 1870 2104 2318 2517 2701 0
25 25 25 25 26 27 29 34 43 63 100 381 1013 1443 1756 2022 2265 2498 2725 2946 0
25 25 25 25 26 27 30 35 46 67 100 546 1183 1570 1874 2144 2400 2655 2915 3186 0
25 25 25 25 26 27 30 36 48 69 100 680 1288 1657 1958 2234 2503 2780 3077 3407 025 25 25 25 26 28 31 37 50 76 175 770 1346 1708 2010 2290 2569 2863 3190 3574 0
25 25 25 25 26 28 31 37 50 80 195 802 1365 1725 2027 2309 2592 2893 3232 3639 0
25 25 25 25 26 28 31 37 50 76 175 770 1346 1709 2010 2291 2570 2864 3191 3575 0
25 25 25 25 26 27 30 36 48 69 100 680 1288 1658 1959 2235 2504 2781 3078 3408 025 25 25 25 26 27 30 35 46 67 100 545 1184 1571 1875 2145 2402 2657 2917 3188 0
25 25 25 25 26 27 29 34 43 63 100 380 1013 1445 1758 2025 2269 2502 2729 2949 0
25 25 25 25 26 26 28 32 39 55 89 219 738 1269 1606 1875 2110 2325 2524 2708 025 25 25 25 25 26 27 30 36 47 68 100 428 1022 1411 1693 1925 2128 2308 2467 2603
25 25 25 25 25 26 27 29 33 41 56 86 202 635 1147 1467 1709 1908 2075 2216 2327
25 25 25 25 25 26 26 28 30 36 45 64 100 305 752 1170 1447 1654 1818 1949 2047
25 25 25 25 25 25 26 27 28 31 37 48 69 100 324 706 1088 1332 1510 1642 173725 25 25 25 25 25 25 26 27 28 31 36 45 63 100 232 471 798 1054 1221 1330
25 25 25 26 26 27 29 33 38 49 67 100 264 495 801 1062 1261 1419 1552 1667 025 25 26 26 27 30 33 40 52 73 100 302 648 1004 1260 1463 1633 1782 1912 2027 0
25 25 26 27 29 32 38 48 66 100 246 579 999 1295 1523 1716 1887 2041 2181 2305 0
25 26 26 28 30 34 42 55 77 100 396 867 1232 1498 1717 1911 2089 2256 2411 2553 025 26 27 28 31 37 46 64 100 234 608 1080 1401 1652 1870 2071 2261 2445 2623 2790 0
25 26 27 29 32 39 50 69 100 335 810 1230 1527 1773 1994 2204 2409 2614 2820 3025 0
25 26 27 29 33 40 53 72 100 426 956 1337 1622 1866 2092 2312 2533 2761 3001 3256 0
25 26 27 30 34 42 54 74 109 502 1049 1409 1688 1933 2164 2393 2628 2880 3156 3470 025 26 28 30 34 42 56 82 167 560 1102 1451 1728 1974 2208 2444 2690 2959 3265 3633 0
25 26 28 30 35 43 57 85 183 582 1119 1466 1742 1988 2224 2462 2712 2988 3306 3696 0
25 26 28 30 34 42 56 82 168 562 1103 1453 1730 1976 2211 2446 2692 2961 3267 3634 0
25 26 27 30 34 42 54 75 111 505 1054 1413 1693 1938 2169 2398 2633 2884 3160 3473 025 26 27 29 33 40 53 72 100 430 964 1344 1629 1874 2100 2320 2541 2768 3008 3262 0
25 26 27 29 32 39 50 69 100 339 822 1241 1539 1786 2007 2217 2422 2626 2831 3035 0
25 26 27 28 31 37 46 65 100 238 624 1098 1419 1671 1890 2091 2281 2464 2640 2806 025 26 26 28 30 35 42 56 78 100 412 898 1262 1528 1748 1943 2120 2286 2439 2577 2695
25 26 26 27 29 32 38 49 68 100 259 623 1051 1348 1576 1769 1938 2090 2226 2343 2437
25 25 26 27 28 30 35 42 55 76 100 335 746 1107 1360 1559 1726 1869 1993 2096 2176
25 25 26 26 27 29 31 36 45 58 78 139 368 747 1060 1283 1458 1602 1720 1816 188725 25 25 26 26 27 28 31 35 41 51 70 100 293 533 813 1043 1213 1343 1441 1512
25 26 27 28 30 33 38 47 65 100 185 315 523 786 1019 1207 1363 1496 1613 1718 026 27 28 30 34 40 50 67 100 213 413 723 1010 1232 1416 1577 1721 1852 1970 2077 0
26 27 29 33 38 47 61 83 140 352 701 1033 1281 1482 1659 1819 1968 2107 2237 2353 0
26 28 31 35 42 54 72 100 248 558 947 1238 1466 1662 1840 2006 2166 2319 2464 2599 027 29 32 37 46 59 80 100 353 758 1120 1386 1606 1801 1984 2160 2333 2504 2672 2833 0
27 29 33 39 49 67 100 202 480 913 1244 1497 1713 1911 2101 2289 2477 2670 2866 3065 0
27 30 34 41 52 71 100 261 596 1023 1333 1579 1795 1997 2194 2392 2598 2814 3044 3292 0
27 30 35 42 54 73 100 303 685 1097 1394 1636 1853 2059 2262 2471 2691 2930 3197 3502 027 30 35 43 55 74 100 330 740 1140 1430 1671 1888 2097 2304 2520 2751 3007 3304 3663 0
27 30 35 43 56 75 100 339 759 1155 1444 1684 1901 2110 2320 2538 2773 3036 3344 3726 0
27 30 35 43 55 74 100 332 744 1144 1434 1675 1892 2100 2308 2523 2754 3010 3306 3665 0
27 30 35 42 54 73 100 307 694 1106 1402 1644 1861 2067 2270 2478 2697 2936 3202 3507 027 30 34 41 52 71 100 266 610 1038 1346 1592 1808 2010 2207 2405 2609 2824 3053 3300 0
27 29 33 39 50 67 100 208 497 936 1265 1517 1734 1932 2121 2307 2495 2686 2880 3077 0
27 29 32 38 46 60 81 100 370 792 1152 1417 1636 1832 2014 2189 2360 2529 2694 2852 026 28 31 36 43 55 73 100 273 607 1000 1287 1513 1708 1885 2050 2207 2357 2498 2627 2737
26 28 30 34 40 49 65 95 185 410 791 1116 1358 1556 1730 1887 2033 2168 2291 2398 2485
26 27 29 32 36 43 55 74 100 249 527 879 1152 1362 1538 1692 1830 1954 2064 2157 2229
26 26 28 29 32 37 45 58 76 100 279 544 848 1091 1281 1440 1577 1695 1797 1881 194425 26 26 27 29 31 35 41 52 68 100 227 383 599 838 1039 1199 1327 1432 1514 1574
t = 30
t = 120
t = 90
t = 60
Figure 4.3 The temperature in each cell in the finite element mesh reported at 30-minute intervals. These computer data were calculated using a Fortran heat transfer program and specifying a 200 kW torch, a 6-inch diameter borehole, and a 26 weight percent soil water content. Each cell is one square inch; the black column represents the borehole. Cells that are colored gray have reached or exceeded the melting point of 1600°C. Each box represents a different snapshot in time; from top to bottom: 30 minutes, 60 minutes, 90 minutes, 120 minutes. Note that after 2 hours, the model predicts a melt 18 inches in diameter.

22
0
500
1000
1500
2000
2500
3000
3500
4000
0 10 20 30 40 50 60 70 80 90 100 110 120T im e (m in ute s)
Tem
pera
ture
(°C
)
(1 ,-2 )(2 ,2 )(1 ,5 )(2 ,8 )
200 kW to rch, 26 w t. % w ate r
Figure 4.4 Temperatures calculated at 4 specific locations as a function of time assuming a 200 kW moving torch, a 6-inch diameter borehole, and a 26 weight percent soil water content. The legend indicates the four locations. The first number in the parentheses refers to the horizontal distance in inches from the edge of the borehole. The second number refers to the height above (positive) or below (negative) the starting torch height. The torch is defined to be initially at a height of z = 5 and then is moved upwards one inch every 20 minutes for 120 minutes. The last vertical height of the torch is z = 10.

23
5. Laboratory-scale Experimental Methods Two separate experiments to simulate in-situ plasma arc vitrification and to validate model results were conducted at the Georgia Institute of Technology’s Plasma Research Applications Laboratory. In each experiment, a cylindrical steel vessel 4 feet tall and 4 feet in diameter was filled with clean red Georgia clay (Piedmont sandy silt) composed principally of quartz, micas, kaolinite and feldspar. The water content of this soil was measured by weighing the soil before and after drying it overnight at 120°C. The resulting weight loss indicates a water content of 26 weight percent. A 6-inch diameter borehole was centrally located for each experiment. In the first experiment, the borehole (Figure 5.1a, p. 24) was 18 inches long and the torch was 6 inches above the bottom of the borehole. In the second experiment, the borehole (Figure 5.1b) was 27 inches long and the torch was 9 inches above the bottom of the borehole. The torch remained stationary for both experiments. The borehole was lined with a thin metal stovepipe for each experiment. In the first experiment, the stovepipe was only 6 inches long. In the second experiment, the stovepipe was 24 inches long with the first 12 inches buried in soil and the remaining 12 inches extending above the rim of the vessel. In each experiment, 12 K-type (Chromega-Alomega) thermocouples were installed at various heights and distances from the borehole. These thermocouples were grouped in three locations. Four thermocouples were located 26 inches above the bottom of the vessel while the eight remaining thermocouples were located 29 inches above the bottom. These eight thermocouples were split into two groups located 180 degrees apart from each other. In each group of four, the thermocouples were located 8, 10, 12 and 14 inches away from the center axis of the test vessel. During each experiment, six of the thermocouples were interfaced to an Omega DP-472 temperature recorder/data logger, which automatically logged temperatures every minute. The remaining six thermocouples were connected to individual Omega temperature meters configured to accept K-thermocouple inputs. The temperatures displayed by these meters were manually recorded every minute.

24
Cs + Ho
stovepipe
torch
(a)
torch
stovepipe
(b)
Figure 5.1 Experimental configuration for (a) experiment one and (b) experiment two. Note the location of the 12 K-type thermocouples. Drawing is to scale; each box represents one square inch. Also shown is the size of the vitrified material and location of CsCO3 and Ho2O3 doped soil. Both experiments used a 200 kW torch. In the first experiment, however, torch power was held at ~150 kW. In the second experiment, torch power was 200 kW. The first experiment ran for ~3.5 hours and was terminated unexpectedly when an o-ring providing a seal for the torch’s cooling water jacket failed. The leaking cooling water extinguished the plasma. The second experiment ran for 3 hours and was terminated

25
manually. The repaired o-ring leaked during most of this experiment as well, but the plasma was not extinguished. In the first experiment, the torch was located 7 inches above the top set of thermocouples and 6 inches above the bottom of the borehole. In the second experiment, the torch was only 1 inch above the top set of thermocouples but 9 inches above the bottom of the borehole (Figure 5.1). An electrical utility meter is connected solely to the torch’s power supply, and allowed power consumption to be monitored directly. The first experiment used 448.5 kWh of electricity while the second utilized 704.3 kWh. Figure 5.2 shows the test vessel filled with dirt, 8 of the 12 thermocouples, the stovepipe extending from the top of the borehole, the torch, and an orange glow caused by heat from the plasma.
Figure 5.2 Photograph of 4-foot tall – 4-foot diameter vessel loaded with soil. Glow at top of borehole is evidence that the torch is on. Yellow extension wires connect to 8 type-K thermocouples. Four additional thermocouples are installed 180 degrees opposite these thermocouples. In addition to loading the vessel with clean Georgia red clay, non-radioactive CsCO3 and Ho2O3 were used to dope the soil artificially. Cesium is of particular concern in soils contaminated with radioactive waste. The most common 235U fission products are 137Cs and 90Sr. These two elements account for most of the heat and penetrating radiation of high-level waste. They are relatively short-lived isotopes having half-lives on the order

26
of 30 years. Previous research on high-level radioactive waste disposal sites at Oak Ridge National Laboratory has revealed some important patterns. In the soil’s natural unvitrified state, 137Cs isotopes tend to be structurally bound by micas and clays and are not water-soluble. 90Sr, on the other hand, is highly soluble in groundwater and represents a significant migration hazard. Because Sr ions can substitute for Ca ions in bones, 90Sr represents a significant potential human health risk. The results of previous in-situ vitrification tests using Joule heating suggest that this situation reverses itself during vitrification (Spalding and Jacobs 1989; Spalding et al. 1989, 1992, 1997). During vitrification, 90Sr is non-volatile and becomes securely bound in the resulting glass monolith. 137Cs isotopes, however, are relatively volatile and become an air-borne emission hazard that must be trapped and subsequently treated. Thus, prior to treatment 90Sr is the most significant hazard but during treatment 137Cs becomes the most significant hazard. These results were the impetus for choosing to study cesium volatility. Therefore, 100 grams of non-radioactive 99.99 percent pure CsCO3 were added to the soil in each experiment. The cesium was added in the carbonate form because the carbonate is readily available and cheap. Cesium metal is too expensive, and previous work suggests that cesium chlorides artificially increase cesium volatility (Spalding et al 1989). In the first experiment, the CsCO3 was mixed with soil and placed 2 inches below the bottom of the borehole. In the second experiment, the CsCO3 was not mixed with soil and was distributed in a ring 3 inches away from the edge of the borehole and 22.5 inches above the bottom of the test vessel (Figure 5.1, p. 24). A key question to be addressed by these experiments is how much cesium is recovered in the melt zone after the experiment is completed. In other words, how much cesium will migrate or volatilize during the vitrification procedure? Given the large size of the expected melt zone, answering this question might require a statistically significant number of glass analyses. To circumvent this problem, 100 grams of 99.9 percent pure Ho2O3 oxide were added in concert with the CsCO3. Holmium is a rare earth element and was selected based on two criteria: (1) it is low in abundance in most soils, and (2) it is nonvolatile (Boynton 1989; McKay 1989). The CsCO3 and Ho2O3 were intimately intermixed prior to doping the soil. Because holmium is nonvolatile, all 100 grams of added Ho2O3 should be recovered. Although equal masses of CsCO3 and Ho2O3 were added, these masses translate to a 0.79 ratio of cesium to holmium. Thus, if neither element was lost through volatilization, the ratio of cesium to holmium in any glass sample should also be 0.79. If lower ratios are found, this implies that cesium was volatilized during melting. Thus, by doping with a second, nonvolatile element, the need to do a large, statistically significant number of analyses was reduced. In each experiment, the CsCO3 and Ho2O3 were purposefully loaded inhomogenously into the predicted melt zone. By adding the CsCO3 and Ho2O3 inhomogenously, the resulting glass could be tested for homogeneity to evaluate if the molten material became well mixed during vitrification. If the doped material had been initially mixed homogeneously into the soil, the resulting homogeneity of the glass would be inconclusive. The CsCO3 and Ho2O3 were also located entirely within the melt zone predicted by the thermal model to facilitate determining whether any cesium atoms

27
migrated either laterally or vertically into clean, undoped soil during the vitrification process. The amount of cesium and holmium to add was determined by doing a simple order of magnitude calculation. This calculation involved estimating the mass of the expected melt, determining the grams of Cs (or Ho) given the specified grams of CsCO3 (or Ho2O3), and calculating the melt concentration assuming zero volatility. 100 grams was determined to be an appropriate amount as it yielded greater than 1000 ppm of each element in the glass even at full torch power. This concentration is well above analytical background and easily within the resolving power of the analytical techniques used subsequently. After each experiment was terminated, the melt was allowed to cool for at least 24 hours. Then half of the container’s steel wall was unhinged and removed. Soil core samples were taken at the height of the cesium and holmium doping levels. These soil cores were collected by hand by pushing a hollow tube from the outside of the dirt as far into the interior as possible; that is, until the edge of the vitrified zone was contacted. Cores were removed from the tubes and catalogued. After this coring procedure, the soil around the vitrified zone was excavated in stages with photographs taken as each new layer was exposed. Eventually, the vitrified material was completely exposed. The glass was removed from the vessel using a forklift and weighed. For the first experiment, both a vertical and a horizontal slice of vitrified material were retrieved. For the second experiment, the vitrified material was cored both vertically and horizontally. These glass samples along with the soil core samples were transported to the Georgia State University Geology Department for further analytical work.
5.1 Analytical Procedures Soil and glass samples were prepared for major and trace element analysis. Soil core samples were dried overnight at 120°C to drive off adsorbed water. Tweezers were used to remove organic material from the dried soil samples. Large glass samples were trimmed to an appropriate size using a cut-off saw. All samples (soil and glass) were first crushed using a chipmunk crusher and then powdered in a SPEX shatterbox using an alumina ring-and-puck assembly. After powdering, samples were stored in clean, labeled vials. Twelve powdered samples were selected for X-ray Fluorescence (XRF) analysis. Aliquots of these samples were heated to 1000°C for three hours in ceramic crucibles to calculate loss on ignition (LOI). A second aliquot of each sample powder was fused into a glass disc. This fusion was accomplished by mixing 0.5 grams of powdered sample with 4.5 grams of Li2B4O7 flux (a 1:9 ratio). Immediately prior to mixing, the flux was heated to 550°C for several hours to dry it completely. The sample-flux mix was placed into a 95 percent Pt-5 percent Au crucible and melted at 1100°C for 20 minutes. The resulting liquid was poured into a white-hot mold also made of 95 percent Pt-5 percent Au and allowed to cool to room temperature. This glass disc was subsequently

28
analyzed for major elements on a Rigaku 3270 XRF wavelength dispersive spectrometer with a side-window Rh-target tube. A USGS granite standard, G2, was also analyzed as an unknown. The resulting analysis was virtually identical to the accepted analysis suggesting minimal analytical error. Trace element analyses were conducted on each soil and glass sample using a high resolution Finnigan MAT Element2 Inductively Coupled Plasma – Mass Spectrometer (ICP-MS) equipped with a Cetac auto-sampler. Samples were prepared for analysis by weighing 0.100 grams of powdered, dried sample into clean Teflon vials. Approximately 6 ml of reagent grade pure HF acid and ~3 ml of reagent grade pure HNO3 acid were added to each vial. The vials were capped, shaken, and allowed to sit on a hot plate for 24 hours to digest the silicate material. After the acid had digested the rock powder, the lid of each vial was removed and the vials were placed back on the hot plate. After 3-4 hours, the acid evaporated leaving a white sticky residue in the bottom of each vial. A few milliliters of 1 percent HNO3 acid were then added to each vial, and the vials were recapped and placed in an ultrasonic bath for 1 hour to redissolve the trace-element enriched residue. This acid solution was then diluted to a concentration of 100 ppm rock per 10 ml of 1 percent HNO3 acid. An internal standard was prepared for each sample by adding 115In in an amount equal to 1.0 ppb for each 10 ml of sample solution. A procedural blank was also prepared during the digestion process. After the first set of sample digestions, it was noticed that organic material present in the soil samples did not completely dissolve in the HF-HNO3 acid solution. For the second set of sample digestions, an additional step was undertaken to promote digestion of this organic material. After the initial dissolution using HF and HNO3 acid, the samples were evaporated as above. Then a second dissolution was performed by adding ~1 ml of 30 percent H2O2 and ~3 ml of 100 percent HNO3 acid to each vial containing a soil sample. These vials were recapped and set on the hot plate for an additional 24 hours. After this second digestion, the same procedures as above were followed. The ICP-MS measures intensity or counts per second for each mass number, and these intensities must be converted to concentrations by analyzing standards with known concentrations prior to analyzing unknown samples. For this study, standards were prepared with concentrations of 0.5, 1.0, 2.0, 4.0, 8.0 and 10.0 ppb for each trace element of interest. After analyzing these solutions, intensity versus concentration was plotted and the data regressed to a linear fit. All regressions had r2 ≥ 0.999. The pre-analysis takeup time for each sample was 30 seconds, after which each analysis took about 75 seconds. Each sample analysis was followed by a 1 minute wash with 1 percent HNO3. For samples 1-31, a blank was analyzed prior to every fifth sample; for samples 33-53 a blank was analyzed prior to each sample. To correct for dilution effects introduced during sample preparation, analytical results (in ppb) were multiplied by 10,000. Final results are then reported in ppm (µg element/g sample). When more than one isotope of a particular element was analyzed, the reported concentration is an average of all analyzed isotopes.

29
5.2 Thermal Results From Experimental Work One objective of the experimental work was to record temperature variations in the soil as functions of location and time. The previous computer modeling work provides some insight into the expected patterns. For example, isotherms are anticipated to be roughly symmetrical about the torch. Further, these isotherms will define six different thermal regions. From coldest to hottest these thermal regions are (1) wet unaltered soil at room temperature, (2) soil heated above room temperature but below the boiling point of water, (3) soil at 100°C where water is actively being boiled, (4) dry soil above 100°C but below the pyrolysis temperature, (5) soil in the pyrolysis zone which is chemically breaking down but not melting and (6) soil at temperatures above the onset of melting at ~1500°C. These six zones are shown schematically in Figure 5.3a (p. 30). Figure 5.3b is a close-up of material from a previous plasma arc torch experiment. Clearly visible by stark contrasts in color are four of the anticipated thermal zones: red pristine soil, white baked soil, gray unmelted crust, and black glass. Harder to observe in the picture but still present are a fifth zone, black unmelted crust located on the borehole side of the gray crust, and a sixth zone, a thin purple rind between this black crust and the black glass. This rind is composed of partially melted soil with quartz grains still present. Figure 5.3c shows the partially excavated steel vessel at the conclusion of the second experiment. The same four thermal zones visible in Figure 5.3b are clearly observable here, and the symmetry of these zones about the borehole is also clear. Figure 5.3d is a close-up of Figure 5.3c with isotherms superimposed. The approximate temperature of each isotherm was determined by placing an aliquot of soil in a ceramic crucible, and then placing this crucible in a high temperature furnace. The temperature of the furnace was periodically increased after observing any associated color or textural change in the soil. These tests revealed that the soil changed color from red to white at roughly 1000°C, turned gray and ashy at 1300°C, became black and partially sintered at 1400°C, and was partially melted with still-visible quartz grains at 1500°C. Table 5.1 (p. 30) lists key physical properties of the vitrified material in both experiments. The width of the melt zone is very close to that predicted by the thermal modeling (9 inch maximum radius). The specific energy requirement (SER) is calculated by dividing the kWh used during the experiment by the pounds of glass produced. In the first experiment, the SER is 3.5 kWh/lb while in the second it is 5.9 kWh/lb. Typical literature values are 1.2 – 2.5 kWh/lb (Circeo et al. 2001). Two factors may explain this large difference in efficiency. First, most of the melting occurs in the first 30 minutes; however, the torch was run for an additional 2-3 hours using much energy but only modestly increasing the mass of melt. Second, cooling water leaked into the molten zone in both experiments causing a significant portion of input energy to be expended boiling cooling water rather than promoting thermal transfer in the soil. This drain on energy appears to be the only significant impact of this cooling water leak.

30
ambient soil zone
transition zone
dry zone
pyrolysis zone
melt zone
25 °C 100 °C > 1600 °C
ambient soil zone
transition zone
dry zone
pyrolysis zone
melt zone
25 °C 100 °C > 1500 °C
1000 ?C
1300 ?C> 1500 ?C
1000 ?C
1300 ?C> 1500 ?C
Figure 5.3 Clockwise from upper left: (a) The five thermal zones, which should occur as a function of distance from the torch. Temperatures are approximate and depend on soil geochemistry and other factors. (b) Close-up of a previous experiment showing many of the thermal zones schematically depicted in (a). (c) Photograph of partially excavated vessel after experiment two showing changes in soil color as a function of temperature. Four zones are clearly visible: pristine red clay, baked white clay, gray unmelted crust, and black glass. A fifth zone is difficult to observe but is present as a black crust between the gray crust and black glass. (d) Close up of zones in (c) with isotherms superimposed.
Table 5.1 Size of Vitrified Materials.
Item Experiment 1 Experiment 2 glass (inches) 17.5 15.6
gray crust (inches) 18.5 16.6 baked white (inches) 26 23
glass (lbs) 130 120 kWh 448.5 704.3
SER* (kWh/lb glass) 3.5 5.9 SER (kWh/ton glass) 6900 11,738
* SER = specific energy requirement

31
In the first experiment, none of the 12 thermocouples recorded temperatures above 100°C. Thus, little relevant thermal information was gathered. The hottest zones were several inches above the level of the thermocouples. In the second experiment, the torch was lowered 6 inches closer to the thermocouples and torch power was increased from 150 kW to 200 kW. Both of these actions put the thermocouples closer to the hot spot, but none of the 12 thermocouples actually extended into the melting zone (Figure 5.4). In Figure 5.4, the 100°C temperature plateau predicted by the thermal model is clearly visible. Also visible is the extreme steepness of the thermal gradient. Only the three thermocouples located 8 inches from the center of the vessel reached temperatures well above 100°C. Thermocouples located 10 inches from the center were 500 – 900° cooler. These data reinforce the knife-edge differences in soil color shown in Figure 5.3, as well as the narrowness of some of the anticipated thermal zones. Finally, although thermocouples (8,29) and (8,29)b were both located 29 inches above the bottom of the test vessel and 8 inches from the center axis, they recorded temperatures different by 400°C after three hours. The thermal model assumes that temperatures are symmetric about the torch. While this assumption is generally valid, during this experiment the torch was slightly off-center and thus heated different sides in an uneven manner.
0
200
400
600
800
1000
0:00 0:20 0:40 1:00 1:20 1:40 2:00 2:20 2:40 3:00 3:20 3:40 4:00 4:20 4:40
Time (hours:minutes)
Tem
pera
ture
(°C
)
(08,29)
(10,29)
(12,29)
(08,26)
(10,26)
(12,26)
(08,29)b
(10,29)b
(12,29)b
Figure 5.4 Recorded thermocouple temperatures versus time for experiment two. Torch power was manually turned off after 3 hours, but the automatically logged thermocouples continued to record temperatures for another 80 minutes. In the legend, the first number indicates distance from the center of vessel while the second number indicates height above the vessel floor (29 or 26 inches). Thermocouples suffixed with a “b” represent the 3 thermocouples located on the backside of the vessel. For clarity, none of the three thermocouples located 14 inches from the vessel center are shown; they recorded only minimal temperature increases.

32
5.3 Geochemical Results From Experimental Work The pore water content of the Georgia clay used in the experiments was determined to be 26 weight percent by weighing the soil before and after drying it overnight at 120°C. Loss on ignition on three dried soil samples all revealed an additional 8.5 percent structurally bound volatiles (Table 5.2). Major element analytical data for selected soils, crusts, and glasses is also reported in Table 5.2. These data reveal that the starting soil has been heavily leached and is composed almost entirely of SiO2, Al2O3 and Fe2O3. Normalization to 100 percent on an anhydrous basis reveals that the glasses are slightly poorer in SiO2 than the starting soil (71 versus 74 weight percent).
Table 5.2 Major Element Analytical Data sample 4 44 43 42 40 30 45 41 16 25 47 51
description moist & red
moist & red
baked white
gray crust
black crust
partial melt
partial melt
chimney glass glass glass glass glass
SiO2 68.89 68.85 70.73 72.19 72.84 69.42 72.06 71.14 68.18 69.47 69.06 70.83TiO2 0.53 0.49 0.46 0.54 0.53 0.54 0.53 0.54 0.52 0.51 0.55 0.53Al2O3 17.06 17.71 16.56 19.53 18.99 19.86 18.42 19.22 18.53 18.62 19.88 19.25Fe2O3 5.09 5.59 5.17 6.10 6.03 7.54 6.06 6.33 8.07 8.04 7.23 7.07MnO 0.05 0.03 0.04 0.03 0.04 0.04 0.03 0.03 0.04 0.04 0.04 0.04MgO 0.23 0.11 0.12 0.18 0.17 0.22 0.18 0.18 0.22 0.19 0.20 0.20CaO 0.24 0.16 0.18 0.19 0.32 0.34 0.32 0.20 0.39 0.38 0.33 0.31Na2O 0.00 0.00 0.00 0.00 0.00 0.19 0.06 0.00 0.09 0.07 0.10 0.07K2O 0.87 0.40 0.41 0.60 0.46 0.64 0.58 0.51 0.63 0.64 0.59 0.57P2O5 0.06 0.07 0.07 0.07 0.07 0.06 0.07 0.07 0.04 0.05 0.07 0.07subtotal 93.02 93.41 93.74 99.43 99.45 98.85 98.31 98.22 96.71 98.01 98.05 98.94LOI 8.53 8.66 8.17 0.12 0.00 0.00 0.00 0.00 0.00 0.00 0.00 0.00TOTAL 101.55 102.07 101.91 99.43 99.45 98.85 98.31 98.22 96.71 98.01 98.05 98.94normalized to 100% SiO2 74.06 73.71 75.45 72.60 73.24 70.23 73.30 72.43 70.50 70.88 70.43 71.59TiO2 0.57 0.52 0.49 0.54 0.53 0.55 0.54 0.55 0.54 0.52 0.56 0.54Al2O3 18.34 18.96 17.67 19.64 19.10 20.09 18.74 19.57 19.16 19.00 20.28 19.46Fe2O3 5.47 5.98 5.52 6.13 6.06 7.63 6.16 6.44 8.34 8.20 7.37 7.15MnO 0.05 0.03 0.04 0.03 0.04 0.04 0.03 0.03 0.04 0.04 0.04 0.04MgO 0.25 0.12 0.13 0.18 0.17 0.22 0.18 0.18 0.23 0.19 0.20 0.20CaO 0.26 0.17 0.19 0.19 0.32 0.34 0.33 0.20 0.40 0.39 0.34 0.31Na2O 0.00 0.00 0.00 0.00 0.00 0.19 0.06 0.00 0.09 0.07 0.10 0.07K2O 0.94 0.43 0.44 0.60 0.46 0.65 0.59 0.52 0.65 0.65 0.60 0.58P2O5 0.06 0.07 0.07 0.07 0.07 0.06 0.07 0.07 0.04 0.05 0.07 0.07TOTAL 100.00 100.00 100.00 100.00 100.00 100.00 100.00 100.00 100.00 100.00 100.00 100.00 Trace element data for all soils and glasses are reported in Table 5.3 (p. 34) and shown in Figure 5.5 (p. 33). In Figure 5.5, samples are arranged in order of increasing temperature. Virtually every trace element has a lower abundance in the soil than in the glass. No mechanism is apparent, however, to concentrate elements in the glass (the

33
glass cannot behave as a sponge). Thus, this effect may be an artifact of the sample digestion procedure. For samples 1-31, improper digestion of soil organics was believed to cause this difference. Even if the organic material is trace element poor, it contributes mass to the 0.100 grams weighed out. All additional calculations assume that the acid digests this entire mass. If an unknown fraction of sample is not digested, then the solutions analyzed will be more dilute than believed. This unknown level of dilution will make trace element abundances lower than they actually are. To overcome this problem, the additional step of an H2O2 digestion was performed for the second set of samples (33-53). The same behavior, however, is apparent in Figure 5.5b as in Figure 5.5a, suggesting that the problem was not solved.
0
10
20
30
40
50
60
70
80
90
100
36 44 35 39 38 43 42 33 34 37 40 41 45 46 47 48 49 50 51 52 53Sample number (cold to hot)
Trac
e el
emen
t ppm
CoMoSrRbBaCeLaNdUCdPb
red white gray black c pm glass
0
10
20
30
40
50
60
70
80
90
100
4 8 3 7 2 6 1 5 10 11 12 13 9 20 21 22 30 31 14 15 16 17 18 19 23 24 25 26 27 28 29
Trac
e el
emen
t ppm
CoMoSrBaCeLaNdUCdPb
red gray c partial melt glass (a)
(b)
Figure 5.5 Trace element ICP-MS data for the two plasma torch experiments. (a) Data from the first run where torch power was ~150 kW; (b) data from second run where torch power was 200 kW. In both cases, data are plotted as a function of temperature as samples are arranged (left to right) from coldest to hottest; i.e., samples are arranged as follows red soils (red), white soils (white), gray crust (gray), black crust (black), chimney glass (c), partial melts (partial melt or pm) and then glasses (glass).

Table 5.3 Trace Element Analytical Data
description ID Rb Cs Sr Ba La Ce Nd Ho U Co Mo Cd Pb soil RHS 9.5-9" in 4 na 3.91 47.22 272.23 18.63 53.41 16.19 1.23 2.69 9.78 0.74 0.13 22.43soil LHS 9.5-9" in 8 na 2.69 30.45 187.18 11.63 35.60 10.37 1.60 2.15 6.02 0.63 0.10 18.45soil RHS 12.5-13" in 3 na 2.48 26.02 164.61 15.39 37.61 12.51 1.19 2.25 5.94 0.67 0.09 16.92soil LHS 12.5-13" in 7 na 2.81 34.76 226.78 14.56 43.88 12.20 1.27 2.69 7.57 0.78 0.15 22.79soil RHS 14.5-15" in 2 na 5.79 34.48 201.27 11.87 35.32 10.49 1.70 2.14 7.94 0.82 0.13 19.75soil LHS 14.5-15" in 6 na 3.00 40.14 256.54 16.99 49.22 14.82 1.26 2.95 7.34 0.80 0.11 25.22soil RHS 16.5-17" in 1 na 2940 62.36 273.03 13.27 35.65 10.94 1955 2.08 6.03 0.60 0.13 19.99soil LHS 16.5-17" in 5 na 2.25 32.72 217.59 15.45 46.39 13.51 0.49 2.32 6.99 0.82 0.37 22.71gray crust bottom 10 na 20586 40.95 408.79 23.00 69.11 19.27 17441 4.47 15.15 1.01 0.18 39.07gray crust bottom 11 na 16112 37.74 353.44 22.53 63.25 18.55 16616 3.75 14.69 0.95 0.15 32.70gray crust bottom 12 na 92.72 50.25 296.18 22.06 59.40 18.66 61.81 3.09 32.01 0.87 0.08 28.07gray crust side 13 na 4.13 70.06 367.88 20.26 61.04 17.27 6.32 2.76 16.23 0.80 0.07 23.77chimney glass 9 na 42.09 50.50 258.99 16.83 46.80 14.03 56.06 3.24 10.20 0.86 0.10 25.76partial melt - edge 20 na 7.64 61.74 296.87 22.35 61.51 18.34 3.50 3.04 10.43 0.91 0.44 29.08partial melt - edge 21 na 3.75 66.25 305.49 22.48 61.45 18.60 0.72 2.85 10.21 0.93 0.12 21.11partial melt - edge 22 na 11.40 67.25 281.78 20.14 55.31 16.82 1.92 2.65 9.04 1.05 0.13 19.53partial melt - bottom 30 na 2.40 46.75 227.78 16.57 44.95 13.95 0.14 2.30 7.62 0.58 0.12 16.05partial melt - bottom 31 na 3.09 50.29 245.06 18.02 49.83 15.04 0.82 2.45 8.11 0.72 0.11 16.44glass - horizontal 14 na 3.98 65.01 287.58 20.05 55.91 16.94 4.38 2.32 9.11 0.79 0.11 12.41glass - horizontal 15 na 3.20 64.72 298.33 20.28 56.32 17.20 1.27 2.30 9.14 0.76 0.12 12.36glass - horizontal 16 na 3.54 62.85 290.45 19.52 54.22 16.78 0.56 2.29 8.49 0.79 0.12 11.93glass - horizontal 17 na 2.93 63.32 294.82 19.58 55.04 17.07 0.39 2.28 8.98 0.75 0.11 12.21glass - horizontal 18 na 3.07 65.82 301.56 21.56 58.88 17.66 0.20 2.31 9.09 0.75 0.10 12.32glass - horizontal 19 na 3.50 65.87 298.40 21.61 58.34 17.57 1.75 2.40 9.59 0.97 0.26 18.47glass - vertical - top 23 na 3.65 57.59 274.17 18.96 49.68 15.52 0.82 2.77 10.23 2.10 0.13 24.89glass - vertical - top 24 na 2.74 61.67 284.00 19.67 54.95 16.28 0.15 2.40 8.64 0.89 0.12 14.28glass - vertical 25 na 2.28 50.48 231.59 16.02 43.54 13.26 0.33 1.86 7.24 0.63 0.11 10.09glass - vertical 26 na 2.74 63.88 292.78 20.13 55.59 16.92 0.16 2.25 8.97 0.79 0.13 12.55glass - vertical 27 na 2.14 50.37 232.83 15.82 43.85 13.39 0.02 1.80 7.12 0.62 0.11 9.63glass - vertical 28 na 2.79 66.74 300.75 20.74 57.31 17.37 0.14 2.38 9.54 0.75 0.12 12.40glass - vertical 29 na 2.14 51.38 235.20 16.23 45.20 13.69 0.02 1.95 8.26 1.48 0.11 10.11RHS - still moist soil 36 22.53 nd 18.29 113.23 6.98 21.92 5.90 nd 0.33 4.56 0.17 nd 11.84soil moist and red 44 20.51 1.56 16.93 124.19 3.15 12.90 3.45 0.14 0.85 4.59 0.47 0.36 15.47RHS - red baked crust 35 22.03 0.11 20.49 113.05 7.29 22.89 6.34 nd 0.36 4.58 0.17 nd 11.85LHS - red crust 39 20.85 nd 85.29 158.05 7.17 19.09 5.86 nd 0.00 3.67 0.03 nd 9.34LHS - red crust 38 23.44 nd 24.61 142.56 6.49 24.39 5.92 nd 0.70 5.13 0.15 nd 12.28baked red & white crust 43 23.37 2.00 19.51 122.23 6.85 21.94 6.00 nd 0.32 5.48 0.20 nd 13.33

gray crust 42 39.64 2.63 31.58 187.50 13.62 38.26 11.90 nd 0.98 8.08 0.47 nd 18.63RHS - black crust 34 28.04 0.87 34.47 156.56 7.32 22.61 6.27 nd 0.46 4.39 0.19 nd 14.73RHS hottest - black 33 28.07 15.55 28.18 159.63 9.88 29.79 8.29 17.11 0.75 5.55 0.35 nd 16.96LHS hottest – black crust 37 27.75 0.69 22.13 143.56 9.93 30.19 8.41 nd 0.65 6.05 0.27 nd 14.41black crust 40 25.70 1.06 20.37 119.33 7.51 24.08 6.62 1.35 0.54 5.83 0.15 nd 11.75chimney glass 41 43.73 25.63 44.11 205.97 14.12 42.18 12.60 3.57 1.38 10.65 0.38 nd 22.36purple partially melted 45 36.37 21.75 44.09 208.82 13.66 38.97 11.56 7.01 1.82 7.43 0.59 0.33 19.56vertical - top 46 28.42 627.64 39.71 176.86 10.81 31.09 8.99 792.72 0.69 6.14 0.47 0.30 7.08vertical - middle 47 29.18 664.88 40.58 176.08 11.21 31.84 9.18 799.37 0.80 6.54 0.68 0.31 9.38vertical - bottom 48 30.97 336.20 39.06 184.12 11.37 33.53 9.68 384.93 1.03 7.42 0.73 0.32 13.95horizontal - edge 49 27.39 7922 34.44 153.90 9.40 28.41 8.14 2651 0.86 6.11 0.50 0.31 12.73horizontal - middle 50 26.96 598.16 37.04 166.60 10.03 28.86 8.43 757.59 0.47 5.86 0.59 0.30 5.50horizontal - middle 51 26.95 541.93 36.84 167.52 9.66 28.25 8.28 675.98 0.51 5.79 0.42 0.31 6.91horizontal - middle 52 28.24 629.19 38.91 174.70 10.25 29.66 8.69 805.74 0.50 6.12 0.48 0.30 5.42horizontal - other edge 53 28.46 651.07 38.43 174.55 10.32 29.53 8.78 812.64 0.57 6.29 0.51 0.31 7.61
na = not analyzed nd = below detection limit

36
The glasses tend to be homogenous in trace elements while the unvitrified material is less homogenous (Figure 5.5, p. 33), suggesting that convection within the molten zone was vigorous. This convection was probably not driven by thermal differences. Heating occurs from the top of the melt zone so hot material is located above colder material, a convectively stable situation. Instead, in this case convection is driven mechanically by the sheer force of the plasma gas torch, like putting an air nozzle in a bucket of dirt. Little correlation exists between the major and trace elements (Figure 5.6). This lack of correlation suggests that the melting process is non-equilibrium, not surprising given the very short time scale involved. Clearly, the vitrification process involves flash melting and does not represent a gradation from metamorphic to igneous processes as might be true in a natural geologic setting. The intense, abrupt nature of flash melting means that trace elements are not coupled to major element variations.
0
10
20
30
40
50
60
70
80
70 71 72 73 74 75 76
SiO2 wt. %
Trac
e el
emen
t ppm
RbSrBaLaCeNdPb
Figure 5.6 Trace elements versus SiO2 content normalized to 100% anhydrous. La and Nd follow each other perfectly, but otherwise little pattern is noticeable. This disconnect between major and trace elements argues that melting is a very rapid, non-equilibrium process. A goal of this experimental work was to decipher geochemical changes caused by the vitrification process (Dragun 1991) by comparing unprocessed material with processed material. This comparison was difficult to make, however, because of incomplete soil digestions. Thus, a different approach was required. After examining the data, the best representation of the trace element content of the unprocessed material appears to be the gray crust. These samples (10 - 13 and 42) tend to be richer in all trace elements than the soil samples (Figure 5.5) and thus represent samples in which the vitrification process ignited the organic material but did not cause melting. To determine the geochemical effects of vitrification, all gray crustal samples from each run were averaged, and all glass samples from each run were averaged. The average glass content was then divided by the average crustal content (Figure 5.7). Only two elements

37
(Sr and Mo) show ratios greater than one. Molybdenum may be enriched in the glass because the stovepipe used to keep the borehole from crumbling was partially melted during each experiment. The stovepipe is an iron alloy and probably contained Mo as a trace element. More stovepipe was melted in the second experiment than the first and indeed the ratio of Mo in glass/crust is higher in this second run. All other elements have ratios below one, suggesting that these elements were lost to different extents from the glass. The element with the lowest ratio is lead, indicating that lead is the most volatile of the elements measured. Thus, if a lead-rich site was remediated (for example, a contaminated Army range), serious effort would be needed to avoid transforming a solid hazard problem into an air pollution problem.
0.0
0.2
0.4
0.6
0.8
1.0
1.2
1.4
Sr Mo Cd La Nd Ce Rb Ba U Co Pb
aver
age
glas
s/av
erag
e cr
ust run 1
run 2
Figure 5.7 The average concentration of each trace element in the glass was divided by the average concentration of the same trace element in the gray crust to determine which elements are volatilized during the melting process. Run 1 refers to the 150 kW run while run 2 is the 200 kW run. In each experiment, the soils were doped with cesium and holmium in a ratio equal to 0.79 so that the behavior of a volatile radioactive element could be simulated. In the first experiment, the cesium and holmium were added below the borehole but the melt zone did not extend far enough below the borehole to melt the doped material. This conclusion is reinforced by the low cesium and holmium abundances in the glasses and their high abundances in the crust samples taken from the bottom of the borehole (Table 5.3, p. 34). In the second experiment, the doped material was added as a ring around the borehole. During excavation of the glass, a ring of yellow material was observed embedded in the black crust at precisely the location where the cesium and holmium had been added. This ring extended only partially around the entire glass sample, suggesting that part (but not all) of the doped material melted. This conclusion was confirmed by the above-background levels of cesium and holmium found in the glasses in this run (Table 5.3). The ratio of Cs/Ho is 0.79 in all but one of the glass

38
samples. This ratio is identical to the starting ratio, indicating that little-to-no cesium was volatilized during melting. The one sample with a high ratio is an edge sample and may have been contaminated with unmelted starting material richer in cesium than holmium. The average holmium concentration in the glass (774 ppm) was divided by the total mass of glass to determine how much Ho2O3 melted; this calculation indicated that 48 of the 100 grams melted. A similar calculation was performed using the average cesium concentration in the glass (623 ppm) and revealed that 49 grams of the CsCO3 melted. Thus, both elements indicate that roughly 50 percent of the doped region was melted. Prior work on in-situ vitrification using Joule heating revealed that cesium is volatile during the melting process — Spalding et al. (1992) calculated that 2.4 percent of the 137Cs was volatilized from the melt. Although this is a relatively modest percentage, given the large quantities of radioactive cesium in the ground, it represents a significant health hazard. In the present work, by contrast, virtually no cesium was volatilized during melting. This lack of volatility may result from two factors. First, the time of melting was much shorter in these laboratory-scale experiments (3 hours) than in the Joule heating tests conducted at Oak Ridge National Laboratory disposal sites (5 days). Secondly, the plasma arc torch causes nearly instantaneous melting. Although the melt zone does grow with time, this growth is very small compared to the initial extent of melting. On the other hand, Joule heating is a much slower melting process. Thus, vitrification induced by plasma torch causes an extremely rapid transformation from solid to liquid, while Joule heating has a much more extended heating period prior to this same transformation. As the soil is heated, clays and micas that contain structurally bound cesium break down, releasing the cesium. Once a melt is present, a cesium sink again exists. In the interim period, however, when clays and micas have broken down and melt does not yet exist, cesium volatility may be at a maximum. Thus, a reduction in cesium volatility may potentially be achieved by decreasing the lag time between heating and melting; plasma arc torches minimize this lag time compared to Joule heating. Spalding (2001) noted that complete melting might not be necessary to achieve vitrification’s environmental benefits. Specifically, he observed that many of these benefits could be achieved simply by heating the soil, since heating causes contaminants to migrate into grain interiors. Once there, the contaminant is inaccessible to surficial weathering processes and eventual mobilization in groundwater. If true, the importance of this observation is that energy does not need to be expended to reach a soil’s melting point. Instead, energy is needed to raise the temperature of the soil only briefly. Of course, the long-term stability of the cooked grains must be balanced with the observation that transient high temperatures below the melting point can lead to increased short-term volatility. Spalding’s work further suggests that even if vitrification is ultimately preferred, vitrification of the entire site might be unnecessary. In other words, the desired environmental benefits might be achieved by emplacing widely spaced boreholes with no requirement that vitrified columns overlap. As long as the soil between the columns is heated during vitrification, any included contaminants would be structurally bound in the cooked soil. This strategy would significantly reduce the energy required and, by extension, site remediation costs.

39
6. In-situ Plasma Arc Vitrification Costs Even if plasma arc vitrification solved every imaginable environmental problem, this technology still must be economically competitive to gain widespread acceptance. Although several key factors affecting cost are yet unknown, an order-of-magnitude cost can be estimated (Table 6.1, p. 40). These estimates assume electrical power is available on site, a mobile gas treatment system can be delivered to the site, no interest payments on capital equipment are necessary, and a 5-megawatt torch is available for use. The numbers in boxes are variables that must be estimated; all other numbers are calculated given these starting estimates. Costs can be broken down into three general categories: site specific costs, capitol costs for a 5-megawatt torch system, and operating costs. Site-specific costs include the cost of energy per kWh, years of equipment life, acres contaminated, depth of contamination, and soil density. Each of these factors is estimated in Table 6.1. A 1-acre site contaminated to a depth of 10 feet with an average density of 100 pounds/ft3 equates to 21,780 tons of contaminated material requiring treatment. Capital costs include money for engineering, design, and production of the torch, a mobile platform on which to mount the torch so that it can be moved from borehole to borehole, a gas collection and treatment system, gas and slag analysis during treatment, and system shakedown costs. Again, estimates of these numbers are given in Table 6.1 and used to compute a total capital cost of $10 million. Operating costs cover several categories: emplacement of clean overburden and boreholes, power, labor, and maintenance. Representative costs are given in Table 6.1. These estimates include two key variables that are not well known: the radius of vitrification given a large megawatt torch and the specific energy required (SER) to melt a ton of contaminated soil. Associated costs were bracketed by choosing a range of values for these variables (2 – 16 feet for the radius of vitrification and 500 – 10,000 kWh/ton for the SER). The SER values chosen range from a minimum representing the heat of fusion of rock to a maximum close to the value calculated from the second experiment. Summing all the costs together produces estimates ranging from $134 to $2081 per ton of contaminated soil. Although these prices are only a rough estimate, they do suggest that plasma arc vitrification is cost competitive with other treatment techniques.

40
Table 6.1 Economic Calculations
1 Site Specific Variables 1a power cost per kWh $0.05 $0.05 $0.05 $0.05 1b years of equipment life 10 10 10 10 years 1c acres contaminated 1 1 1 1 acre(s) 1d depth of contamination 10 10 10 10 feet 1e soil density 100 100 100 100 lb/ft^3
1f square feet contaminated (1 acre = 43,560 ft^2) 43,560 43,560 43,560 43,560 ft^2
1g volume contaminated = depth x area = 1d*1f 435,600 435,600 435,600 435,600 ft^3
1h tons of contaminated soil = (1e*1g)/2000 21,780 21,780 21,780 21,780 tons
2 Capital Costs 2a engineering and design $500,000 $500,000 $500,000 $500,000
2b 5 MW plasma heating system (20 foot torch with spare parts) $6,000,000 $6,000,000 $6,000,000 $6,000,000
2c mobile platform $300,000 $300,000 $300,000 $300,000
2d gas collection and treatment system $1,500,000 $1,500,000 $1,500,000 $1,500,000
2e gas/slag analysis systems $300,000 $300,000 $300,000 $300,000
2f system integration/shakedown $400,000 $400,000 $400,000 $400,000
2g total capitol costs = sum(2a:2f) $9,000,000 $9,000,000 $9,000,000 $9,000,000
2h contingency (10% of total capitol costs) $900,000 $900,000 $900,000 $900,000
2i total capitol costs $9,900,000 $9,900,000 $9,900,000 $9,900,000 subtotal $10,000,000 $10,000,000 $10,000,000 $10,000,000 3 Operating Costs 3a Overburden 3a1 cost per yd^3 of clean overburden $100 $100 $100 $100
3a2 depth of clean overburden over contaminated area 2 2 2 2 feet
3a3 total ft^2 to cover 43,560 43,560 43,560 43,560 ft^2 3a4 total ft^3 of overburden = 3a1*3a2 87,120 87,120 87,120 87,120 ft^3 3a5 total yd^3 of overburden = ft^3/27 3,227 3,227 3,227 3,227 yd^3 3a6 total overburden cost = 3a1*3a5 $322,667 $322,667 $322,667 $322,667 subtotal $400,000 $400,000 $400,000 $400,000 3b Boreholes 3b1 cost per borehole $200 $200 $200 $200
3b2 radius of vitrification for each 5 MW torch 2 4 8 16 feet
3b3 area vitrified = πr^2 = π*3b2^2 13 50 201 804 ft^2
3b4 # of boreholes = contaminated area/vitrified area = 1f/3b2 3466 867 217 54 boreholes

41
3b5 total borehole cost = 3b1*3b4 $693,279 $173,320 $43,330 $10,832 subtotal $700,000 $200,000 $100,000 $100,000 3c Power 3c1 torch power 5000 5000 5000 5000 kW
3c2 specific energy requirement per ton of soil 10000 5000 2000 500 kWh/ton
3c3 total power requirement = 1h*3c2 217,800,000 108,900,000 43,560,000 10,890,000 kWh 3c4 total power cost = 1a*3c3 $10,890,000 $5,445,000 $2,178,000 $544,500 subtotal $10,900,000 $5,500,000 $2,200,000 $600,000 3d Labor 3d1 worker monthly salary $15,000 $15,000 $15,000 $15,000
3d2 working days per month 22 22 22 22 days
3d3 workers per shift 5 5 5 5 workers 3d4 shifts per day 2 2 2 2 shifts/day 3d5 hours per shift 8 8 8 8 hours 3d6 working hours per day = 3d5*3d4 16 16 16 16 hours 3d7 tons/day = (3c1/3c2)*3d6 8 16 40 160 tons/day
3d8 total days to vitrify all material = tons/(tons/day) = 1h/3d7 2723 1360 545 136 days
3d9 total months to vitrify all material = 3d8/3d2 124 62 25 6 months
3d10 total years to vitrify all material = 3d9/12 10.3 5.2 2.1 0.5 years
3d11 total salary costs per month = 3d1*3d3*3d4 $150,000 $150,000 $150,000 $150,000
3d12 total labor cost = 3d9*3d11 $18,562,500 $9,281,250 $3,712,500 $928,125 subtotal $18,600,000 $9,300,000 $3,800,000 $1,000,000 3e Maintenance 3e1 cost per hour of operation $100 $100 $100 $100 3e2 hours of operation = 3d6*3d8 43560 21780 8712 2178 hours 3e3 total maintenance cost = 3e1*3e2 $4,356,000 $2,178,000 $871,200 $217,800 subtotal $4,400,000 $2,200,000 $900,000 $300,000
amortized capitol cost = total capitol cost/1b/3d10 $10,320,000 $5,160,000 $2,070,000 $520,000
COST PER TON $2,081 $1,045 $435 $134

42

43
7. Conclusions This work included a case study of a potential ex-situ application of plasma arc technology and thermal modeling and laboratory experiments regarding in-situ applications. The ex-situ case study revealed that if the Army pyrolyzed the 16 million pounds of scrap tires it currently sells, the Army could produce $823,000 dollars worth of energy beyond that needed to power the torch itself. The thermal model developed for this project to study in-situ applications successfully predicted the presence of a 100°C plateau resulting from the boiling of pore water in soil. This prediction strongly suggests that in-situ remediation below the water table will be grossly energy inefficient. The model also correctly predicts the maximum width of the melt zone and as such could be used as a tool to estimate borehole spacing, melt time, and cost of in-situ treatment. Finally, the model reveals that powering the torch for extended periods of time is energy inefficient — most melting occurs immediately with little further increase in melt mass with time. Laboratory-scale experiments were performed to study the thermal and geochemical changes caused by vitrification. These experiments revealed the dramatic steepness of the thermal gradient in the vicinity of the torch. They also demonstrated that convection in the melt zone is vigorous and thus any contaminants widely dispersed in the soil will be homogenized in the glass by the vitrification process. Cesium volatility was shown to be minimal, but lead volatility could be problematic. In summary, plasma arc technology can be viewed as a process in which an input (some sort of waste) is processed (vitrified) and an output (glassy material) is produced. In the case of most input streams (tires, municipal solid waste, radioactive waste) the resulting output has several fundamental advantages. Perhaps most obvious is a significant reduction in the waste’s volume and surface area, thus decreasing the potential for contaminant migration. Secondly, the glassy material produced via vitrification can be used as an input for other processes, such as aggregate for roads or cement manufacturing. If the waste has a high fuel potential (tires, municipal solid waste) a syngas may also be collected during vitrification and either sold or used on site to power the torch itself. Finally, plasma arc technology has intangible benefits such as increased national and environmental security. Increased national security would result from reduced dependence on foreign oil, as our “trash” becomes a potential fuel source. Environmental security would increase as contaminated sites are permanently treated, leaving fewer hotspots to threaten our groundwater and other natural resources. Plasma arc technology as an ex-situ technique is gaining acceptance in various parts of the world. As an in-situ remediation method, however, it is not ready for full-scale field deployment. Basic scientific questions regarding the thermal and geochemical changes occurring during vitrification remain. The promise of vitrification, however, argues strongly that this basic research is worth pursuing.

44

45
8. Recommendations For Future Plasma Arc Research To develop the full potential of this technology, a complete understanding of all thermal and geochemical changes that occur during vitrification must be achieved. This understanding can be sought by future research involving both modeling and experimental work. The computer model developed to date is a good initial description of the heat transfer process but the next generation model should allow for a physical transformation from solid to liquid accompanied by collapsing material and void space development. Such a model in concert with further laboratory-scale experimental work is needed to quantify the relationship between torch power and the radius of vitrification. A similar approach will further our understanding of how much energy is required to melt a ton of contaminated soil under various conditions. Quantifying these results will reduce the uncertainty in economic estimates. Future experimental work should continue to study element volatility and specifically methods to reduce the volatility of contaminants. Vitrification will not be an appealing solution if it simply changes the problem from a solid waste issue to an air pollution issue. Given the initial results reported here, the ability to locate any doped material fully in the predicted melt zone will be vastly improved. Studies on the volatility of cesium should be continued and studies of other elements, most importantly lead, should be initiated using a similar approach. Research to improve our understanding of how the lag time between heating and melting affects volatility is also needed. Improvements in soil digestion techniques would facilitate interpreting analytical results. Finally, Spalding’s (2001) suggestion that heating alone rather than complete vitrification accomplishes many environmental objectives deserves further experimental verification. Is this observation equally valid for plasma arc torch vitrification as for Joule heating? Once the laboratory-scale experiments are fully understood and quantified, field-scale testing using a megawatt torch needs to be undertaken. Currently, it is difficult to scale laboratory results with a kilowatt torch to a field setting with a megawatt torch. The likelihood of success with field-scale research experiments, however, will increase substantially as a thorough understanding of laboratory-scale research results is achieved.

46

47
REFERENCES Amirkhanian, Serji. 2000. Waste tires cut costs of building new highways. BioCycle,
41:12, 46-47. Baker, Duffy A. 2001. Pollution-prevention branch helps Navy deal with waste. National
Defense, April 2001. Beles, A. A. and I.I. Stanculescu. 1958. Thermal treatment as a means of improving the
stability of earth masses. Geotechnique, 8, 158-165. Blumenthal, Michael H. 1997a. Scrap tire market analysis. BioCycle, 37:3, 35-37. Blumenthal, Michael H. 1997b. Scrap tire derived fuel: markets and issues. In Municipal
solid wastes: Problems and solutions, edited by Robert E. Landreth and Paul A. Rebers. New York: Lewis Publishers..
Blumenthal, Michael H. and Edward C. Weatherhead. 1997. The use of scrap tires in
rotary cement kilns. In Municipal solid wastes: Problems and solutions, edited by Robert E. Landreth and Paul A. Rebers. New York: Lewis Publishers.
Boynton, W. V. 1989. Cosmochemistry of the rare earth elements: Condensation and
evaporation processes. In Reviews in Mineralogy, v.21, Geochemistry and Mineralogy of Rare Earth Elements, edited by B. R. Lipin and G. A. McKay. Washington, D.C.: Mineralogical Society of America.
Buelt, J. L., C. L. Timmerman, K. H. Oma, V. F. Fitzpatrick, and J. G. Carter. 1987. In-
situ vitrification of transuranic wastes: systems evaluation and applications assessment. PNL-4800. Richland, WA: Pacific Northwest Laboratory.,
Camacho, Salvador L. 1990. Plasma pyrolysis of hydrocarbon wastes. Proceedings
Plasma for Industry and Environment, September, 25-27. Camacho, S. L. 1988. Industrial worthy plasma arc torches: state of the art. Pure and
Applied Chemistry, 60, 619-632. Carter, George W. and Andreas V. Tsangaris. 1995a. Plasma gasification of municipal
solid waste. In Proceedings of the International Symposium on Environmental Technologies: Plasma systems and applications. Atlanta, GA: Georgia Institute of Technology.
Carter, George W. and Andreas V. Tsangaris. 1995b. Plasma gasification of biomedical
waste. In Proceedings of the International Symposium on Environmental Technologies: Plasma systems and applications. Atlanta, GA: Georgia Institute of Technology.

48
Celes, Josepha D. and Paul W. Mayne. 2000. Remediation and transformation of kaolin by plasma magmavication. Transportation Research Record, No.1714 Recycled and Secondary Materials, Soil Remediation, and In situ Testing, 65-74.
Circeo, Louis J., Paul W. Mayne, Eric A. Mintz, , Conrad W. Ingram, Robert C. Martin,
Robert A. Newson, Amr Elhakim, ,Kathryn Wehrle, and Lamar C. Carney. 2001. Final Report: In-situ plasma remediation of contaminated soil. ERDA Contract Number DE-FC09-97SR189911, Georgia Tech Contract Number A-5586. Atlanta, GA: Georgia Institute of Technology..
Circeo, Louis J., Paul W. Mayne, Robert A. Newson, and Kate A. Mayer. 1996. Final
Report: Demonstration of in situ plasma vitrification technology for Savannah River Site contaminated soils. ERDA Contract Number 95069, Georgia Tech Contract Number D48-X30. Atlanta, GA: Georgia Institute of Technology.
Cohn, Daniel R. 1993. Environmental cleanup applications of hot and cold plasmas.
Journal of Fusion Energy, 12, 375-378. Environmental Protection Agency Handbook. 1992. Vitrification technologies for
treatment of hazardous and radioactive waste. EPA/625/R-92/002. Washington, D.C.: Office of Research and Development.
Dragun, James. 1991. Geochemistry and soil chemistry reactions occurring during in
situ vitrification. Journal of Hazardous Materials, 26, 343-364. Dunbar, N. W., L. R. Riciputi, G. K. Jacobs, M. T. Naney, and W. Christie. 1993.
Generation of rhyolitic melt in an artificial magma: implications for fractional crystallization in natural magmas. Journal of Volcanology and Geothermal Research, 57, 157-166.
Fox, Catherine A., Louis J. Circeo and Robert C. Martin. 2001. In-situ plasma
remediation of contaminated soils. Remediation, Autumn, 3-13. Jankiewicz, E. J. 1972. Fusing soils. The Military Engineer, November-December, 422-
423. Jacobs, G. K., N. W. Dunbar, M. T. Naney, and R. T. Williams. 1992. Petrologic and
geophysical studies of an artificial magma. Eos, 73, no. 38, 401 and 411-412. Jacobs, Gary K., Brian P. Spalding, J. Gary Carter and Sydney S. Koegler. 1988. In situ
vitrification demonstration for the stabilization of buried wastes at the Oak Ridge National Laboratory. Nuclear and Chemical Waste Management, 8, 249-259.
Makansi, Jason. 1992. Tires-to-energy plant takes highroad in managing discharges.
Power, 136, 152-156.

49
Mayne, Paul W., Susan E. Burns, and Louis J. Circeo. 2000. Plasma magmavication of soils by nontransferred arc. Journal of Geotechnical and Geoenvironmental Engineering, 126, 387-396.
McKay, G. A. 1989. Partitioning of rare earth elements between major silicate minerals
and basaltic melts. In Reviews in mineralogy, v. 21, Geochemistry and mineralogy of rare earth elements, edited by B. R. Lipin and G. A. McKay. Washington, D.C.: Mineralogical Society of America.
Mitchell, J. K. 1993. Fundamentals of soil behaviour. New York: John Wiley. Nolting, Eugene E., Jon W. Cofield, Theodora Alexakis, Peter Tsantrizos, and Platon
Manoliadis. 2001a. Plasma arc thermal destruction technology for shipboard solid waste. In 2001 International Conference on Incineration and Thermal Treatment Technologies, Proceedings, Philadelphia, PA.
Nolting, Eugene E., Jon W. Cofield, Peter Tsantrizos, Platon Manoliadis, and Theodora
Alexakis. 2001b. A compact solid waste destruction device using a plasma arc discharge. In The American Society of Naval Engineers and Society for Naval Architects and Marine Engineers Marine Environmental Technology 2001, Technical Proceedings, Alexandria, VA.
Sartwell, Bruce D., Eugene E. Nolting, Steven H. Peterson, David A. Counts, Roy
Richard, Eugene Keating, John L. Giuliani, James W. Fleming, and John H. Callahan. 1999. Studies on the application of plasma arc technology to destruction of shipboard waste. Naval Research Laboratory report NRL/MR/6170—99-8353.
Serumgard, John R. 1997. Ground rubber and civil engineering markets for scrap tires.
In Municipal Solid Wastes: problems and solutions, edited by Robert E. Landreth and Paul a. Rebers. New York: Lewis Publishers.
Spalding, B. P. 2001. Fixation of radionuclides in soil and minerals by heating.
Environmental Science and Technology, 35, 4327-4333. Spalding, B. P., J. S. Tixier, M. T. Naney, S. R. Cline, and M. A. Bogle. 1997. In situ
demonstration at Pit 1, Oak Ridge National Laboratory. Volume 1. Results of treatability study. Oak Ridge National Laboratory, Environmental Sciences Division report ORNL/ER-425/V1.
Spalding, B. P., G. K. Jacobs, N. W. Dunbar, M. T. Naney, J. S. Tixier, and T. D. Powell.
1992. Tracer-level radioactive pilot-scale test of in-situ vitrification for the stabilization of contaminated soil sites at ORNL. Oak Ridge National Laboratory, Environmental Sciences Division report ORNL/TM-12201.

50
Spalding, B. P. and G. K. Jacobs. 1989. Evaluation of an in situ vitrification field demonstration of a simulated radioactive liquid waste disposal trench. Oak Ridge National Laboratory, Environmental Sciences Division report ORNL/TM-10992.
Spalding, B. P., G. K. Jacobs, and E. C. Davis. 1989. Demonstrations of technology for
remediation and closure of Oak Ridge National Laboratory waste disposal sites. Oak Ridge National Laboratory, Environmental Sciences Division report ORNL/TM-11286.
Teng, Hsisheng, Michael A. Serio, Marek A. Wojtowicz, Rosemary Bassilakis, and Peter
R. Solomon. 1995. Reprocessing of used tires into activated carbon and other products. Industrial and Engineering Chemistry Research, 34, 3102-3111.
Touloukian, Y. S., R. W. Powell, C. Y. Ho and M. C. Nicolaou, eds. 1973.
Thermophysical Properties of Matter, Vol. 10, Thermal Diffusivity. New York: Plenum.
Zaghloul, H. H. and Louis J. Circeo. 1993. Destruction and vitrification of asbestos using
plasma arc technology. Champaign, IL: U. S. Army Construction Engineering Research Laboratories.

A-1
Appendix A Plasma Arc Torch Supply Companies
contact info system permit remarks Burns and Roe (founded 1932)
800 Kinderkamack Rd., Oradell, NJ 07649 Tel: (201) 265-2000 Email: [email protected] url: www.roe.com
Metal electrodes
Various permits – 3 in Switzerland, 1 in France, 1 in Germany
On 15 January 2000 signed a licensing agreement with MGC-Plasma AG (MGC) of Switzerland to commercialize Plasmox® technology
Integrated Environmental Technologies, LLC (IET) (founded July 1995)
1935 Butler Loop Richland, WA 99352 Tel: 509-946-5700 Email: [email protected] url: www.inentec.com
Graphite electrodes; Plasma Enhanced Melter – 2 test machines (500 lb/day and 15 tons/day)
July 2000 permit in WA to treat hazardous and radioactive waste; May 2000 permit in HI to treat medical waste; holds patent for MSW cogeneration
Founded by Dan Cohn of MIT; collaborated with Battelle Pacific Northwest Labs; uses both plasma (gases conduct electricity) and Joule (running electric current through wastes) heating
MeltTran Incorporated (founded February 1995) 1293 East 65th North Idaho Falls, ID 83401 Tel: 208/524-6358 Fax: 208/523-1049 E-mail: [email protected] url: www.melttran.com
DC graphite electrodes; 200 kW; Plasma Arc Melter Ultimate Solution
R&D permit in ID Process low-level radioactive and medical waste
MSE Technologies Applications, Inc. (founded 1978, involved with plasma since 1989)
200 Technology Way PO Box 4078 Butte, MT 59701 Tel: 406-494-7100 Email: [email protected] url: www.mse-ta.com
Metal electrodes; 0.5 (Hawthorne Army Depot in NV for energetics) and 1 MW (Crane Army Ammunition Plant in ID for metal recycling) units
Permit in MT; Army to complete permitting process in late 2001
Units are Army owned; developed Plasma Ordnance Demilitarization System and Mobile Plasma Treatment System

A-2
Plasma Energy Applied Technology, Inc. (PEAT) (founded 1991)
4914 Moores Mill Road Huntsville, AL 35811 Tel: 256-859-3006 Email: [email protected] url: www.peat.com
Metal electrodes; 150 kW; Thermal Destruction and Recovery System
2001 treatability permit in AL; 50 hours of processing agricultural blast material seeded with metals and hazardous organics; also investigating medical waste and waste-to-energy operations
Patented thermal destruction and recovery process; built 500 kW demo system for USAEC; installed in a Vanguard licensed research facility in Lorton, VA in 1998; permitted for vitrification of hospital waste for Kaiser Permanente Hospital complex in San Diego but project was cancelled
PyroGenesis Inc. (founded 1992) 1744 William Street, Suite 200 Montreal, Quebec Canada H3J 1R4 Tel: 514-937-0002 email: [email protected] url: www.pyrogenesis.com/
Has pilot scale model to vitrify incinerator ash; power up to 1.5 MW
Has worked with Navy to build shipboard plasma systems

A-3
Resorption Canada Ltd. (founded 1973) 2610 Del Zotto Ave. Gloucester Ontario Canada K1T 3V7 Tel: 613-831-0590 Email: [email protected] url: www.rcl-plasma.com/
150 kW test facility; uses reduction atmosphere over molten bath process
Retech Systems LLC. (founded 1963) Div of Lockheed Martin Environmental Systems and Technology 100 Henry Station Road Ukiah, CA 95482 Tel: 707- 462-6522 url: www.retechsystemsllc.com
Plasma Arc Centrifugal Treatment Systems; can operate in transferred or non-transferred mode
March 2000 permit to process low and medium level radioactive waste in Wurenlingen, Switzerland and pharmaceutical waste in Muttenz, Switzerland
Built system at Norfolk Navy base to dispose of hazardous waste which is awaiting local permit approval and EIS
Science Applications International Corp. (SAIC) (founded 1969)
545 Shoup Ave. Idaho Falls, ID 83402 Tel: 208-528-2144 url: www.saic.com
Plasma Hearth Process; metal electrodes; 200 kW and 1.2 MW; process mixed waste (radioactive and hazardous)
Treatability permit in ID; tested demo unit in 1992
Fortune 500 company; largest employee-owned research and engineering firm in US; partnered with DOE ; demo unit built by Retech Inc. in Ukiah, CA; also collaborates with INEL and Argonne National Lab

A-4
Startech Environmental Corp. (founded 1994) 15 Old Danbury Rd Suite 203 Wilton, CT 06897 Tel: (203) 762-2499 Email: [email protected] url: www.startech.net
Plasma converter; metal electrodes; 300 kW
R&D permit in CT Released press report saying US Army contracted them to dispose of non-stockpile weapons; USA released report saying this was completely unfounded; started as a licensee of RCL but no longer associated with RCL
Scientific Utilization, Inc. (SUI) (founded 1992)
201 Electronics Blvd. SW P.O. Box 6787 Huntsville, AL 35824-0787 Tel: 256-772-8555 Email: [email protected] url: www.suip3.com
Hazardous Waste Destruction System; AC Plasmatron torch; metal electrodes; 480 VAC; 15 ton/day system deployed in Taiwan in November 2001
Waste stream includes almost all solid organics, industrial and chemical liquids, PCBs or sludge, as well as CFCs and toxic industrial gases; R&D permit in AL
Partnered with DOE and Lawrence Livermore Labs
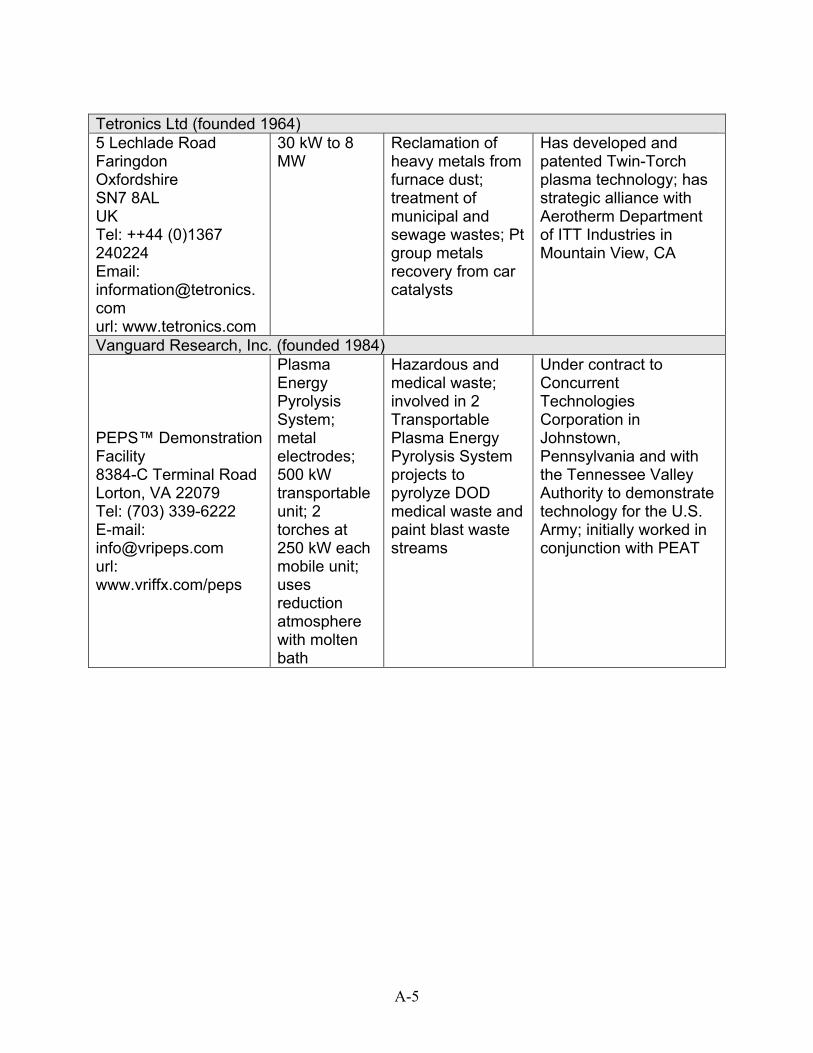
A-5
Tetronics Ltd (founded 1964) 5 Lechlade Road Faringdon Oxfordshire SN7 8AL UK Tel: ++44 (0)1367 240224 Email: [email protected] url: www.tetronics.com
30 kW to 8 MW
Reclamation of heavy metals from furnace dust; treatment of municipal and sewage wastes; Pt group metals recovery from car catalysts
Has developed and patented Twin-Torch plasma technology; has strategic alliance with Aerotherm Department of ITT Industries in Mountain View, CA
Vanguard Research, Inc. (founded 1984)
PEPS™ Demonstration Facility 8384-C Terminal Road Lorton, VA 22079 Tel: (703) 339-6222 E-mail: [email protected] url: www.vriffx.com/peps
Plasma Energy Pyrolysis System; metal electrodes; 500 kW transportable unit; 2 torches at 250 kW each mobile unit; uses reduction atmosphere with molten bath
Hazardous and medical waste; involved in 2 Transportable Plasma Energy Pyrolysis System projects to pyrolyze DOD medical waste and paint blast waste streams
Under contract to Concurrent Technologies Corporation in Johnstown, Pennsylvania and with the Tennessee Valley Authority to demonstrate technology for the U.S. Army; initially worked in conjunction with PEAT

A-6
Westinghouse Plasma Corp. (began work with plasma technology in 1950)
Dr. Shyam V. Dighe, P.E., President & Chief Technology Officer P.O. Box 410 Madison, PA 15663 Tel: 724-722-7050 url: www.westinghouse-plasma.com
MARC 3 is 50-300 kW; MARC-11 is 600-2500 kW
MSW and NY harbor dredging
Commercial projects include iron melting at General Motors in Defiance, Ohio (1989) and Geneva Steel in Provo, UT (1997); resource (aluminum) recovery in Jonquiere, Canada (1995); gasification of MSW (waste to energy) in Yoshii, Japan (July, 1999); MSW ash vitrification at IHI plant in Kinuura, Japan (1995); torch is considered to be the best on the marketplace today

B-1
Appendix B Fortran Heat Transfer Computer Model program heattrans * * Marie Johnson * Army Environmental Policy Institute * 404-524-9364 * * Summary * This program models heat diffusion in 2-D assuming the only mode of heat transfer * is conduction. The soil is assumed to be isotropic and homogenous. The test vessel is cylindrical and heat transfer * occurs radially; i.e., in 1-D from borehole to the edge of the container. The program will calculate the temperature at * any point within the 3-D grid of x, z, and time. Energy is input into the system by the plasma torch and converted to * heat in the soil matrix. This heat energy is transferred to other points in the grid by conduction. * * Variables * symbol type units definition * * T(x,z,time) real C temperature at point x,z at each time step * * x integer cm position in x direction * * z integer cm position in z direction * * time integer s position in time * * dtime integer s time step in seconds * * timemax integer s elapsed time (total running time) at each step * * xmax integer cm maximum value for x *

B-2
* zmax integer cm maximum value for z * * zmin integer cm minimum value for z * * w, h, d real cm width, height, and depth of finite element * * m, n integer none counter for cells in x, z direction respectively * * theight integer cm height of torch above borehole bottom * * raises integer none how many times torch is raised * * interval integer cm distance torch is moved in z units * * rbore real cm radius of bore hole * * rinner real cm radius of inner element * * router real cm radius of outer element * * volume real cm3 volume of finite element; f(x) * * a(T) real cm2/s thermal diffusivity of crystalline SiO2 (sand); * alpha is a function of temp and defined by either: * a = 10^-7*T^2 - 0.0001*T + 0.0381 (selected data) or * a = 4*10^-8*T^2 - 4*10^-5*T + 0.0231 (all data) * * k real kJ/scmC thermal conductivity * * q real kJ/s heat rate by conduction (function of nearest neighbors)* * density real g/cm3 soil density *

B-3
* perwater real none * * masswater real g mass of water in each cell; f(x,z,time) * * moleswater real moles moles of water in each cell; f(x,z,time) * * massoil real g mass of soil in each cell; f(x) but defined as f(x,z) * * Cpsoil real kJ/g-C specific heat of soil * * Cpwater real kJ/g-C specific heat of water * * Cp real kJ/g-C specific heat of total system (water + soil) * * dhwater real kJ/mole heat of vaporization for water * * power integer kJ/s power output by torch (kJ/sec = kW) * * pi real none defined constant * * i integer none dummy counter * * Important equations * * q = (mass*Cp*deltaT)/deltatime; deltaT = (q*deltatime)/(mass*Cp) (no phase change) * q = (moles * deltaH)/deltatime (phase change) * q = (thermal conductivity * area * deltaT)/width * area = 2pi * r * height * volume = pi * r^2 * height * Cptotal = (massa*Cpa + massb*Cpb)/(massa + massb) * thermal conductivity = k = thermal diffusivity(a) * density * Cp * real T(0:21, -6:15, 0:18000),

B-4
1 q(0:21, -6:15, 0:18000), 1 q1(0:21, -6:15, 0:18000), q2(0:21, -6:15, 0:18000), 1 q3(0:21, -6:15, 0:18000), q4(0:21, -6:15, 0:18000), 1 masswater(0:21, -6:15, 0:18000), massoil(0:21, -6:15), 1 F(0:21, -6:15), a(1:4), k(1:4), Temp(1:4) * real w, h, d, rbore, rinner, router, pi, 1 volume, density, Cpsoil, Cpwater, Cp, power, 1 perwater, moleswater, dhwater * integer m, n, x, z, xmax, zmax, zmin, time, dtime, 1 theight, raises, i, j * integer timemax(0:6), interval (0:6) * * Set control volume conditions parameter (xmax = 20) parameter (zmax = 14) parameter (zmin = -5) parameter (dtime = 1.0) parameter (raises = 0) parameter (w = 2.54) parameter (h = 2.54) parameter (d = 2.54) parameter (rbore = 7.62) parameter (density = 2.3) parameter (Cpsoil = 0.00117) parameter (Cpwater = 0.00418) parameter (dhwater = 40.7) parameter (pi = 3.14159) * * Open data output files open (unit = 1, file = 'TC1.dat')

B-5
open (unit = 2, file = 'TC2.dat') open (unit = 3, file = 'TC3.dat') open (unit = 4, file = 'TC4.dat') open (unit = 5, file = 'TC5.dat') open (unit = 30, file = 'melt30.dat') open (unit = 60, file = 'melt60.dat') open (unit = 90, file = 'melt90.dat') open (unit = 120, file = 'melt120.dat') open (unit = 200, file = 'energy.dat') * * Open data input file open (unit = 6, file = 'torch.dat') read (6,*) power, perwater do i = 0,raises+1 read (6,*) timemax(i), interval(i) timemax(i) = timemax(i)*60 end do close (unit = 6) * Calculate initial grams of soil and water per cell m = 0 do x = 0,xmax n = zmin do z = zmin, zmax if (m .eq. 0 .and. n .lt. 0) then volume = pi*h*(rbore**2) elseif (m .eq. 0 .and. n .ge. 0) then volume = 0.0 else rinner = rbore + (m-1) * w router = rbore + m * w volume = pi * (router**2 - rinner**2) * h end if

B-6
massoil(x,z) = density * volume masswater(x,z,0) = (perwater/100.0) * massoil(x,z) n = n + 1 end do m = m + 1 end do * * Set initial ambient temperature to 25 degrees C everywhere do x= 0, xmax+1 do z = zmin-1, zmax+1 T(x,z,0) = 25.0 end do end do * * Initialize height of torch theight = 5 * * Temperature / Time calculations * do i = 1,raises+1 * Calculate fractional flux for each cell at m = 0 (remember that z = n) F(0,-1) = 0.5*(sin(atan(h*(2*(-1-theight)+1)/(2*rbore))) + 1) do z = 0, zmax F(1,z) = 0.5*(sin(atan(h*(2*(z-theight)+1)/(2*rbore))) - 1 sin(atan(h*(2*(z-theight)-1)/(2*rbore)))) end do * do time = timemax(i-1),timemax(i) * set temperature along top and bottom edges of control volume do x = 0, xmax+1 T(x, zmax+1, time) = 25.0 T(x, zmin-1, time) = 25.0 end do

B-7
q1tot = 0.0 q2tot = 0.0 q3tot = 0.0 q4tot = 0.0 * do z = zmax, zmin, -1 * set temperature along left edge of control volume T(xmax+1, z, time) = 25.0 * m = 0 do x = 0, xmax * Determine thermal conductivity coefficient if (masswater(x,z,time) .gt. 0.0) then Cp = ((masswater(x,z,time) * Cpwater) 1 + (massoil(x,z) * Cpsoil))/ 1 (masswater(x,z,time) + massoil(x,z)) else Cp = Cpsoil end if do j = 1,4 if (j .eq. 1) Temp(j) = (T(x,z,time)+T(x-1,z,time))/2 if (j .eq. 2) Temp(j) = (T(x,z,time)+T(x+1,z,time))/2 if (j .eq. 3) Temp(j) = (T(x,z,time)+T(x,z-1,time))/2 if (j .eq. 4) Temp(j) = (T(x,z,time)+T(x,z+1,time))/2 a(j) = (4.0*10.0**-8.0)*Temp(j)*Temp(j) - 1 (4.0*10.0**-5.0)*Temp(j) + 0.0231 k(j) = a(j) * density * Cp end do * if (x .eq. 0 .and. z .ge. 0) goto 300 if (x .eq. 0 .and. z .eq. -1) then q1(x, z, time) = 0.0
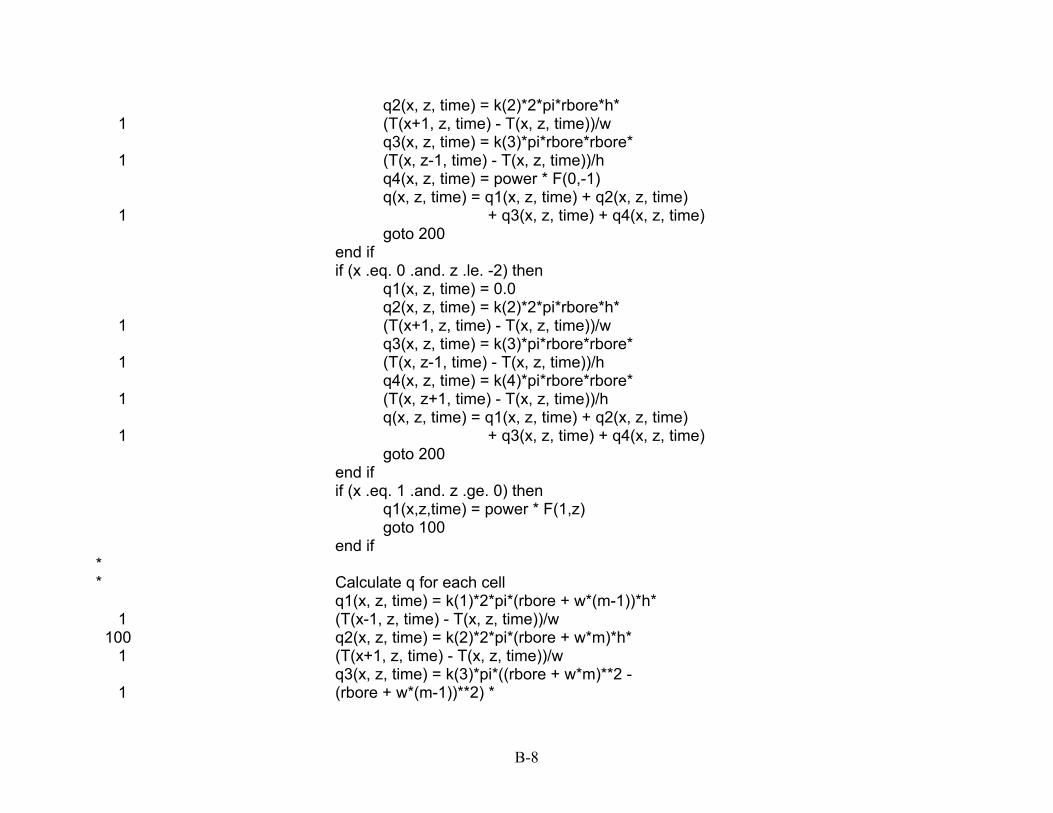
B-8
q2(x, z, time) = k(2)*2*pi*rbore*h* 1 (T(x+1, z, time) - T(x, z, time))/w q3(x, z, time) = k(3)*pi*rbore*rbore* 1 (T(x, z-1, time) - T(x, z, time))/h q4(x, z, time) = power * F(0,-1) q(x, z, time) = q1(x, z, time) + q2(x, z, time) 1 + q3(x, z, time) + q4(x, z, time) goto 200 end if if (x .eq. 0 .and. z .le. -2) then q1(x, z, time) = 0.0 q2(x, z, time) = k(2)*2*pi*rbore*h* 1 (T(x+1, z, time) - T(x, z, time))/w q3(x, z, time) = k(3)*pi*rbore*rbore* 1 (T(x, z-1, time) - T(x, z, time))/h q4(x, z, time) = k(4)*pi*rbore*rbore* 1 (T(x, z+1, time) - T(x, z, time))/h q(x, z, time) = q1(x, z, time) + q2(x, z, time) 1 + q3(x, z, time) + q4(x, z, time) goto 200 end if if (x .eq. 1 .and. z .ge. 0) then q1(x,z,time) = power * F(1,z) goto 100 end if * * Calculate q for each cell q1(x, z, time) = k(1)*2*pi*(rbore + w*(m-1))*h* 1 (T(x-1, z, time) - T(x, z, time))/w 100 q2(x, z, time) = k(2)*2*pi*(rbore + w*m)*h* 1 (T(x+1, z, time) - T(x, z, time))/w q3(x, z, time) = k(3)*pi*((rbore + w*m)**2 - 1 (rbore + w*(m-1))**2) *
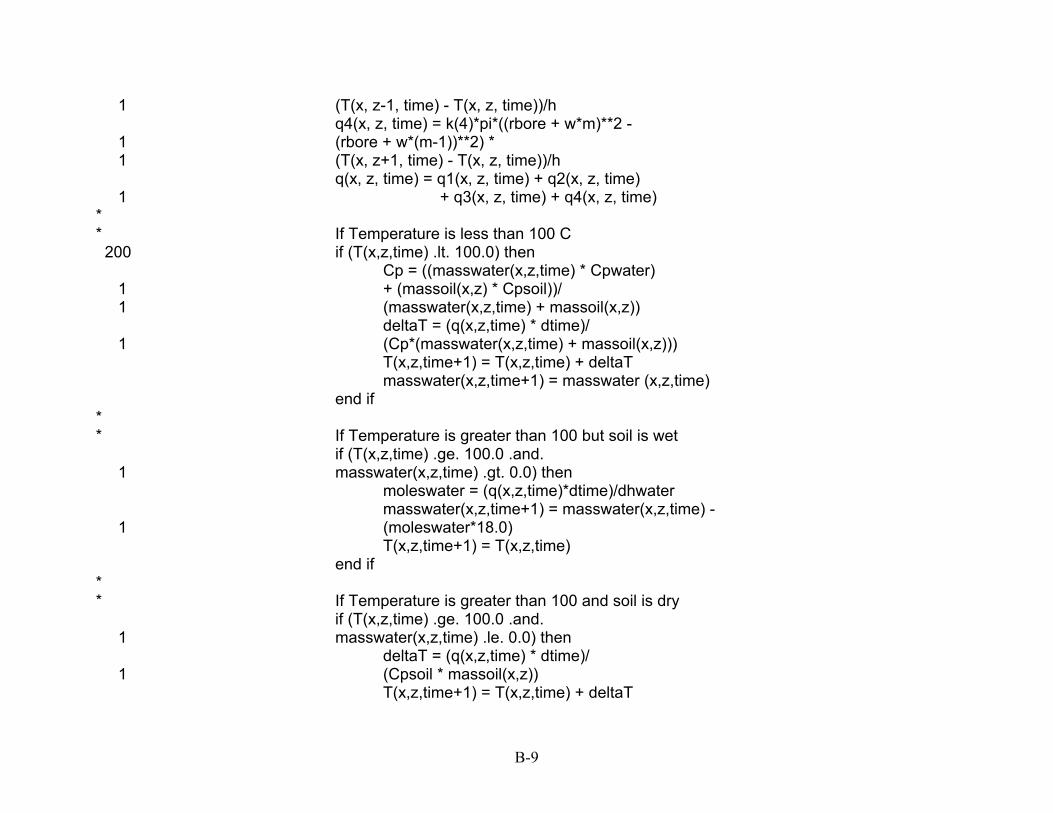
B-9
1 (T(x, z-1, time) - T(x, z, time))/h q4(x, z, time) = k(4)*pi*((rbore + w*m)**2 - 1 (rbore + w*(m-1))**2) * 1 (T(x, z+1, time) - T(x, z, time))/h q(x, z, time) = q1(x, z, time) + q2(x, z, time) 1 + q3(x, z, time) + q4(x, z, time) * * If Temperature is less than 100 C 200 if (T(x,z,time) .lt. 100.0) then Cp = ((masswater(x,z,time) * Cpwater) 1 + (massoil(x,z) * Cpsoil))/ 1 (masswater(x,z,time) + massoil(x,z)) deltaT = (q(x,z,time) * dtime)/ 1 (Cp*(masswater(x,z,time) + massoil(x,z))) T(x,z,time+1) = T(x,z,time) + deltaT masswater(x,z,time+1) = masswater (x,z,time) end if * * If Temperature is greater than 100 but soil is wet if (T(x,z,time) .ge. 100.0 .and. 1 masswater(x,z,time) .gt. 0.0) then moleswater = (q(x,z,time)*dtime)/dhwater masswater(x,z,time+1) = masswater(x,z,time) - 1 (moleswater*18.0) T(x,z,time+1) = T(x,z,time) end if * * If Temperature is greater than 100 and soil is dry if (T(x,z,time) .ge. 100.0 .and. 1 masswater(x,z,time) .le. 0.0) then deltaT = (q(x,z,time) * dtime)/ 1 (Cpsoil * massoil(x,z)) T(x,z,time+1) = T(x,z,time) + deltaT

B-10
end if q1tot = q1tot + q1(x,z,time) q2tot = q2tot + q2(x,z,time) q3tot = q3tot + q3(x,z,time) q4tot = q4tot + q4(x,z,time) 300 m = m + 1 end do end do write (200,*) time, q1tot, q2tot, q3tot, q4tot end do theight = theight + interval(i) end do * * Write thermocouple data do time = 0, timemax(raises+1), 60 write (1,15) time/60, T( 3, 5, time) write (2,15) time/60, T( 6, 5, time) write (3,15) time/60, T( 9, 5, time) write (4,15) time/60, T(12, 5, time) write (5,15) time/60, T(15, 5, time) 15 format (1x, I3, 1x, F10.2) end do * * Write isothermal data do time = 1800, 7200, 1800 do x = xmax, 0, -1 write (time/60, 55) (T(x,z,time), z = zmax,zmin,-1) 55 format (20(1x, F9 .2)) end do end do * * End of program end