NYU Abu Dhabi Conference on Education Media and Human Development. Quantitative Analysis of...
39
NYU Abu Dhabi Conference on Education Media and Human Development. Quantitative Analysis of Education Policy in the UK Peter Dolton Royal Holloway College, University of London and Centre for Economics of Education, London School of Economics [email protected]
-
date post
21-Dec-2015 -
Category
Documents
-
view
214 -
download
1
Transcript of NYU Abu Dhabi Conference on Education Media and Human Development. Quantitative Analysis of...

NYU Abu DhabiConference on Education Media and Human Development.
Quantitative Analysis of Education Policy in the UK
Peter DoltonRoyal Holloway College, University of London and
Centre for Economics of Education, London School of Economics

‘I’m giving education just one more try… if I fail again, I’m entering politics!’

Outline
• Examples of Analysis (and failures of analysis) of Policy in the UK (and data).
• My take on the ‘causal’ v ‘observational’ debate - IDENTIFICATION
• Brief follow up on the Andreas Scheicher presentation on a paper I am writing.

Examples of Key Education Policy Reform Questions
• What are effects of National Curriculum from 1988?
• What has been the effect of the Literacy and Numeracy Hour?
• What is the effect of National KS tests at age 7,11, 13, 16, 18:– Have educational standards been rising– Has publication of school results encouraged
competition?• What has been the effect of the Introduction of a
School Teacher Performance threshold on pay in 2000?


Some outputs are easier to observe than others!

Recent Policy Questions
• Effect of Class size on outcomes
• Why boys are doing so much worse than girls.


The proportion of boys and girls achieving 5 good GCSEs
0
10
20
30
40
50
60
1975 1977 1979 1981 1983 1985 1987 1989 1991 1993 1995 1997 1999 2001 2003
%
Boys
Girls
Source: DfES (2003)

Data to Answer these Questions
Administrative Data on:
• National Pupil Database on every child with all their scores on all KS tests.
• Database of Teacher Records.
• School level data on performance in KS tests.
• Assorted other Admin data on House Prices, (Land Registry), Deprivation etc

Other Data Sources
• Loads of good surveys – cohort data etc
• BUT

• NO LINK BETWEEN ADMIN DATA
• Hence impossible to find out which teacher taught which class.

Some Real Effects of these Policies Which we don’t need data
to tell us.
• Teaching to the test to push up school scores.
• Educational ‘improvement’ by government edict.
• Squashing of teacher initiative to teach – 9/11 example.

IDENTIFICATION
• OLS – observational• RCT – ‘causal’Many other techniques• Panel, Longitudinal, Cohort, Spatial• Statistical Matching• Difference-in-Differences• Regressional Discontinuity Design• Instrumental Variables - LATE

• Often involve the creative use of:
• Some administrative change or rule like Miamonides Rule (Angrist and Lavy)
• Changes in Policy
• Above techniques may give us as close an estimate of causal effects as you are going to get with RCTs.

If You Pay Peanuts do You Get Monkeys? A Cross Country Comparison of Teacher Pay
and Pupil Performance.
Peter Dolton[1]Oscar D. Marcenaro-Gutierrez[2]
[1] Royal Holloway University of London & Centre for Economic Performance, LSE. [2] University of Malaga.

UK ADVERT
– Make a Difference – Become a Teacher!!!!

‘To save democracy, is it? I have been hurling stones thinking it’s about teachers’ pay!’

What Makes a Good Teacher??
Not sure we really know the answer
BUT


1. Central Motivation
• Why do teachers in Holland Earn 4 times teachers in Israel (after allowing for PPP adjustments)?
• Kids in some countries do 2-6 times as well as kids in other countries.
• Is there a link between these 2 facts –• If we take relative salary as a measure of
teacher quality, is it the case that kids perform better?

Motivation cont’d
• Think of two possible basic causal mechanisms:
• You pay teachers better gives them an incentive to work harder and be more effective in teaching kids.
• You pay teachers better and this raises the status of the job and induces more able young people to want to be teachers in the future.

3. Data
We have new data to do this with
• OECD data on teachers salaries
• PISA, TIMSS data on pupil performance.
• PISA 2000, 2003, 2006 for Maths, Science and Reading
• TIMSS 1995, 1999, 2003 Maths and Science

Data contHow do we measure teacher
salary?
• In terms of real PPP $
• Relative to country’s standard of living - In terms of $PPP divided by GDP per head.
• Relative point in the income distribution of the country. (Assuming Income is lognormal, and we have Gini coeff and Ave earnings)

Figure 1.a. Actual and fitted Upper Secondary school teachers’
salaries after 15 years experience in 2007 $ PPP (2005) 1
000
02
000
03
000
04
000
05
000
0T
each
ers
sala
ries
aft
er 1
5 y
ears
in 2
005
Actual Teachers salaries after 15 years Fitted values
Upper Secondary education

Figure 1.c. Actual and fitted Upper Secondary school teachers’ salaries after 15 years experience relative to the earnings
distribution of the whole population (2003) .4
.5.6
.7.8
Tea
cher
s sa
lari
es r
elat
ive
po
siti
on
(p
erce
nti
le)
Actual Teachers salaries (percentile) Fitted values
Upper Secondary education

Teacher Salaries
We also have data on• Starting • After 15 years• At top of scale.AND• Primary • Lower Secondary• Upper Secondary

Figure 2. Relative position (percentile) of teachers’ salaries in the
earnings distribution of the pop’n (Upper Secondary Education) 0.
25.5.
751
0.25
.5.75
10.
25.5.
751
0.25
.5.75
10.
25.5.
751
0.25
.5.75
1
1995
1996
1997
1998
1999
2000
2001
2002
2003
2004
2005
1995
1996
1997
1998
1999
2000
2001
2002
2003
2004
2005
1995
1996
1997
1998
1999
2000
2001
2002
2003
2004
2005
1995
1996
1997
1998
1999
2000
2001
2002
2003
2004
2005
1995
1996
1997
1998
1999
2000
2001
2002
2003
2004
2005
1995
1996
1997
1998
1999
2000
2001
2002
2003
2004
2005
Argentina Australia Austria Belgium Brazil Chile
Czech Republic Denmark Finland France Germany Greece
Hungary Indonesia Ireland Italy Japan Korea
Malaysia Netherlands New Zealand Norway Peru Philippines
Portugal Spain Sweden Switzerland Thailand Tunisia
Turkey UK USA Uruguay
Percentile position of teachers (starting wages) in the earnings distribution
Percentile position of teachers (after 15 years) in the earnings distribution
Percentile position of teachers (top wages) in the earnings distribution
Year
Graphs by Country

Data Conclusions
• Most countries pay their teachers between 50-75%ile.
• Some countries have flat career salaries:Denmark, Finland, Sweden, Peru• Other significant advancement:Austria, Belgium, France etc• Some countries teacher wages are falling back:Indonesia, Chile, Thailand, Australia• Others teachers are being paid better:Brazil, Czech, Uruguay

Figure 3.a. Standardised Average Scores (8th grade students) by country (2006)
-2
-1
0
1
2

Figure 4. Score’s percentile at 8th grade students as a function of teachers’ salaries after 15 years experience.
Turkey
IsraelGreece
ItalyPortugal
SpainUSA
NorwayHungary
FranceIceland
DenmarkUK
Czech RepublicAustria
SwedenGermany
IrelandBelgium
Switzerland
JapanAustralia
NetherlandsNew Zealand
KoreaFinland
02
04
06
08
01
00
Sco
re's
Per
cen
tile
8th
gra
de s
tud
ents
10000 20000 30000 40000 50000 60000Teachers' salaries (2007 USA$ PPP)

4. Econometric Estimation
• Teacher Salaries -> function of: Supply of Teachers
Demand for Teachers
• Production Function for Pupil Outcomes:function of : Teacher Hours,
Pupil Teacher Ratios
Educational Expenditure
GDP Growth
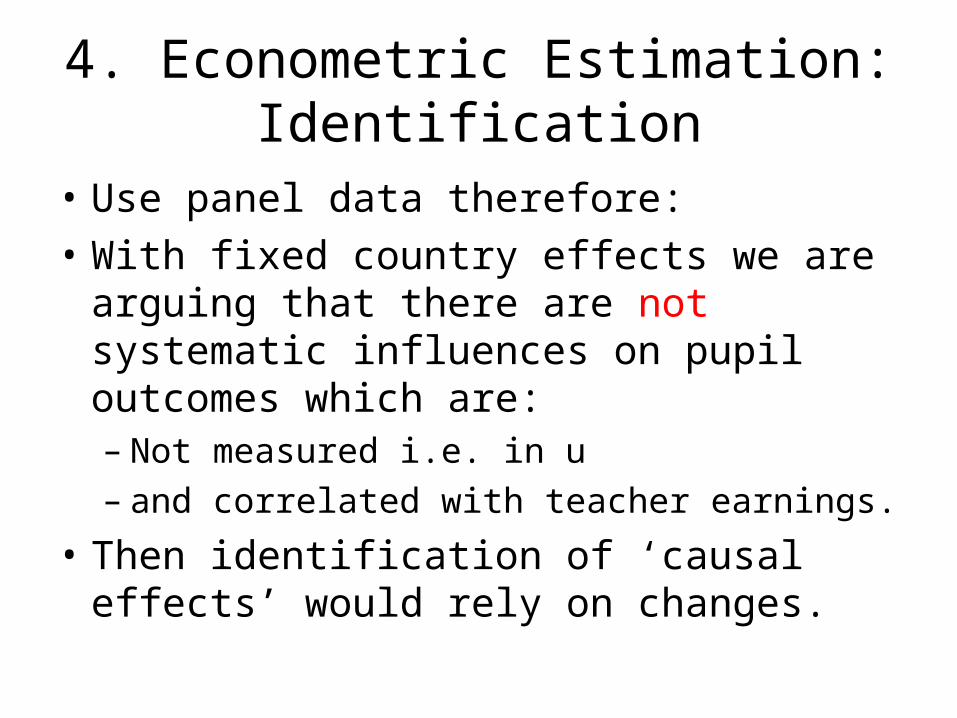
4. Econometric Estimation: Identification
• Use panel data therefore:
• With fixed country effects we are arguing that there are not systematic influences on pupil outcomes which are:– Not measured i.e. in u– and correlated with teacher earnings.
• Then identification of ‘causal effects’ would rely on changes.

Controls
• Teaching Hours
• Pupil/Teacher ratios
• Fraction of Women
• GDP growth
• Educational Expenditure
• Growth in size of teacher cohort.
• Growth in size of pupil pop’n

5. Results
Teachers salaries vary across country:
• -ve With supply
• +ve with Pupil/teacher ratios
• -ve with size of pupil cohort.

Table 3.a. Estimates explaining the Standardised scores for each type of Assessment, 8th grade students.
Fixed Effects Random Effects Specific. I Specific. II Specific. I Specific. II Teaching hours per year (hundreds) 0.0931*** 0.0977** 0.0629* 0.0914** (0.0348) (0.0427) (0.0333) (0.0430) Pupil/Teacher ratio 0.0324 0.0295 -0.0490*** -0.0883*** (0.0214) (0.0355) (0.0138) (0.0235) Women fraction of teaching staff (%) 0.0147** 0.0094 0.0030 -0.0193 (0.0061) (0.0213) (0.0053) (0.0127) Teachers' salaries after 15 years in 1000$ (deflated) 0.0307** 0.0542*** (0.0146) (0.0092) Percentile position of teachers (after 15 years) 3.7156*** 3.2153*** (1.2548) (1.1178) GDP growth (%) -0.0618** -0.1346*** -0.0035 -0.0049 (0.0247) (0.0476) (0.0226) (0.0393) Year dummies: (reference year 1995)
1999 1.4606*** 1.5708*** 1.3961*** 1.4623*** (0.1952) (0.2271) (0.1949) (0.2258) 2000 1.2679*** 1.5389*** 1.0798*** 1.2700*** (0.1663) (0.2358) (0.1676) (0.2139) 2003 1.2601*** 1.3221*** 1.1417*** 1.3975*** (0.1735) (0.2196) (0.1690) (0.2033) 2005 1.3378*** 1.1901*** (0.1848) (0.1812)
Constant -3.5052*** -4.4246*** -2.5253*** -1.6493* (0.5784) (1.2483) (0.4918) (0.8676) Observations 211 141 211 141 F-statistic R-squared Within 0.50 0.56 0.44 0.48 R-squared Between 0.11 0.47 0.63 0.42 R-squared Overall 0.01 0.08 0.40 0.30

Marginal Effects
• $5000 or 15% rise in teachers earnings
• OR
• 5% shift up the wage distribution for teachers
• will mean .20 of a SD in test score and hence around 8% rise in student performance.
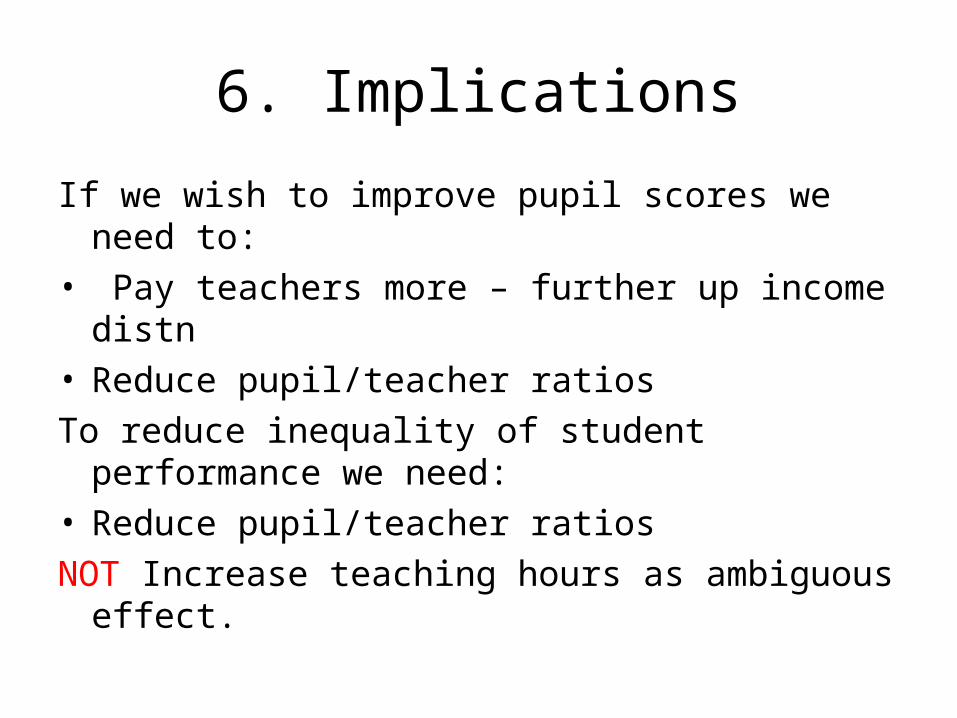
6. Implications
If we wish to improve pupil scores we need to:• Pay teachers more – further up income distn• Reduce pupil/teacher ratios
To reduce inequality of student performance we need:
• Reduce pupil/teacher ratios
NOT Increase teaching hours as ambiguous effect.