NYISO OPERATING STUDY SUMMER 2014 · NYISO OPERATING STUDY SUMMER 2014 ... in this report are based...
22
NYISO OPERATING STUDY SUMMER 2014 Prepared by Operations Engineering Staff New York Independent System Operator, Inc. Approved by NYISO Operating Committee May 15, 2014
Transcript of NYISO OPERATING STUDY SUMMER 2014 · NYISO OPERATING STUDY SUMMER 2014 ... in this report are based...
NYISO OPERATING STUDY
SUMMER 2014
Prepared by Operations Engineering Staff
New York Independent System Operator, Inc.
Approved by NYISO Operating Committee May 15, 2014
Caution and Disclaimer
The contents of these materials are for informational purposes and are provided “as is” without representation or warranty of any kind, including without limitation, accuracy, completeness or fitness for any particular purposes. The New York Independent System Operator (NYISO) assumes no responsibility to the reader or any other party for the consequences of any errors or omissions. The NYISO may revise these materials at any time in its sole discretion without notice to the reader.
NYISO OPERATING STUDY SUMMER 2014
TABLE OF CONTENTS
I. INTRODUCTION ........................................................................................................................................................ 4
II. PURPOSE .................................................................................................................................................................. 4
III. STUDY PARTICIPANTS .............................................................................................................................................. 5
IV. SYSTEM REPRESENTATION AND BASE STUDY ASSUMPTIONS .................................................................................... 5
A. SYSTEM REPRESENTATION ...................................................................................................................................................... 5 B. BASE STUDY ASSUMPTIONS .................................................................................................................................................... 6
V. DISCUSSION ............................................................................................................................................................. 6
A. RESOURCE ASSESSMENT ......................................................................................................................................................... 6 B. CROSS‐STATE INTERFACES ...................................................................................................................................................... 7 1. Transfer Limit Analysis ................................................................................................................................................. 7 2. Athens SPS ................................................................................................................................................................... 8 3. Sensitivity Testing ........................................................................................................................................................ 8 4. West Woodbourne Transformer .................................................................................................................................. 8 5. ConEd – LIPA Transfer Analysis .................................................................................................................................... 8 6. Transfer Limits for Outage Conditions ......................................................................................................................... 9 7. Transient Stability and Voltage transfer Limits ........................................................................................................... 9
C. THERMAL TRANSFER CAPABILITIES WITH ADJACENT BALANCING AREAS ......................................................................................... 10 1. New York – New England Analysis ............................................................................................................................. 11 2. New York ‐ PJM Analysis ............................................................................................................................................ 12 3. Ontario – New York Analysis ...................................................................................................................................... 13 4. TransÉnergie–New York Interface ............................................................................................................................. 14
VI. SUMMARY OF RESULTS – THERMAL TRANSFER LIMIT ANALYSIS ............................................................................ 15
APPENDICES
A. SCHEDULE OF SIGNIFICANT INTERCHANGES ASSUMED FOR TRANSFER LIMIT STUDIES
B. SUMMER 2014 BASE CASE CONDITIONS
C. POWER FLOW TRANSCRIPTION DIAGRAMS
D. RATINGS OF MAJOR TRANSMISSION FACILITIES IN NEW YORK
E. INTERFACE DEFINITIONS
F. ANNOTATED MUST OUTPUT
G. TRANSFER LIMIT SENSITIVITY GRAPHS
H. COMPARISON OF TRANSFER LIMITS: SUMMER 2014 vs. SUMMER 2013
I. GENERATION SHIFTS ASSUMED FOR THERMAL ANALYSIS
J. DISTRIBUTION FACTORS

NYISO OPERATING STUDY SUMMER 2014
NYISO OPERATING STUDY ‐ SUMMER 2014
I. INTRODUCTION
The following report, prepared by the Operating Studies Task Force (OSTF) at the direction and guidance of the System Operations Advisory Subcommittee (SOAS), highlights the significant results of the thermal analysis completed for the summer 2014 capability period. This analysis indicates that, for the summer 2014 capability period, the New York interconnected bulk power system can be operated reliably in accordance with the "NYSRC Reliability Rules for Planning and Operating the New York State Power System" and the NYISO System Operating Procedures. Transfer limits cited in this report are based on the forecast peak load conditions and are intended as a guide to system operation. Changes in generation dispatch or load patterns that significantly change pre‐contingency line loadings may change limiting contingencies or limiting facilities, resulting in higher or lower interface transfer capabilities. System Operators should monitor the critical facilities noted in the included tables along with other limiting conditions while maintaining bulk power system transfers within secure operating limits.
II. PURPOSE
The purpose of the study is to determine:
The total transfer capabilities (TTC) between NYISO and adjacent areas including IESO, PJM and ISO‐NE for normal conditions in the summer/winter periods. The TTC is calculated based on NERC TPL‐002‐0b Category B contingencies and a set of selected NERC TPL‐003‐0a Category C contingencies.
The TTC between NYISO and adjacent areas including IESO, PJM and ISO‐NE for emergency conditions in the summer/winter periods. The TTC is calculated based on NERC TPL‐002‐0b Category B contingencies.
This study is being performed to fulfill NERC requirements, which include Requirement R2 of FAC‐013 and Requirement R11 of TOP‐002‐2a as quoted below. “FAC‐013‐1—Establish and Communicate Transfer Capabilities Requirement R2: The Reliability Coordinator and Planning Authority shall each provide its inter‐regional and intra‐regional Transfer Capabilities to those entities that have a reliability‐related need for such Transfer Capabilities and make a written request that includes a schedule for delivery of such Transfer Capabilities as follows:
R2.1. The Reliability Coordinator shall provide its Transfer Capabilities to its associated Regional Reliability Organization(s), to its adjacent Reliability Coordinators, and to the Transmission Operators, Transmission Service Providers and Planning Authorities that work in its Reliability Coordinator Area. R2.2. The Planning Authority shall provide its Transfer Capabilities to its associated Reliability Coordinator(s) and Regional Reliability Organization(s), and to the Transmission Planners and Transmission Service Provider(s) that work in its Planning Authority Area.”
“TOP‐002‐2a—Normal Operations Planning Requirement R11: The Transmission Operator shall perform seasonal, next‐day, and current‐day Bulk Electric System studies to determine System Operating Limits (SOLs). Neighboring Transmission Operators shall utilize identical SOLs for common facilities. The Transmission Operator shall update these Bulk Electric System studies as necessary to reflect current system conditions; and shall make the results of Bulk Electric System studies available to the Transmission Operators, Balancing Authorities (subject to confidentiality requirements), and to its Reliability Coordinator.”
4

NYISO OPERATING STUDY SUMMER 2014
III. STUDY PARTICIPANTS
First Name Last Name Company Name First Name Last Name Company NameAnie Philip LIPA David Mahlmann NYISO Michael Del Casale LIPA Robert Golen NYISO Jalpa Patel LIPA De Dinh Tran NYISO Robert Eisenhuth LIPA Kenneth Wei NYISO Diem Ehret National Grid Roleto Mangonon O&R Matthew Antonio National Grid Henry Wysocki ConEd Brian Gordon NYSEG Zahid Qayyum ConEd Robert King NYSEG Bryan Kang Central Hudson Jence Mandizha NYSEG Ruby Chan Central Hudson Dean LaForest ISO‐NE Mohammed Hossain NYPA Bilgehan Donmez ISO‐NE Abhilash Gari NYPA Yuri Smolanitsky PJM Larry Hochberg NYPA Farzad Farahmand IESO Isen Widjaja IESO Jonathan Mendoza IESO Ovidiu Vasilachi IESO Hardeep Kandola IESO
IV. SYSTEM REPRESENTATION AND BASE STUDY ASSUMPTIONS
A. System Representation
The representation was developed from the NYISO Data Bank and assumes the forecast summer coincident peak load of 33,666 MW. The other NPCC Balancing Area and adjacent Regional representations were obtained from the RFC‐NPCC summer 2014 Reliability Assessment power flow base case and has been updated to reflect the summer 2014 operating period. Generation Resource Changes The generator output levels for major units are summarized in Appendix B, and are consistent with typical operation for the period. The inter‐Area schedules represented in the study base case are summarized in Appendix A. The following table shows generation retirements and additions since the summer 2013 capability period: Retirements
Freeport 9 ‐2 MW Ravenswood 07 (Mothballed) ‐13 MW Station 9 ‐14 MW Chateauguay Power ‐18 MW Syracuse Energy ST1 ‐11 MW Syracuse Energy ST2 ‐64 MW
Total Retirements ‐122 MW
Additions Niagara Bio‐Gen 0 MW Nanticoke Landfill Uprate 2 MW Stewarts Bridge Hydro Uprate 3 MW Astoria GT 10 (Return to Service) 17 MW Astoria GT 11 (Return to Service) 17 MW Orangeville Wind Farm (Nameplate) 94 MW Total Additions 133 MW
5

NYISO OPERATING STUDY SUMMER 2014
Significant changes since the summer 2013 capability period include: Transmission Facilities Changes
Ramapo Phase Angle Regulator (PAR) 4500 return to service Moses to Massena (MMS2) 230 kV line remains out‐of‐service
The Ramapo PAR 4500 has returned to service for the summer 2014 operating period. Moses to Massena (MMS2) 230 kV line remains out‐of‐service for the summer 2014 operating period.
B. Base Study Assumptions
The Siemens PTI PSS™MUST and PSS™E software packages were used to calculate the thermal limits based on Normal and Emergency Transfer Criteria defined in the “NYSRC Reliability Rules for Planning and Operating the New York State Power System". The thermal transfer limits presented have been determined for all transmission facilities scheduled in service during the summer 2014 period. The schedules used in the base case power flow for this analysis assumed a net flow of 1,000 MW from Public Service Electric & Gas (PSE&G) to Consolidated Edison via the PAR transformers controlling the Hudson – Farragut and Linden – Goethals interconnections, and 1,000 MW on the South Mahwah – Waldwick circuits from Consolidated Edison to PSE&G, controlled by the PARs at Waldwick. The Hopatcong – Ramapo 500 kV (5018) circuit is scheduled in accordance with the "Market‐to‐Market Coordination Process", August 14, 2013. For the summer 2014 base case, the schedule for the tie is 400 MW from PJM to New York. The four Ontario – Michigan PARs are modeled in‐service and scheduled to a 0 MW transfer. These schedules are consistent with the scenarios developed in the RFC‐NPCC Inter‐Regional Reliability Assessment for summer 2014, and the MMWG summer 2014 power flow base cases. The series reactors on the Dunwoodie – Mott Haven (71 and 72), the Farragut – Gowanus (41 and 42) 345 kV and the Sprain Brook – W. 49
th St. (M51 and M52) 345 kV cables, as well as the E. 179th St. – Hell Gate (15055) 138 kV feeder are in‐service in the base case. The series reactors on the Sprain Brook – East Garden City (Y49) 345 kV cable are by‐passed.
V. DISCUSSION
A. Resource Assessment
Load and Capacity Assessment The forecast peak demand for the summer 2014 capability period is 33,666 MW. This forecast is approximately 387 MW (1.16%) higher than the forecast of 33,279 MW for the summer 2013 capability period, and 290 MW (0.85%) lower than the all‐time New York Control Area (NYCA) seasonal peak of 33,956 MW, which occurred on July 19, 2013. The Installed Capacity (ICAP) requirement for the summer period is 39,389 MW based on the NYSRC 17.0% Installed Reserve Margin (IRM) requirement for the 2014‐2015 Capability Year. NYCA generation capacity for summer 2014 is 37,978 MW, and net external capacity purchases of 2,130 MW have been secured for the summer period. The combined capacity resources represent a 19.1% margin above the forecast peak demand of 33,666 MW. These values were taken from the 2013 Load & Capacity Data report produced by the NYISO, located at: http://www.nyiso.com/public/webdocs/markets_operations/services/planning/Documents_and_Res
ources/Planning_Data_and_Reference_Docs/Data_and_Reference_Docs/2014_GoldBook.pdf The equivalent forced outage rate is 5.05%, and includes forced outages and de‐ratings based on historical performance of all generation in the NYCA. For summer 2013, the equivalent forced outage
6

NYISO OPERATING STUDY SUMMER 2014
rate assumed was 5.0%.
B. Cross‐State Interfaces
1. TRANSFER LIMIT ANALYSIS
This report summarizes the results of thermal transfer limit analyses performed on power system representation modeling the forecast peak load conditions for summer 2014. Normal and emergency thermal limits were calculated according to Normal and Emergency Transfer Criteria definitions in the “NYSRC Reliability Rules for Planning and Operating the New York State Power System". Facility ratings applied in the analysis were from the online MW ratings in the EMS, and are detailed in Appendix D. Generation shifts assumed for the thermal analysis are detailed in Appendix I. Figure 1 presents a comparison of the summer 2014 thermal transfer limits to summer 2013 transfer limits. Changes in these limits from the previous years are due to changes in the base case load flow generation and load patterns that result in different pre‐contingency line loadings, changes in limiting contingencies, or changes in circuit ratings, or line status. Appendix H presents a summary comparison of Cross‐State thermal transfer limits between summer 2014 and 2013, with limiting element/contingency descriptions. Significant differences in these thermal transfer limits are discussed below.
Figure 1 – Cross‐State Thermal Transfer Limits
Dysinger East and West Central interface peak load thermal transfer limits will continue to be highly sensitive to the load in Zone A, generation dispatch and the flow toward PJM on Dunkirk‐Erie 230 kV tie. The network and available generation are essentially unchanged since the summer of 2013 when Dysinger East was observed to flow from 423 to 2,478 MW. The scheduling assumption for the Ramapo tie is primarily responsible for the 375 MW reduction in
7

NYISO OPERATING STUDY SUMMER 2014
the limits reported in this study. In the 2013 study Ramapo was scheduled at zero, consistent with the interregional base case for that summer. In this analysis, the Ramapo PARs were scheduled at 400 MW consistent with the Market to Market Coordination Process for this summer. This assumption change affects the flow toward PJM on Dunkirk‐Erie 230 kV, all other transaction assumptions held constant. Removing the modeling assumption, the 2014 limits would be essentially unchanged from 2013. UPNY ‐ ConEd interface thermal transfer limits increased 100 MW. This is due to the increase in Hopatcong – Ramapo flows due to the Ramapo PAR returning to service. 2. ATHENS SPS In 2008 a Special Protection System (SPS) went in‐service, impacting the thermal constraint on the Leeds to Pleasant Valley 345 kV transmission corridor. The SPS is designed to reject generation at the Athens combined‐cycle plant if either the Leeds to Pleasant Valley 345 kV (92) circuit or the Athens to Pleasant Valley 345 kV (91) circuit are out‐of‐service and the flow on the remaining circuit is above the LTE rating. Generation at Athens will be tripped until the flow is below the LTE rating, the out‐of‐service circuit recloses, or the remaining circuit trips. This SPS is expected to be active when there is generation on‐line at the Athens station, and will allow the NYCA transmission system to be secured to the STE rating of the 91 line for the loss of the 92 line, and vice‐versa, for normal operating conditions. The SPS increases the normal thermal limit to match the emergency thermal limit across the UPNY‐ConEd operating interface when the 91 or 92 is the limiting circuit. The Table 1 “Emergency” limit for the UPNY‐ConEd interface can be interpreted as the “Normal” limit, when the Athens SPS is active. 3. SENSITIVITY TESTING
The thermal limits presented in Section VI were determined using the base conditions and schedules. The effects of various intra‐ and inter‐Area transfers or generation patterns in the system are presented in Appendix G. Certain graphs indicate that there may not be a measurable sensitivity to the specific variable condition (summer peak load), or the sensitivity may occur at transfer levels above other transfer constraints (e.g., voltage or transient stability limitations). This analysis demonstrates how the particular constraint (thermal transfer limits) may respond to different conditions.
Phase angle regulator schedules may vary from day‐to‐day. A sensitivity analysis for selected interfaces has been included for the Ramapo and St. Lawrence interconnections. Graphs showing the sensitivity of the interface limit to the PAR schedule are included in Appendix G. 4. WEST WOODBOURNE TRANSFORMER The Total‐East interface may be limited at significantly lower transfer levels for certain contingencies that result in overloading of the West Woodbourne 115/69 kV transformer. Should the West Woodbourne tie be the limiting facility, it may be removed from service to allow higher Total‐East transfers. An over‐current relay is installed at West Woodbourne to protect for contingency overloads. 5. CONED – LIPA TRANSFER ANALYSIS
Normal transfer capabilities were determined using the base case generation dispatch and PAR settings as described in Appendix B. Emergency limits are dispatch dependant, and can vary based on generation and load patterns in the LIPA system.
For emergency transfer capability analysis, the PARs controlling the LIPA import were adjusted to allow for maximum transfer capability into LIPA:
8

NYISO OPERATING STUDY SUMMER 2014
ConEd – LIPA PAR Settings Normal Emergency
Jamaica – Lake Success 138 kV ‐165 MW 85 MW
Jamaica – Valley Stream 138 kV ‐123 MW 90 MW
Sprain Brook – E. Garden City 345 kV 637 MW 637 MW
ISO‐NE – LIPA PAR Settings
Norwalk Harbor – Northport 138 kV 100 MW 286 MW
The PAR schedules referenced above and the ConEd – LIPA transfer assessment assume a 70% loss factor and rapid oil circulation in the determination of the facility ratings. Emergency Transfer via the 138 kV PAR‐controlled Jamaica ties between ConEdison and LIPA
Con Edison and LIPA have determined possible emergency transfer levels via the Jamaica ‐ Valley Stream (901) 138 kV and Jamaica ‐ Lake Success (903) 138 kV PAR‐controlled ties that could be used to transfer emergency power between the two entities during peak conditions. The emergency transfer levels were calculated in both directions, for system peak load conditions with all transmission lines in service and all generation available for full capacity.
ConEd to LIPA emergency assistance Based on analysis of historical conditions performed by LIPA and Con Edison, Con Edison anticipates being able to supply a total flow up to 175 MW of emergency transfer from Con Edison to Long Island, if requested, via the ties. LIPA to ConEd emergency assistance Historically, LIPA anticipated being able to supply a total flow up to 510 MW of emergency transfer from Long Island to Con Edison, if requested, via the ties. However, with rating changes to several 138kV circuits internal to the LIPA system, this emergency transfer capability will likely be reduced. Assessment of emergency transfer capability from Long island to Con Ed is under review.
6. TRANSFER LIMITS FOR OUTAGE CONDITIONS
Transfer limits for scheduled outage conditions are determined by the NYISO Scheduling and Market Operations groups. The NYISO Real‐Time Dispatch system monitors the EHV transmission continuously to maintain the secure operation of the interconnected system.
7. TRANSIENT STABILITY AND VOLTAGE TRANSFER LIMITS
The interface transfer limits shown in Section VI are the results of a thermal transfer limit analysis only. Transient stability and voltage interface transfer limits for all lines in‐service and line outage conditions are summarized and available through the NYISO website located at:
http://www.nyiso.com/public/markets_operations/market_data/reports_info/index.jsp
9
NYISO OPERATING STUDY SUMMER 2014
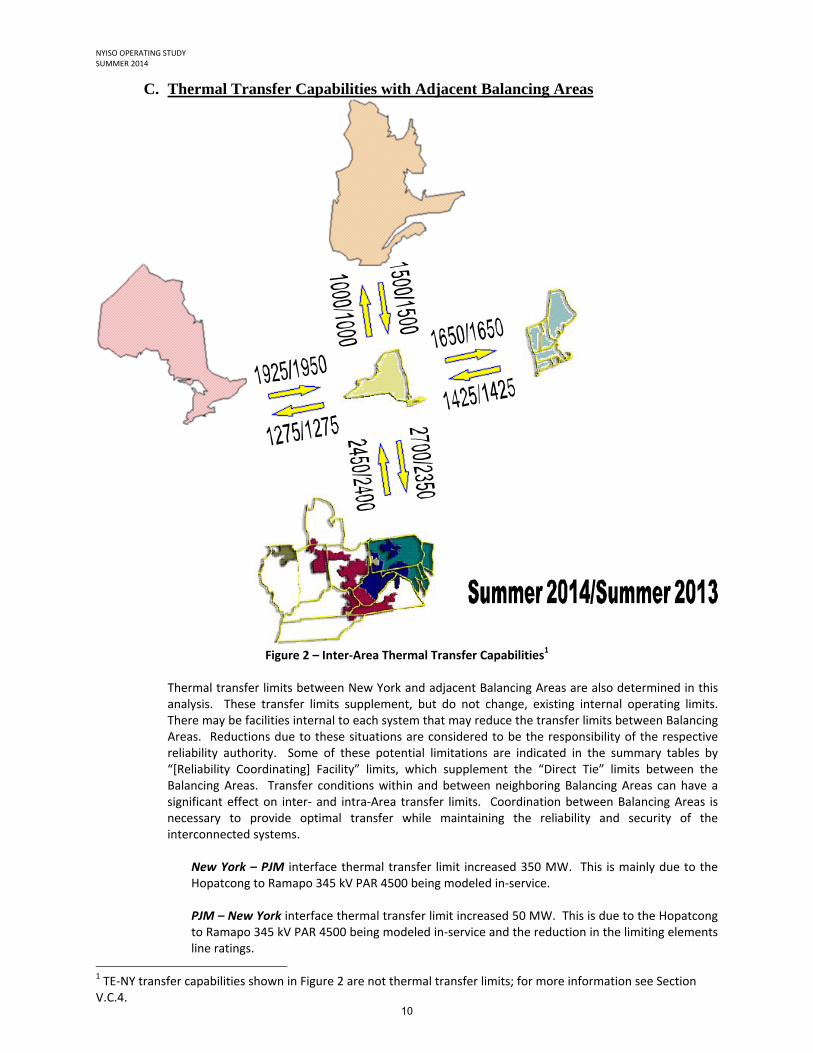
C. Thermal Transfer Capabilities with Adjacent Balancing Areas
Figure 2 – Inter‐Area Thermal Transfer Capabilities1
Thermal transfer limits between New York and adjacent Balancing Areas are also determined in this analysis. These transfer limits supplement, but do not change, existing internal operating limits. There may be facilities internal to each system that may reduce the transfer limits between Balancing Areas. Reductions due to these situations are considered to be the responsibility of the respective reliability authority. Some of these potential limitations are indicated in the summary tables by “[Reliability Coordinating] Facility” limits, which supplement the “Direct Tie” limits between the Balancing Areas. Transfer conditions within and between neighboring Balancing Areas can have a significant effect on inter‐ and intra‐Area transfer limits. Coordination between Balancing Areas is necessary to provide optimal transfer while maintaining the reliability and security of the interconnected systems.
New York – PJM interface thermal transfer limit increased 350 MW. This is mainly due to the Hopatcong to Ramapo 345 kV PAR 4500 being modeled in‐service. PJM – New York interface thermal transfer limit increased 50 MW. This is due to the Hopatcong to Ramapo 345 kV PAR 4500 being modeled in‐service and the reduction in the limiting elements line ratings.
1 TE‐NY transfer capabilities shown in Figure 2 are not thermal transfer limits; for more information see Section V.C.4.
10

NYISO OPERATING STUDY SUMMER 2014
1. NEW YORK – NEW ENGLAND ANALYSIS
a) New England Transmission/Capacity Additions Transmission Most of the Greater Springfield Reliability Project (GSRP) has been completed with a number of new transmission facilities installed in western Massachusetts including 345 kV lines terminating at a new Agawam substation paralleling the existing 345 kV path from western Massachusetts to Connecticut. Preliminary construction efforts have begun on a new 345 kV line between eastern Connecticut, Rhode Island and Massachusetts. Concurrently, northern New England transmission system is in the midst of major transmission upgrades. Larrabee Road, Albion Road, Elliot and Raven Farm are the new substations already in service. Capacity No major generation additions or retirements are scheduled before the summer 2014 operating period.
b) Thermal Transfer Limit Analysis
The transfer limits between the NYISO and ISO New England for normal and emergency transfer criteria are summarized in Section VI, Table 2.
c) Cross‐Sound Cable
The Cross‐Sound Cable is an HVdc merchant transmission facility connecting the New Haven Harbor 345 kV (United Illuminating, ISO‐NE) station and Shoreham 138 kV (LIPA, NYISO) station. It has a design capacity of 330 MW. This facility is not metered as part of NYISO – ISO‐NE interface, and HVdc transfers are independent of transfers between the NYISO and ISO‐NE.
d) Smithfield – Salisbury 69 kV
CHG&E and Northeast Utilities will operate the Smithfield ‐ Salisbury 69 kV (FV/690) line normally closed. The maximum allowable flow on this line is 28 MVA based on limitations in the Northeast Utilities 69 kV system. When the ISO‐NE to NYISO transfer is greater than approximately 400 MW, however, the line will be opened, due to post contingency limits within the Northeast Utilities system. The FV/690 line has directional over‐current protection that will trip the FV/690 Line in the event of an overload when the flow is into Northeast Utilities, no protection exists that will trip the FV/690 Line in the event of an overload when the flow is into NYISO.
e) Northport – Norwalk Harbor Cable Flow
Flow on the NNC Norwalk Harbor to Northport, facility is controlled by a phase angle‐regulating (PAR) transformer at Northport. As system conditions vary the scheduled flow on the NNC may be used to optimize transfer capability between the Balancing Areas. The thermal transfer limits are presented in Table 2 for different PAR schedule assumptions on the Northport – Norwalk Harbor interconnection. Exhibits in Appendix G graphically demonstrate the optimization of transfer capability by regulating the flow on the Northport‐Norwalk Harbor tie.
f) Whitehall – Blissville 115 kV
The phase angle regulator on this circuit will control pre‐contingency flow between the respective stations. VELCO, National Grid, ISO‐NE and NYISO developed a joint
11

NYISO OPERATING STUDY SUMMER 2014
operating procedure. For the summer 2014 analyses, the pre‐contingency schedule is 25 MW from Blissville (ISO‐NE) to Whitehall (NYISO). The scheduled flow may be adjusted to protect the National Grid local 115 kV transmission south of Whitehall for 345 kV contingency events in southern Vermont.
g) Plattsburgh – Sand Bar 115 kV (i.e. PV20)
The phase angle regulating transformer at the VELCO Sand Bar substation was modeled holding a pre‐contingency flow of approximately 100 MW on the PV20 tie. This modeling assumption was premised upon common operating understandings between ISO‐NE and the NYISO given local operating practice on the Moses – Willis – Plattsburgh 230 kV transmission corridor. ISO‐NE’s analysis examined and considered New England system limitations given this modeling assumption and did not examine generation dispatch / system performance on the New York side of the PV20 tie for this analysis.
2. NEW YORK ‐ PJM ANALYSIS
a) Thermal Transfer Limit Analysis
The transfer limits for the New York ‐ PJM interface are summarized in Section VI, Table 3. The phase angle regulating transformers controlling the Hopatcong – Ramapo 500 kV circuit are used to maintain flow at the normal rating of the Ramapo 500/345 kV transformer (1,000 MW) in the direction of the transfer.
b) Opening of PJM ‐ New York 115 kV Ties as Required
The normal criteria thermal transfer limits presented in Section VI were determined for an all lines in‐service condition. The 115 kV interconnections between First Energy and New York (Warren ‐ Falconer, North Waverly ‐ East Sayre, and Laurel Lake ‐ Westover) may be opened in accordance with NYISO and PJM Operating Procedures provided this does not cause unacceptable impact on local reliability in either system. Over‐current protection is installed on the Warren ‐ Falconer and the North Waverly ‐ East Sayre 115 kV circuits; either of these circuits would trip by relay action for an actual overload condition. There is no overload protection on the Laurel Lake ‐ Westover circuit, but it may be opened by operator action if there is an actual or post‐contingency overload condition. However, opening the Laurel Lake – Westover tie could potentially cause local thermal and pre‐ and post‐contingency voltage violations for the 34.5 kV distribution system within New York. Sensitivity analysis performed indicated that the thermal and voltage conditions were exacerbated for conditions that modeled high simultaneous interface flows from New York to PJM and New York to Ontario.
c) DC Ties
Neptune DC tie is expected to be available at full capability, 660 MW, for summer 2014. Hudson Transmission Project (HTP) DC tie is expected to be to be available at full capability, 660 MW, for summer 2014. For the summer 2014 study HTP’s firm transmission rights will be 320 MW.
d) Variable Frequency Transformer Tie The Variable Frequency Transformer Tie is a transmission facility connecting the Linden 230 kV (PSEG, PJM) to Linden 345 kV (ConEd, NYISO). For the summer 2014 analysis, LIN VFT will have 300 bi‐directional transmission rights.
12

NYISO OPERATING STUDY SUMMER 2014
3. ONTARIO – NEW YORK ANALYSIS
a) Thermal Transfer Limit Analysis The thermal transfer limits between the NYISO and Ontario’s Independent Electricity System Operator (IESO) Balancing Areas for normal and emergency transfer criteria are presented in Section 4, Table 4. The thermal transfer limits between NY and Ontario were determined for two scheduled transfers in either direction on the phase angle regulating (PAR) transformers controlling the L33P and L34P interconnections at St. Lawrence: One transfer at 0 MW and one at 300 MW. The 300 MW transfer on L33P and L34P is the interconnection flow limit across these ties, as presented in table 4.3 “Interconnection Total Transfer Capability (TTC) Limits” from the document “Ontario Transmission System” available at:
http://www.ieso.ca/imoweb/monthsYears/monthsAhead.asp
Transient Stability Limitations
Transient stability limits for the NYISO ‐ IESO interconnection are reported in "NYPP‐OH TRANSIENT STABILITY TESTING REPORT on DIRECT TIE TRANSFER CAPABILITY ‐ OCTOBER 1993" available at: http://www.nyiso.com/public/webdocs/market_data/reports_info/operating_studies/NOH‐1/NYPP‐OH_1993.PDF
b) Ontario – Michigan PARs
All of the PARs on the four major transmission lines interconnecting Ontario and Michigan are in service and regulating. For this study, the PARs were scheduled to regulate at 0 MW, consistent with the ERAG Transmission System Assessment for summer 2014.
c) Impact of the Queenston Flow West (QFW) Interface on the New York to Ontario Transfer Limit The QFW interface is defined as the sum of the power flows into Ontario on the 230 kV circuits out of Beck. The QFW is primarily equal to the algebraic sum of the following:
1. Total generation in the Niagara zone of Ontario including the units at the Beck #1, #2 & Pump Generating Stations, Thorold and Decew Falls GS
2. The total load in the zone 3. The import from New York.
For a given limit for QFW, the import capability from New York will depend on the generation dispatch and the load in the Niagara zone. The import capability from New York can be increased by decreasing the generation in the Niagara zone. An increase in the load in this zone would also increase the import capability.
13

NYISO OPERATING STUDY SUMMER 2014
4. TRANSÉNERGIE–NEW YORK INTERFACE
Thermal transfer limits between TransÉnergie (Hydro‐Quebec) and New York are not analyzed as part of this study. Respecting the NYSRC and NYISO operating reserve requirements, the maximum allowable delivery into the NYCA from TransÉnergie on the Chateauguay – Massena (MSC‐7040) 765 kV tie is limited to 1310 MW. However in real‐time the total flow is limited to 1800 MW; the additional flow is a “wheel‐through” transaction to another Balancing Authority Area. Maximum delivery from NYCA to Quebec on the 7040 line is 1000 MW.
The Dennison Scheduled Line represents a 115 kV dual‐circuit transmission line that interconnects the New York Control Area to the Hydro‐Quebec Control Area at the Dennison Substation, near Massena, NY. The Line has a nominal north to south capacity of 190 MW in summer, into New York, and a nominal south to north capacity of 100 MW into Quebec.
14
NYISO OPERATING STUDY SUMMER 2014
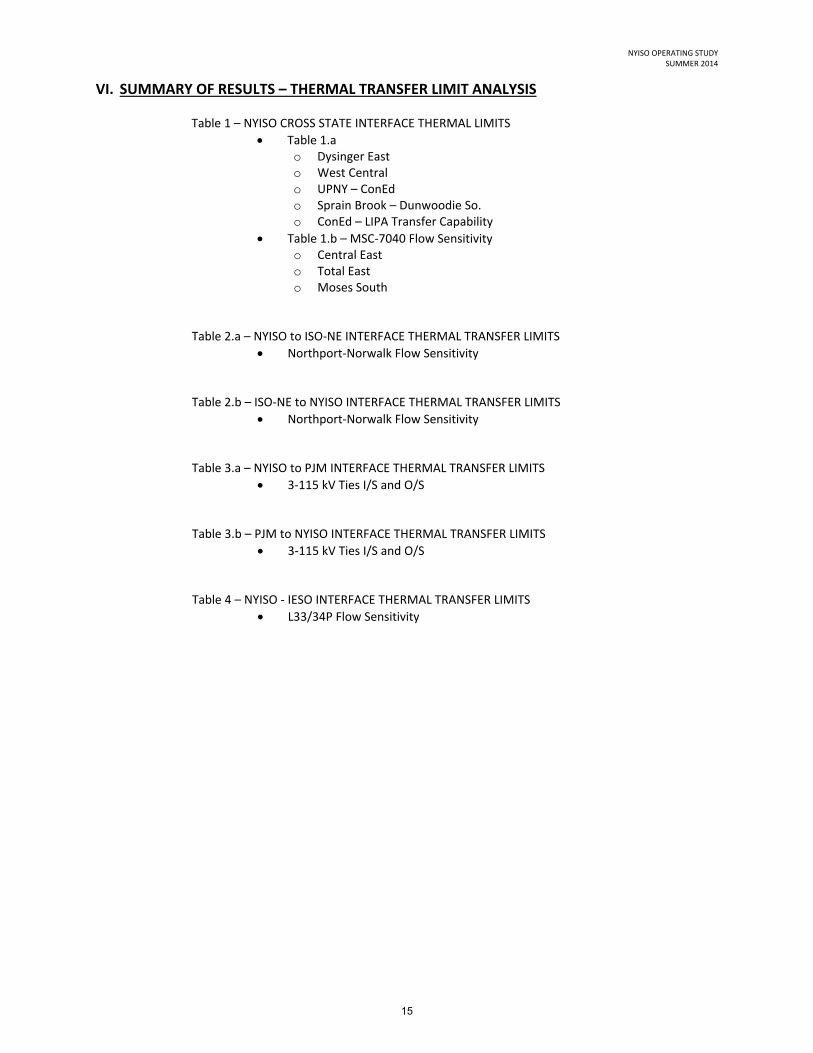
VI. SUMMARY OF RESULTS – THERMAL TRANSFER LIMIT ANALYSIS Table 1 – NYISO CROSS STATE INTERFACE THERMAL LIMITS
Table 1.a o Dysinger East o West Central o UPNY – ConEd o Sprain Brook – Dunwoodie So. o ConEd – LIPA Transfer Capability
Table 1.b – MSC‐7040 Flow Sensitivity o Central East o Total East o Moses South
Table 2.a – NYISO to ISO‐NE INTERFACE THERMAL TRANSFER LIMITS
Northport‐Norwalk Flow Sensitivity Table 2.b – ISO‐NE to NYISO INTERFACE THERMAL TRANSFER LIMITS
Northport‐Norwalk Flow Sensitivity Table 3.a – NYISO to PJM INTERFACE THERMAL TRANSFER LIMITS
3‐115 kV Ties I/S and O/S Table 3.b – PJM to NYISO INTERFACE THERMAL TRANSFER LIMITS
3‐115 kV Ties I/S and O/S Table 4 – NYISO ‐ IESO INTERFACE THERMAL TRANSFER LIMITS
L33/34P Flow Sensitivity
15

NYISO OPERATING STUDY SUMMER 2014
TABLE 1.a
NYISO CROSS‐STATE INTERFACE THERMAL TRANSFER LIMITS‐SUMMER 2014 ALL LINES I/S
Dysinger East West Central UPNY ‐ ConEd1 Sprain Brook
Dunwoodie ‐ So.
ConEd – LIPA Transfer Capability
NORMAL 1675 (1) 225 (1) 3600 (3) 4125 (5) 900 (7)
EMERGENCY 2200 (2) 700 (2) 4250 (4) 4150 (6) 1450 (8)
LIMITING ELEMENT Rating LIMITING CONTINGENCY
(1) Huntley – Sawyer (80) 230 kV @LTE 654 MW L/O Huntley – Sawyer (79) 230 kV
(2) Huntley – Sawyer (80) 230 kV @STE 755 MW L/O Huntley – Sawyer (79) 230 kV
(3) Leeds – Pleasant Valley (92) 345 kV @LTE 1538 MW L/O Athens – Pleasant Valley (91) 345 kV
(4) Leeds – Pleasant Valley (92) 345 kV @STE 1724 MW L/O Athens – Pleasant Valley (91) 345 kV
(5) Mott Haven – Rainey (Q11) 345 kV @SCUC2 1066 MW L/O (SB:RAIN345_7W) Mott Haven – Rainey (Q12) 345 kV Rainey 345/138 kV Transformer 7W Rainey – East 75 St. 138 kV East 75 St. – West 110 St. 138 kV
(6) Dunwoodie – Mott Haven (71) 345 kV @NORM 707 MW Pre‐Contingency Loading
(7) Dunwoodie – Shore Rd. (Y50) 345 kV @LTE 914 MW3 L/O (SB RNS2 @ Sprain Brook 345 kV) Sprain Brook – East Garden City (Y49) 345 kV Sprain Brook – Academy (M29) 345 kV
(8) Dunwoodie – Shore Rd. (Y50) 345 kV @NORM 653 MW3 Pre‐Contingency Loading
1: See Section V.B.2 for discussion on Athens SPS 2: The rating used for cable circuits during SCUC reliability analysis is the average of the LTE and STE rating (SCUC Rating). 3: LIPA rating for Y50 circuit is based on 70 % loss factor and rapid oil circulation.
16

NYISO OPERATING STUDY SUMMER 2014
TABLE 1.b
NYISO CROSS‐STATE INTERFACE THERMAL TRANSFER LIMITS‐SUMMER 2014 ALL LINES I/S
MSC‐7040 FLOW
800 MW MSC‐7040 FLOW
1310 MW MSC‐7040 FLOW
1600 MW
CENTRAL EAST
NORMAL 2875 (1) 2875 (1) 2875 (1)
EMERGENCY 3175 (2) 3200 (2) 3200 (2)
TOTAL EAST
NORMAL 4975 (3) 5000 (3) 4975 (3)
EMERGENCY 5650 (4) 5625 (4) 5625 (4)
MOSES SOUTH
NORMAL 2050 (5) 2250 (7) 2175 (7)
EMERGENCY 2350 (6) 2750 (8) 2675 (8)
LIMITING ELEMENT Rating LIMITING CONTINGENCY
(1) New Scotland – Leeds (93) 345 kV @LTE 1538 MW L/O New Scotland – Leeds (94) 345 kV
(2) New Scotland – Leeds (93) 345 kV @STE 1724 MW L/O New Scotland – Leeds (94) 345 kV
(3) Fraser – Coopers Corners (33) 345 kV @LTE 1404 MW L/O Double‐circuit Tower 31&41 Marcy – Coopers Corners (UCC2‐41) 345 kV Porter – Rotterdam (31) 230 kV
(4) Rock Tavern – Ramapo (77) 345 kV @STE 2037 MW L/O Roseton – East Fishkill (305) 345 kV
(5) Moses – Adirondack (MA2) 230 kV @LTE 386 MW L/O Chateauguay–Massena (MSC‐7040) 765 kV Massena – Marcy (MSU1) 765 kV and TransÉnergie delivery
(6) Moses – Massena (MMS1) 230 kV @NORM 936 MW Pre‐Contingency Loading
(7) Marcy 765/345 kV T2 Transformer @LTE 1650 MW L/O Marcy 765/345 kV T1 Transformer
(8) Marcy 765/345 kV T2 Transformer @STE 1971 MW L/O Marcy 765/345 kV T1 Transformer
17

NYISO OPERATING STUDY SUMMER 2014
TABLE 2.a
NYISO to ISO‐NE INTERFACE THERMAL TRANSFER LIMITS ‐ SUMMER 2014 ALL LINES I/S
New York to New England
DIRECT TIE NYISO FACILITY ISO‐NE FACILITY
Northport –Norwalk 100 MW
NORMAL 1700 (1) 2975 (3) 1625 (5)
EMERGENCY 2325 (2) 3075 (4) 1625 (5)
Northport –Norwalk 0 MW
NORMAL 1650 (1) 2975 (3) 1600 (5)
EMERGENCY 2275 (2) 3125 (4) 1600 (5)
NOTE: Northport – Norwalk Harbor flow is positive in the direction of transfer The Northport – Norwalk Harbor (NNC) line is no longer part of the New York – New England Interface Definition
LIMITING ELEMENT Rating LIMITING CONTINGENCY
(1) Pleasant Valley – Long Mountain (398) 345 kV @LTE 1313 MW L/O SB:MILLST 3:14T Beseck – Millstone (348) 345 kV Millstone G3 24 kV
(2) Pleasant Valley – Long Mountain (398) 345 kV @STE 1596 MW L/O Millstone G3 24.0 kV
(3) New Scotland – Alps (2‐AN) 345 kV @LTE 1326 MW L/O Pleasant Valley – Long Mountain (398) 345 kV Pleasant Valley – East Fishkill (F37) 345 kV
(4) Reynolds Rd – Greenbush (9‐RG) 115 kV @STE 398 MW L/O New Scotland – Alps (2‐AN) 345 kV
(5) Blandford – Granville Junction (1512) 115 kV @STE 147 MW L/O Northfield – Ludlow (354) 345 kV
18

NYISO OPERATING STUDY SUMMER 2014
TABLE 2.b
ISO‐NE to NYISO INTERFACE THERMAL LIMITS – SUMMER 2014 ALL LINES I/S
New England to New York
DIRECT TIE NYISO FACILITY ISO‐NE FACILITY
Norwalk –Northport
@ 0 MW
NORMAL 1800 (1) 2550 (5) 1350 (7)
EMERGENCY 2075 (2) 3325 (6) 1400 (8)
Norwalk –Northport
@ 100 MW
NORMAL 1825 (1) 2550 (5) 1400 (7)
EMERGENCY 2125 (2) 3325 (6) 1450 (8)
Norwalk–Northport @ 200 MW
NORMAL 1425 (3) 2550 (5) 1450 (7)
EMERGENCY 2025 (4) 3325 (6) 1500 (8)
NOTE: Northport – Norwalk Harbor flow is positive in the direction of transfer. The Northport – Norwalk Harbor (NNC) line is no longer part of the New York – New England Interface Definition
LIMITING ELEMENT LIMITING CONTINGENCY
(1) Pleasant Valley – Long Mountain (398) 345 kV @LTE 1313 MW L/O Alps – Berkshire (393) 345 kV Berkshire – Northfield Mount (312) 345 kV Berkshire 345/115 kV Transformer
(2) Pleasant Valley – Long Mountain (398) 345 kV @NORM 1135 MW Pre‐Contingency Loading
(3) Northport – Norwalk Harbor (NNC) 138 kV @LTE 513 MW L/O Pleasant Valley – Long Mountain (398) 345 kV Pleasant Valley – East Fishkill (F37) 345 kV
(4) Northport – Norwalk Harbor (NNC) 138 kV @STE 641 MW L/O Pleasant Valley – Long Mountain (398) 345 kV
(5) New Scotland – Alps (2‐AN) 345 kV @LTE 1326 MW L/O Pleasant Valley – Long Mountain (398) 345 kV
(6) New Scotland – Alps (2‐AN) 345 kV @STE 1685 MW L/O Pleasant Valley – Long Mountain (398) 345 kV
(7) Norwalk Junction – Archers Lane (3403C) 345 kV @LTE 850 MW L/O Southington 5T Stuck Breaker
(8) Norwalk Junction – Archers Lane (3403C) 345 kV @LTE 850 MW L/O Long Mountain – Frost Bridge (352) 345 kV
19

NYISO OPERATING STUDY SUMMER 2014
TABLE 3.a
NYISO to PJM INTERFACE THERMAL TRANSFER LIMITS ‐ SUMMER 2014 ALL LINES I/S
NYISO to PJM DIRECT TIE NYISO FACILITY PJM FACILITY
NORMAL 2375 (1) 2775 (3) 2575 (6)
3‐115‐O/S 2700 (2) 3325 (4) 3500 (7)
EMERGENCY 2450 (8) 3325 (5) 2650 (6)
3‐115‐O/S 2800 (9) 3300 (10) 3500 (7)
LIMITING ELEMENT Rating LIMITING CONTINGENCY
(1) North Waverly – East Sayre (956) 115 kV @LTE 128 MW L/O East Towanda – Hillside (70) 230 kV
(2) Hillside – East Towanda (70) 230 kV @LTE 531 MW L/O (Tower 72 & 69) Hillside – Watercure (69) 230 kV Stoney Ridge – Hillside (72) 230 kV
(3) Oakdale – Goudey (939) 115 kV @LTE 274 MW L/O Grover – East Towanda 230 kV East Towanda – Hillside (70) 230 kV East Towanda 230/115 kV transformer East Sayre – North Waverly (956) 115 kV
(4) Watercure 345/230 kV Transformer
@LTE 520 MW L/O Watercure – Homer City (30) 345 kV
(5) Oakdale – Goudey (939) 115 kV @STE 306 MW L/O Hillside – East Towanda (70) 230 kV
(6) Towanda – East Sayre 115 kV @EMER 131 MW L/O Hillside – East Towanda (70) 230 kV
(7) East Towanda – Canyon 230 kV @EMER 554 MW L/O Susquehanna G1
(8) North Waverly – East Sayre (956) 115 kV @STE 143 MW L/O Hillside – East Towanda (70) 230 kV
(9) Hillside – East Towanda (70) 230 kV @NORM
483 MW Pre‐Contingency Loading
(10) Hillside – Watercure (69) 230 kV @STE
657 MW L/O Watercure – Homer City (30) 345 kV
NOTE: Emergency Transfer Capability Limits may have required line outages as described in Section V.C.2. PAR schedules have been adjusted in the direction of transfer.
20

NYISO OPERATING STUDY SUMMER 2014
TABLE 3.b
PJM to NYISO INTERFACE THERMAL TRANSFER LIMITS ‐ SUMMER 2014 ALL LINES I/S
PJM to NYISO DIRECT TIE NYISO FACILITY PJM FACILITY
NORMAL 1475 (1) 2350 (6) 2400 (3)
3‐115‐O/S 2450 (2) 2325 (7) 3250 (11)
EMERGENCY 1600 (4) 3025 (9) 2575 (8)
3‐115‐O/S 2450 (5) 2875 (10) 3250 (11)
LIMITING ELEMENT Rating LIMITING CONTINGENCY
(1) Falconer – Warren (171) 115 kV @LTE 116 MW L/O South Ripley – Dunkirk (68) 230 kV Gardenville – Dunkirk (73) 230 kV Gardenville – Dunkirk (74) 230 kV Dunkirk 230/115 kV Transformer Bank 31 Dunkirk 230/115 kV Transformer Bank 41
(2) Dunkirk – South Ripley (68) 230 kV @LTE 444 MW L/O Stolle Rd. – Homer City (37) 345 kV
(3) Towanda – East Sayre 115 kV @EMER 131 MW L/O (Stuck Breaker Hillside 230 kV) Hillside – Watercure (69) 230 kV Hillside – East Towanda (70) 230 kV Hillside 230/34.5 kV Transformer Hillside 115/34.5 kV Transformer
(4) Falconer – Warren (171) 115 kV @STE 119 MW L/O Glade – Forest 230 kV
(5) Dunkirk – South Ripley (68) 230 kV @STE 444 MW L/O Stolle Rd. – Homer City (37) 345 kV
(6) North Waverly – Lounsberry 115 kV @LTE 131 MW L/O Watercure – Oakdale (31) 345 kV Oakdale – Clarks Corners (36) 345 kV
(7) Watercure 345/230 kV Transformer
@LTE 520 MW L/O Watercure – Oakdale (31) 345 kV Oakdale – Clarks Corners (36) 345 kV
(8) Towanda – East Sayre 115 kV @EMER 131 MW L/O Hillside – East Towanda (70) 230 kV
(9) North Waverly – Lounsberry 115 kV @STE 143 MW L/O Watercure – Oakdale (31) 345 kV
(10) Watercure 345/230 kV Transformer
@STE 600 MW L/O Watercure – Oakdale (31) 345 kV
(11) North Meshoppen 230/115 kV Transformer @EMER 189 MW L/O Canyon – North Meshoppen 230 kV
NOTE: Emergency Transfer Capability Limits may have required line outages as described in Section V.C.2. PAR schedules have been adjusted in the direction of transfer.
21

NYISO OPERATING STUDY SUMMER 2014
TABLE 4
NYISO ‐ IESO INTERFACE THERMAL TRANSFER LIMITS ‐ SUMMER 2014 ALL LINES I/S
DIRECT
TIE NYISO FACILITY
IESO FACILITY
DIRECT TIE
NYISO FACILITY
IESO FACILITY
Ontario to New York
L33/34P 0 MW
L33/34P 300 MW
NORMAL 1925 (1) 150 (2) 2175 (3) 2225 (1) 475 (2) 2475 (3)
EMERGENCY 2300 (4) 1050 (5) 2725 (6) 2600 (4) 1350 (5) 3000 (6)
New York to Ontario
L33/34P 0 MW
L33/34P 300 MW
NORMAL 1275 (7) 500 (9,11) 1575 (7) 800 (9,11)
EMERGENCY 1750 (8) 825 (10,11) 2050 (8) 1125 (10,11)
LIMITING ELEMENT Rating LIMITING CONTINGENCY
(1) Beck – Niagara (PA27) 230 kV @LTE 460 MW L/O Beck – Niagara (PA 302) 345 kV
(2) Huntley – Sawyer (80) 230 kV @LTE 654 MW L/O Huntley – Sawyer (79) 230 kV
(3) Q30M 220 kV @LTE 393 MW L/O Q23BM + Q25BM 220 kV
(4) Beck – Niagara (PA27) 230 kV @STE 558 MW L/O Beck – Niagara (PA 301) 345 kV
(5) Packard – Sawyer (77) 230 kV @STE 704 MW L/O Packard – Sawyer (78) 230 kV
(6) Q30M 220 kV @NORM 370 MW Pre‐Contingency Loading
(7) Beck – Niagara (PA27) 230 kV @LTE 460 MW L/O Beck – Niagara (PA 301) 345 kV Q28A 220 kV Beck #2 units 19 & 20 + Thorold GS
(8) Beck – Niagara (PA27) 230 kV @NORM 400 MW Pre‐Contingency Loading
(9) Beck – Niagara West 220 kV @LTE 473 MW L/O Q25BM + Q29HM 220 kV
(10) Q29HM 220 kV @NORM 415 MW Pre‐Contingency Loading
(11) This limit can be increased by reducing generation in the Niagara zone of Ontario. See Section V.C.3.c. for discussion.
22