NWS State College Case Examplescms.met.psu.edu/sref/severe/2013/13Jun2013.pdf · NWS State College...
28
NWS State College Case Examples Eastern Derecho 12-13 June 2013-Draft Richard H. Grumm National Weather Service Office State College, PA 16803 Abstract: A strong mid-tropospheric short-wave coming over a sharp 500 hPa ridge produced a series of mesoscale convective complexes on 12-13 June 2013. One MCS classified as a derecho producing widespread wind damage from the western Great Lakes into southeastern Pennsylvania. The severe weather in Pennsylvania was observed mainly between 0600 and 1200 UTC 13 June 2013 with the long-lived derecho producing MCS. This system included a deep surface cyclone for so late in the season and NCEP models produced significant amounts of QPF with the system. Overall, most forecast systems grossly over forecast the QPF relative to observed rainfall data. These over predictions of QPF lead to the issuance of flood watches and concerns about flooding that did not materialize due to the general lack of heavy rainfall. Probabilistic QPF threshold values from the NCEP SREF showed high end rainfall amounts were a low probability outcome. This paper shows the pattern in which the derecho producing MCS developed. The pattern and thus the pattern of the precipitation was relatively well predicted, though as stated earlier the NCEP models grossly over predicted the rainfall.
Transcript of NWS State College Case Examplescms.met.psu.edu/sref/severe/2013/13Jun2013.pdf · NWS State College...

NWS State College Case Examples
Eastern Derecho 12-13 June 2013-Draft Richard H. Grumm
National Weather Service Office State College, PA 16803 Abstract:
A strong mid-tropospheric short-wave coming over a sharp 500 hPa ridge produced a series of mesoscale convective complexes on 12-13 June 2013. One MCS classified as a derecho producing widespread wind damage from the western Great Lakes into southeastern Pennsylvania. The severe weather in Pennsylvania was observed mainly between 0600 and 1200 UTC 13 June 2013 with the long-lived derecho producing MCS.
This system included a deep surface cyclone for so late in the season and NCEP models produced significant amounts of QPF with the system. Overall, most forecast systems grossly over forecast the QPF relative to observed rainfall data. These over predictions of QPF lead to the issuance of flood watches and concerns about flooding that did not materialize due to the general lack of heavy rainfall. Probabilistic QPF threshold values from the NCEP SREF showed high end rainfall amounts were a low probability outcome.
This paper shows the pattern in which the derecho producing MCS developed. The pattern and thus the pattern of the precipitation was relatively well predicted, though as stated earlier the NCEP models grossly over predicted the rainfall.

NWS State College Case Examples
1. Overview
A derecho (Hinrichs 1888) developed over the western Great Lakes region (Fig. 1) spreading severe weather from southern Minnesota to southern Pennsylvania from the afternoon hours of 12 June through the early morning hours of 13 June 2013 (Fig. 2) before moving over the western Atlantic. The intense synoptic pattern produced additional convection over the Mid-Atlantic region during the afternoon and evening hours of 13 June 2013 (Fig. 2b). The strong pattern produced over 400 reports of severe weather on both the 12th and 13th of June 2013.
The derecho of 12-13 June 2013 was dominated by straight-line wind damage as implied by the name derecho coined by Hinrichs (1888) who used the Spanish term “derecho” to distinguish such events from tornadic events. Derechoes are a subset of mesoscale convective systems (MCS:Zisper 1982). The definition of derechoes evolved over the 20th Century (Howard et al. 1985; Johns and Hirt 1987;Johns et al 1990) such that a derecho is widespread convective windstorm with a concentrated area with winds over 50kts spanning at least 240 miles (400km). The National Weather Service definition further requires that the convective system last at least 6 hours. The two primary types of derechoes (Johns and Hirt 1987) include serial and progressive derechoes. A climatology of derechoes (Bentley and Mote 1998) showed the highest areas of derechoes was form the southern Plains into the Great Lakes and extending eastward with some derecho activity reaching the Mid-Atlantic region.
Two significant derechoes impacted the eastern United States including the 15 July 1995 and the 29 June 2013 derecho. The derecho of 15 July 1995 brought damaging winds across New York into southern New England. The 29 June 2012 (Grumm and Ross. 2012; NWS Sterling 2013) brought damaging winds and massive power outages from Indiana to the Washington-Baltimore metropolitan area.
MCS’s and derechoes often develop over or on the flanks of large mid-tropospheric ridges. Many derechoes are classic “ring-of-fire” events occurring in the ideal spot on the northern fringes of a massive mid-tropospheric anticyclone. Several other fast moving MCS’s classifying as derechoes or ridge-rollers have been identified (Galarneau and Bosart 2006; Galarneau et al. 2008). The massive derecho which impacted the Mid-West and Mid-Atlantic region on 29-30 June 2013 was a ridge-roller event (Grumm and Ross. 2012).
The key to forecasting MCSs and the subset of these systems, derechoes, is knowing the patterns and environments in which they form (Evans et al. 2001). These patterns can then be diagnosed and evaluated in numerical guidance to aid in anticipating the evolution of MCSs and derecho producing MCS’s. The advent of high resolution models and improved data assimilation is slowly making the stronger forced convective systems more predictable (Weisman et al 2013). The evolution of storm scale ensembles may improve forecasts of these systems over the next decade.

NWS State College Case Examples
This case study will document the derecho event of 13 June 2013. The focus is on the pattern and evolution of the system. The second area of convection which developed on 13 June and affected the Ohio Valley and Mid-Atlantic region is not covered here. Forecasts of the pattern from NCEP systems and regional scale models are presented.
2. Data and Methods Satellite and radar data were obtained using AWIPS. All data shown were produced from
AWIPS. Storm reports were taken locally and the Storm Prediction Center plots are displayed
herein. The definition of a derecho was met here but this term and MCS are used interchangeably understanding that a derecho is subset of an MCS.
The large scale pattern was reconstructed using the, GFS, RAP, and Climate Forecast System V2 data displayed in GrADS (Doty and Kinter 1995). Employing the methods of Hart and Grumm (2001) standardize anomalies were computed to see if any of the fields associated with MCS’s departed significantly from normal.
3. The Pattern
The 500 hPa pattern (Fig. 3) over the United States showed a ridge off the East Coast on 9 June and the gradual evolution of strong ridge over the south-central United States from 11-14 June 2013 (Figs. 3c-f). A cut-off low off the California coast (Fig. 3a-b) moved over the western flanks of the evolving ridge; and southern Plains heat episode. This short-wave came over the ridge was clearly visible at 13/0000 UTC (Fig. 3e) though it likely interacted with a northern stream wave visible to the northeast. These two features produced a deep trough over the northeastern United States by 14/0000 UTC (Fig. 3f). A regional perspective in 6-hour increments showed the evolution of the short-waves from 12/1800 through 14/0000 UTC (Fig. 4). These data show that the MCS developed in strong northwesterly flow and the northern derecho which affected southern Minnesota southeastward into Pennsylvania was associated with a well-defined 500 hPa short-wave in this northwesterly flow.
In addition to the strong wave at 500 hPa, an unseasonably strong surface cyclone was associated with the convective evolution (Fig. 5); there was a strong southwesterly jet at 850 hPa (Fig. 6) in the warm sector of the evolving cyclone; and there was a surge of high precipitable water (PW:Fig 7) air with the system. Interestingly the PW anomalies were on the order of +1σ to at times +2σ above normal.
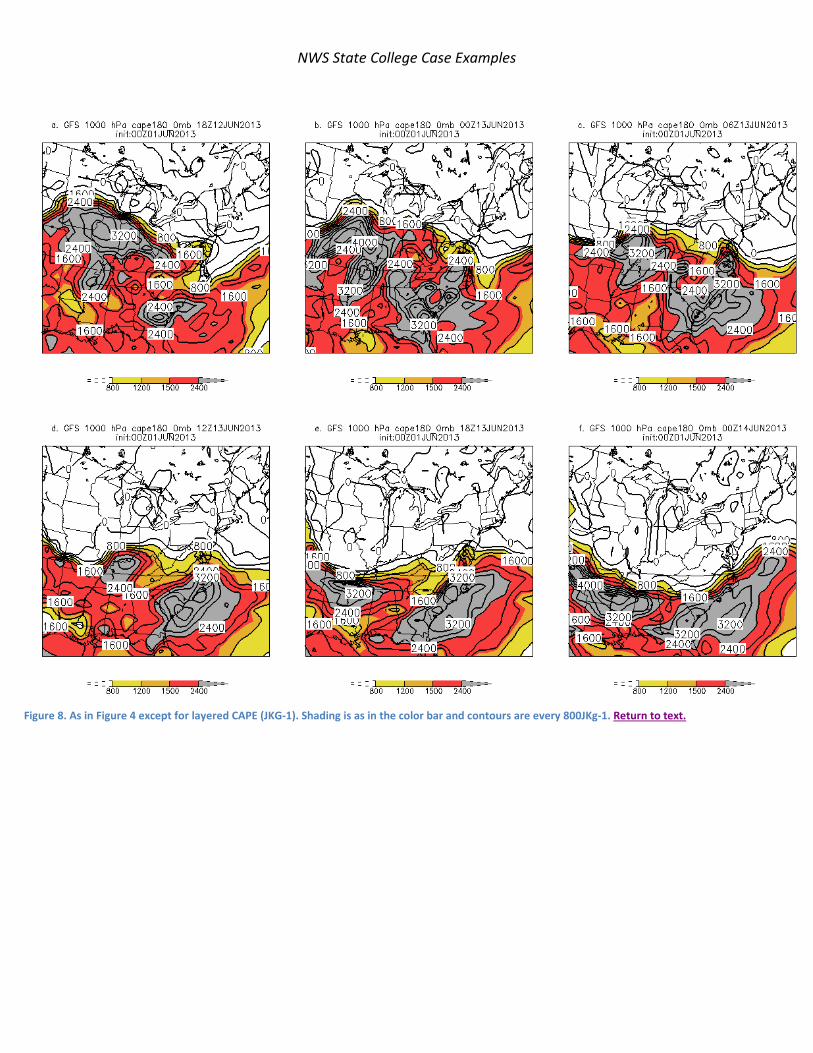
The GFS initialized extremely high CAPE (Fig. 8a) over the Mid-West where the MCS developed during the afternoon hours of 12 June 2013. As the system moved across Pennsylvania, the analyzed CAPE between 13/0600 and 13/1200 UTC was relatively low. Clearly, the high CAPE environment was present during 13 June (Figs. 8d-e) supporting the active and widespread convection in that region.

NWS State College Case Examples
Surface based CAPE from the 13km RAP (not shown) also showed limited CAPE in Pennsylvania during the peak convective time between 13/0500 and 13/1000 UTC. The RAP did analyze strong low-level with 850 hPa u-wind (Fig. 9) anomalies behind the implied convection (Fig. 10) winds were over 40kts and the 850 hPa jet core had +4 to +5s above normal wind anomalies, a strongly forced system.
4. Observations
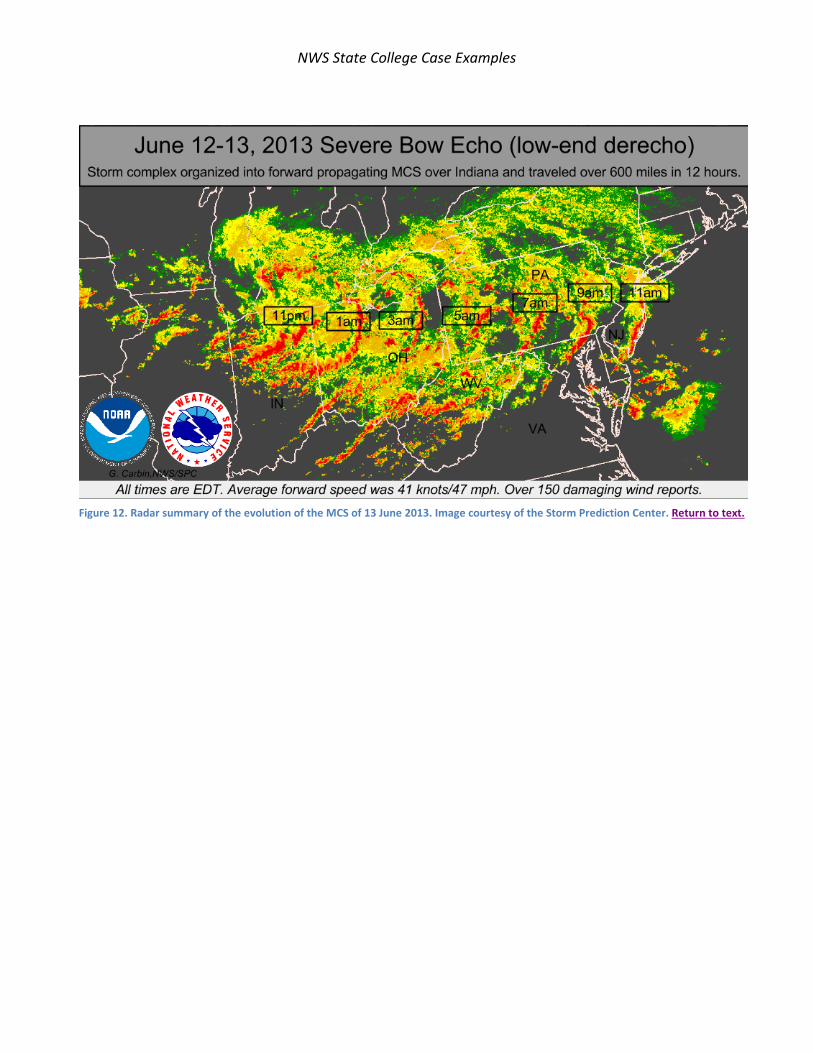
The infrared (IR) satellite and lightning data (Fig. 1) showed snap shots of the cold cloud shield associated with the MCS at 13/0115 and 13/0915. These data and loops of satellite data showed some areas of convection developed ahead of the main MCS and the core of the coldest cloud tops was with the derecho. The system had an extremely linear lightning pattern near the coldest cloud tops as it raced across Ohio from 13/0615 and 13/0715 UTC (Fig. 11) and into western Pennsylvania by 13/0815 UTC. The total time in the images shows that this system met the 6 hour duration litmus test for a derecho. By 13/1115 (Fig. 11) lightning was diminishing as the MCS was weakening over southeastern Pennsylvania, though another MCS had clearly developed on the southwestern flank of the derecho producing MCS over West Virginia.
The radar evolution of the “low-end” showing the systems evolution (Fig. 12) shows that the system was off the East Coast by 13/1500 UTC.
Radar evolutions show the system as it crossed central Pennsylvania (Fig. 13). At 13/0919 UTC the system had enhanced echoes over southwestern Pennsylvania with strong in-bound winds behind the enhanced cells. Like many QLCS the winds showed better indications of the organization of the system than the reflectivity data. The system moved through State College and after it passed out bounds behind the line were evident at 1037 UTC.
There was a concentrated region of wind damage from State College southward into Huntingdon County, Pennsylvania. An area near Warriors Mark along Dungarvin (see A :Fig. 14 and Fig. 15) road had an approximate 4 mile area of extensive tree damages and downed wires1. The zoomed in radar data showed a bowing segment with strong out bound winds moving through State College. A similar feature had moved through Warriors Mark (see A Fig. 14) around 13/1009 UTC (not shown) producing a concentrated area of wind damage (Fig. 15). The bowing features created focused areas of damage in central Pennsylvania near both Warriors Mark and in State College.
5. Forecasts The overall pattern the potential for both convection and rainfall were relatively well predicted by the NCEP guidance systems to include the GEFS, GFS, NAM, and SREF. Other centers models also performed well with the pattern. The quantitative precipitation forecasts (QPFs) from 6 NAM and GFS cycles leading up to the event are shown in Figures 16 & 17 respectively.
1 Serendipitous bike ride by the author on the morning of 13 June found the damage swath.

NWS State College Case Examples
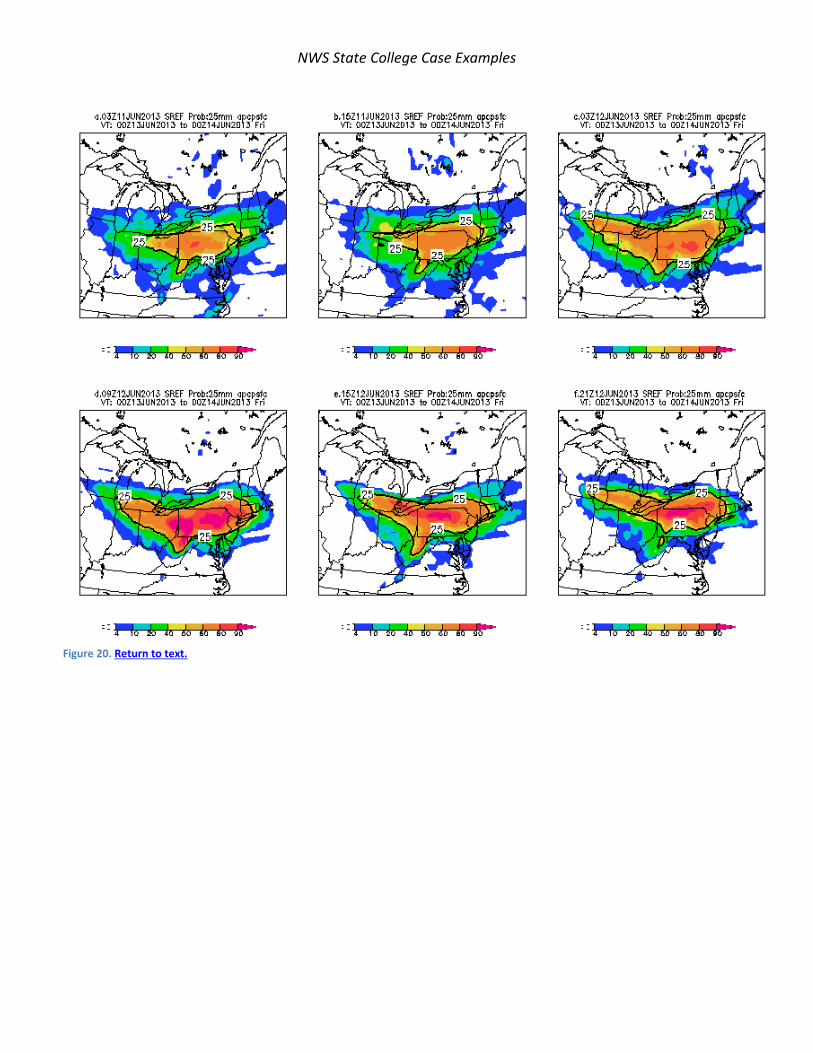
Both the NAM and GFS QPFs showed a “clipper-like” low precipitation pattern expanding to the east. The NAM field (Fig. 16) was smoother and had close 75 and at times 100 mm (Fig. 16b) contours for the 24 hour period. The NAM from 12/0600 UTC (Fig. 16d) had a wide area of 75mm or more QPF over northern Pennsylvania with smaller 75mm contours forecast in the 12/1200 UTC cycle (Fig. 16a). The GFS forecasts showed a wave like pattern in the QPF field particularly the forecasts issued at 11/0000 UTC (Fig. 17a). The similar to the NAM, the GFS had high QPF values north of the low track in the easterly flow associated with the cyclone, though it did show some convective rainfall tracking with an implied MCS. In the eastern United States, most of these QPFs grossly over forecast rainfall. From a probabilistic perspective 3 SREF thresholds of QPF are shown in Figure 18-20. It should be noted that Flash Flood Guidance (FFG) over Pennsylvania ranged from near 25 to about 80 mm depending on location. The probability of over 75mm of QPF (Fig. 18) was relatively low over Pennsylvania. Rarely did 2 or more members predict in excess of 75 mm of QPF. The probability of 50 mm (Fig. 19) was higher ranging from 40 to 60% at times. The SREF grossly over predicted the rainfall north of the surface cyclone. In Pennsylvania much of the region where the probability of 50mm exceeded 40% the FFG was over 75mm. Finally, the probability of 25mm of QPF (Fig. 20) showed that this was the higher and more likely outcome. Similar forecasts for the GEFS resulted in rainfall probabilities similar too the SREF with rainfall amounts in 24 hours in excess of 50mm being a low probability outcome. 6. Summary
Work in progress.
Derecho producing MCS’s often occur on the periphery of large ridges during the warm season. The derecho of 13 June 2013 formed on the periphery of a ridge which may qualify it as a “ridge roller” (Galarneau and Bosart 2006). This event and had the additional impact of a strong and well defined mid-tropospheric short-wave (Fig. 4) and an attendant deep surface cyclone. Many events often lack this strong signal in the larger scale forcing.
The NAM, GFSF, and SREF grossly over predicted the rainfall north of the surface cyclone. All three systems over predicted the overall QPF and the actually period of heavy rainfall. Over central Pennsylvania nearly 90% of the rainfall occurred in less than 3 hours. Despite over predicting the total QPF Not one of these systems produced such rapid rainfall rates.
7. References

NWS State College Case Examples
Bentley, M. L., and T. L. Mote, 1998: A climatology of derecho-producing mesoscale convective systems in the central and eastern United States 1986-95. Part I: Temporal and spatial distribution. Bull. Amer. Meteor. Soc., 79, 2527-2540.
Bosart, L. F., W. E. Bracken, A. Seimon, J. W. Cannon, K. D. LaPenta, and J. S. Quinlan, 1998: Large-scale conditions associated with the northwesterly flow intense derecho events of 14-15 July 1995 in the northeastern United States. Preprints, 19th Conf. on Severe Local Storms, Minneapolis, MN, Amer. Meteor. Soc., 503-506.
Coniglio, M. C., D. J. Stensrud, and M. B. Richman, 2004: An observational study of derecho-producing convective systems. Wea. Forecasting, 19, 320-337.
Coniglio, M.C., and D. J. Stensrud, 2004: Interpreting the climatology of derechos.
Weather Forecasting, 19, 595-605.
Craven, J. P., and H. E. Brooks, 2004: Baseline climatology of sounding-derived parameters associated with deep moist convection. Natl. Wea. Dig., 28, 13–24.
Doty, B.E. and J.L. Kinter III, 1995: Geophysical Data Analysis and Visualization using GrADS.
Visualization Techniques in Space and Atmospheric Sciences, eds. E.P. Szuszczewicz and J.H. Bredekamp, NASA, Washington, D.C., 209-219.
Evans, Jeffry S.; Doswell, Charles A. (2001). "Examination of Derecho Environments Using Proximity Soundings". Weather and Forecasting 16 (3): 329.
Galarneau, T. J., Jr., L. F. Bosart, and A. R. Aiyyer, 2008: Closed anticyclones of the subtropics and
middle latitudes: A 54-yr climatology (1950-2003) and three case studies. Synoptic-Dynamic Meteorology and Weather Analysis and Forecasting: A Tribute to Fred Sanders, Meteor. Monogr., No. 55, Amer. Meteor. Soc., 349-392. [Available at the AMS Online Store.]
Galarneau, T. J., and L. F. Bosart, 2006: Ridge Rollers: Mesoscale Disturbances on the Periphery of
Cutoff Anticyclones. Preprints, Severe Local Storms Special Symposium, Atlanta, GA, Amer. Meteor. Soc. 7pp.
Grumm, RH, and C Ross: 2012: Chesapeake and Ohio Express: The Derecho of 29-30 June 2012. On line article.
Hinrichs, G., 1888: Tornadoes and derechos. Amer. Meteor. J.,5, 341–349.

NWS State College Case Examples
Johns, Robert H.; Hirt, William D. (1987). "Derechos: Widespread Convectively Induced Windstorms". Weather and Forecasting 2: 32.
Schoen, J.M W. S. Ashley. 2011: A Climatology of Fatal Convective Wind Events by Storm Type.
Weather and Forecasting 26:1, 109-121. Online publication date: 1-Feb-2011. Abstract . Full Text . PDF (1569 KB)
Weisman, ML, C. Evans, and L Bosart: 2013: The 8 May 2009 Super-derecho: Analysis of real-time
explicit convective forecast. WAF,

NWS State College Case Examples
Figure 1. GOES IR and 1-minute lightning showing the MCS over northern Indiana at 0115 UTC 13 June and over western Pennsylvania at 0915 UTC 13 June 2013. Return to text.

NWS State College Case Examples
Figure 2. Storm reports from the Storm Prediction Center (SPC) color coded by type. Data valid through 1200 UTC 13 and 14 June 2013. Return to text.

NWS State College Case Examples
Figure 3. Return to text.

NWS State College Case Examples
Figure 4. As in Figure 3 except for 6-hour increments from a) 1800 UTC 12 June through f) 0000 UTC 14 June 2013. Return to text.

NWS State College Case Examples
Figure 5. As in Figure 4 except for mean sea-level pressure (hPa) and pressure anomalies. Return to text.

NWS State College Case Examples
Figure 6. As in Figure 4 except for 850 hPa winds and u-wind anomalies. Return to text.

NWS State College Case Examples
Figure 7. As in Figure 4 except for precipitable water (mm) and precipitable water anomalies. Return to text.
NWS State College Case Examples
Figure 8. As in Figure 4 except for layered CAPE (JKG-1). Shading is as in the color bar and contours are every 800JKg-1. Return to text.

NWS State College Case Examples
Figure 9. As in Figure 6 except for 13km RAP 850 hPa winds and u-wind anomalies. Return to text.

NWS State College Case Examples
Figure 10. As in Figure 9 except RAP synthetic reflectivity at each initialization time. Return to text.

NWS State College Case Examples
Figure 11. As in Figure 1 except for clockwise from top 0615, 0715, 0815, and 1115 UTC. Return to text.
NWS State College Case Examples
Figure 12. Radar summary of the evolution of the MCS of 13 June 2013. Image courtesy of the Storm Prediction Center. Return to text.

NWS State College Case Examples
Figure 13. KCCX radar at 0.5 degrees showing reflectivity on left side and corresponding base velocity on the right side. Times are 0915 UTC, 1037 UTC, and 1134 UTC. Return to text.

NWS State College Case Examples
A
Figure 14. As in Figure 13 except zoomed in view at 1014 and 1023 UTC showing the mini-bow echo feature which moved across State College . The A in the upper velocity pattern is the point of extensive damage referred to in the text. Out bound winds were 50-58kts behind the bowing segment outlined. Return to text.

NWS State College Case Examples
Figure 15. Area of tree and wire damage from the intersection of Dry Hollow and Dungarvin road to “Frogtown”. Limbs and branches littered large stretches of Dungarvin road and numerous trees were down in the woods and properties along the road. Power crews were fixing poles and wires near points A and B. These points are displaced off the roads as not obscure the map data. Limbs and branches were down sporadically along all of Dry Hollow road to the north of the main damage swath shown here. Return to text.
A B

NWS State College Case Examples
Figure 16. Return to text.

NWS State College Case Examples
Figure 17. Return to text.

NWS State College Case Examples
Figure 18. Return to text.

NWS State College Case Examples
Figure 19. Return to text.
NWS State College Case Examples
Figure 20. Return to text.

NWS State College Case Examples