NWF Group plc Final results to May 2021
35
NWF Group plc Final results to May 2021
Transcript of NWF Group plc Final results to May 2021
NWF Group plc Final results to May 2021
Group overview
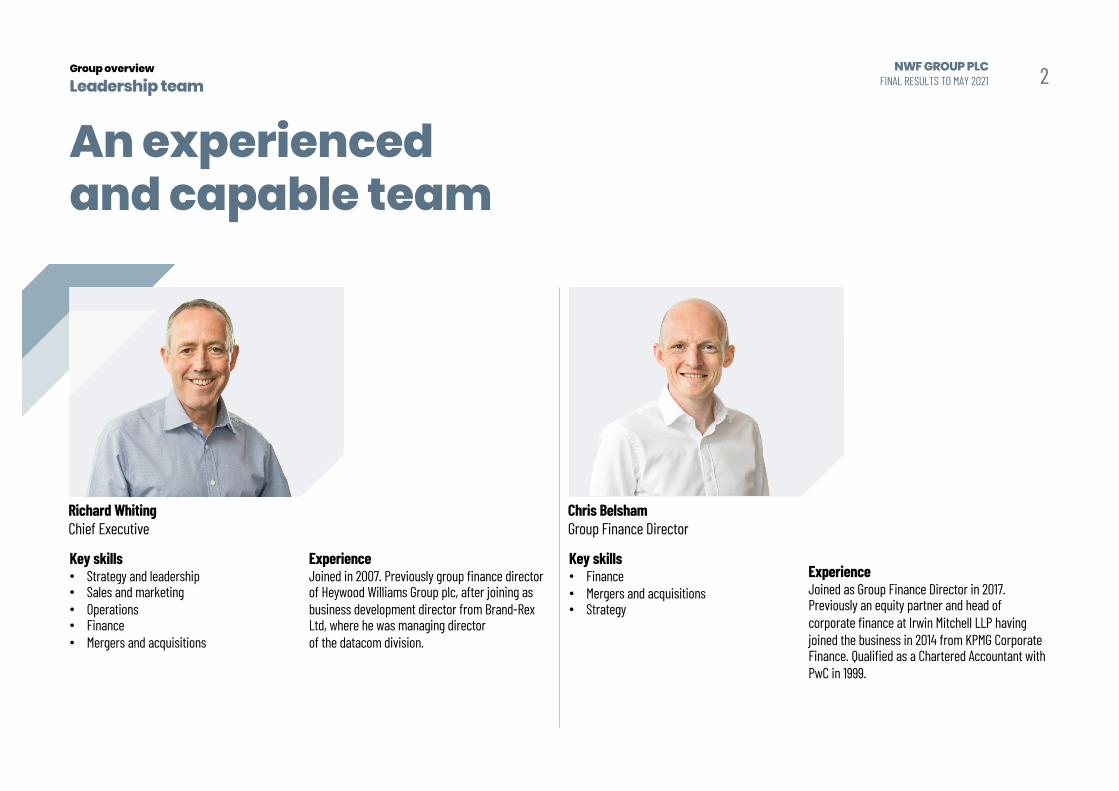
Leadership team 2NWF GROUP PLCFINAL RESULTS TO MAY 2021
Key skills • Strategy and leadership • Sales and marketing• Operations• Finance • Mergers and acquisitions
Experience Joined in 2007. Previously group finance director of Heywood Williams Group plc, after joining as business development director from Brand-Rex Ltd, where he was managing director of the datacom division.
Chris BelshamGroup Finance Director
Key skills • Finance• Mergers and acquisitions • Strategy
Experience Joined as Group Finance Director in 2017. Previously an equity partner and head of corporate finance at Irwin Mitchell LLP having joined the business in 2014 from KPMG Corporate Finance. Qualified as a Chartered Accountant with PwC in 1999.
An experienced and capable team
Richard WhitingChief Executive
Group overview
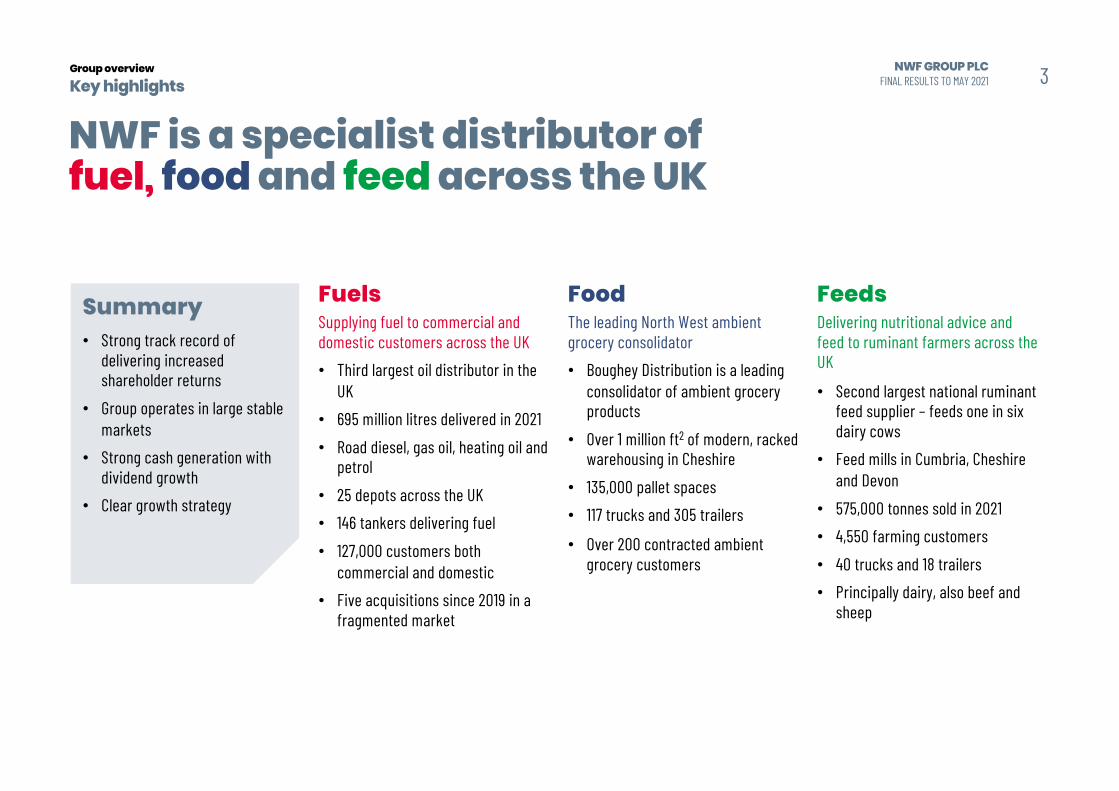
Key highlights
Summary• Strong track record of
delivering increased shareholder returns
• Group operates in large stable markets
• Strong cash generation with dividend growth
• Clear growth strategy
FuelsSupplying fuel to commercial and domestic customers across the UK
• Third largest oil distributor in the UK
• 695 million litres delivered in 2021
• Road diesel, gas oil, heating oil and petrol
• 25 depots across the UK
• 146 tankers delivering fuel
• 127,000 customers both commercial and domestic
• Five acquisitions since 2019 in a fragmented market
FoodThe leading North West ambient grocery consolidator
• Boughey Distribution is a leading consolidator of ambient grocery products
• Over 1 million ft2 of modern, racked warehousing in Cheshire
• 135,000 pallet spaces
• 117 trucks and 305 trailers
• Over 200 contracted ambient grocery customers
FeedsDelivering nutritional advice and feed to ruminant farmers across the UK
• Second largest national ruminant feed supplier – feeds one in six dairy cows
• Feed mills in Cumbria, Cheshire and Devon
• 575,000 tonnes sold in 2021
• 4,550 farming customers
• 40 trucks and 18 trailers
• Principally dairy, also beef and sheep
NWF is a specialist distributor of fuel, food and feed across the UK
3NWF GROUP PLCFINAL RESULTS TO MAY 2021
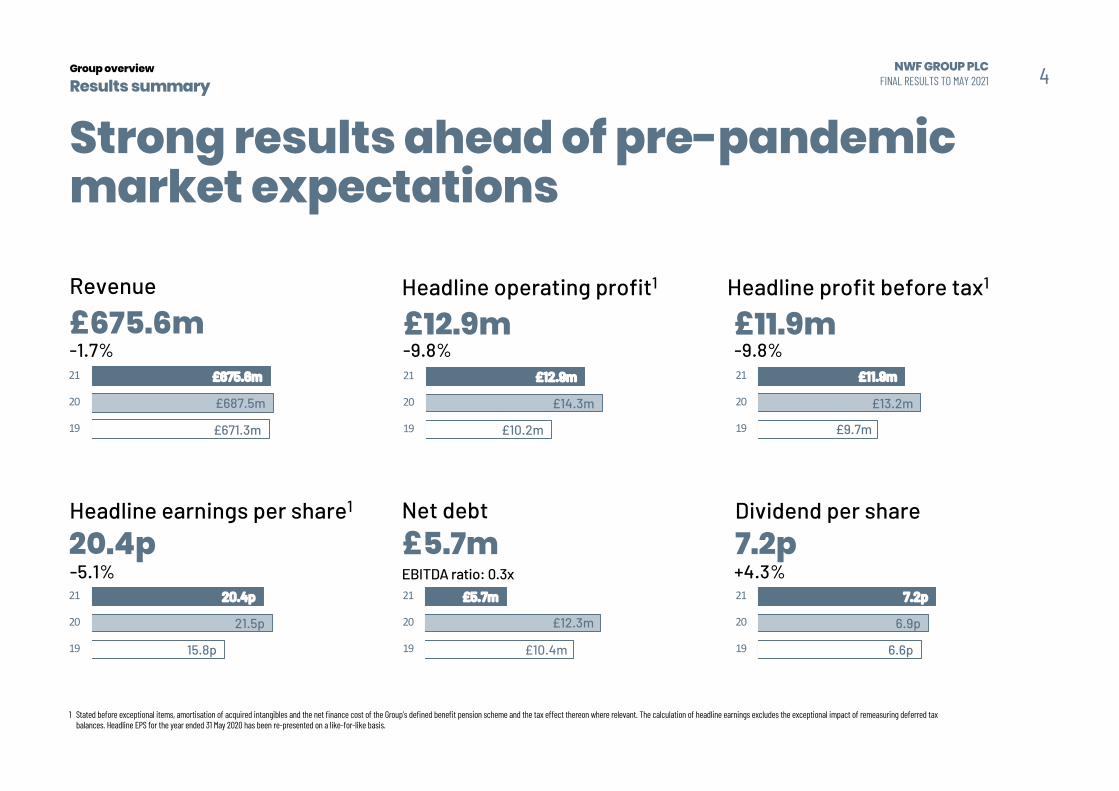
Group overview
Results summary
Revenue
£675.6m
£671.3m
£687.5m
£675.6m
19
20
21
-1.7%
Headline operating profit1
£12.9m
£10.2m
£14.3m
£12.9m
19
20
21
-9.8%
Headline profit before tax1
£11.9m
£9.7m
£13.2m
£11.9m
19
20
21
-9.8%
Headline earnings per share1
20.4p
15.8p
21.5p
20.4p
19
20
21
-5.1%
Net debt
£5.7m
£10.4m
£12.3m
£5.7m
19
20
21
Dividend per share
7.2p
6.6p
6.9p
7.2p
19
20
21
+4.3%
1 Stated before exceptional items, amortisation of acquired intangibles and the net finance cost of the Group’s defined benefit pension scheme and the tax effect thereon where relevant. The calculation of headline earnings excludes the exceptional impact of remeasuring deferred tax balances. Headline EPS for the year ended 31 May 2020 has been re-presented on a like-for-like basis.
Strong results ahead of pre-pandemic market expectations
4
EBITDA ratio: 0.3x
NWF GROUP PLCFINAL RESULTS TO MAY 2021
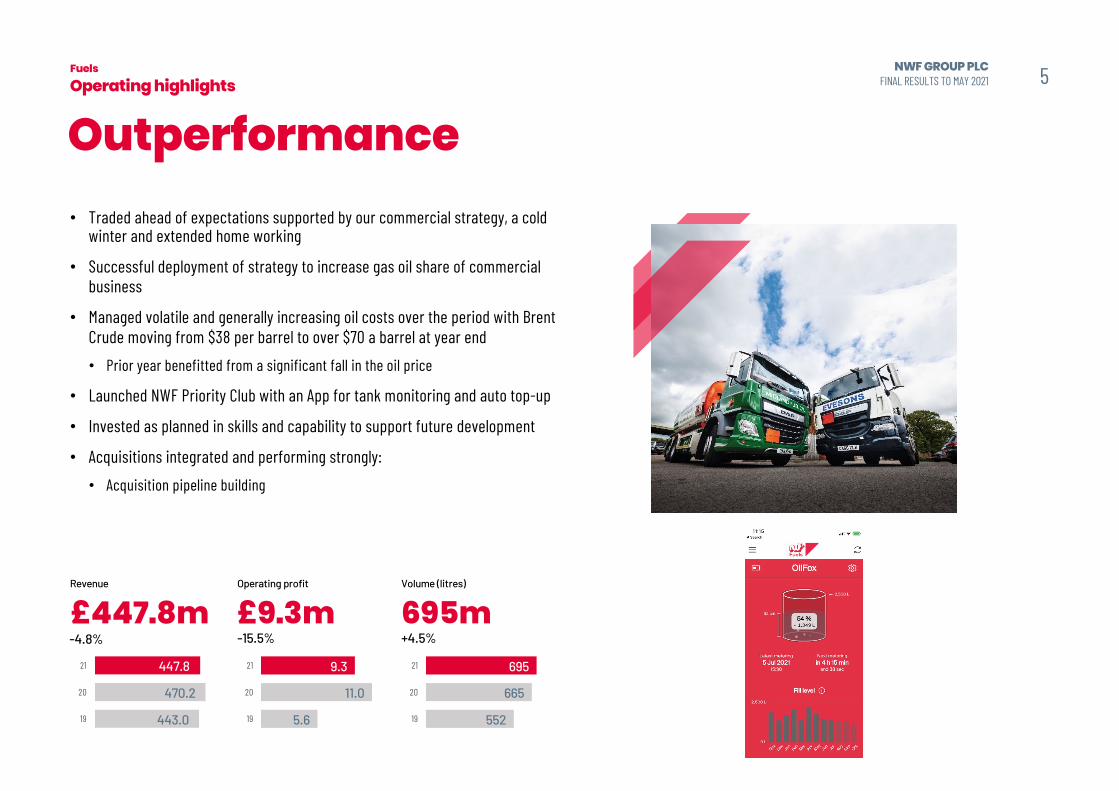
Fuels
Operating highlights
Outperformance
Revenue
£447.8m
443.0
470.2
447.8
19
20
21
-4.8%
Operating profit
£9.3m-15.5%
Volume (litres)
695m+4.5%
5.6
11.0
9.3
19
20
21
552
665
695
19
20
21
5NWF GROUP PLCFINAL RESULTS TO MAY 2021
• Traded ahead of expectations supported by our commercial strategy, a cold winter and extended home working
• Successful deployment of strategy to increase gas oil share of commercial business
• Managed volatile and generally increasing oil costs over the period with Brent Crude moving from $38 per barrel to over $70 a barrel at year end
• Prior year benefitted from a significant fall in the oil price
• Launched NWF Priority Club with an App for tank monitoring and auto top-up
• Invested as planned in skills and capability to support future development
• Acquisitions integrated and performing strongly:
• Acquisition pipeline building
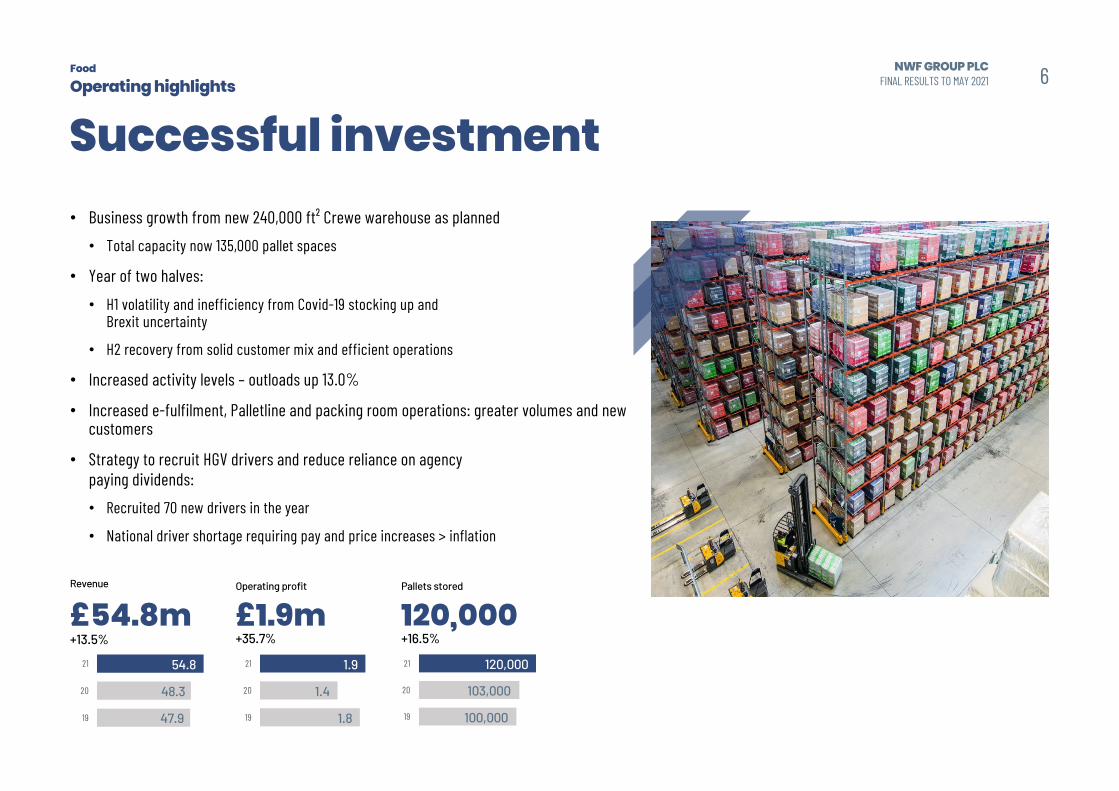
Food
Operating highlights
Successful investment• Business growth from new 240,000 ft² Crewe warehouse as planned
• Total capacity now 135,000 pallet spaces
• Year of two halves:
• H1 volatility and inefficiency from Covid-19 stocking up and Brexit uncertainty
• H2 recovery from solid customer mix and efficient operations
• Increased activity levels – outloads up 13.0%
• Increased e-fulfilment, Palletline and packing room operations: greater volumes and new customers
• Strategy to recruit HGV drivers and reduce reliance on agency paying dividends:
• Recruited 70 new drivers in the year
• National driver shortage requiring pay and price increases > inflation
Revenue
£54.8m
47.9
48.3
54.8
19
20
21
+13.5%
Operating profit
£1.9m+35.7%
Pallets stored
120,000+16.5%
6NWF GROUP PLCFINAL RESULTS TO MAY 2021
1.8
1.4
1.9
19
20
21
100,000
103,000
120,000
19
20
21
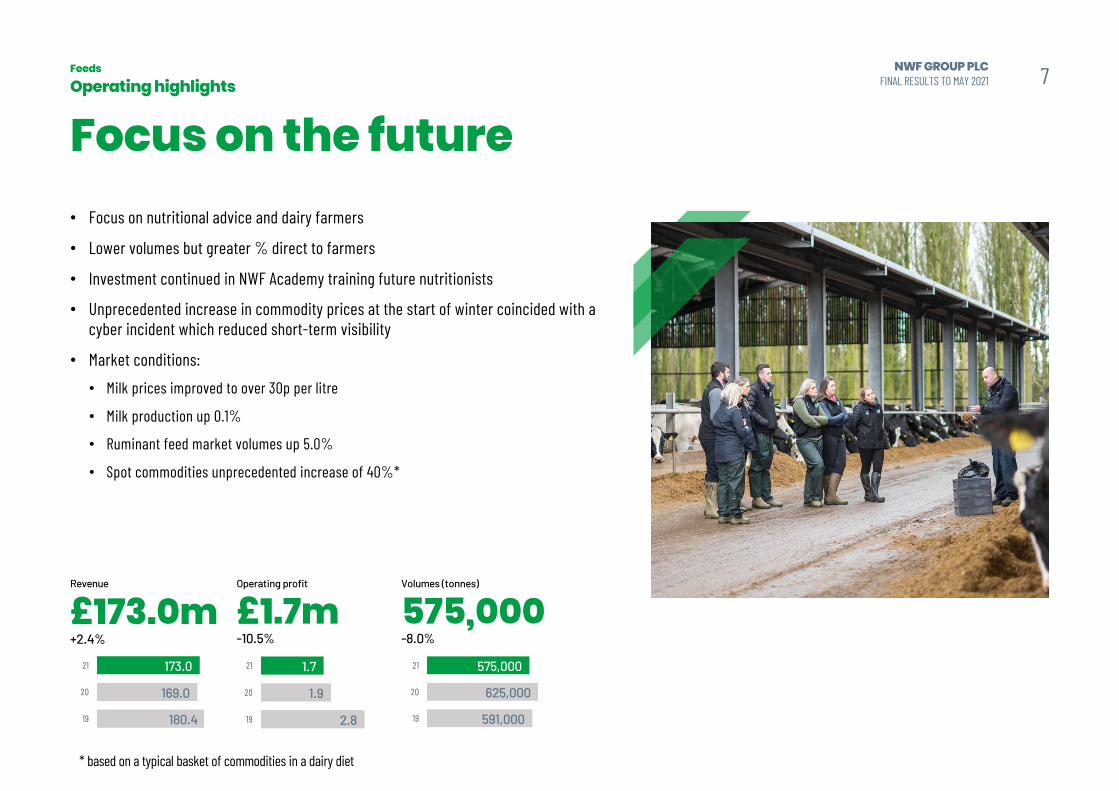
Feeds
Focus on the future• Focus on nutritional advice and dairy farmers
• Lower volumes but greater % direct to farmers
• Investment continued in NWF Academy training future nutritionists
• Unprecedented increase in commodity prices at the start of winter coincided with a cyber incident which reduced short-term visibility
• Market conditions:
• Milk prices improved to over 30p per litre
• Milk production up 0.1%
• Ruminant feed market volumes up 5.0%
• Spot commodities unprecedented increase of 40%*
Operating highlights
Revenue
£173.0m
180.4
169.0
173.0
19
20
21
+2.4%
Operating profit
£1.7m-10.5%
Volumes (tonnes)
575,000-8.0%
7NWF GROUP PLCFINAL RESULTS TO MAY 2021
2.8
1.9
1.7
19
20
21
591,000
625,000
575,000
19
20
21
* based on a typical basket of commodities in a dairy diet
Financial review
Group overview
Financial reviewIncome statement summary
• Revenue decreased by £11.9 million (1.7%):• £32.0 million lower average oil price in Fuels
• £9.2 million higher average commodity costs in Feeds
• £4.9 million from higher activity levels
• £6.0 million from increased sales price and product mix benefit
• Headline operating profit of £12.9 million
• Exceptional items:• Cyber incident costs net of insurance recoveries (£0.3
million)
• Acquisition-related costs (£0.2 million)
• Fuel volumes increased by 4.5%• Pence per litre profit significantly above normal target
of 1.0 pence per litre
May 2021£m
May 2020£m
Revenue
Fuels 447.8 470.2
Food 54.8 48.3
Feeds 173.0 169.0
Total revenue 675.6 687.5
Operating profit
Fuels 9.3 11.0
Food 1.9 1.4
Feeds 1.7 1.9
Headline operating profit* 12.9 14.3
Exceptional items (0.5) (0.5)
Amortisation of acquired intangibles (0.3) (0.3)
Operating profit 12.1 13.5
* Stated before exceptional items and the net finance cost of the Group’s defined benefit pension scheme
Fuels 2015 2016 2017 2018 2019 2020 2021
Litres (million) 420 474 513 543 552 665 695
Profit (pence per litre) 1.0p 0.8p 0.9p 1.3p 1.0p 1.6p 1.4p
Litres per depot (m) 24.7 24.9 27.0 28.6 29.0 26.6 27.8
Revenue per litre £0.74 £0.62 £0.70 £0.74 £0.80 £0.71 £0.64
9NWF GROUP PLCFINAL RESULTS TO MAY 2021
Group overview
Financial reviewIncome statement summary
• Headline PBT of £11.9 million• Bank interest reduced to £0.5 million
• IFRS 16 interest of £0.5 million (2020:£0.4 million) reflecting full year of Crewe warehouse lease
• Pension scheme interest reduced by £0.1 million due to a lower pension scheme deficit across the year
• Effective tax rate of 28.3% (2020: 26.8%) as a result of one-off deferred tax charge of £1.3 million arising from increase in future CT rate to 25%. Underlying tax rate was 19.4% (2020: 20.8%)
• Full year proposed dividend increased by 4.3% to 7.2p
May 2021£m
May 2020£m
Operating profit 12.1 13.5
Finance costs (1.3) (1.5)
Headline profit before tax* 11.9 13.2
Exceptional items (0.5) (0.5)
Amortisation of acquired intangibles (0.3) (0.3)
Net finance costs – DB scheme (0.3) (0.4)
Profit before tax 10.8 12.0
Tax (3.0) (3.1)
Profit after tax 7.8 8.9
Diluted headline EPS (pence)* 20.4 21.3
DPS (pence) 7.2 6.9
Dividend cover 2.8 2.9
Interest cover (excluding pension finance) 25.8 20.4
* Stated before exceptional items and the net finance cost of the Group’s defined benefit pension scheme. The calculation of headline earnings excludes the exceptional impact of remeasuring deferred tax balances. Headline EPS for the year ended 31 May 2020 has been re-presented on a like-for-like basis. Diluted headline EPS also takes into account the taxation effect thereon.
10NWF GROUP PLCFINAL RESULTS TO MAY 2021
Group overview
Financial reviewBalance sheet summary
• Fixed assets decreased slightly as depreciation exceeded capex
• Lower net working capital due to some short-term timing benefits on supplier payments at the year end
• Net debt decreased by £6.6 million, reflecting the strong trading, working capital inflow and lower capex
• Strong asset underpin – total assets of £186.9 million
• Group ROCE of 15.8%
May 2021£m
May 2020£m
Fixed assets 78.2 79.9
Right of use assets 25.4 27.3
Net working capital 3.5 4.8
Derivative financial instruments 0.1 0.1
Assets employed 107.2 112.1
Pension deficit (14.9) (21.0)
Net debt (5.7) (12.3)
Tax provisions (1.5) (1.4)
Lease liabilities (25.6) (26.3)
Net assets 59.5 51.1
Net debt : EBITDA 0.3 0.7
Total assets 186.9 174.0
ROCE:
Fuels 54.4% 52.9%
Food 6.7% 4.8%
Feeds 4.7% 5.3%
Total ROCE 15.8% 16.7%
11NWF GROUP PLCFINAL RESULTS TO MAY 2021
Group overview
Financial reviewPension summary
• Single defined benefit pension scheme• Closed to new members in 2002 and future accrual in 2016
• Decrease in deficit since May 2020 – contributions and asset gains• Triennial valuation as at 31 December 2019:• Recovery plan contributions of £1.8 million until May 2022,
£2.1 million thereafter
• Recovery payments to increase in line with dividend growth* from January 2022
• No constraint on Group development
May 2021£m
May 2020£m
Assets 45.1 40.1
Liabilities (60.0) (61.1)
Deficit (14.9) (21.0)
Related deferred tax asset 3.7 4.0
Net pension liability (11.2) (17.0)
Discount rate 2.00% 1.65%
Inflation rate (RPI) 3.30% 2.65%
12NWF GROUP PLCFINAL RESULTS TO MAY 2021
21.0 (2.8)0.6 (3.9)
(0.1) 0.1 14.9
-
5.0
10.0
15.0
20.0
25.0
31 May 2020
Company contrib
utions
Scheme expenses/fin
ance costs
Gain on assets
Change in liability as
sumptions
Current se
rvice co
st
31 May 2021
£m
* Dividend growth will be measured as the growth above and beyond the dividend in FY19
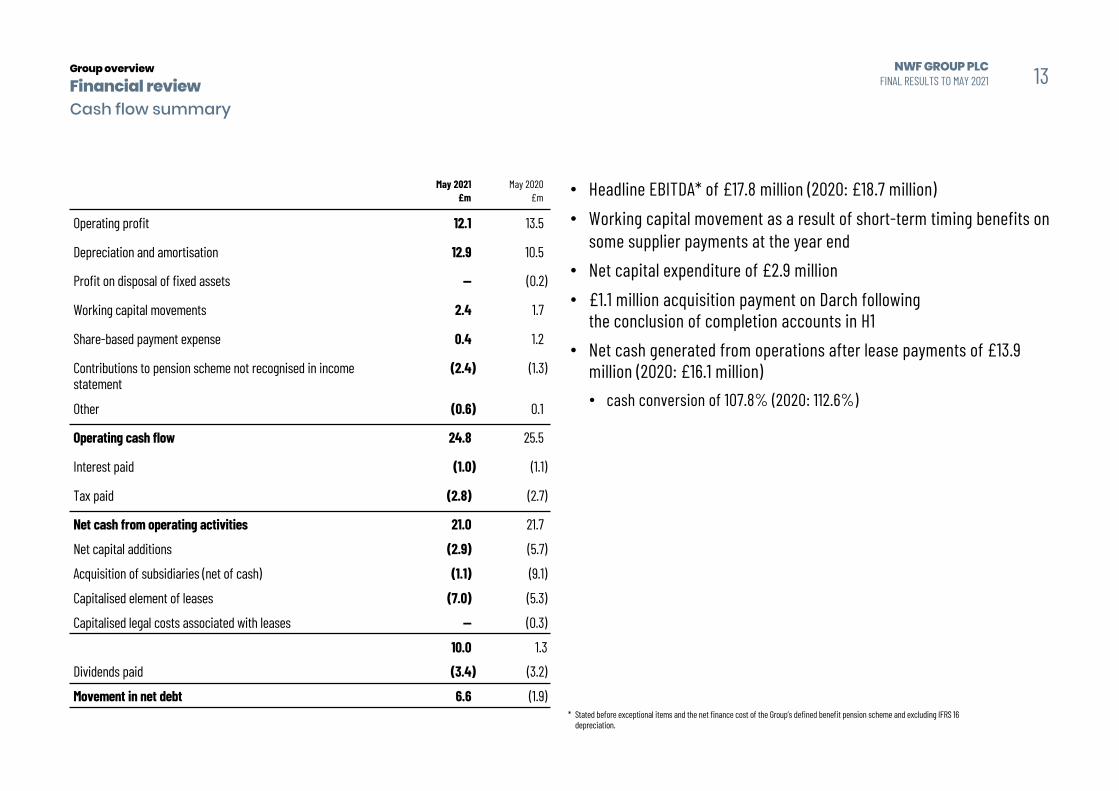
Group overview
Financial reviewCash flow summary
• Headline EBITDA* of £17.8 million (2020: £18.7 million)• Working capital movement as a result of short-term timing benefits on
some supplier payments at the year end• Net capital expenditure of £2.9 million• £1.1 million acquisition payment on Darch following
the conclusion of completion accounts in H1• Net cash generated from operations after lease payments of £13.9
million (2020: £16.1 million) • cash conversion of 107.8% (2020: 112.6%)
May 2021£m
May 2020£m
Operating profit 12.1 13.5
Depreciation and amortisation 12.9 10.5
Profit on disposal of fixed assets — (0.2)
Working capital movements 2.4 1.7
Share-based payment expense 0.4 1.2
Contributions to pension scheme not recognised in income statement
(2.4) (1.3)
Other (0.6) 0.1
Operating cash flow 24.8 25.5
Interest paid (1.0) (1.1)
Tax paid (2.8) (2.7)
Net cash from operating activities 21.0 21.7
Net capital additions (2.9) (5.7)
Acquisition of subsidiaries (net of cash) (1.1) (9.1)
Capitalised element of leases (7.0) (5.3)
Capitalised legal costs associated with leases — (0.3)
10.0 1.3
Dividends paid (3.4) (3.2)
Movement in net debt 6.6 (1.9)* Stated before exceptional items and the net finance cost of the Group’s defined benefit pension scheme and excluding IFRS 16
depreciation.
13NWF GROUP PLCFINAL RESULTS TO MAY 2021
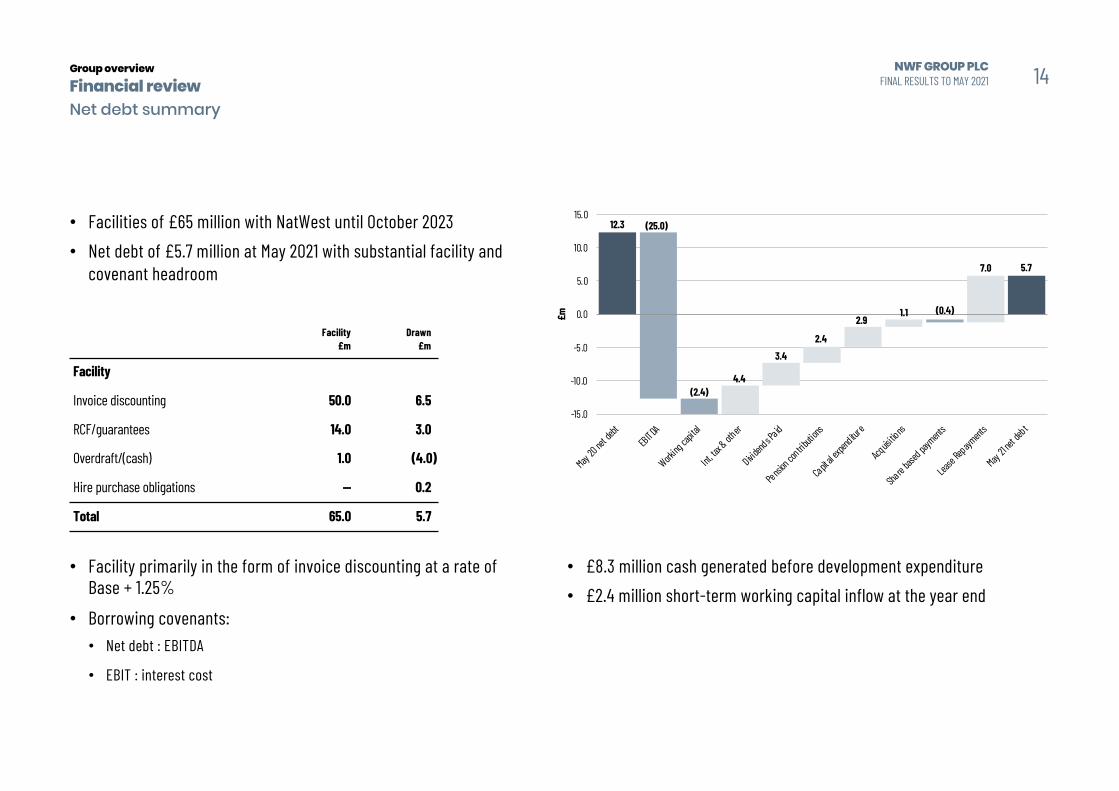
Group overview
Financial reviewNet debt summary
• Facilities of £65 million with NatWest until October 2023• Net debt of £5.7 million at May 2021 with substantial facility and
covenant headroom
• Facility primarily in the form of invoice discounting at a rate of Base + 1.25%
• Borrowing covenants:• Net debt : EBITDA
• EBIT : interest cost
Facility£m
Drawn£m
Facility
Invoice discounting 50.0 6.5
RCF/guarantees 14.0 3.0
Overdraft/(cash) 1.0 (4.0)
Hire purchase obligations — 0.2
Total 65.0 5.7
• £8.3 million cash generated before development expenditure• £2.4 million short-term working capital inflow at the year end
14NWF GROUP PLCFINAL RESULTS TO MAY 2021
1.1
7.0
12.3 (25.0)
(2.4)4.4
3.42.4
2.9(0.4)
5.7
-15 .0
-10.0
-5 .0
0.0
5.0
10.0
15.0
May 20
net de
btEBITDA
Working
capita
l
Int, tax
& other
Dividend
s Paid
Pension con
tributio
ns
Capit al ex
penditur
e
Acquisi
tions
Share b
ased p
ayment
s
Lease
Repaym
ents
May 21 n
et debt
£m
Group overview
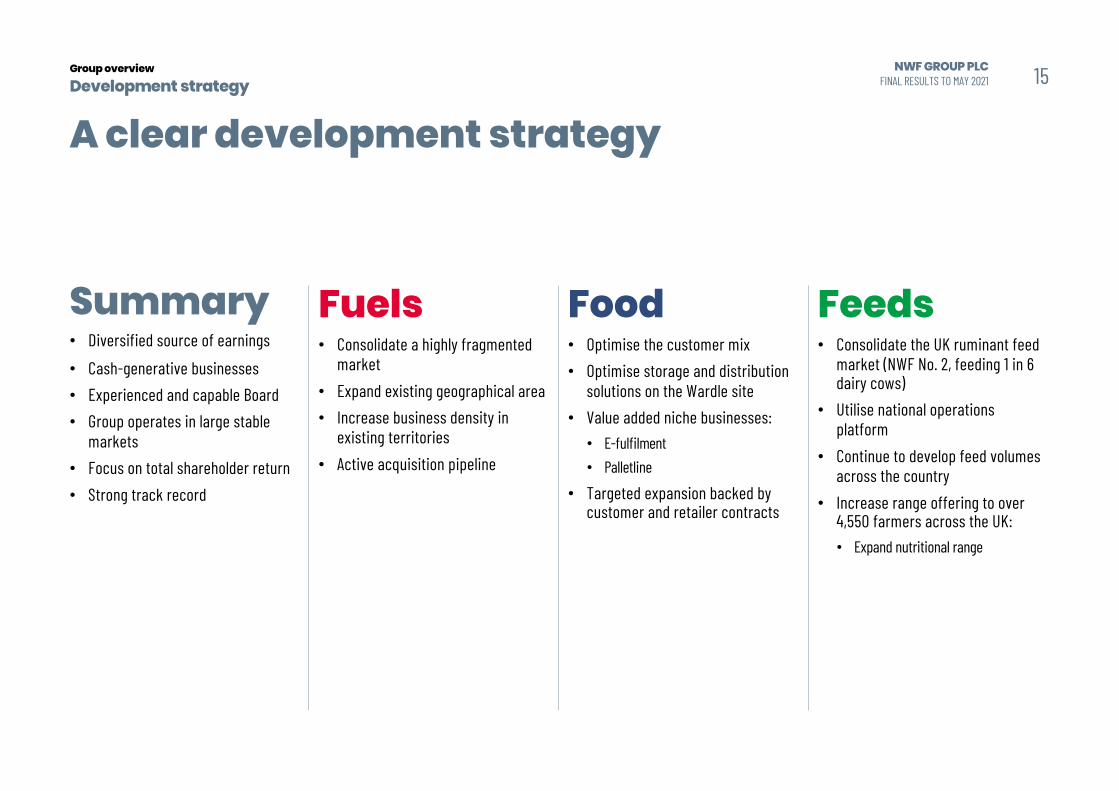
Development strategy
A clear development strategy
Fuels• Consolidate a highly fragmented
market• Expand existing geographical area• Increase business density in
existing territories• Active acquisition pipeline
Food• Optimise the customer mix• Optimise storage and distribution
solutions on the Wardle site• Value added niche businesses:• E-fulfilment• Palletline
• Targeted expansion backed by customer and retailer contracts
Feeds• Consolidate the UK ruminant feed
market (NWF No. 2, feeding 1 in 6 dairy cows)
• Utilise national operations platform
• Continue to develop feed volumes across the country
• Increase range offering to over 4,550 farmers across the UK:• Expand nutritional range
15
Summary• Diversified source of earnings
• Cash-generative businesses• Experienced and capable Board• Group operates in large stable
markets• Focus on total shareholder return• Strong track record
NWF GROUP PLCFINAL RESULTS TO MAY 2021
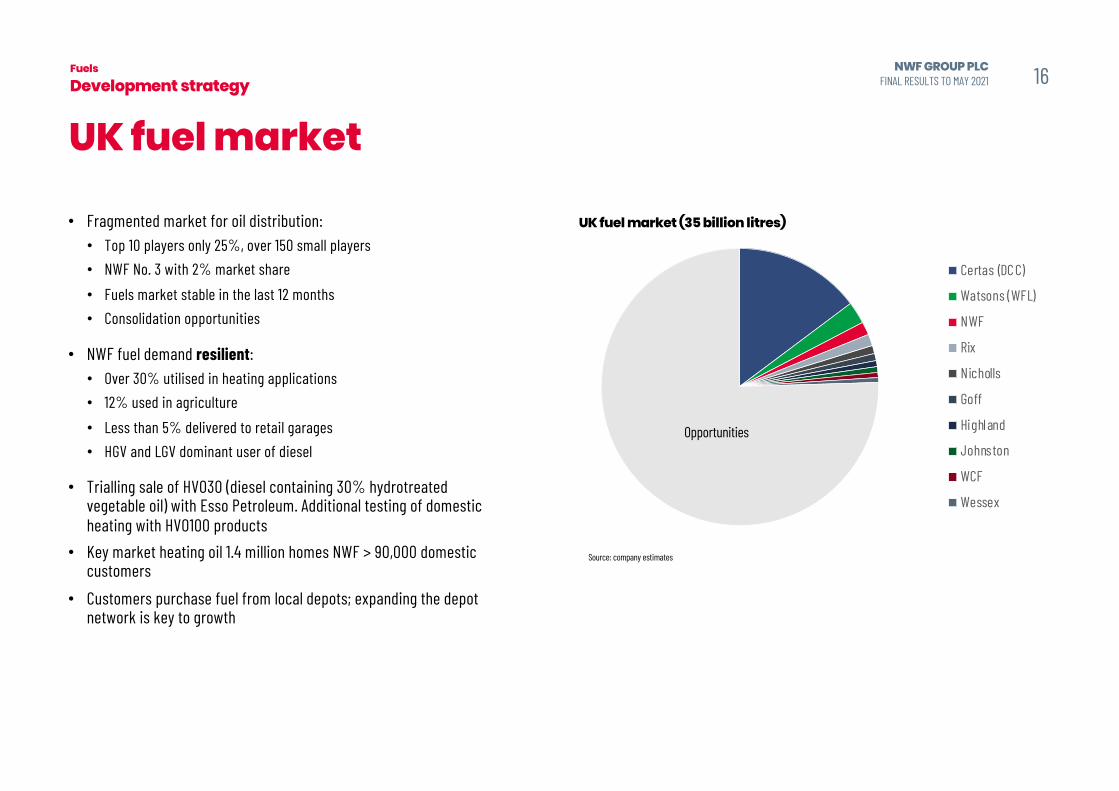
Fuels
Development strategy
• Fragmented market for oil distribution:• Top 10 players only 25%, over 150 small players• NWF No. 3 with 2% market share• Fuels market stable in the last 12 months• Consolidation opportunities
• NWF fuel demand resilient:• Over 30% utilised in heating applications• 12% used in agriculture• Less than 5% delivered to retail garages• HGV and LGV dominant user of diesel
• Trialling sale of HVO30 (diesel containing 30% hydrotreated vegetable oil) with Esso Petroleum. Additional testing of domestic heating with HVO100 products
• Key market heating oil 1.4 million homes NWF > 90,000 domestic customers
• Customers purchase fuel from local depots; expanding the depot network is key to growth
Source: company estimates
UK fuel market (35 billion litres)
Certas (DCC)
Watsons (WFL)
NWF
Rix
Nicholls
Goff
Highland
Johnston
WCF
Wessex
16
UK fuel market
NWF GROUP PLCFINAL RESULTS TO MAY 2021
Opportunities
Fuels
Development strategy
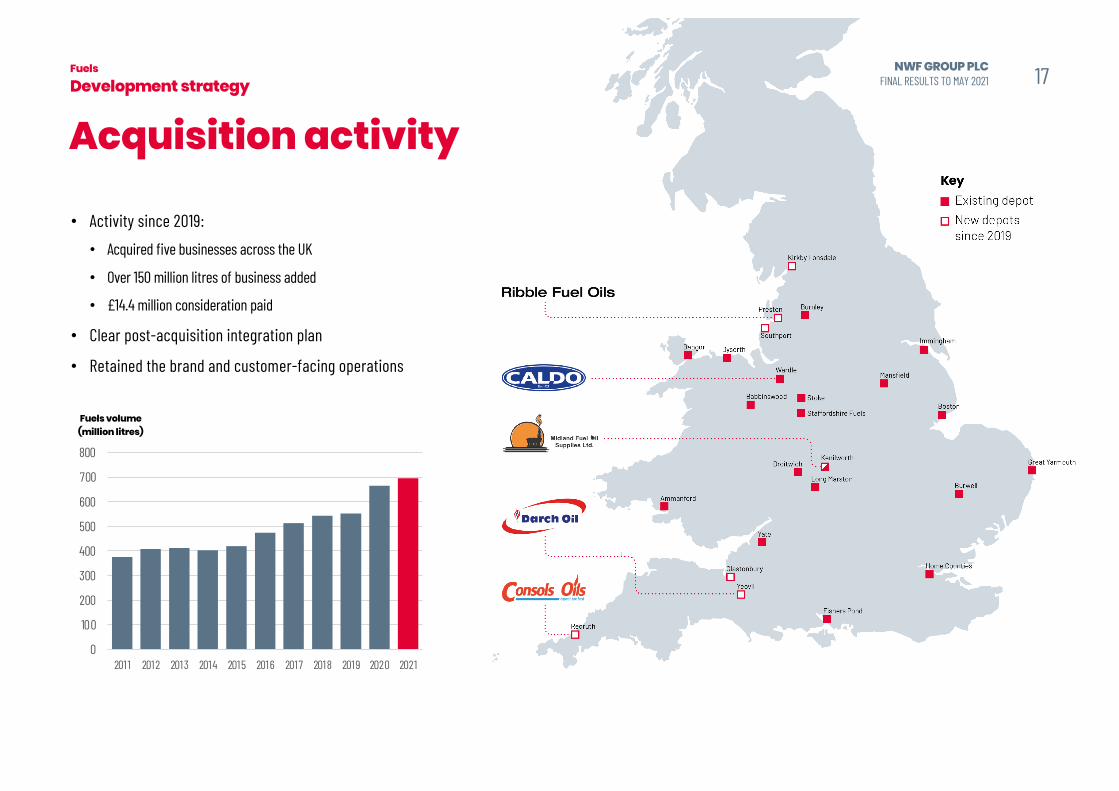
Acquisition activity
• Activity since 2019:
• Acquired five businesses across the UK
• Over 150 million litres of business added
• £14.4 million consideration paid
• Clear post-acquisition integration plan
• Retained the brand and customer-facing operations
17
0
100
200
300
400
500
600
700
800
2011 2012 2013 2014 2015 2016 2017 2018 2019 2020 2021
Fuels volume(million litres)
NWF GROUP PLCFINAL RESULTS TO MAY 2021
Fuels
Development strategy
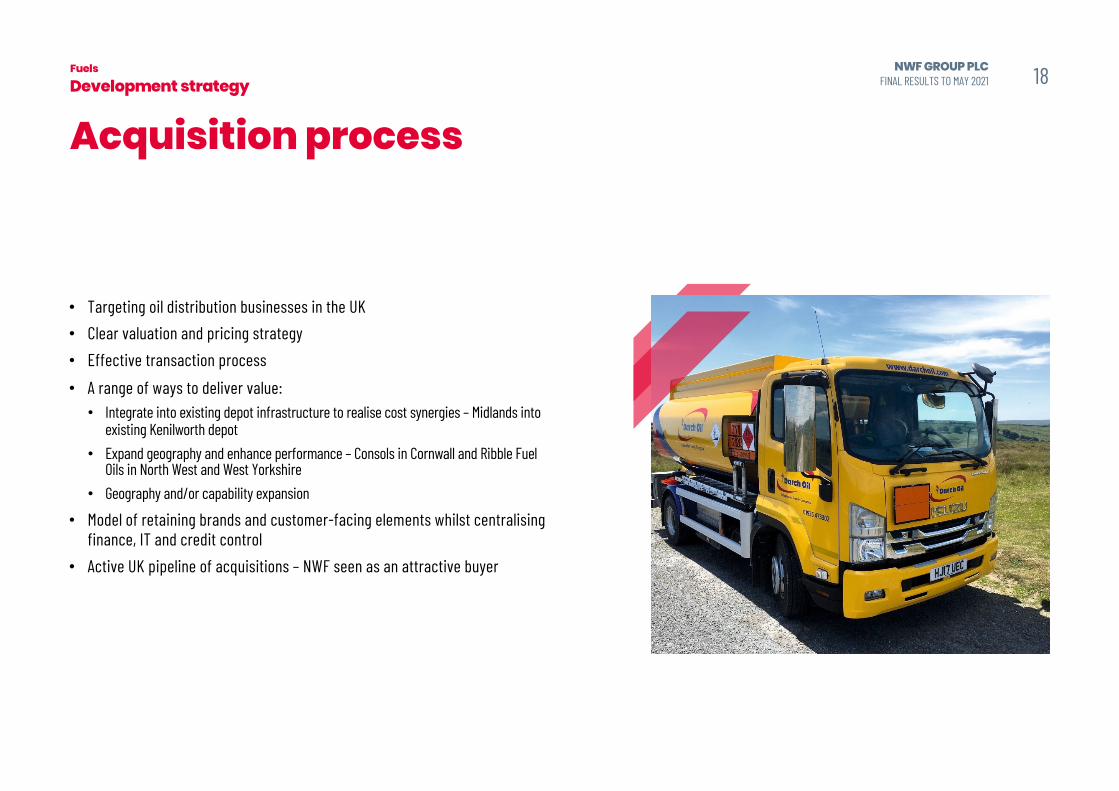
• Targeting oil distribution businesses in the UK• Clear valuation and pricing strategy• Effective transaction process
• A range of ways to deliver value:• Integrate into existing depot infrastructure to realise cost synergies – Midlands into
existing Kenilworth depot• Expand geography and enhance performance – Consols in Cornwall and Ribble Fuel
Oils in North West and West Yorkshire• Geography and/or capability expansion
• Model of retaining brands and customer-facing elements whilst centralising finance, IT and credit control
• Active UK pipeline of acquisitions – NWF seen as an attractive buyer
Acquisition process18NWF GROUP PLC
FINAL RESULTS TO MAY 2021

Group overview
Our sustainability framework consists of four strategic objectives that reflect our values and are designed to ensure we take a proactive and responsible approach to the way we operate. Together, with our stakeholders and across our three divisions, we are working to deliver long-term sustainable value.
NWF Group plcFinal results to may 2020 19
Strategic objectives Priority objective Our ambitions
Create a culture of safety
Invest in our people
Build strong partnerships
Respect the environment
Create a culture of safety to protect our employees and the wider community.
Build a workforce for the future where our people are healthy, happy and can fulfiltheir potential.
Collaborate and innovate with our customers and suppliers to deliverlong-term sustainable value.
Reduce carbon, emissions and waste across our value chain and promote a healthy environment.
• Champion road safety
• Implement a safety first approach
• Promote personal and professional development
• Empower future generations
• Improve employee wellbeing
• Understand our customers’ needs
• Work together with our suppliers
• Collaborate and innovate for more sustainable products
• Mitigate our carbon emissions
• Maximise fleet capacity
• Invest in clean fleet
• Drive efficiencies across our operations
• Responsible use and protection of the natural environment
Delivering sustainable value
ESG framework 19NWF GROUP PLCFINAL RESULTS TO MAY 2021
Group overview
Summary and outlook
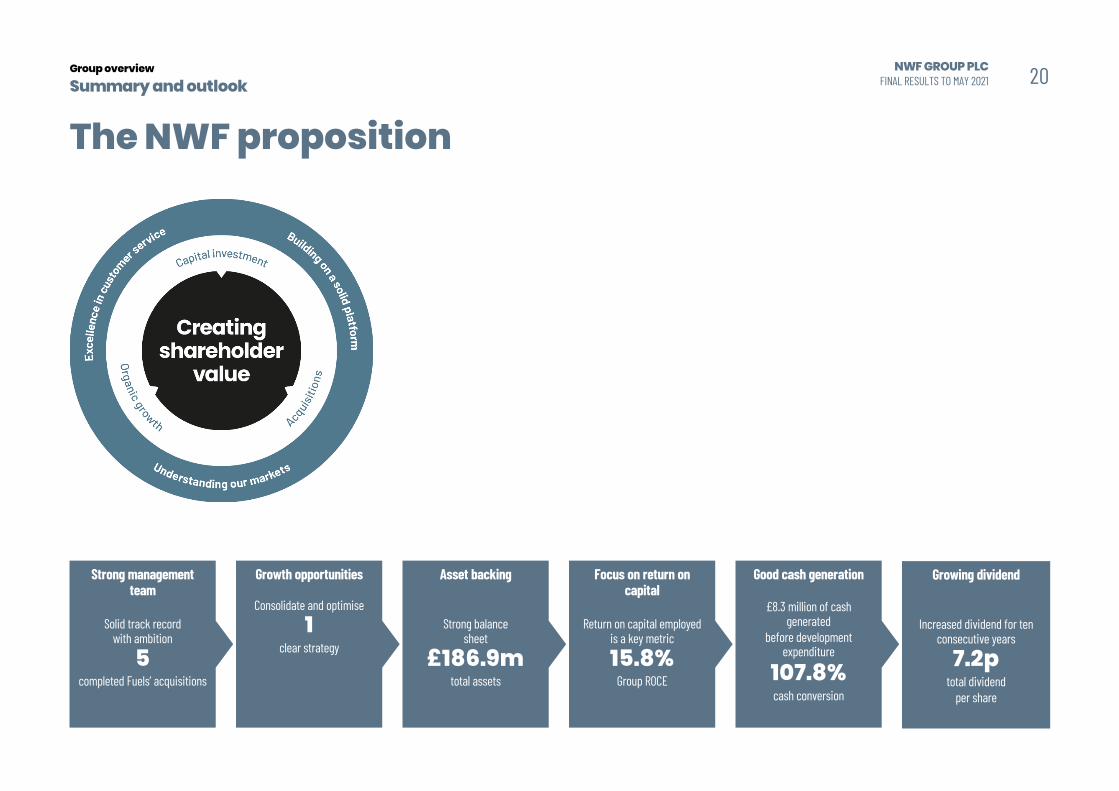
The NWF proposition
Strong management team
Solid track record with ambition
5completed Fuels’ acquisitions
Growing dividend
Increased dividend for ten consecutive years
7.2ptotal dividend
per share
20
Growth opportunities
Consolidate and optimise
1clear strategy
Asset backing
Strong balancesheet
£186.9mtotal assets
Focus on return on capital
Return on capital employed is a key metric
15.8%Group ROCE
Good cash generation
£8.3 million of cash generated
before development expenditure
107.8%cash conversion
NWF GROUP PLCFINAL RESULTS TO MAY 2021
Group overview
Summary and outlook
Significant opportunity for growth
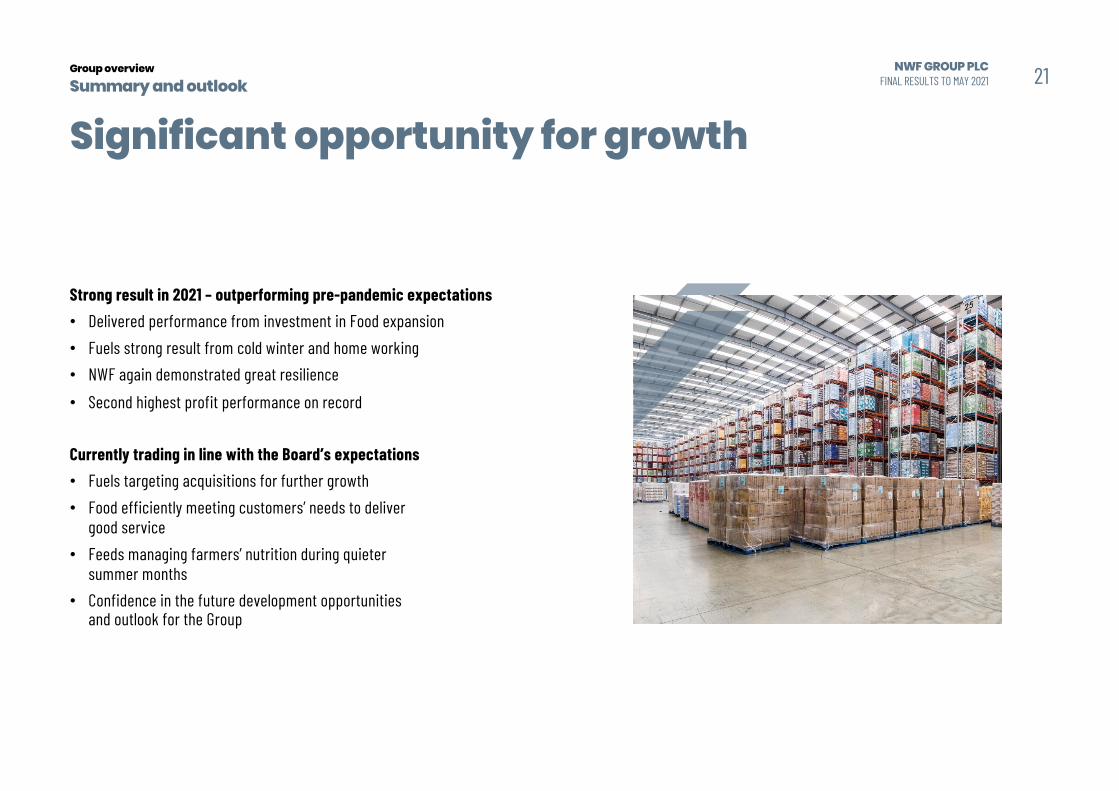
Strong result in 2021 – outperforming pre-pandemic expectations• Delivered performance from investment in Food expansion• Fuels strong result from cold winter and home working• NWF again demonstrated great resilience
• Second highest profit performance on record
Currently trading in line with the Board’s expectations• Fuels targeting acquisitions for further growth• Food efficiently meeting customers’ needs to deliver
good service• Feeds managing farmers’ nutrition during quieter
summer months• Confidence in the future development opportunities
and outlook for the Group
21NWF GROUP PLCFINAL RESULTS TO MAY 2021
Group overview 22NWF GROUP PLCFINAL RESULTS TO MAY 2021
Q&A
Chris BelshamGroup Finance Director
Richard WhitingChief Executive
Group overview
Appendix
Additional information
• Analyst coverage and consensus forecasts• Business overview• Locations• Organisation• Main site photo• Group financial performance• Divisional track record• Additional market data
23NWF GROUP PLCFINAL RESULTS TO MAY 2021
Group overview
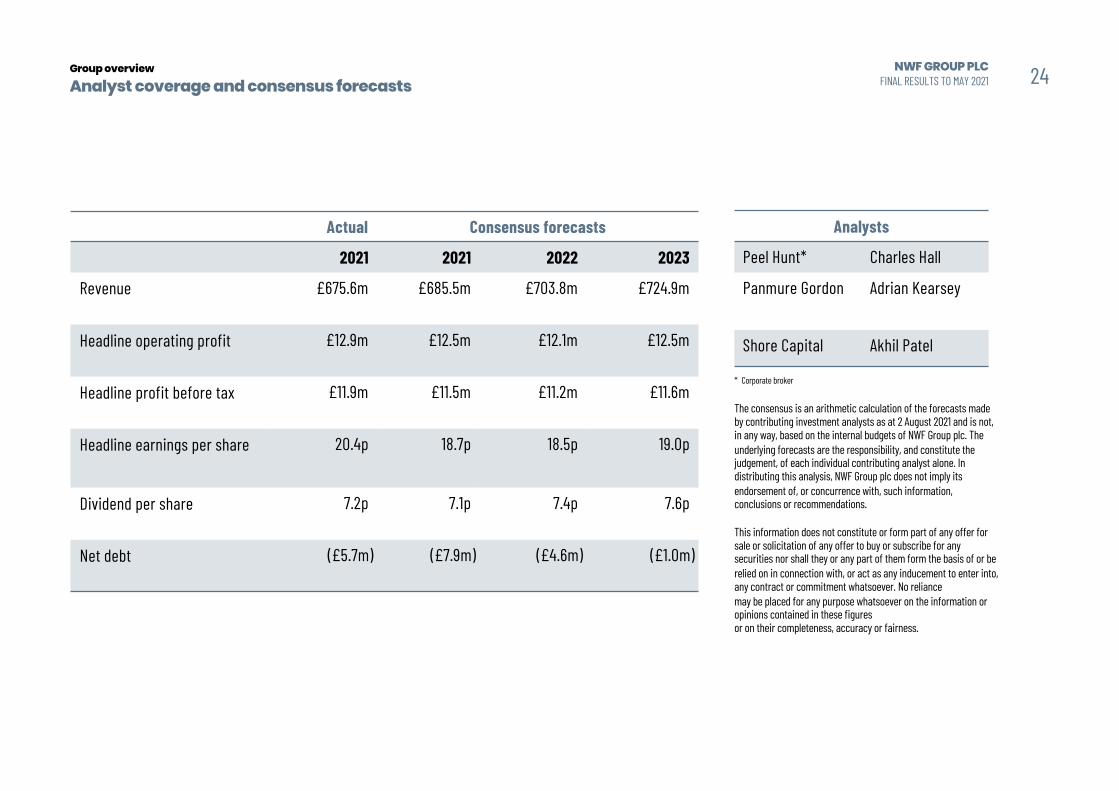
Analyst coverage and consensus forecasts
Actual Consensus forecasts
2021 2021 2022 2023
Revenue £675.6m £685.5m £703.8m £724.9m
Headline operating profit £12.9m £12.5m £12.1m £12.5m
Headline profit before tax £11.9m £11.5m £11.2m £11.6m
Headline earnings per share 20.4p 18.7p 18.5p 19.0p
Dividend per share 7.2p 7.1p 7.4p 7.6p
Net debt (£5.7m) (£7.9m) (£4.6m) (£1.0m)
Analysts
Peel Hunt* Charles Hall
Panmure Gordon Adrian Kearsey
Shore Capital Akhil Patel
* Corporate broker
The consensus is an arithmetic calculation of the forecasts made by contributing investment analysts as at 2 August 2021 and is not, in any way, based on the internal budgets of NWF Group plc. The underlying forecasts are the responsibility, and constitute the judgement, of each individual contributing analyst alone. In distributing this analysis, NWF Group plc does not imply its endorsement of, or concurrence with, such information, conclusions or recommendations.
This information does not constitute or form part of any offer for sale or solicitation of any offer to buy or subscribe for any securities nor shall they or any part of them form the basis of or be relied on in connection with, or act as any inducement to enter into, any contract or commitment whatsoever. No reliance may be placed for any purpose whatsoever on the information or opinions contained in these figures or on their completeness, accuracy or fairness.
24NWF GROUP PLCFINAL RESULTS TO MAY 2021
Group overview
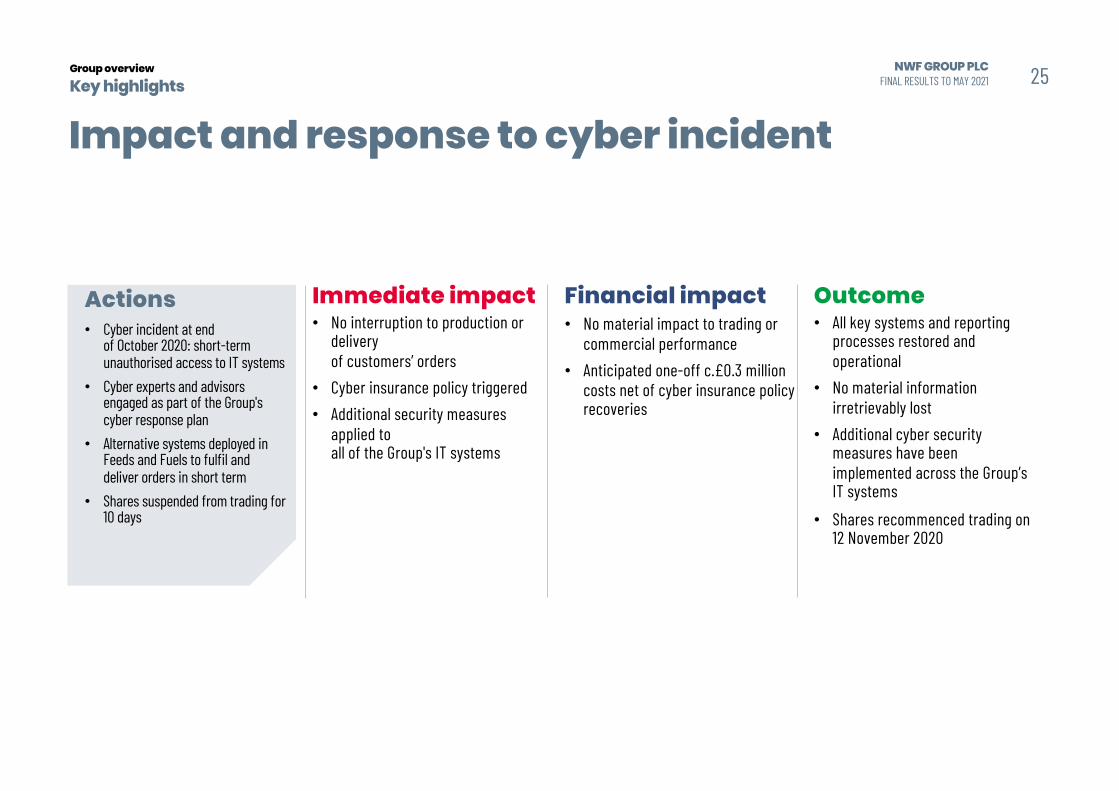
Key highlights
Actions• Cyber incident at end
of October 2020: short-term unauthorised access to IT systems
• Cyber experts and advisors engaged as part of the Group's cyber response plan
• Alternative systems deployed in Feeds and Fuels to fulfil and deliver orders in short term
• Shares suspended from trading for 10 days
Immediate impact• No interruption to production or
delivery of customers’ orders
• Cyber insurance policy triggered• Additional security measures
applied to all of the Group's IT systems
Financial impact• No material impact to trading or
commercial performance• Anticipated one-off c.£0.3 million
costs net of cyber insurance policy recoveries
Outcome• All key systems and reporting
processes restored and operational
• No material information irretrievably lost
• Additional cyber security measures have been implemented across the Group’s IT systems
• Shares recommenced trading on 12 November 2020
Impact and response to cyber incident25NWF GROUP PLC
FINAL RESULTS TO MAY 2021
Fuels
Business overview
Key figures
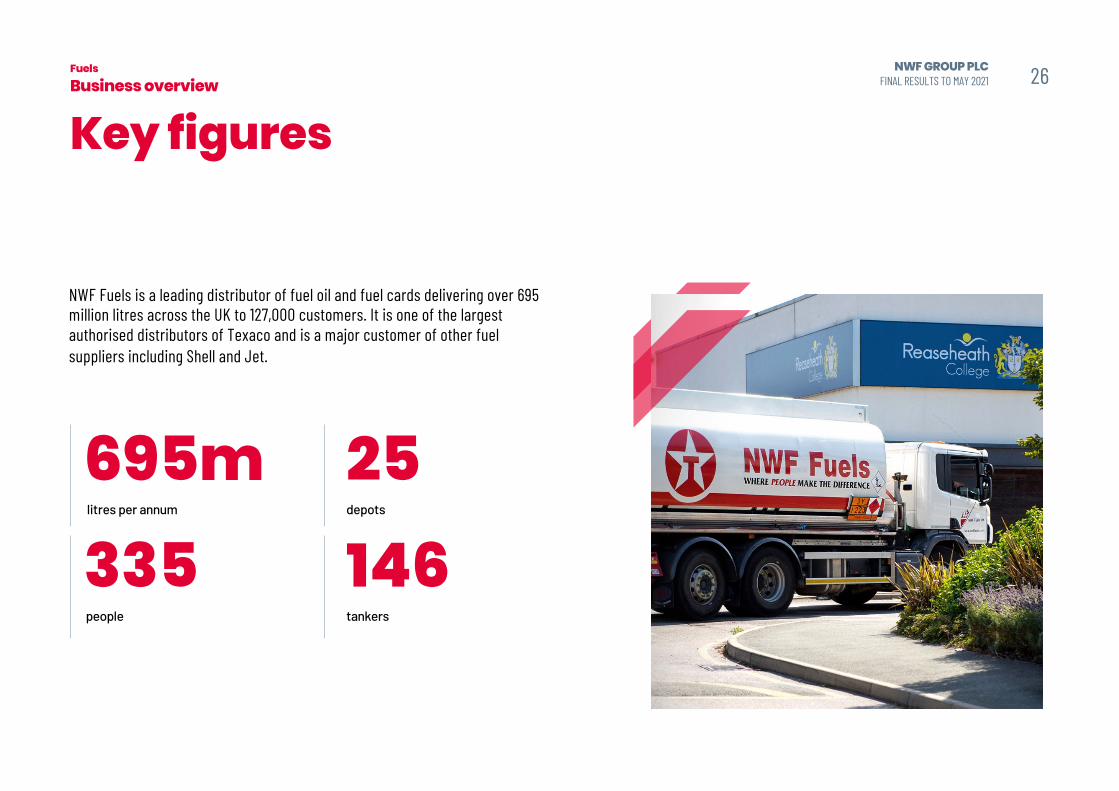
NWF Fuels is a leading distributor of fuel oil and fuel cards delivering over 695 million litres across the UK to 127,000 customers. It is one of the largest authorised distributors of Texaco and is a major customer of other fuel suppliers including Shell and Jet.
26NWF GROUP PLCFINAL RESULTS TO MAY 2021
litres per annum depots
tankerspeople
335 14625695m

Food
Business overview
Key figures
Boughey Distribution is a leading consolidator of ambient grocery products to UK supermarkets with over 1 million ft2 of warehousing and significant distribution assets. It works with over 200 customers including Arla, Swizzelsand Typhoo.
pallet spaces
691135,000 117
trucks
305trailerspeople
27NWF GROUP PLCFINAL RESULTS TO MAY 2021
Feeds
Business overview
Key figures
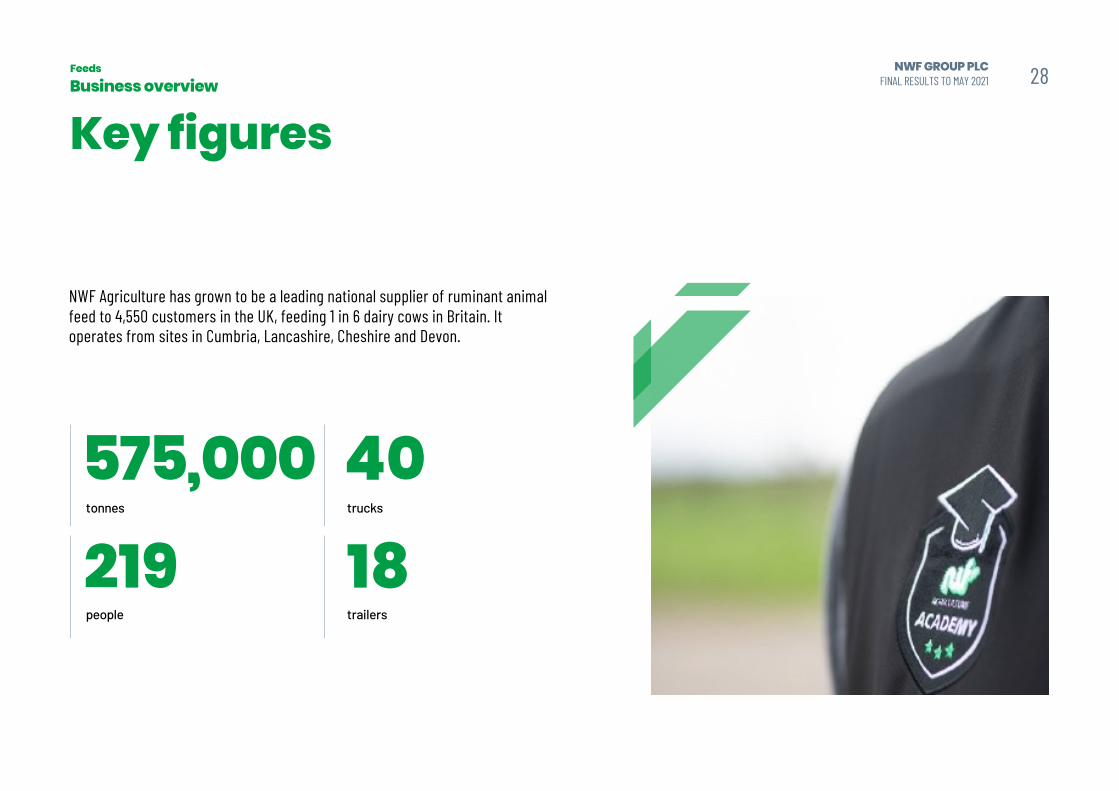
NWF Agriculture has grown to be a leading national supplier of ruminant animal feed to 4,550 customers in the UK, feeding 1 in 6 dairy cows in Britain. It operates from sites in Cumbria, Lancashire, Cheshire and Devon.
575,000tonnes
219people
40trucks
18trailers
28NWF GROUP PLCFINAL RESULTS TO MAY 2021
Group overview
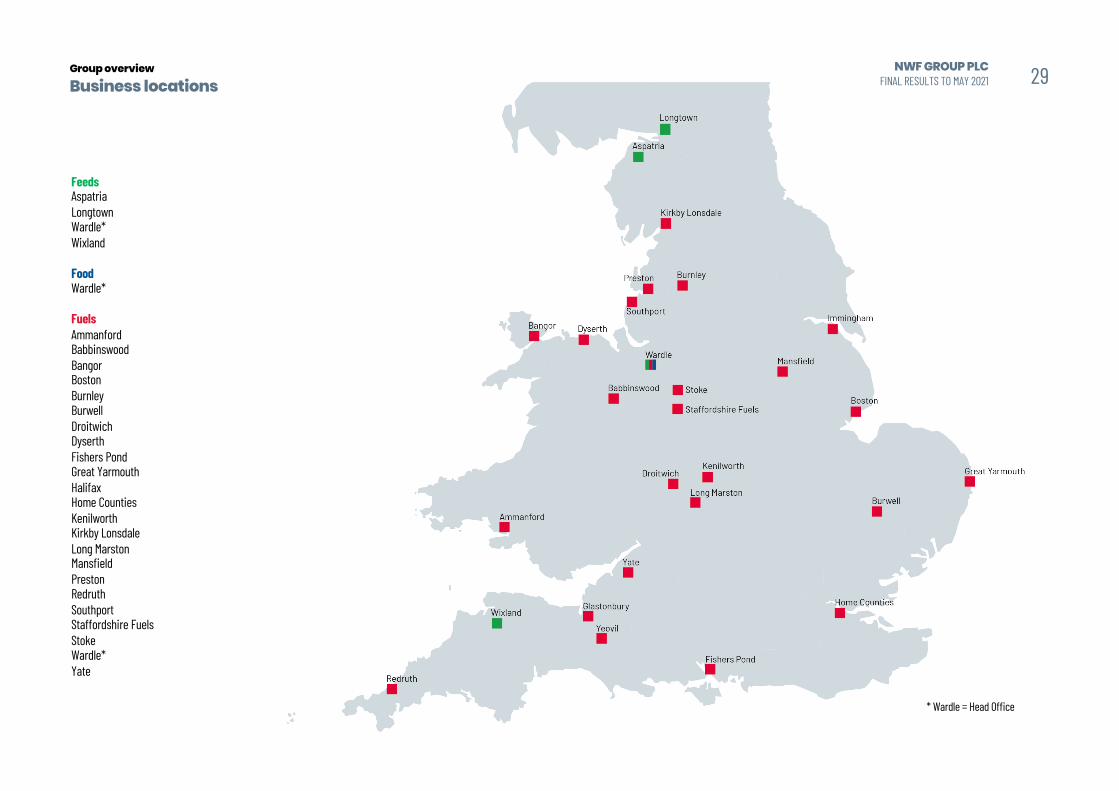
Business locations
FeedsAspatriaLongtownWardle*Wixland
FoodWardle*
FuelsAmmanfordBabbinswoodBangorBostonBurnleyBurwellDroitwichDyserthFishers PondGreat YarmouthHalifaxHome CountiesKenilworthKirkby LonsdaleLong MarstonMansfieldPrestonRedruthSouthportStaffordshire FuelsStokeWardle*Yate
* Wardle = Head Office
29NWF GROUP PLCFINAL RESULTS TO MAY 2021
Group overview
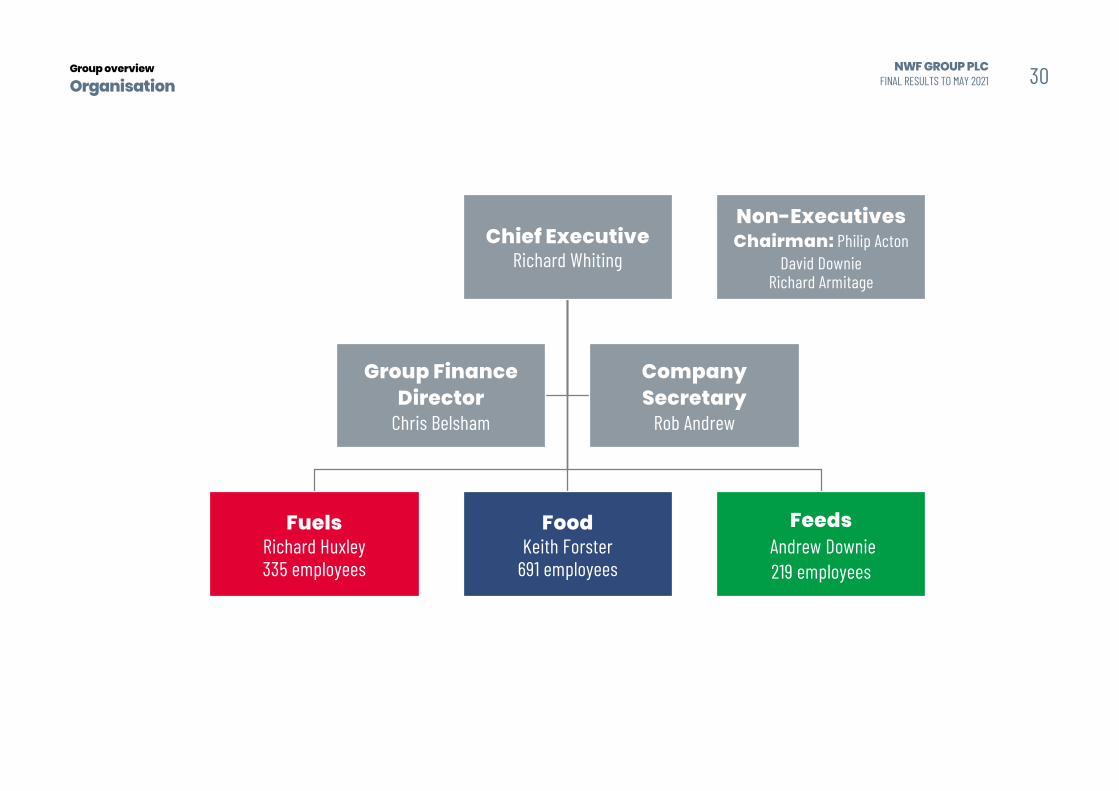
Organisation
Chief Executive Richard Whiting
Fuels Richard Huxley335 employees
FoodKeith Forster
691 employees
FeedsAndrew Downie219 employees
Group Finance Director
Chris Belsham
Company Secretary
Rob Andrew
Non-ExecutivesChairman: Philip Acton
David DownieRichard Armitage
30NWF GROUP PLCFINAL RESULTS TO MAY 2021

Group overview
Wardle – main operating site 31NWF GROUP PLCFINAL RESULTS TO MAY 2021
Group overview
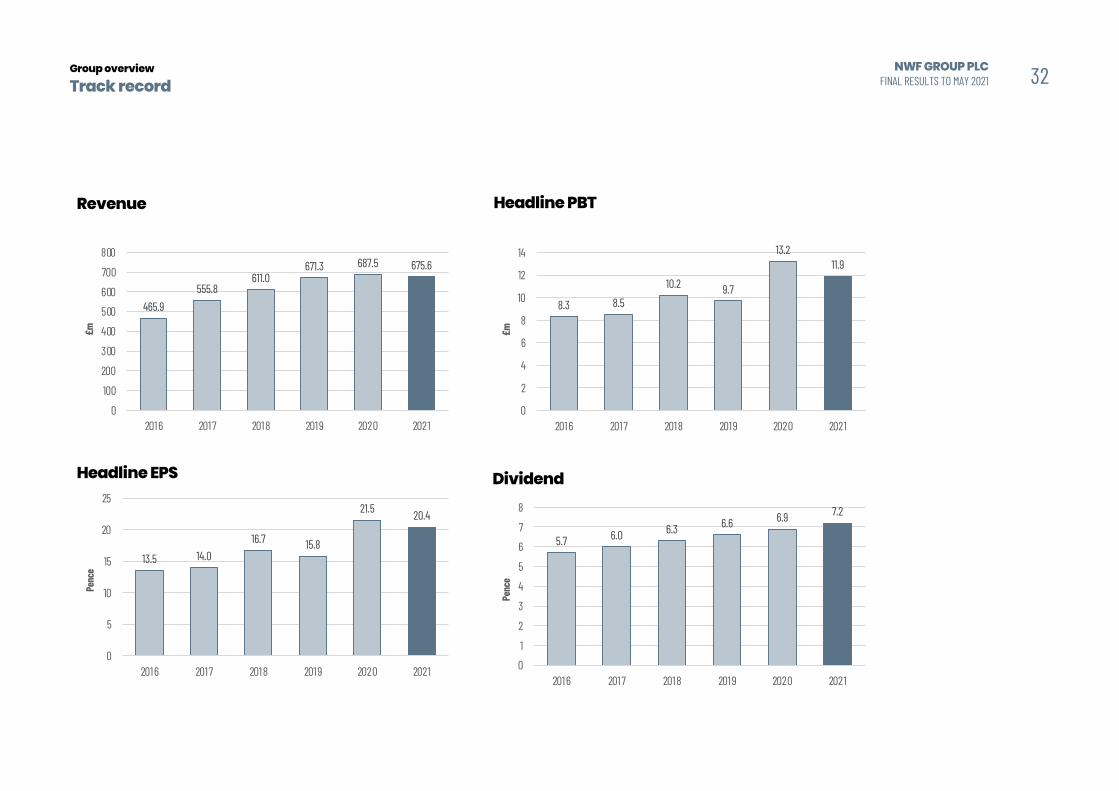
Track record
Revenue Headline PBT
Headline EPS Dividend
32NWF GROUP PLCFINAL RESULTS TO MAY 2021
465.9555.8
611.0671.3 687.5 675.6
0
100
200
300
400
500
600
700
800
2016 2017 2018 2019 2020 2021
£m
8.3 8.510.2 9.7
13.211.9
0
2
4
6
8
10
12
14
2016 2017 2018 2019 2020 2021
£m
13.5 14.016.7 15.8
21.5 20.4
0
5
10
15
20
25
2016 2017 2018 2019 2020 2021
Penc
e
5.7 6.0 6.3 6.6 6.9 7.2
0
1
2
3
4
5
6
7
8
2016 2017 2018 2019 2020 2021
Penc
e
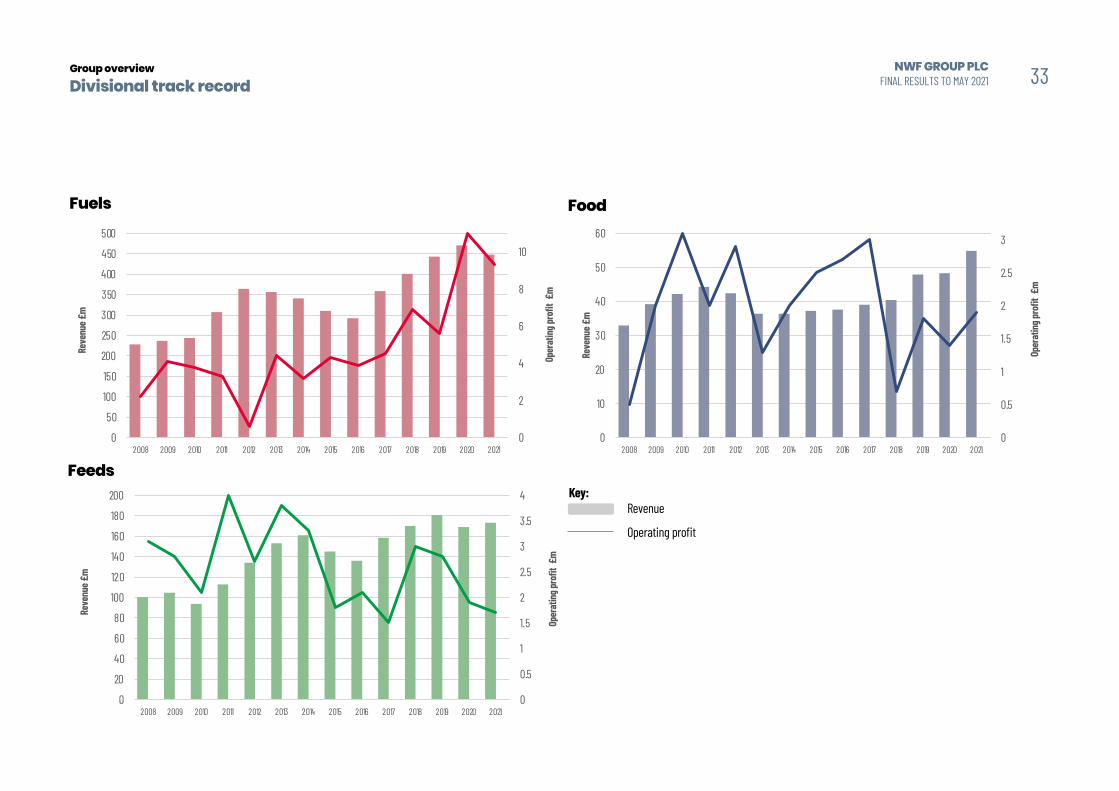
Group overview
Divisional track record
Key:Revenue
Operating profit
Fuels Food
Feeds
33NWF GROUP PLCFINAL RESULTS TO MAY 2021
0
2
4
6
8
10
0
50
100
150
200
250
300
350
400
450
500
2008 2009 2010 2011 2012 2013 2014 2015 2016 2017 2018 2019 2020 2021
Oper
ating
prof
it £
m
Reve
nue £
m
0
0.5
1
1.5
2
2.5
3
0
10
20
30
40
50
60
2008 2009 2010 2011 2012 2013 2014 2015 2016 2017 2018 2019 2020 2021
Oper
ating
prof
it £
m
Reve
nue £
m
0
0.5
1
1.5
2
2.5
3
3.5
4
0
20
40
60
80
100
120
140
160
180
200
2008 2009 2010 2011 2012 2013 2014 2015 2016 2017 2018 2019 2020 2021
Oper
ating
prof
it £
m
Reve
nue £
m
Fuels
Group overview
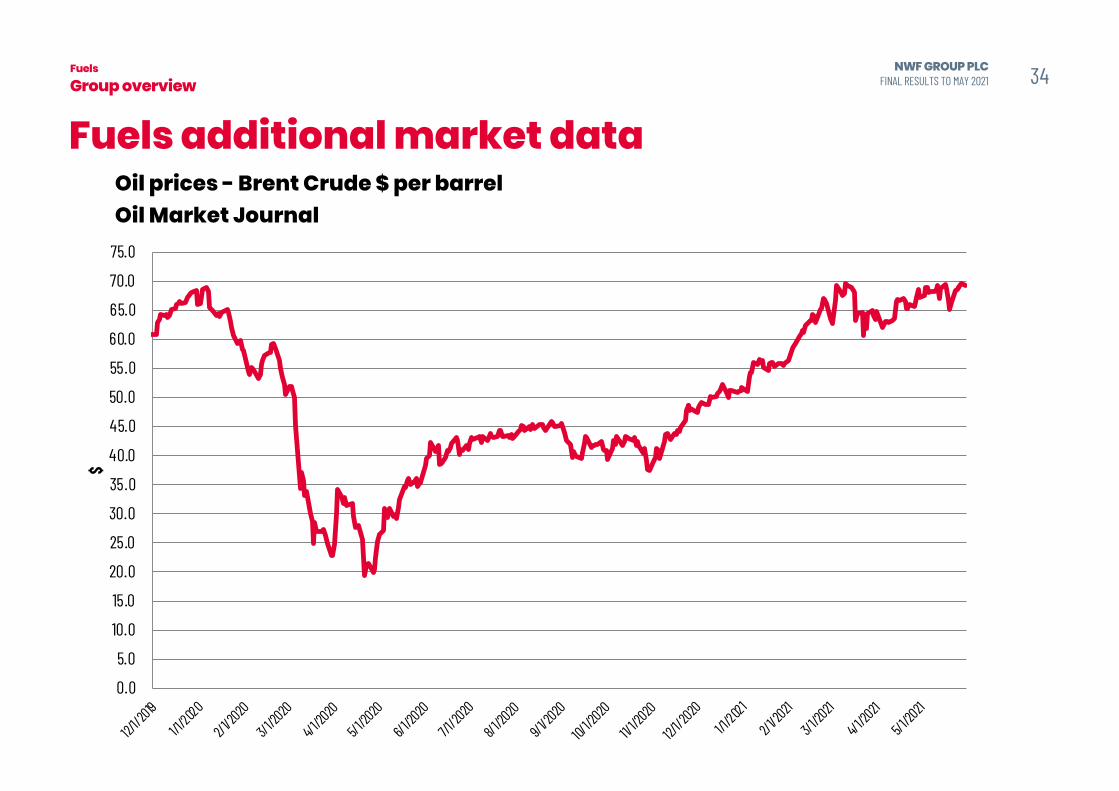
Fuels additional market data34NWF GROUP PLC
FINAL RESULTS TO MAY 2021
0.0
5.0
10.0
15.0
20.0
25.0
30.0
35.0
40.0
45.0
50.0
55.0
60.0
65.0
70.0
75.0
12/1/2
019
1/1/2020
2/1/20
20
3/1/20
20
4/1/20
20
5/1/20
20
6/1/20
20
7/1/20
20
8/1/20
20
9/1/20
20
10/1/2
020
11/1/20
20
12/1/2
0201/1/
2021
2/1/20
21
3/1/20
21
4/1/20
21
5/1/20
21
$
Oil prices - Brent Crude $ per barrelOil Market Journal
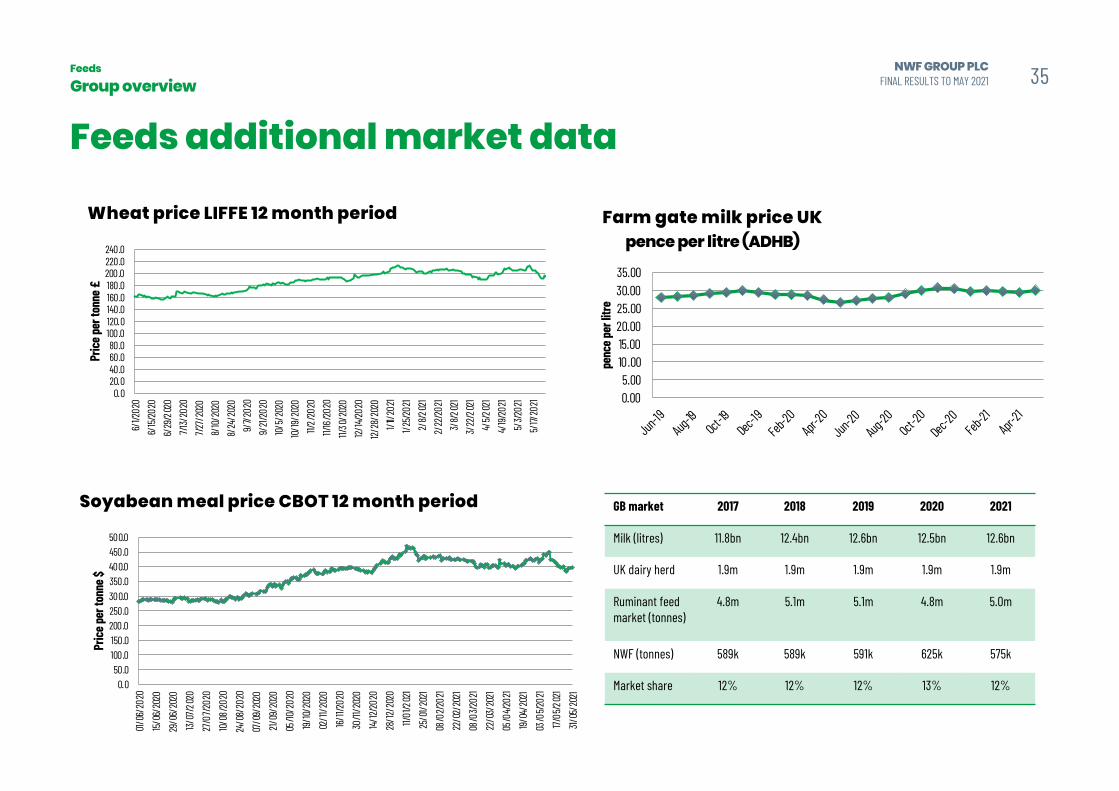
Feeds
Group overview
Feeds additional market data
35NWF GROUP PLCFINAL RESULTS TO MAY 2021
GB market 2017 2018 2019 2020 2021
Milk (litres) 11.8bn 12.4bn 12.6bn 12.5bn 12.6bn
UK dairy herd 1.9m 1.9m 1.9m 1.9m 1.9m
Ruminant feed market (tonnes)
4.8m 5.1m 5.1m 4.8m 5.0m
NWF (tonnes) 589k 589k 591k 625k 575k
Market share 12% 12% 12% 13% 12%
0.005.00
10.0015.0020.0025.0030.0035.00
Jun-19
Aug-19
Oct-19
Dec-19
Feb-20
Apr-20
Jun-20
Aug-20
Oct-20
Dec-20
Feb-21
Apr-21
penc
e per
litre
Farm gate milk price UKpence per litre (ADHB)
0.020.040.060.080.0
100.0120.0140.0160.0180.0200.0220.0240.0
6/1/2
020
6/15/
2020
6/29
/202
07/1
3/20
207/2
7/20
208/
10/20
208/
24/2
020
9/7/2
020
9/21/
2020
10/5/
2020
10/19/
2020
11/2/
2020
11/16
/2020
11/30
/202
012/
14/20
2012/
28/2
020
1/11/2
021
1/25/2
021
2/8/2
021
2/22
/2021
3/8/2
021
3/22
/202
14/
5/202
14/
19/20
215/
3/202
15/
17/20
21
Price
per t
onne
£
Wheat price LIFFE 12 month period
0.050.0
100.0150.0200.0250.0300.0350.0400.0450.0500.0
01/06
/202
015/
06/2
020
29/0
6/20
2013/
07/2
020
27/0
7/202
010/
08/20
2024
/08/
2020
07/0
9/20
2021/
09/2
020
05/10
/202
019/
10/20
2002
/11/2
020
16/11/
2020
30/11
/202
014/
12/20
2028
/12/2
020
11/01
/202
125
/01/2
021
08/0
2/202
122
/02/
2021
08/0
3/202
122
/03/
2021
05/0
4/202
119/
04/2
021
03/0
5/202
117/
05/2
021
31/05
/202
1
Price
per t
onne
$
Soyabean meal price CBOT 12 month period