NWF Group Plc Annual Report and Accounts 2011
72
NWF Group plc Annual Report and Acc ounts 2011
-
Upload
fikirini-rashid-akbar -
Category
Documents
-
view
216 -
download
0
Transcript of NWF Group Plc Annual Report and Accounts 2011
7/29/2019 NWF Group Plc Annual Report and Accounts 2011
http://slidepdf.com/reader/full/nwf-group-plc-annual-report-and-accounts-2011 1/72
NWF Group plc Annual Report and Accounts 2011
7/29/2019 NWF Group Plc Annual Report and Accounts 2011
http://slidepdf.com/reader/full/nwf-group-plc-annual-report-and-accounts-2011 2/72
Contents
You can keep up to date with all the
latest news and gures from NWF
via our website www.nwf.co.uk
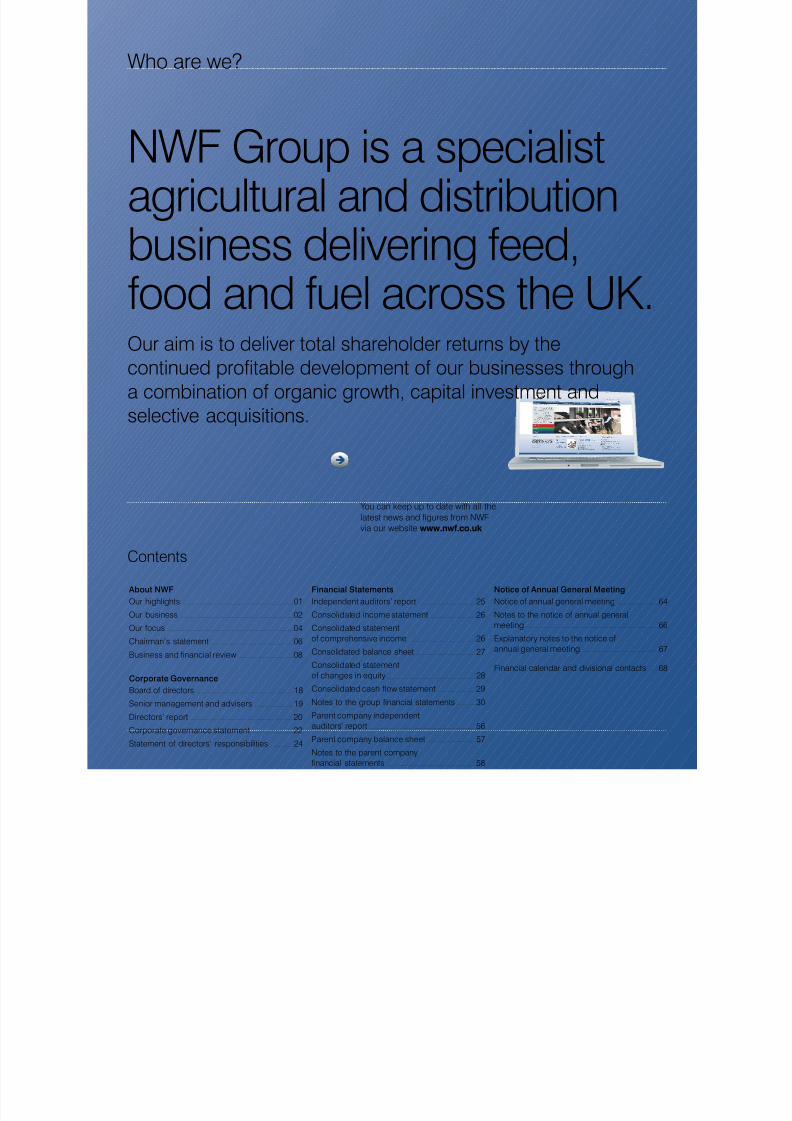
NWF Group is a specialistagricultural and distributionbusiness delivering feed,
food and fuel across the UK.Our aim is to deliver total shareholder returns by the
continued protable development of our businesses through
a combination of organic growth, capital investment and
selective acquisitions.
Who are we?
About NWF
Our highlights ................................................................................................... 01
Our business ...................................................................................................... 02Our focus ................................................................................................................. 04
Chairman’s statement ........................................................................ 06
Business and nancial review ..................................................08
Corporate Governance
Board of directors ....................................................................................... 18
Senior management and advisers ...................................19
Directors’ report .............................................................................................20
Corporate governance statement .....................................22
Statement of directors’ responsibilities .....................24
Financial Statements
Independent auditors’ report ....................................................25
Consolidated income statement .........................................26Consolidated statement
of comprehensive income .............................................................26
Consolidated balance sheet ......................................................27
Consolidated statement
of changes in equity ................................................................................28
Consolidated cash ow statement ...................................29
Notes to the group nancial statements .................30
Parent company independent
auditors’ report ................................................................................................56
Parent company balance sheet ............................................57
Notes to the parent company
nancial statements .................................................................................58
Notice of Annual General Meeting
Notice of annual general meeting .................................... 64
Notes to the notice of annual general meeting ....................................................................................................................... 66
Explanatory notes to the notice of
annual general meeting .....................................................................67
Financial calendar and divisional contacts ....... 68
7/29/2019 NWF Group Plc Annual Report and Accounts 2011
http://slidepdf.com/reader/full/nwf-group-plc-annual-report-and-accounts-2011 3/72
1 From continuing operations only, excluding
Garden Centres disposed of in October 2008.
2 Excluding £3.5 million exceptional deferred tax
charge in 2009 arising from the phased withdrawal
of industrial buildings allowances.
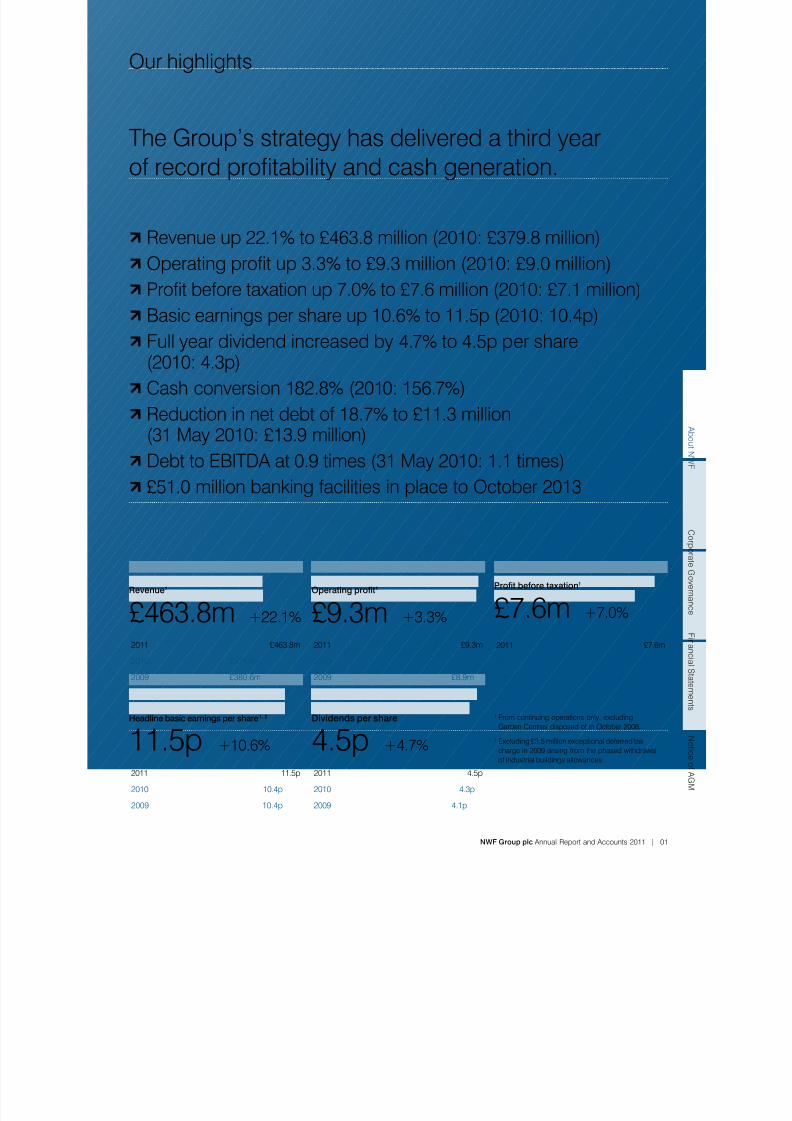
b Revenue up 22.1% to £463.8 million (2010: £379.8 million)
b Operatingprotup3.3%to£9.3million(2010:£9.0million)
b Protbeforetaxationup7.0%to£7.6million(2010:£7.1million)
b Basic earnings per share up 10.6% to 11.5p (2010: 10.4p)
b Full year dividend increased by 4.7% to 4.5p per share(2010: 4.3p)
b Cash conversion 182.8% (2010: 156.7%)
b Reduction in net debt of 18.7% to £11.3 million(31 May 2010: £13.9 million)
b Debt to EBITDA at 0.9 times (31 May 2010: 1.1 times) b £51.0 million banking facilities in place to October 2013
The Group’s strategy has delivered a third yearofrecordprotabilityandcashgeneration.
Headline basic earnings per share1, 2
11.5p +10.6%
2011 11.5p
2010 10.4p
2009 10.4p
Dividends per share
4.5p +4.7%
2011 4.5p
2010 4.3p
2009 4.1p
Revenue1
£463.8m +22.1%2011 £463.8m
2010 £379.8m
2009 £380.6m
Operating prot1
£9.3m +3.3%2011 £9.3m
2010 £9.0m
2009 £8.9m
Prot before taxation1
£7.6m +7.0%2011 £7.6m
2010 £7.1m
2009 £6.2m
A b o u t N
WF
C or p or a t e G ov er n an c
e
F i n an c i al S t a t em en t s
N o t i c e o
f A GM
NWF Group plc Annual Report and Accounts 2011 | 01
Our highlights
7/29/2019 NWF Group Plc Annual Report and Accounts 2011
http://slidepdf.com/reader/full/nwf-group-plc-annual-report-and-accounts-2011 4/72
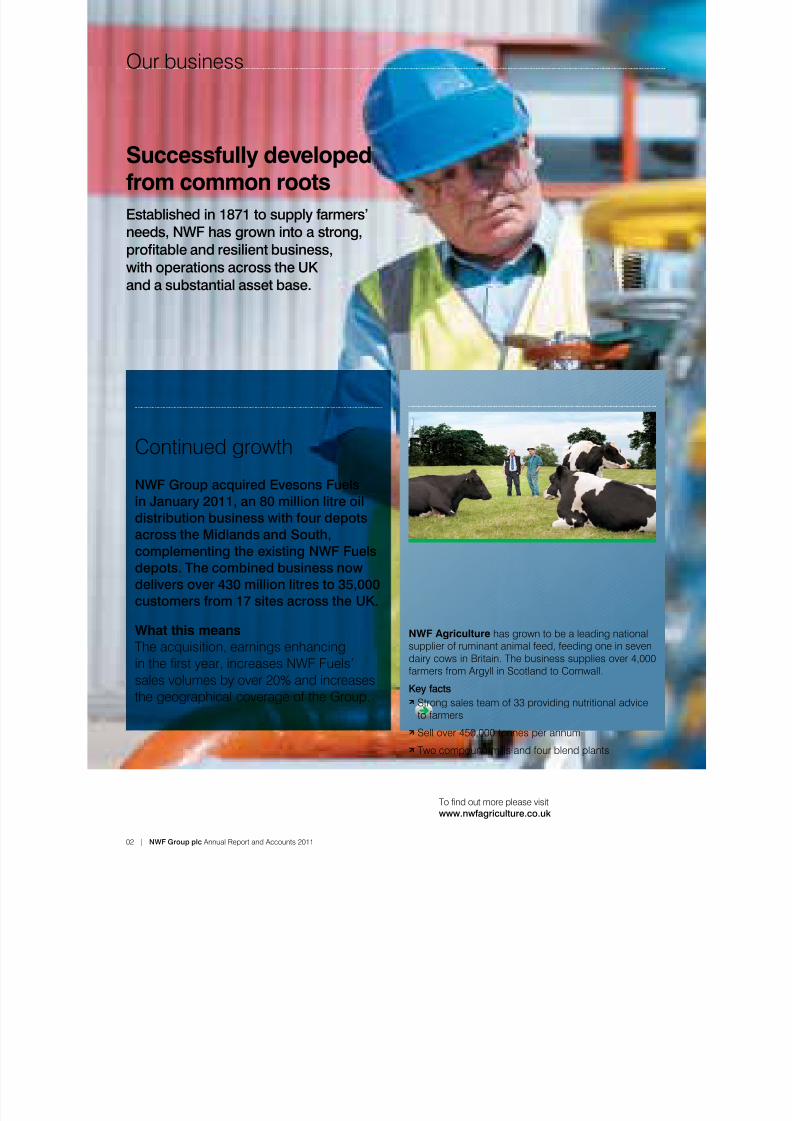
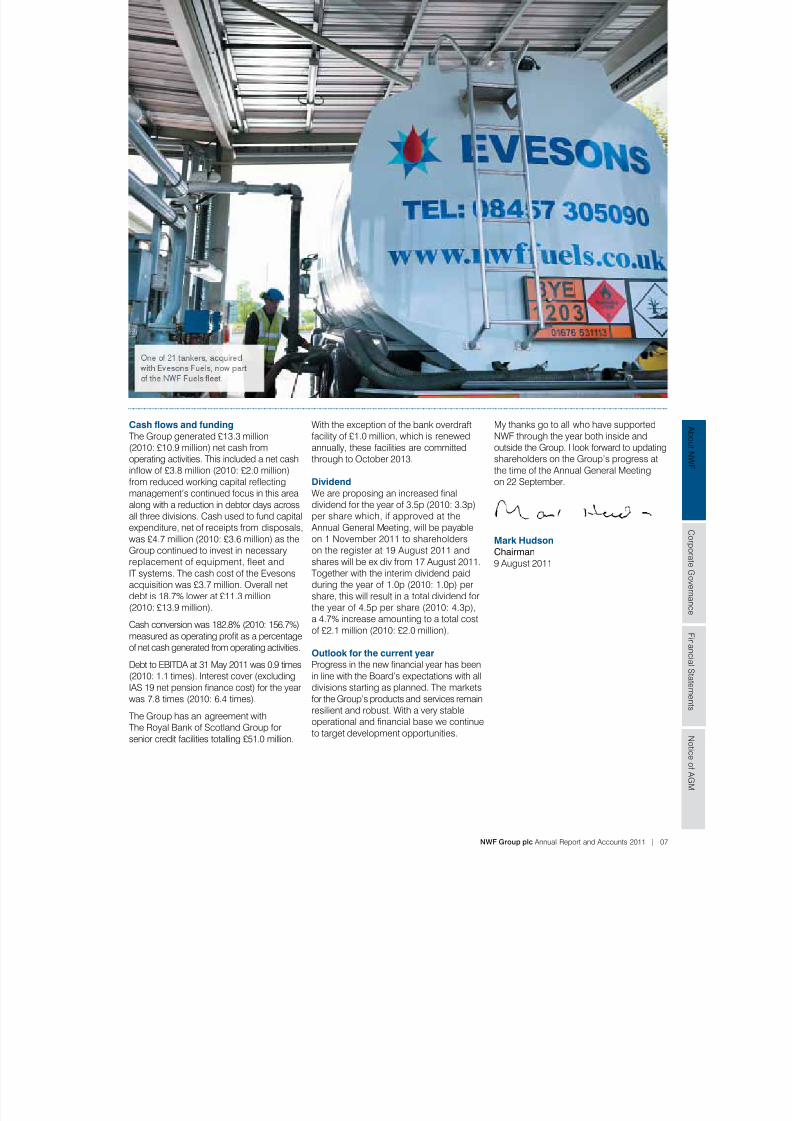
NWF Group acquired Evesons Fuels
in January 2011, an 80 million litre oil
distribution business with four depots
across the Midlands and South,
complementing the existing NWF Fuels
depots. The combined business now
delivers over 430 million litres to 35,000
customers from 17 sites across the UK.
What this means
The acquisition, earnings enhancingintherstyear,increasesNWFFuels’
sales volumes by over 20% and increasesthe geographical coverage of the Group.
Successfully developedfrom common roots
Established in 1871 to supply farmers’
needs, NWF has grown into a strong,
protable and resilient business,
with operations across the UK
and a substantial asset base.
Continued growth
NWF Agriculture has grown to be a leading nationalsupplier of ruminant animal feed, feeding one in sevendairy cows in Britain. The business supplies over 4,000farmers from Argyll in Scotland to Cornwall.
Key facts
b Strong sales team of 33 providing nutritional adviceto farmers
b Sell over 450,000 tonnes per annum
b Two compound mills and four blend plants
Feeds
Tondoutmorepleasevisit www.nwfagriculture.co.uk
02 | NWF Group plc Annual Report and Accounts 2011
Our business
7/29/2019 NWF Group Plc Annual Report and Accounts 2011
http://slidepdf.com/reader/full/nwf-group-plc-annual-report-and-accounts-2011 5/72
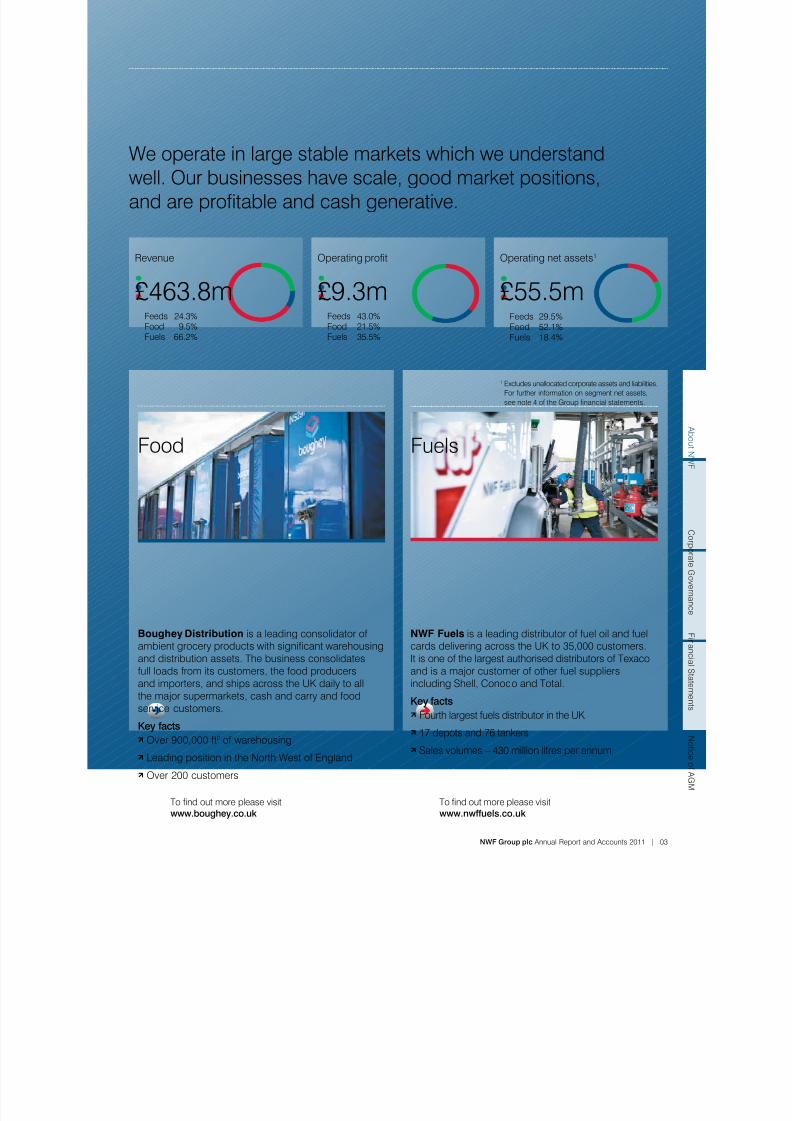
Boughey Distribution is a leading consolidator ofambient grocery products with signicant warehousingand distribution assets. The business consolidatesfull loads from its customers, the food producersand importers, and ships across the UK daily to allthe major supermarkets, cash and carry and foodservice customers.
Key facts
b Over 900,000 ft2 of warehousing
b Leading position in the North West of England
b Over 200 customers
Food
To nd out more please visit www.boughey.co.uk
NWF Fuels is a leading distributor of fuel oil and fuelcards delivering across the UK to 35,000 customers.It is one of the largest authorised distributors of Texacoand is a major customer of other fuel suppliersincluding Shell, Conoco and Total.
Key facts
b Fourth largest fuels distributor in the UK
b 17 depots and 76 tankers
b Sales volumes – 430 million litres per annum
Fuels
To nd out more please visit www.nwffuels.co.uk
1 Excludes unallocated corporate assets and liabilities.
For further information on segment net assets,
see note 4 of the Group nancial statements.
A b o u t N
WF
C or p or a t e G ov er n an c
e
F i n an c i al S t a t em en t s
N o t i c e o
f A GM
NWF Group plc Annual Report and Accounts 2011 | 03
Operating net assets1
Feeds 29.5% Food 52.1% Fuels 18.4%
£55.5m
Operating prot
Feeds 43.0% Food 21.5% Fuels 35.5%
£9.3m
Revenue
£463.8m Feeds 24.3% Food 9.5% Fuels 66.2%
We operate in large stable markets which we understandwell. Our businesses have scale, good market positions,and are protable and cash generative.
7/29/2019 NWF Group Plc Annual Report and Accounts 2011
http://slidepdf.com/reader/full/nwf-group-plc-annual-report-and-accounts-2011 6/72
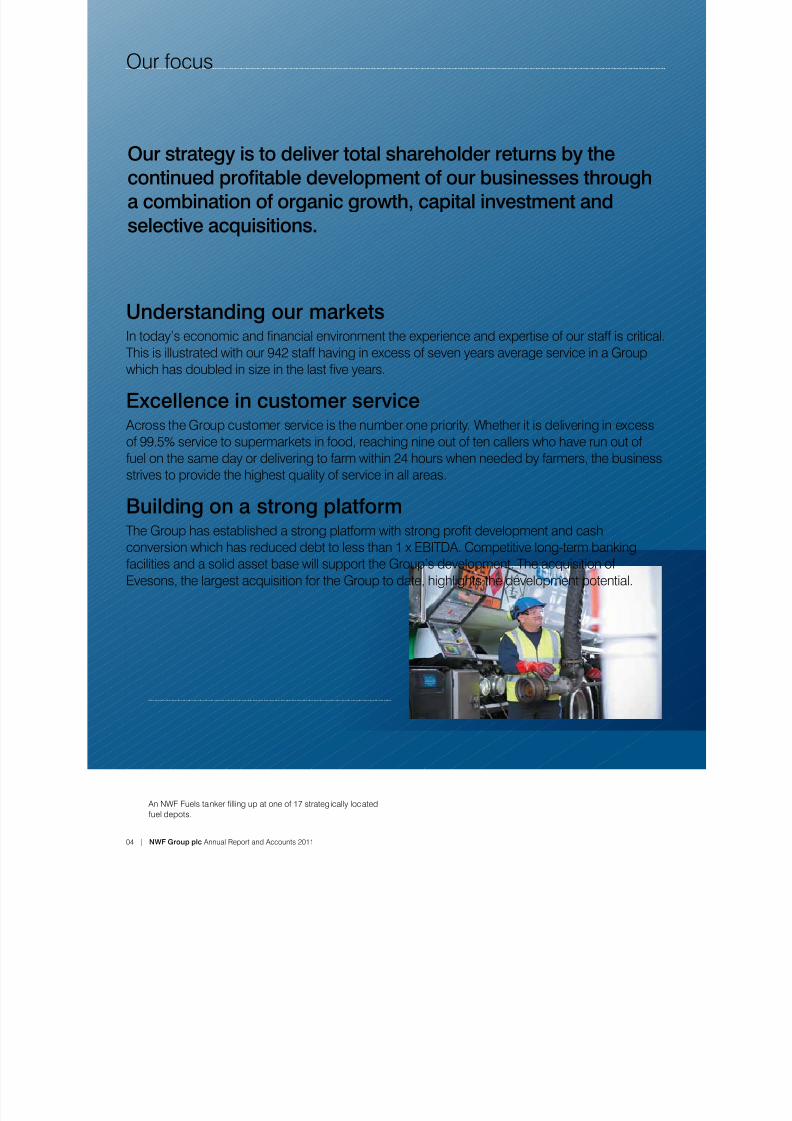
Our strategy is to deliver total shareholder returns by thecontinued protable development of our businesses through
a combination of organic growth, capital investment and
selective acquisitions.
Understanding our marketsIntoday’seconomicandnancialenvironmenttheexperienceandexpertiseofourstaffiscritical.
This is illustrated with our 942 staff having in excess of seven years average service in a Groupwhichhasdoubledinsizeinthelastveyears.
Excellence in customer service Across the Group customer service is the number one priority. Whether it is delivering in excessof 99.5% service to supermarkets in food, reaching nine out of ten callers who have run out of
fuel on the same day or delivering to farm within 24 hours when needed by farmers, the businessstrives to provide the highest quality of service in all areas.
Building on a strong platformTheGrouphasestablishedastrongplatformwithstrongprotdevelopmentandcash
conversion which has reduced debt to less than 1 x EBITDA. Competitive long-term bankingfacilities and a solid asset base will support the Group’s development. The acquisition ofEvesons, the largest acquisition for the Group to date, highlights the development potential.
AnNWFFuelstankerllingupatoneof17strategicallylocated
fuel depots.
04 | NWF Group plc Annual Report and Accounts 2011
Our focus
7/29/2019 NWF Group Plc Annual Report and Accounts 2011
http://slidepdf.com/reader/full/nwf-group-plc-annual-report-and-accounts-2011 7/72
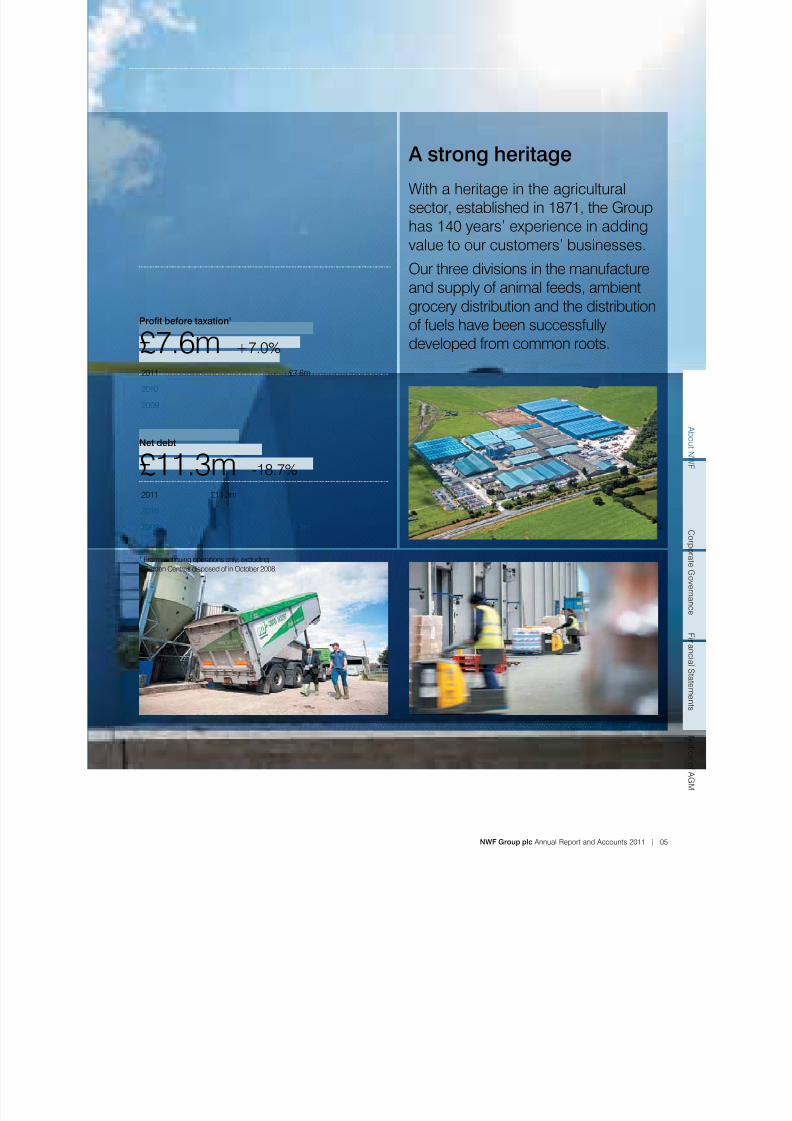
A strong heritageWith a heritage in the agriculturalsector, established in 1871, the Grouphas 140 years’ experience in addingvalue to our customers’ businesses.
Our three divisions in the manufactureand supply of animal feeds, ambient
grocery distribution and the distributionof fuels have been successfullydeveloped from common roots.
Net debt
£11.3m -18.7%
2011 £11.3m
2010 £13.9m
Prot before taxation1
£7.6m +7.0%
2011 £7.6m
2010 £7.1m
2009 £6.2m
2009 £19.3m
1 From continuing operations only, excluding
Garden Centres disposed of in October 2008.
A b o u t N
WF
C or p or a t e G ov er n an c
e
F i n an c i al S t a t em en t s
N o t i c e o
f A GM
NWF Group plc Annual Report and Accounts 2011 | 05
7/29/2019 NWF Group Plc Annual Report and Accounts 2011
http://slidepdf.com/reader/full/nwf-group-plc-annual-report-and-accounts-2011 8/72
06 | NWF Group plc Annual Report and Accounts 2011
Chairman’s statement
Fuels has over
35,000customers in the UK across all major
oil categories. Future demand for oil
is forecast to be stable.
Food has over
200customers, many with long-term
contracts. Demand for ambient grocery
products will grow as the population
increases and consumers continue
to eat more.
Summary of Chairman’s statement
b Record performance for NWF
b Revenue up 22.1% to £463.8 million(2010: £379.8 million)
b Operatingprotup3.3%to£9.3 million (2010: £9.0 million)
b Protbeforetaxationup7.0%to
£7.6 million (2010: £7.1 million)
b Basic earnings per share up10.6% to 11.5p (2010: 10.4p)
b Full year dividend increased by4.7% to 4.5p per share (2010: 4.3p)
b Reduction in net debt of 18.7%to £11.3 million (31 May 2010:£13.9 million)
b Debt to EBITDA at 0.9 times(31 May 2010: 1.1 times)
b £51.0 million banking facilitiesin place to October 2013
We have delivered an excellent resultdemonstrating the resilience of theGroupduringaperiodofsignicantvolatility in key commodity markets.Mark Hudson Chairman
I am pleased to report another record yearin the continuing development of the Group.We have delivered an excellent result
demonstrating the resilience of the Groupduringaperiodofsignicantvolatilityin
key commodity markets. In addition, thesuccessful acquisition of the Evesons fuelsbusiness demonstrates our capacity todevelop the Group through targetedacquisitions in line with our strategy.
Results
Revenue in the year was up 22.1% to£463.8 million (2010: £379.8 million) andoperatingprotwasup3.3%to£9.3million
(2010: £9.0 million). Revenue growth hasbeen fuelled by increasing commodity
prices in the Feeds and Fuels divisions.The Group has successfully implementedprice increases in both markets.
The outstanding performance in the yearin Feeds demonstrates the capability of thebusiness to manage the unprecedentedincreases in key commodity costs, whilstdeveloping more compound businessdirect with farmers and driving operational
efciencies.TheFuelsdivision’sstrong
performance was in a year of extremes,with the coldest December and the warmest
April on record. The ability of the businessto deliver the largest Fuels acquisition todate and successfully integrate it into ourdepot network demonstrates deliveryagainst our strategic development plans.The volatility in the ambient grocery marketscontinued in the second half though we arepleased to report an improvement in theunderlying performance of our Food businessas it responded to both volatility in short-termdemand patterns and implementedoperational changes to deliver an improvedunderlying result. It has been pleasing tonote this improvement has been sustained
intothenewnancialyear.
Protbeforetaxationwasarecord
for the Group, up 7.0% to £7.6 million(2010:£7.1million)andprotafter
taxation was up 10.2% to £5.4 million(2010: £4.9 million).
Basic earnings per share were up 10.6%to 11.5p (2010: 10.4p). Diluted earningsper share were 11.4p (2010: 10.4p).
Feeds supplies over
4,000farmers; consumer demand for milk
and dairy products has been stable
through the recession and is forecast
to grow modestly.
7/29/2019 NWF Group Plc Annual Report and Accounts 2011
http://slidepdf.com/reader/full/nwf-group-plc-annual-report-and-accounts-2011 9/72
NWF Group plc Annual Report and Accounts 2011 | 07
A b o u t N
WF
C or p or a t e G ov er n an c
e
F i n an c i al S t a t em en t s
N o t i c e o
f A GM
Cash ows and funding
The Group generated £13.3 million(2010: £10.9 million) net cash from
operating activities. This included a net cashinowof£3.8million(2010:£2.0million)
fromreducedworkingcapitalreecting
management’s continued focus in this areaalong with a reduction in debtor days acrossall three divisions. Cash used to fund capitalexpenditure, net of receipts from disposals,was £4.7 million (2010: £3.6 million) as theGroup continued to invest in necessaryreplacement of equipment, fleet andIT systems. The cash cost of the Evesonsacquisition was £3.7 million. Overall netdebt is 18.7% lower at £11.3 million(2010: £13.9 million).
Cash conversion was 182.8% (2010: 156.7%),measuredasoperatingprotasapercentage
of net cash generated from operating activities.
Debt to EBITDA at 31 May 2011 was 0.9 times(2010: 1.1 times). Interest cover (excludingIAS19netpensionnancecost)fortheyear
was 7.8 times (2010: 6.4 times).
The Group has an agreement withThe Royal Bank of Scotland Group forsenior credit facilities totalling £51.0 million.
With the exception of the bank overdraftfacility of £1.0 million, which is renewedannually, these facilities are committed
through to October 2013.
Dividend
Weareproposinganincreasednal
dividend for the year of 3.5p (2010: 3.3p)per share which, if approved at the Annual General Meeting, will be payableon 1 November 2011 to shareholderson the register at 19 August 2011 andshares will be ex div from 17 August 2011.Together with the interim dividend paidduring the year of 1.0p (2010: 1.0p) pershare, this will result in a total dividend forthe year of 4.5p per share (2010: 4.3p),
a 4.7% increase amounting to a total costof £2.1 million (2010: £2.0 million).
Outlook for the current yearProgressinthenewnancialyearhasbeen
in line with the Board’s expectations with alldivisions starting as planned. The marketsfor the Group’s products and services remainresilient and robust. With a very stableoperationalandnancialbasewecontinue
to target development opportunities.
My thanks go to all who have supportedNWF through the year both inside andoutside the Group. I look forward to updating
shareholders on the Group’s progress atthe time of the Annual General Meetingon 22 September.
Mark Hudson
Chairman
9 August 2011
7/29/2019 NWF Group Plc Annual Report and Accounts 2011
http://slidepdf.com/reader/full/nwf-group-plc-annual-report-and-accounts-2011 10/72
08 | NWF Group plc Annual Report and Accounts 2011
Businessandnancialreview
Summary of business
and nancial review
b Specialist agricultural anddistribution business
b Third record year for NWF
b Demonstrated strategic intentwith the Evesons Fuels acquisition
b Evesons acquisition and increasedcapital expenditure funded fromcash generation
b Protbeforetaxationup7.0%to£7.6 million (2010: £7.1 million)
b
Reduction in net debt of 18.7%to £11.3 million (31 May 2010:£13.9 million)
b Competitive banking facilitiesin place to October 2013
b Alldivisionsprotable,cashgenerative with experiencedmanagement teams
b Substantial asset base and astrong platform for development
Athirdyearofrecordprotabilityandpositivecash generation.
NWF has delivered a strong operationalperformance in the year. In addition toathirdyearofrecordprotabilityand
positive cash generation, the Group hasdemonstrated its strategic intent with thesuccessful acquisition and integration of theEvesons fuels business. Of particular notein the year is the outperformance of Feeds,which demonstrated the capability to deliversuccess in extremely volatile commoditymarkets, with demand for our productsremaining robust.
TheGroupdeliveredanoperatingprot
of £9.3 million (2010: £9.0 million) andarecordprotbeforetaxation,up7.0%
to £7.6 million (2010: £7.1 million).
Our continued focus on cash generationresulted in a reduction in net debt of 18.7%to £11.3 million (2010: £13.9 million).During the year the Group increased itscapital expenditure programme to supportthe organic development of each division,and acquired the Evesons fuel businessfor consideration of £3.6 million (includingworking capital of £0.3 million) which wasfully funded through cash generation fromthe Group’s existing activities.
The Group has an agreement withThe Royal Bank of Scotland Group for
senior credit facilities totalling £51.0 millionthrough to October 2013. These facilities
and the reduction in Group net debtprovide the Group with a strong platformfrom which to continue its successful
development building on the excellentresults delivered in 2011.
NWF Group is a specialist agricultural anddistribution business delivering feed, foodand fuel across the UK. Our trading divisionshave scale, good market positions, andareprotableandcashgenerative.
In Feeds, feeding one in seven dairycows in Britain, we are a leading nationalsupplier of ruminant animal feeds andhave opportunities to continue our growthtrack record with the focus on winningbusiness direct with farmers. In Food,
we have managed to improve theperformance of the business in morevolatile conditions and with enhancedsystems and processes we are lookingto deliver strong results utilising our storagefacilities in the North West. In Fuels, we havea proven depot operating model and arelooking to continue the development of our17 depots and deliver bolt-on acquisitions.
The Group has established a strong platformwithstrongprotdevelopmentandcash
conversion which has reduced net debt toless than 1 x EBITDA. Competitive long-term
banking facilities and a solid asset base bothsupport the Group’s development.
Richard Whiting
Chief ExecutiveJohnathan Ford
Finance Director
7/29/2019 NWF Group Plc Annual Report and Accounts 2011
http://slidepdf.com/reader/full/nwf-group-plc-annual-report-and-accounts-2011 11/72
NWF Group plc Annual Report and Accounts 2011 | 09
A b o u t N
WF
C or p or a t e G ov er n an c
e
F i n an c i al S t a t em en t s
N o t i c e o
f A GM
Group revenue
£463.8m +22.1%
Group operating prot
£9.3m +3.3%
Net debt
£11.3m -18.7%
2011 £463.8m 2011 £9.3m 2011 £11.3m
2010 £379.8m 2010 £9.0m 2010 £13.9m
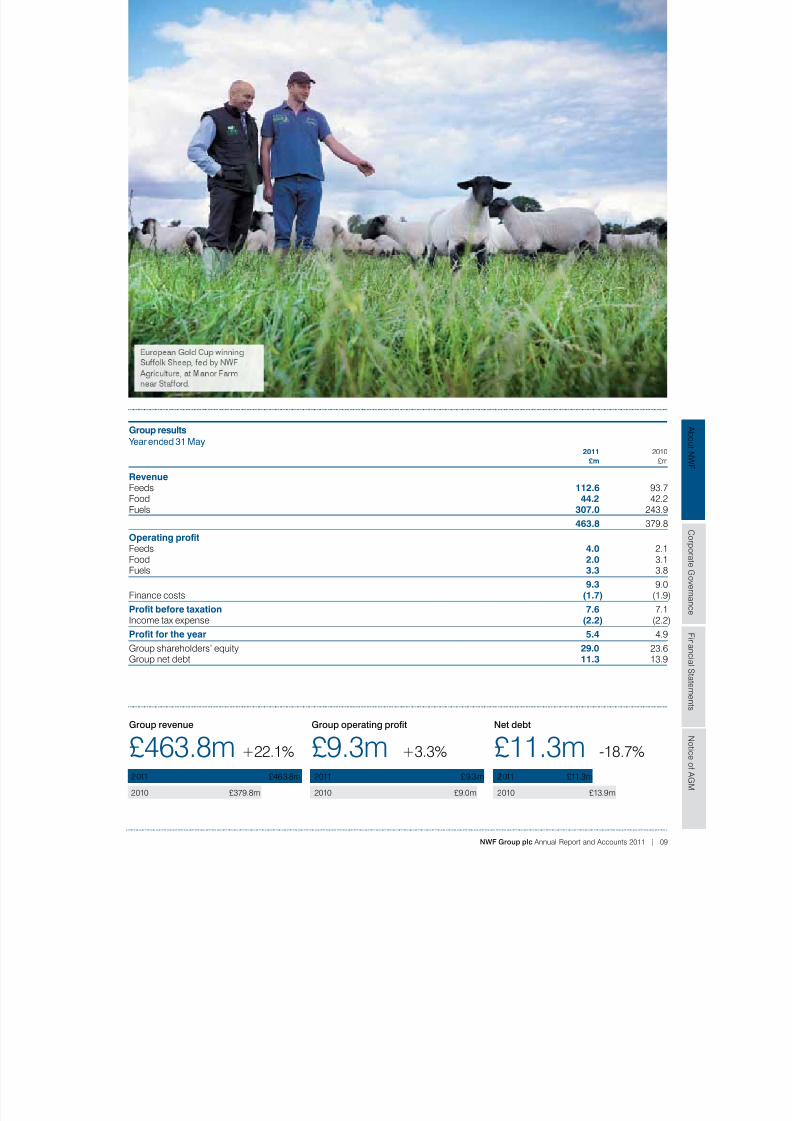
Group results
Year ended 31 May 2011 2010
£m £m
Revenue Feeds 112.6 93.7Food 44.2 42.2Fuels 307.0 243.9
463.8 379.8
Operating prot Feeds 4.0 2.1Food 2.0 3.1Fuels 3.3 3.8
9.3 9.0Finance costs (1.7) (1.9)
Prot before taxation 7.6 7.1
Income tax expense (2.2) (2.2)
Prot for the year 5.4 4.9
Group shareholders’ equity 29.0 23.6Group net debt 11.3 13.9
7/29/2019 NWF Group Plc Annual Report and Accounts 2011
http://slidepdf.com/reader/full/nwf-group-plc-annual-report-and-accounts-2011 12/72
10 | NWF Group plc Annual Report and Accounts 2011
Feeds
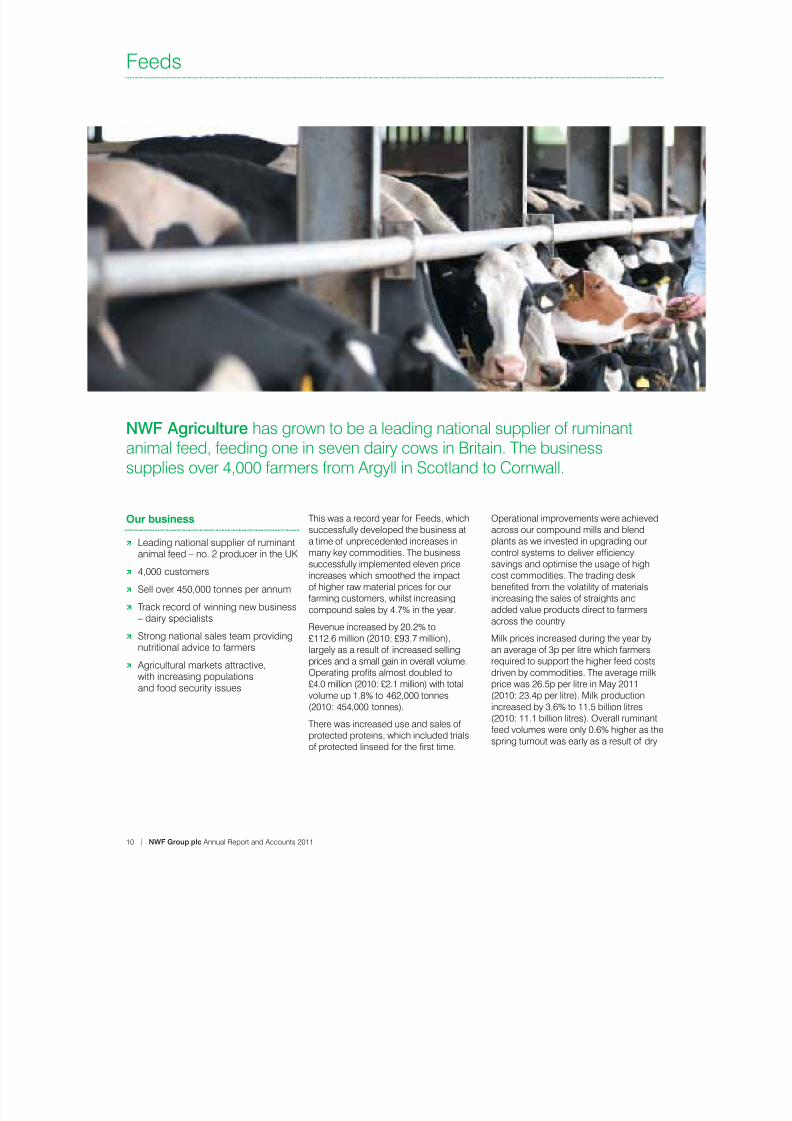
NWF Agriculture has grown to be a leading national supplier of ruminantanimal feed, feeding one in seven dairy cows in Britain. The business
supplies over 4,000 farmers from Argyll in Scotland to Cornwall.
This was a record year for Feeds, whichsuccessfully developed the business ata time of unprecedented increases inmany key commodities. The businesssuccessfully implemented eleven priceincreases which smoothed the impactof higher raw material prices for ourfarming customers, whilst increasingcompound sales by 4.7% in the year.
Revenue increased by 20.2% to£112.6 million (2010: £93.7 million),largely as a result of increased sellingprices and a small gain in overall volume.Operatingprotsalmostdoubledto
£4.0 million (2010: £2.1 million) with totalvolume up 1.8% to 462,000 tonnes(2010: 454,000 tonnes).
There was increased use and sales ofprotected proteins, which included trialsofprotectedlinseedforthersttime.
Operational improvements were achievedacross our compound mills and blendplants as we invested in upgrading ourcontrolsystemstodeliverefciency
savings and optimise the usage of highcost commodities. The trading deskbenetedfromthevolatilityofmaterials
increasing the sales of straights andadded value products direct to farmersacross the country.
Milk prices increased during the year byan average of 3p per litre which farmersrequired to support the higher feed costsdriven by commodities. The average milkprice was 26.5p per litre in May 2011(2010: 23.4p per litre). Milk productionincreased by 3.6% to 11.5 billion litres(2010: 11.1 billion litres). Overall ruminantfeed volumes were only 0.6% higher as thespring turnout was early as a result of dry
Our business
b Leading national supplier of ruminantanimal feed – no. 2 producer in the UK
b 4,000 customers
b Sell over 450,000 tonnes per annum
b Track record of winning new business
– dairy specialists
b Strong national sales team providingnutritional advice to farmers
b Agricultural markets attractive,with increasing populationsand food security issues
7/29/2019 NWF Group Plc Annual Report and Accounts 2011
http://slidepdf.com/reader/full/nwf-group-plc-annual-report-and-accounts-2011 13/72
NWF Group plc Annual Report and Accounts 2011 | 11
A b o u t N
WF
C or p or a t e G ov er n an c
e
F i n an c i al S t a t em en t s
N o t i c e o
f A GM
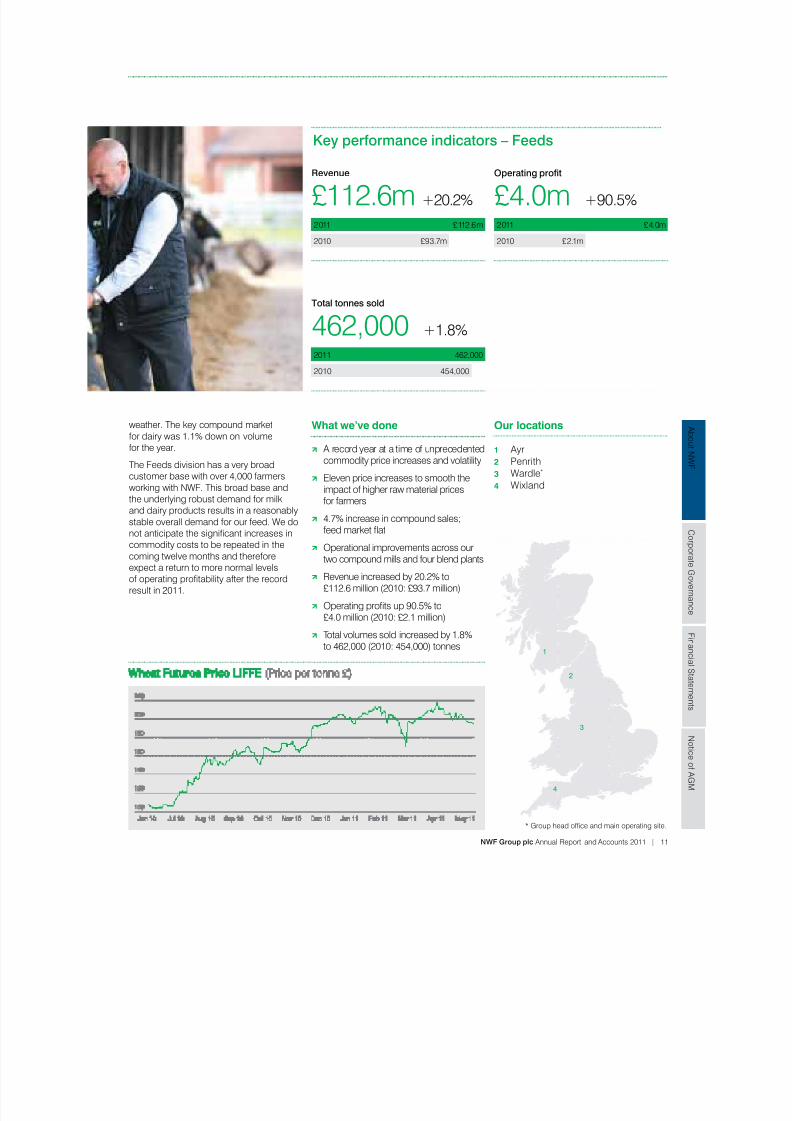
Total tonnes sold
462,000 +1.8%
Revenue
£112.6m +20.2%
Operating prot
£4.0m +90.5%
2011 462,000
2011 £112.6m 2011 £4.0m
2010 454,000
2010 £93.7m 2010 £2.1m
Key performance indicators – Feeds
weather. The key compound marketfor dairy was 1.1% down on volumefor the year.
The Feeds division has a very broadcustomer base with over 4,000 farmersworking with NWF. This broad base andthe underlying robust demand for milkand dairy products results in a reasonablystable overall demand for our feed. We donotanticipatethesignicantincreasesin
commodity costs to be repeated in thecoming twelve months and thereforeexpect a return to more normal levelsofoperatingprotabilityaftertherecord
result in 2011.
What we’ve done
b A record year at a time of unprecedented
commodity price increases and volatility b Eleven price increases to smooth the
impact of higher raw material pricesfor farmers
b 4.7% increase in compound sales;feedmarketat
b Operational improvements across ourtwo compound mills and four blend plants
b Revenue increased by 20.2% to£112.6 million (2010: £93.7 million)
b Operatingprotsup90.5%to
£4.0 million (2010: £2.1 million)
b Total volumes sold increased by 1.8%to 462,000 (2010: 454,000) tonnes
Our locations
1 Ayr
2 Penrith3 Wardle*
4 Wixland
1
2
3
4
*Groupheadofceandmainoperatingsite.
7/29/2019 NWF Group Plc Annual Report and Accounts 2011
http://slidepdf.com/reader/full/nwf-group-plc-annual-report-and-accounts-2011 14/72
12 | NWF Group plc Annual Report and Accounts 2011
Food
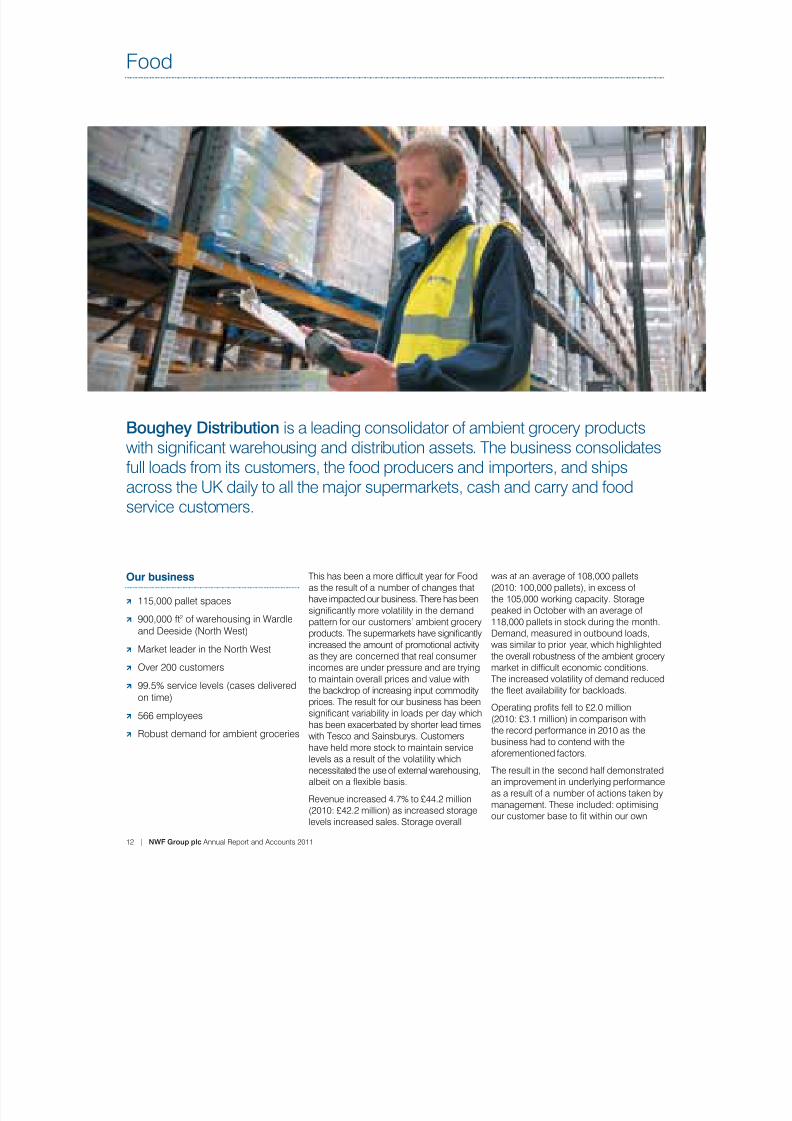
Boughey Distribution is a leading consolidator of ambient grocery productswithsignicantwarehousinganddistributionassets.Thebusinessconsolidates
full loads from its customers, the food producers and importers, and shipsacross the UK daily to all the major supermarkets, cash and carry and foodservice customers.
ThishasbeenamoredifcultyearforFood
as the result of a number of changes thathave impacted our business. There has beensignicantlymorevolatilityinthedemand
pattern for our customers’ ambient groceryproducts.Thesupermarketshavesignicantly
increased the amount of promotional activityas they are concerned that real consumerincomes are under pressure and are tryingto maintain overall prices and value withthe backdrop of increasing input commodityprices. The result for our business has beensignicantvariabilityinloadsperdaywhich
has been exacerbated by shorter lead timeswith Tesco and Sainsburys. Customershave held more stock to maintain servicelevels as a result of the volatility which
necessitated the use of external warehousing,albeitonaexiblebasis.
Revenue increased 4.7% to £44.2 million(2010: £42.2 million) as increased storagelevels increased sales. Storage overall
was at an average of 108,000 pallets(2010: 100,000 pallets), in excess ofthe 105,000 working capacity. Storagepeaked in October with an average of118,000 pallets in stock during the month.Demand, measured in outbound loads,was similar to prior year, which highlightedthe overall robustness of the ambient grocerymarketindifculteconomicconditions.
The increased volatility of demand reducedtheeetavailabilityforbackloads.
Operatingprotsfellto£2.0million
(2010: £3.1 million) in comparison withthe record performance in 2010 as thebusiness had to contend with theaforementioned factors.
The result in the second half demonstratedan improvement in underlying performanceas a result of a number of actions taken bymanagement. These included: optimisingourcustomerbasetotwithinourown
Our business
b 115,000 pallet spaces
b 900,000 ft2 of warehousing in Wardleand Deeside (North West)
b Market leader in the North West
b Over 200 customers
b 99.5% service levels (cases deliveredon time)
b 566 employees
b Robust demand for ambient groceries
7/29/2019 NWF Group Plc Annual Report and Accounts 2011
http://slidepdf.com/reader/full/nwf-group-plc-annual-report-and-accounts-2011 15/72
NWF Group plc Annual Report and Accounts 2011 | 13
A b o u t N
WF
C or p or a t e G ov er n an c
e
F i n an c i al S t a t em en t s
N o t i c e o
f A GM
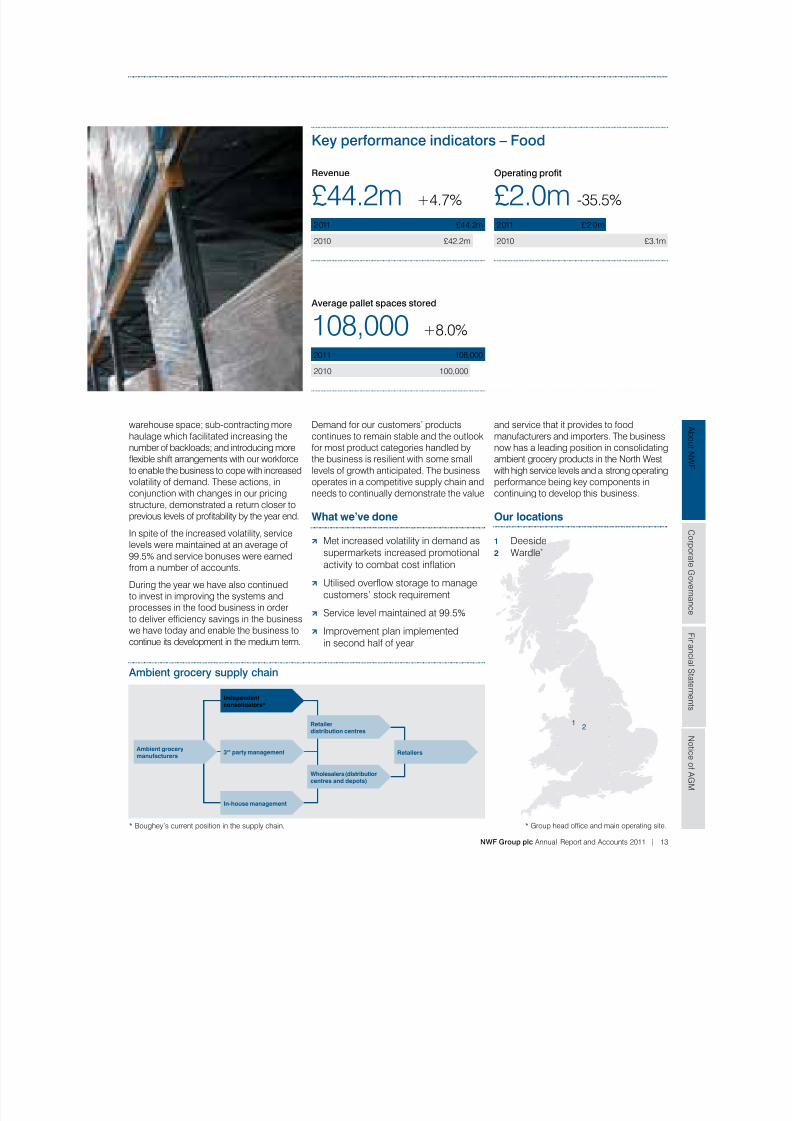
Average pallet spaces stored
108,000 +8.0%
Revenue
£44.2m +4.7%
Operating prot
£2.0m -35.5%
2011 108,000
2011 £44.2m 2011 £2.0m
2010 100,000
2010 £42.2m 2010 £3.1m
Key performance indicators – Food
warehouse space; sub-contracting morehaulage which facilitated increasing thenumber of backloads; and introducing more
exibleshiftarrangementswithourworkforceto enable the business to cope with increasedvolatility of demand. These actions, inconjunction with changes in our pricingstructure, demonstrated a return closer topreviouslevelsofprotabilitybytheyearend.
In spite of the increased volatility, servicelevels were maintained at an average of99.5% and service bonuses were earnedfrom a number of accounts.
During the year we have also continuedto invest in improving the systems andprocesses in the food business in order
todeliverefciencysavingsinthebusinesswe have today and enable the business tocontinue its development in the medium term.
What we’ve done
b Met increased volatility in demand assupermarkets increased promotionalactivitytocombatcostination
b Utilisedoverowstoragetomanagecustomers’ stock requirement
b
Service level maintained at 99.5% b Improvement plan implemented
in second half of year
Our locations
1 Deeside2 Wardle*
12
Demand for our customers’ productscontinues to remain stable and the outlookfor most product categories handled by
the business is resilient with some smalllevels of growth anticipated. The businessoperates in a competitive supply chain andneeds to continually demonstrate the value
and service that it provides to foodmanufacturers and importers. The businessnow has a leading position in consolidating
ambient grocery products in the North West,with high service levels and a strong operatingperformance being key components incontinuing to develop this business.
*Groupheadofceandmainoperatingsite.
Ambient grocery supply chain
* Boughey’s current position in the supply chain.
Ambient grocerymanufacturers
3rd party management
In‑house management
Independentconsolidators*
Wholesalers (distributioncentres and depots)
Retailerdistribution centres
Retailers
7/29/2019 NWF Group Plc Annual Report and Accounts 2011
http://slidepdf.com/reader/full/nwf-group-plc-annual-report-and-accounts-2011 16/72
14 | NWF Group plc Annual Report and Accounts 2011
Fuels
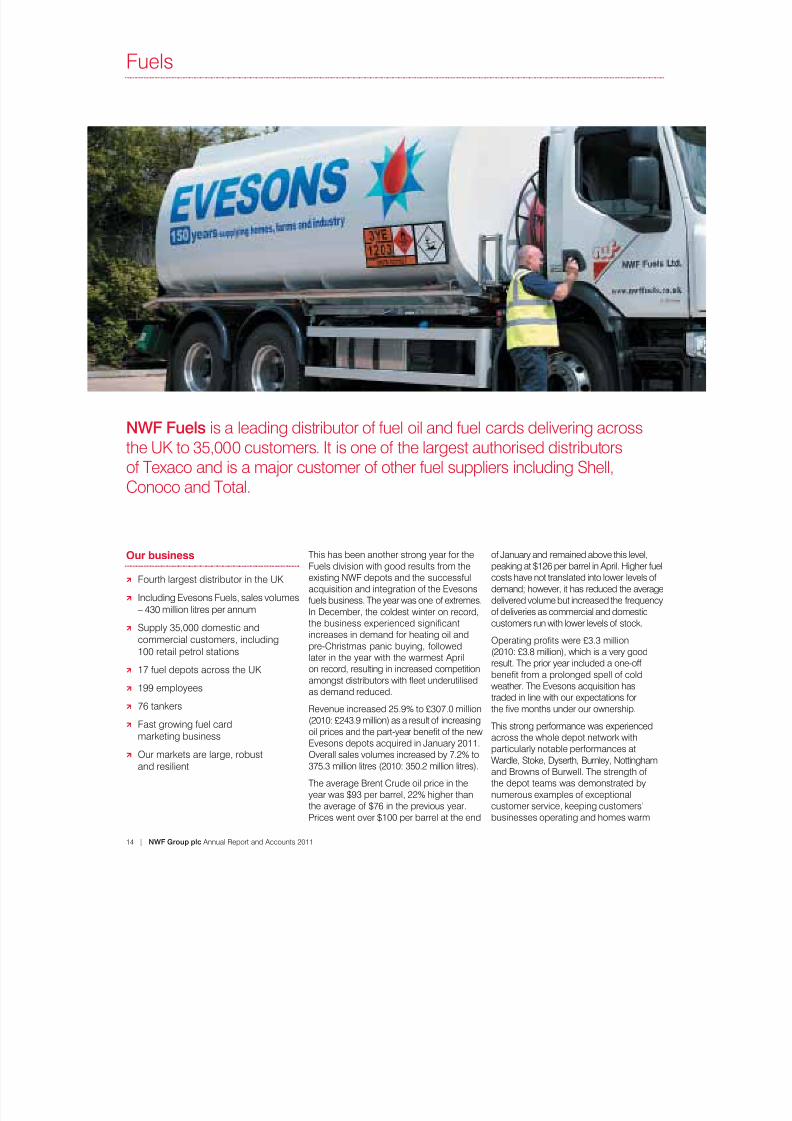
NWF Fuels is a leading distributor of fuel oil and fuel cards delivering acrossthe UK to 35,000 customers. It is one of the largest authorised distributors
of Texaco and is a major customer of other fuel suppliers including Shell,Conoco and Total.
This has been another strong year for theFuels division with good results from theexisting NWF depots and the successfulacquisition and integration of the Evesonsfuels business. The year was one of extremes.In December, the coldest winter on record,thebusinessexperiencedsignicant
increases in demand for heating oil andpre-Christmas panic buying, followedlater in the year with the warmest Aprilon record, resulting in increased competitionamongstdistributorswitheetunderutilised
as demand reduced.
Revenue increased 25.9% to £307.0 million(2010: £243.9 million) as a result of increasingoilpricesandthepart-yearbenetofthenew
Evesons depots acquired in January 2011.Overall sales volumes increased by 7.2% to375.3 million litres (2010: 350.2 million litres).
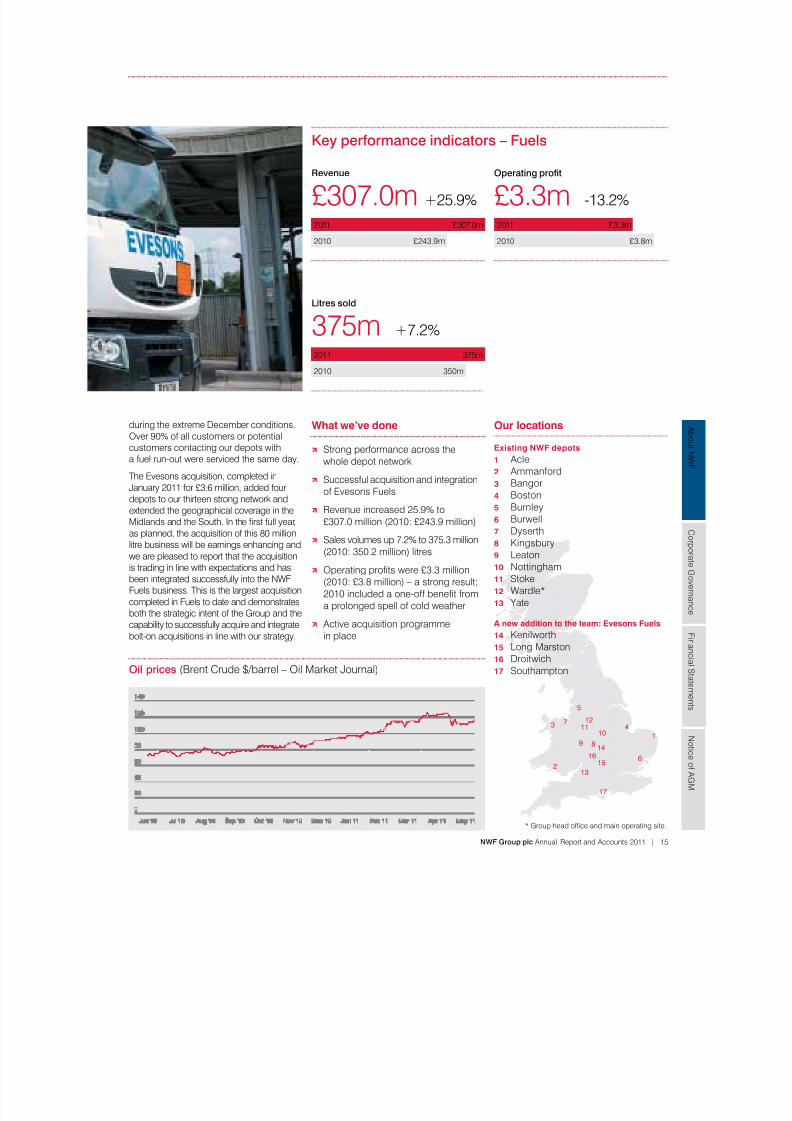
The average Brent Crude oil price in theyear was $93 per barrel, 22% higher thanthe average of $76 in the previous year.Prices went over $100 per barrel at the end
of January and remained above this level,peaking at $126 per barrel in April. Higher fuelcosts have not translated into lower levels ofdemand; however, it has reduced the averagedelivered volume but increased the frequencyof deliveries as commercial and domesticcustomers run with lower levels of stock.
Operatingprotswere£3.3million
(2010: £3.8 million), which is a very goodresult. The prior year included a one-offbenetfromaprolongedspellofcold
weather. The Evesons acquisition hastraded in line with our expectations forthevemonthsunderourownership.
This strong performance was experiencedacross the whole depot network withparticularly notable performances atWardle, Stoke, Dyserth, Burnley, Nottingham
and Browns of Burwell. The strength ofthe depot teams was demonstrated bynumerous examples of exceptionalcustomer service, keeping customers’businesses operating and homes warm
Our business
b Fourth largest distributor in the UK
b Including Evesons Fuels, sales volumes– 430 million litres per annum
b Supply 35,000 domestic andcommercial customers, including100 retail petrol stations
b 17 fuel depots across the UK
b 199 employees
b 76 tankers
b Fast growing fuel cardmarketing business
b Our markets are large, robust
and resilient
7/29/2019 NWF Group Plc Annual Report and Accounts 2011
http://slidepdf.com/reader/full/nwf-group-plc-annual-report-and-accounts-2011 17/72
NWF Group plc Annual Report and Accounts 2011 | 15
A b o u t N
WF
C or p or a t e G ov er n an c
e
F i n an c i al S t a t em en t s
N o t i c e o
f A GM
Litres sold
375m +7.2%
Revenue
£307.0m +25.9%
Operating prot
£3.3m -13.2%
2011 375m
2011 £307.0m 2011 £3.3m
2010 350m
2010 £243.9m 2010 £3.8m
Key performance indicators – Fuels
during the extreme December conditions.Over 90% of all customers or potentialcustomers contacting our depots with
a fuel run-out were serviced the same day.The Evesons acquisition, completed inJanuary 2011 for £3.6 million, added fourdepots to our thirteen strong network andextended the geographical coverage in theMidlandsandtheSouth.Intherstfullyear,
as planned, the acquisition of this 80 millionlitre business will be earnings enhancing andwe are pleased to report that the acquisitionis trading in line with expectations and hasbeen integrated successfully into the NWFFuels business. This is the largest acquisitioncompleted in Fuels to date and demonstrates
both the strategic intent of the Group and thecapability to successfully acquire and integratebolt-on acquisitions in line with our strategy.
What we’ve done
b Strong performance across the
whole depot network
b Successful acquisition and integrationof Evesons Fuels
b Revenue increased 25.9% to£307.0 million (2010: £243.9 million)
b Sales volumes up 7.2% to 375.3 million(2010: 350.2 million) litres
b Operatingprotswere£3.3million(2010: £3.8 million) – a strong result;2010includedaone-offbenetfroma prolonged spell of cold weather
b Active acquisition programmein place
1
2
3 4
5
6
7
89
1011
12
13
15
17
1614
*Groupheadofceandmainoperatingsite.
Our locations
Existing NWF depots
1 Acle2 Ammanford3 Bangor4 Boston5 Burnley6 Burwell7 Dyserth8 Kingsbury9 Leaton10 Nottingham11 Stoke12 Wardle*13 Yate
A new addition to the team: Evesons Fuels
14 Kenilworth15 Long Marston16 Droitwich17 SouthamptonOil prices (Brent Crude $/barrel – Oil Market Journal)

7/29/2019 NWF Group Plc Annual Report and Accounts 2011
http://slidepdf.com/reader/full/nwf-group-plc-annual-report-and-accounts-2011 18/72
16 | NWF Group plc Annual Report and Accounts 2011
Businessandnancialreviewcontinued
Group results
Group revenue increased by 22.1%to £463.8 million (2010: £379.8 million).Operating profit was £9.3 million(2010: £9.0 million), a 3.3% increase.
Totalnetnancecostsdecreasedfrom
£1.9 million in 2010 to £1.7 million in 2011.TheIAS19netnancecostinrespectof
denedbenetpensionschemesremained
atat£0.5million.Thedecreaseinothernancecoststo
£1.2 million (2010: £1.4 million) is primarilydue to lower interest rate hedging costsfollowing the expiry of an interest ratehedging instrument in December 2010.
Interest cover (excluding IAS 19 net pensionnancecosts)increasedto7.8times
(2010: 6.4 times).
Thetaxchargehasremainedatat
£2.2 million in 2011 (2010: £2.2 million).The 2011 tax charge represents an effective
tax rate of 28.9% which compares to aneffective rate of 31.0% in 2010. The reductionin effective rate relates to the reduction in themain rate of corporation tax rate from 28.0%to 26.0% which reduced the Group’s deferredtax provisions. The Group’s future underlyingrate of tax is expected to remain above thestandard rate due to its ongoing level ofdisallowable expenditure.
Basic earnings per share increased by 10.6%to 11.5p (2010: 10.4p). Diluted earningsper share increased by 9.6% to 11.4p(2010: 10.4p).
Balance sheet AsaresultoftheGroup’sstrongprot
performance during the year and areductionintheGroup’sdenedbenet
pension scheme liabilities, Group net assetsincreased to £29.0 million at 31 May 2011(2010: £23.6 million).
Tangible and intangible assets increasedfollowing the acquisition of Evesons FuelsLimited and as the Group continued toinvestinnewITsystemsandeet.
Net working capital reduced to £8.5 millionat 31 May 2011 (2010: £11.0 million) as
the Group continued to focus on cashmanagement. Within net working capital,trade and other receivables increasedto £56.6 million (2010: £45.8 million);however, trade and other payables increasedto £51.8 million (2010: £37.8 million) asa result of the Evesons Fuels Limitedacquisition and increased commodityprices in Feeds and Fuels.
The gross liability on the Group’sdefined benefit pension schemesreduced to £11.3 million at 31 May 2011(2010: £12.3 million). The value of pension
scheme assets grew to £29.1 million(2010: £23.4 million), due in part to theinclusion of £3.0 million of assets (2010: £Nil)from the Evesons Fuels Limited acquisitionand an improvement in equity values.The value of the pension scheme liabilitiesincreased to £40.4 million at 31 May 2011(2010: £35.7 million) due in part to theinclusion of £3.5 million of liabilities(2010: £Nil) from the Evesons Fuels Limitedacquisition and a slight reduction in thediscount rate used to calculate the presentvalue of the future pension obligations.
Total Group net debt fell to £11.3 millionat 31 May 2011 (2010: £13.9 million)as the Group continued to focus oncash management.
Cash ow and banking facilities
Cash management continuesto be a major priority for the Group.
Net cash generated from operating activitieswas £13.3 million (2010: £10.9 million).Operating cash flow before workingcapital movements was £13.2 million(2010: £12.1 million). In addition, therewas a favourable overall movement
in net working capital of £3.8 million(2010: £2.0 million) mainly as a result of lowerworking capital within Feeds and Fuels.
Cash used to fund capital expenditure(net of disposal proceeds) increased to£4.7 million (2010: £3.6 million) as the Groupinvested £1.4 million (2010: £0.5 million)in new Food IT systems, £1.3 million(2010: £1.2 million) in fuel tankers and£0.7 million (2010: £0.1 million) in newFood trucks and trailers.
In January 2011 the Group completedthe acquisition of Evesons Fuels Limited.
The cash consideration paid on completionto acquire Evesons was £3.6 million. Togetherwith a bank overdraft of £0.1 million, acquiredwith the business, this resulted in a totalcashoutowof£3.7million.
There was an overall net increase in cashand cash equivalents of £1.0 million in theyear (2010: £1.2 million).
The Group has an agreement withThe Royal Bank of Scotland Group forsenior credit facilities totalling £51.0 million.With the exception of the bank overdraft
facility of £1.0 million, which is renewedannually, these facilities are committedthrough to October 2013. Included in thetotal facility of £51.0 million, the Grouphas an invoice discounting facility, theavailability of which is dependent on the
Group results
Year ended 31 May 2011 2010
£m £m
Revenue 463.8 379.8Operating expenses (454.5) (370.8)
Operating prot 9.3 9.0
Netnancecosts: Netnancecostinrespectofdenedbenetpensionschemes (0.5) (0.5)Othernancecosts (1.2) (1.4)
(1.7) (1.9)
Prot before taxation 7.6 7.1Income tax expense (2.2) (2.2)
Prot for the year 5.4 4.9
7/29/2019 NWF Group Plc Annual Report and Accounts 2011
http://slidepdf.com/reader/full/nwf-group-plc-annual-report-and-accounts-2011 19/72
NWF Group plc Annual Report and Accounts 2011 | 17
A b o u t N
WF
C or p or a t e G ov er n an c
e
F i n an c i al S t a t em en t s
N o t i c e o
f A GM
level of trade receivables available forrenancing,andissubjecttoamaximum
drawdown of £40.0 million.
The new bank facilities above are providedsubject to conventional banking covenants.
Financial risk management
The Group’s operations expose it to a varietyofnancialrisks:pricerisk;interestraterisk;
credit risk; and liquidity risk. There is nosignicantforeignexchangeriskinrespect
of the Group’s operations.
The Group’s policy in respect of managingnancialriskhasnotchangedsignicantly
in the year ended 31 May 2011.
Price risk
The Group is exposed to commodity pricerisk principally in respect of certain rawmaterials in its Feeds business andoil-related products in the Fuels business.
The Feeds business enters into forward
supply contracts in order to manage theimpact of price movements on its grossmargin. The fair value of forward supplycontracts recognised in the balance sheetin accordance with IAS 39 ‘FinancialInstruments: Recognition and Measurement’is £0.2 million (2010: £0.1 million).
The Group has not designated any of thesecontracts as hedging instruments duringthe period under review. As a result, changesin the fair value of non-hedging forwardsupply contracts amounting to £0.1 millionhave been credited (2010: £0.1 million
credited) to the income statement in the year.The Fuel division’s oil-related products aresubject to changes in the world commodityprice for crude oil. However, the relatively
low stockholding maintained and daily pricemonitoring systems used to determine sellingprices enable the business to effectivelymanage the risk of gross margin erosion.Forward supply contracts are not utilisedby this business.
Interest rate risk
The Group has used interest rate derivativesto manage its exposure to interest rate
increases on its borrowings. At 31 May 2011,the Group held no interest rate derivatives. At 31 May 2010, the Group held one interestrate swap with a notional principal amountof£15.0millionandaxedannualinterest
rate of 5.045% for the 18 months ended31 December 2010. This instrument wasdesignatedandeffectiveasacashow
hedge for the entire period from inceptionto its contract end date of 31 December 2010.
The fair value of the swap held at31 May 2010 was estimated at £0.3 millionin the bank’s favour. The fair value loss
transferred from equity to the incomestatement in the year ended 31 May 2011was £0.3 million (2010: £0.6 million).
Credit risk
Where appropriate, relevant credit checksare performed on potential customers beforesales are made. The amount of exposureto any individual customer is controlledby means of a credit limit that is monitoredregularly by management and, in thecaseofananciallymaterialvalue,bythe
Executive Directors. In addition, the Fuelsbusiness maintains credit insurance for
certain higher value accounts in ordertomanagethepotentialnancialloss
incurred on certain bad debts.
Liquidity risk
The Group actively maintains a mixture ofmedium-termandshort-termdebtnance,
which is designed to ensure that it has accesstosufcientavailablefundsforongoing
working capital needs, as well as plannedcapital investment and expansion generally.Theamountofdebtnancerequiredis
reviewed at least annually by the Directors.
Going concernWith effect from 1 July 2010, the Grouphas a new agreement with The Royal Bankof Scotland Group for senior credit facilitiestotalling £51.0 million. With the exceptionof the bank overdraft facility of £1.0 million,which is renewed annually, these facilitiesare committed until 31 October 2013.
Accordingly, the Directors have a reasonableexpectation that the Company and the Grouphave adequate resources to continue inoperational existence for the foreseeablefuture. Thus, they continue to adopt the
going concern basis of accounting inpreparingtheannualnancialstatements.
Share price
The market price per share of theCompany’s shares at 31 May 2011 was121.3p (2010: 85.0p) and the range ofmarket prices during the year was between82.0p and 122.0p.
Richard Whiting Johnathan FordChief Executive Finance Director
9 August 2011
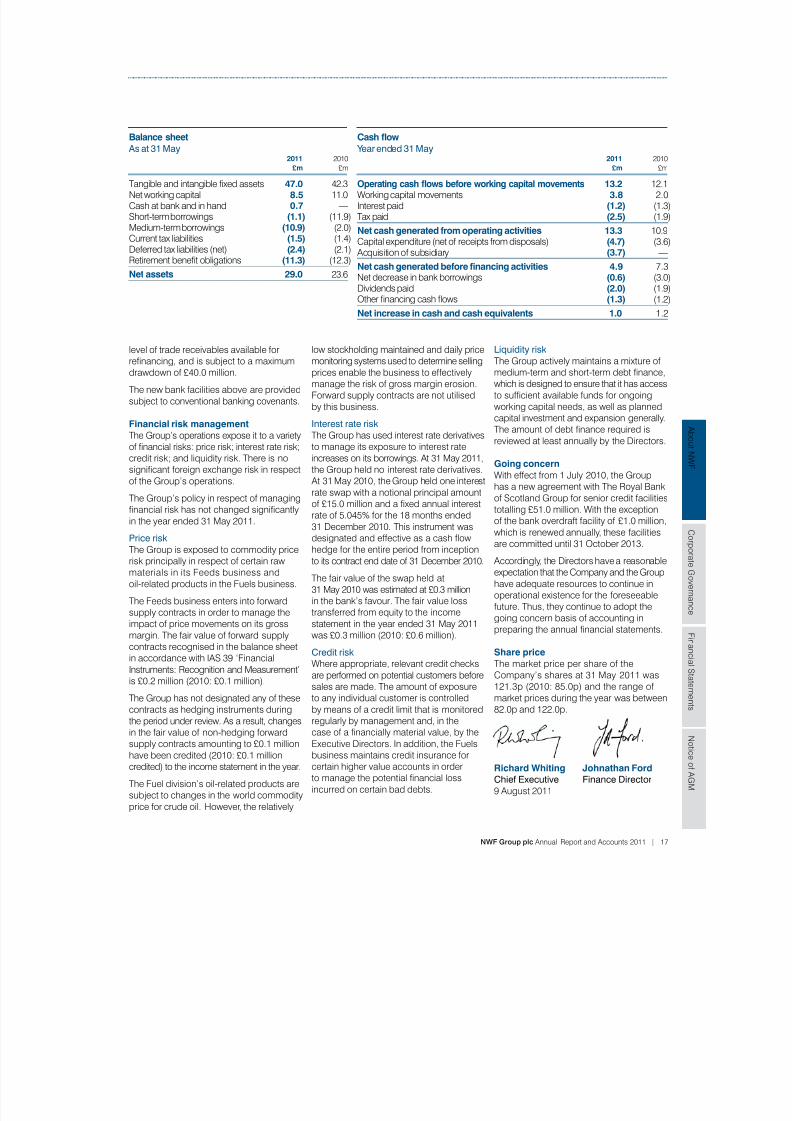
Balance sheet
As at 31 May 2011 2010
£m £m
Tangibleandintangiblexedassets 47.0 42.3Net working capital 8.5 11.0Cash at bank and in hand 0.7 —Short-term borrowings (1.1) (11.9)Medium-term borrowings (10.9) (2.0)Current tax liabilities (1.5) (1.4)Deferred tax liabilities (net) (2.4) (2.1)Retirementbenetobligations (11.3) (12.3)
Net assets 29.0 23.6
Cash ow
Year ended 31 May 2011 2010
£m £m
Operating cash ows before working capital movements 13.2 12.1Working capital movements 3.8 2.0Interest paid (1.2) (1.3)Tax paid (2.5) (1.9)
Net cash generated from operating activities 13.3 10.9Capital expenditure (net of receipts from disposals) (4.7) (3.6) Acquisition of subsidiary (3.7) —
Net cash generated before nancing activities 4.9 7.3Net decrease in bank borrowings (0.6) (3.0)Dividends paid (2.0) (1.9)Othernancingcashows (1.3) (1.2)
Net increase in cash and cash equivalents 1.0 1.2

7/29/2019 NWF Group Plc Annual Report and Accounts 2011
http://slidepdf.com/reader/full/nwf-group-plc-annual-report-and-accounts-2011 20/72
18 | NWF Group plc Annual Report and Accounts 2011
Board of directors
John Acornley 57
Senior Non‑Executive Director
Chairman of Audit Committee
Joined the Board in 2001. Extensive publicand private company experience at boardlevel. Currently non-executive chairman oftwo privately owned companies.
David Southworth 62
Non‑Executive Director
Chairman of Remuneration Committee
Joined the Board in 2006. Previously chiefexecutive and chairman of Skillsgroup plc.Currently non-executive chairman of threebusinesses in diverse market sectors.
Johnathan Ford 41
Finance Director
Joined as Finance Director in March 2009.
PreviouslydivisionalnancedirectoroftheEmergency Services Division of listedsupport services company, Homeserve PlcandheadofcorporatenanceatKiddePlc.
Richard Whiting 47
Chief Executive
Joined in October 2007. Previously group
nancedirectorofHeywoodWilliamsGroupplc, after joining as business developmentdirector from Brand-Rex Ltd, where he wasmanaging director of the datacom division.
Mark Hudson 64
Non‑Executive Chairman of the Board
Joined the Board in 1985, became Chairman
in 2006. An agricultural business adviserand dairy farmer. Past president of the CLA,past chairman of the Game and WildlifeConservation Trust and member of council,Duchy of Lancaster.

7/29/2019 NWF Group Plc Annual Report and Accounts 2011
http://slidepdf.com/reader/full/nwf-group-plc-annual-report-and-accounts-2011 21/72
NWF Group plc Annual Report and Accounts 2011 | 19
A b o u t N
WF
C or p or a t e G ov er n an c
e
F i n an c i al S t a t em en t s
N o t i c e o
f A GM
Senior management and advisers
Advisers
RegistrarsCapita RegistrarsNorthern HouseWoodsome ParkFenay BridgeHudderseldHD80GA
Auditors
PricewaterhouseCoopers LLP101 Barbirolli SquareLower Mosley StreetManchester M2 3PW
Bankers
The Royal Bank of ScotlandCorporate Banking6th Floor1SpinningeldsSquare Manchester M3 3AP
Nominated adviser
and broker
Peel Hunt LLP111 Old Broad StreetLondon EC2N 1PH
Solicitors
Brabners Chaffe Street LLPHorton HouseExchange FlagsLiverpool L2 3YL
Financial PR
Tavistock Communications Ltd131 Finsbury PavementLondon EC2A 1NT
Registered ofce
NWF Group plcWardleNantwich
Cheshire CW5 6BP
Registered number
2264971
Keith Forster 51
Managing Director, Food
Appointed Managing Director of the
Food division in November 2004, havingjoined the Group in 2001. Previouslyheld senior positions in a number ofdistribution businesses.
David Warrington 55
Managing Director, Feeds
Appointed Managing Director of the Feeds
division in June 1995, having joined theGroup in 1993. Previously ran his ownfeed merchant business.
Kevin Kennerley 57
Managing Director, Fuels
Appointed Managing Director of the Fuelsdivision in November 1992, having joinedthe Group in 1978.
Company Secretary
Rob Andrew 48
Joined as Company Secretary in 2004. An experienced chartered secretary,previously assistant company secretaryof Iceland Frozen Foods plc.
7/29/2019 NWF Group Plc Annual Report and Accounts 2011
http://slidepdf.com/reader/full/nwf-group-plc-annual-report-and-accounts-2011 22/72
20 | NWF Group plc Annual Report and Accounts 2011
Directors’ report
for the year ended 31 May 2011
The Directors present their report together with the audited nancial statements of the Parent Company (‘the Company’) and theGroup for the year ended 31 May 2011.
Principal activities
The principal activities of the Group are the warehousing and distribution of ambient groceries, the manufacture and sale of animalfeeds and the sale and distribution of fuel oils.
On 17 January 2011, the Group acquired 100% of the share capital of Evesons Fuels Limited, a fuel distribution business, for a totalconsideration of £3.6 million. Further details of this acquisition can be found in note 10 of the Group nancial statements.
The subsidiary undertakings principally affecting the prots and net assets of the Group in the year are listed in note 5 of the ParentCompany nancial statements.
Business review and future developments
A review of the performance of the Group during the year, including principal risks and uncertainties, key performance indicators andcomments on future developments, is given in the Business and Financial Review on pages 8 to 17.
Results and dividends
The Group prot before taxation for the year ended 31 May 2011 amounted to £7.6 million (2010: £7.1 million). The prot for the yearattributable to equity shareholders was £5.4 million (2010: £4.9 million).
The Directors recommend a nal dividend for the year of 3.5p per share (2010: 3.3p) which, if approved at the Annual GeneralMeeting (‘AGM’), will be payable on 1 November 2011. Together with the interim dividend paid during the year of 1.0p per share(2010: 1.0p), this will result in a total dividend of 4.5p per share (2010: 4.3p) amounting to £2.1 million (2010: £2.0 million).
Financial risk management
Full details of the Group’s nancial risk management policies and nancial instruments are set out in note 20 of the Group nancial statements.
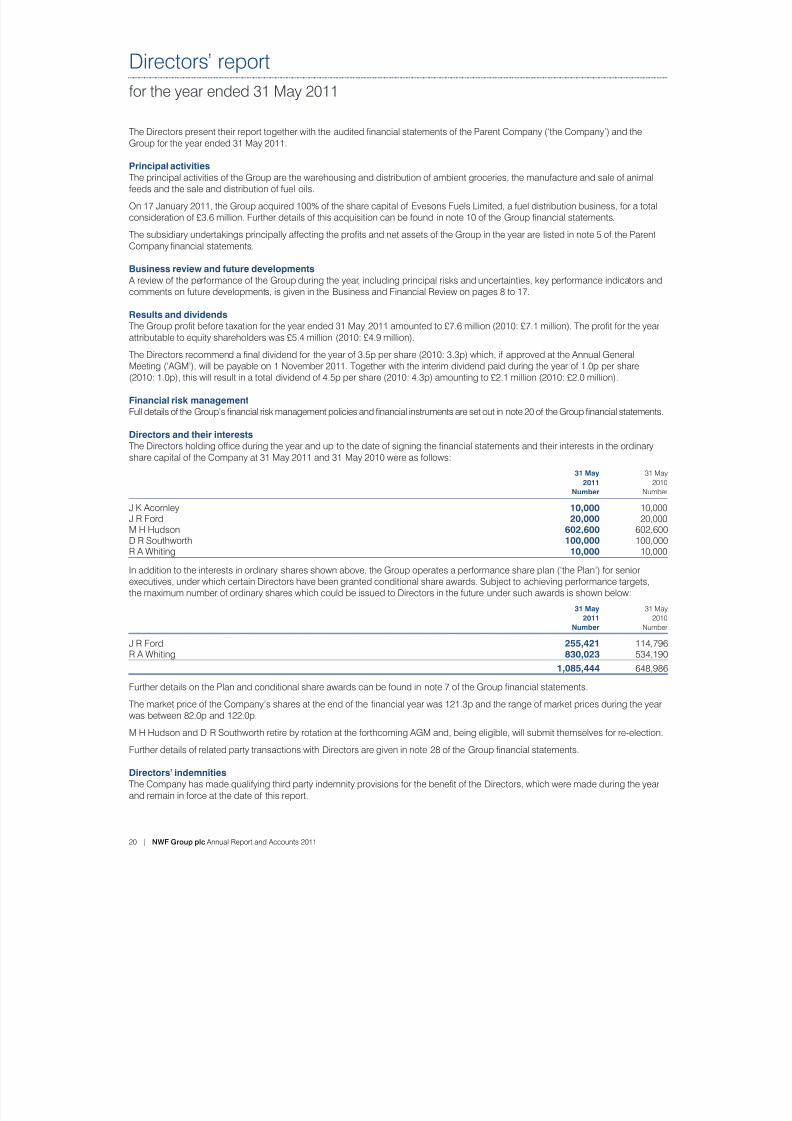
Directors and their interests
The Directors holding ofce during the year and up to the date of signing the nancial statements and their interests in the ordinaryshare capital of the Company at 31 May 2011 and 31 May 2010 were as follows:
31 May 31 May
2011 2010
Number Number
J K Acornley 10,000 10,000J R Ford 20,000 20,000M H Hudson 602,600 602,600D R Southworth 100,000 100,000R A Whiting 10,000 10,000
In addition to the interests in ordinary shares shown above, the Group operates a performance share plan (‘the Plan’) for seniorexecutives, under which certain Directors have been granted conditional share awards. Subject to achieving performance targets,the maximum number of ordinary shares which could be issued to Directors in the future under such awards is shown below:
31 May 31 May
2011 2010Number Number
J R Ford 255,421 114,796R A Whiting 830,023 534,190
1,085,444 648,986
Further details on the Plan and conditional share awards can be found in note 7 of the Group nancial statements.
The market price of the Company’s shares at the end of the nancial year was 121.3p and the range of market prices during the yearwas between 82.0p and 122.0p.
M H Hudson and D R Southworth retire by rotation at the forthcoming AGM and, being eligible, will submit themselves for re-election.
Further details of related party transactions with Directors are given in note 28 of the Group nancial statements.
Directors’ indemnitiesThe Company has made qualifying third party indemnity provisions for the benet of the Directors, which were made during the yearand remain in force at the date of this report.
7/29/2019 NWF Group Plc Annual Report and Accounts 2011
http://slidepdf.com/reader/full/nwf-group-plc-annual-report-and-accounts-2011 23/72
NWF Group plc Annual Report and Accounts 2011 | 21
A b o u t N
WF
C or p or a t e G ov er n an c
e
F i n an c i al S t a t em en t s
N o t i c e o
f A GM
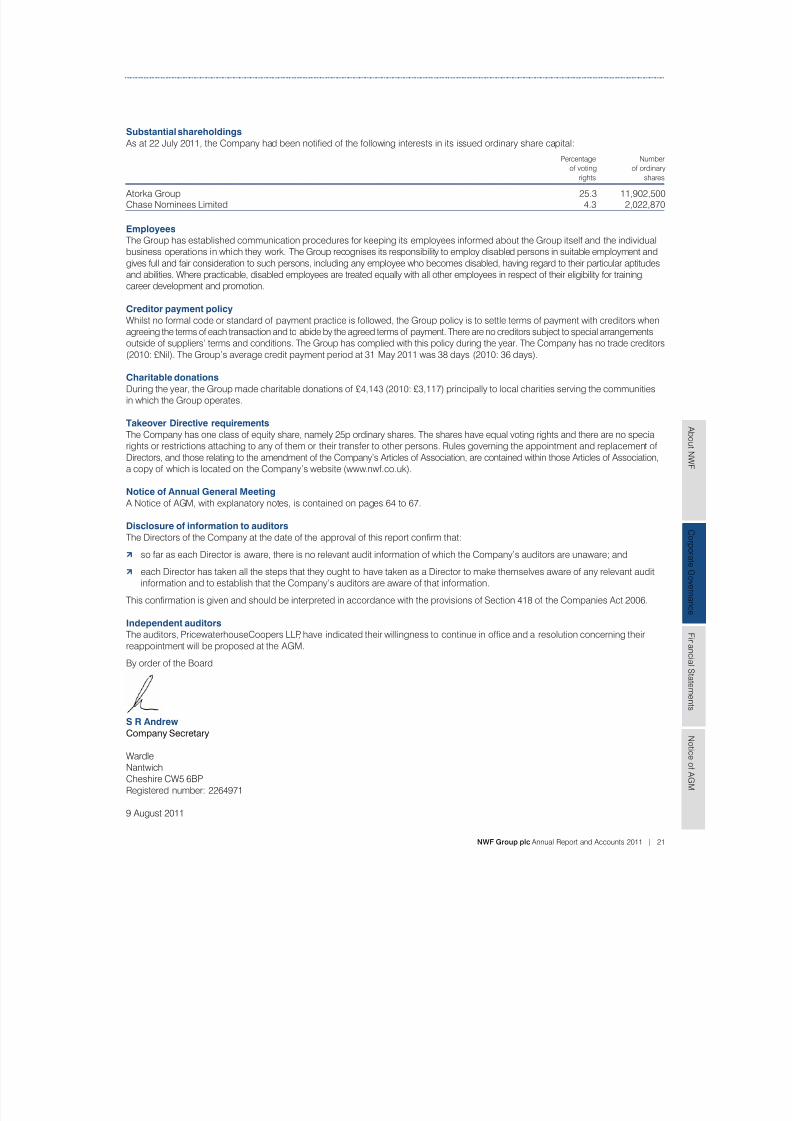
Substantial shareholdings
As at 22 July 2011, the Company had been notied of the following interests in its issued ordinary share capital:
Percentage Number
of voting of ordinary
rights shares
Atorka Group 25.3 11,902,500Chase Nominees Limited 4.3 2,022,870
Employees
The Group has established communication procedures for keeping its employees informed about the Group itself and the individualbusiness operations in which they work. The Group recognises its responsibility to employ disabled persons in suitable employment andgives full and fair consideration to such persons, including any employee who becomes disabled, having regard to their particular aptitudesand abilities. Where practicable, disabled employees are treated equally with all other employees in respect of their eligibility for training,career development and promotion.
Creditor payment policyWhilst no formal code or standard of payment practice is followed, the Group policy is to settle terms of payment with creditors whenagreeing the terms of each transaction and to abide by the agreed terms of payment. There are no creditors subject to special arrangementsoutside of suppliers’ terms and conditions. The Group has complied with this policy during the year. The Company has no trade creditors(2010: £Nil). The Group’s average credit payment period at 31 May 2011 was 38 days (2010: 36 days).
Charitable donations
During the year, the Group made charitable donations of £4,143 (2010: £3,117) principally to local charities serving the communitiesin which the Group operates.
Takeover Directive requirements
The Company has one class of equity share, namely 25p ordinary shares. The shares have equal voting rights and there are no specialrights or restrictions attaching to any of them or their transfer to other persons. Rules governing the appointment and replacement ofDirectors, and those relating to the amendment of the Company’s Articles of Association, are contained within those Articles of Association,a copy of which is located on the Company’s website (www.nwf.co.uk).
Notice of Annual General Meeting
A Notice of AGM, with explanatory notes, is contained on pages 64 to 67.
Disclosure of information to auditors
The Directors of the Company at the date of the approval of this report conrm that:
b so far as each Director is aware, there is no relevant audit information of which the Company’s auditors are unaware; and
b each Director has taken all the steps that they ought to have taken as a Director to make themselves aware of any relevant auditinformation and to establish that the Company’s auditors are aware of that information.
This conrmation is given and should be interpreted in accordance with the provisions of Section 418 of the Companies Act 2006.
Independent auditors
The auditors, PricewaterhouseCoopers LLP, have indicated their willingness to continue in ofce and a resolution concerning theirreappointment will be proposed at the AGM.
By order of the Board
S R Andrew
Company Secretary
Wardle
NantwichCheshire CW5 6BP Registered number: 2264971
9 August 2011
7/29/2019 NWF Group Plc Annual Report and Accounts 2011
http://slidepdf.com/reader/full/nwf-group-plc-annual-report-and-accounts-2011 24/72
22 | NWF Group plc Annual Report and Accounts 2011
Corporate governance statement
The Board is committed to achieving high standards of corporate governance, integrity and business ethics for all of the activitiesof the Group. Under the rules of AIM, the Group is not required to comply with the 2008 Combined Code on Corporate Governance
(‘the Code’). Nevertheless, the Board has taken steps to comply with the Code insofar as it can be applied practically and appropriately,given the size of the Group and the nature of its operations. The main ways in which it does this are described below.
Board composition and operation
The Board currently comprises two Executive and three Non-Executive Directors. The roles of Chairman and Chief Executive areseparated and clearly understood. The Chief Executive is responsible for the operating performance of the Group. A formal scheduleof matters requiring Group Board approval is maintained, covering such areas as Group strategy, approval of budgets, nancialresults, Board appointments and dividend policy. The Board normally meets once a month and additional meetings are called whenrequired. Comprehensive brieng papers are sent to all Directors prior to each scheduled Board meeting. Directors are able, ifnecessary, to take independent professional advice in the furtherance of their duties at the Company’s expense.
Due to the infrequency of senior appointments, the Board does not maintain a standing Nomination Committee but will form one asappropriate if required. The current Chief Executive’s and Group Finance Director’s appointments were approved by the Board, after receivinga recommendation from a committee of the Board consisting of the Non-Executive Directors that was formed specically for that purpose.
The committee undertook a comprehensive recruitment process and was assisted by independent external recruitment consultants.
The Board regularly conducts an appraisal of its own performance and that of each Director consisting of individual assessmentsusing prescribed questionnaires that are completed by all Directors. The results are reviewed and individual feedback given, by theSenior Non-Executive Director in respect of assessments of the Chairman and by the Chairman in respect of assessments of eachof the other Directors and of the Board as a whole.
All Directors are subject to retirement by rotation in accordance with the Articles of Association.
The service contracts of Executive Directors require one year’s notice or less.
Audit Committee
The Audit Committee consists of all three Non-Executive Directors. The Audit Committee met twice during the year and allmembers attended.
The Audit Committee has terms of reference in place which have been formally approved by the Board and will be made availableat the AGM and on the Company’s website. Its primary responsibilities include reviewing the effectiveness of the Group’s internalcontrol systems and monitoring the integrity of the Group’s nancial statements and external announcements of the Group’s results.
The Audit Committee also approves the appointment and remuneration of the Group’s external auditors and satises itself that theymaintain their independence regardless of any non-audit work performed by them.
The respective responsibilities of the Directors and external auditors in connection with the nancial statements are explained in theStatement of Directors’ Responsibilities on page 24 and the auditors’ reports on pages 25 and 56. Details of services provided by andfees payable to the auditors are shown in note 5 of the Group nancial statements.
PricewaterhouseCoopers LLP have been the Company’s external auditors for many years. The Audit Committee considers that therelationship with the auditors is working well and remains satised with their effectiveness. Accordingly, it has not consideredit necessary to date to require the rm to tender for the audit work. The auditors are required to rotate the audit partner responsiblefor the Group and subsidiary audits every ve years. The current audit partner was rst appointed in respect of the nancial yearended 31 May 2010. There are no contractual obligations restricting the Company’s choice of auditors.
Remuneration Committee
The Remuneration Committee consists of all three Non-Executive Directors. The Remuneration Committee met twice during the yearand all members attended. Its remit is to determine, on behalf of the Board, appropriate short and long-term total reward packagesfor the Executive Directors of the Group and its subsidiaries. The Remuneration Committee will also satisfy itself that good practicesapply to all Group employees through the relevant management structures. Its terms of reference will be made available at the AGMand on the Company’s website.
Non-Executive Directors
The Non-Executive Directors have received appointment letters setting out their terms of appointment. Appointment of newNon-Executive Directors is initially for one year with renewal for two-year terms if performance is satisfactory. The Chairman and theSenior Non-Executive Director have served for more than nine years on the Board and, whilst this does not comply with the Code’sdenition of independence, the Board considers that their experience is invaluable to the Group. The Board considers that the other
Non-Executive Director meets the independence tests.
The appointment of new Non-Executive Directors to the Board is considered by the whole Board.
7/29/2019 NWF Group Plc Annual Report and Accounts 2011
http://slidepdf.com/reader/full/nwf-group-plc-annual-report-and-accounts-2011 25/72
NWF Group plc Annual Report and Accounts 2011 | 23
A b o u t N
WF
C or p or a t e G ov er n an c
e
F i n an c i al S t a t em en t s
N o t i c e o
f A GM
Internal control
The Board has overall responsibility for ensuring that the Group maintains a system of internal control, to provide it with reasonable
assurance regarding the reliability of nancial information that is used within the business and for publication and the safeguardingof assets. There are inherent limitations in any system of internal control and accordingly even the most effective system can provideonly reasonable, and not absolute, assurance against material misstatement or loss. Some examples of internal controls operatedby the Group are given below and elsewhere in this statement.
The Group’s organisational structure has clear lines of responsibility. Operating and nancial responsibility for subsidiary companiesis delegated to operational management.
There is a comprehensive budgeting and nancial reporting system which, as a matter of routine, compares actual results to thebudgets approved by the Group Board. Management accounts are prepared for each subsidiary company and for the Group on amonthly basis. Signicant variances from budget are thoroughly investigated. In addition, updated protability forecasts are preparedto reect actual performance and revised outlook as the year progresses.
Cash ow forecasts are prepared regularly, to ensure that the Group has adequate funds for the foreseeable future.
Investment policy, acquisition proposals and major capital expenditure projects are authorised and monitored by the Group Board.The Group’s risk management programme, which assesses key risks and the required internal controls that are delegated to Directorsand managers at all levels in the Group, is reviewed regularly in order to ensure that it continues to meet the Board’s requirements.
Shareholders
The Chairman and the Non-Executive Directors will always make themselves available to meet with shareholders. Each AGM is aparticular opportunity for this. Normal relationships with shareholders are maintained by the Executive Directors who brief the Boardon shareholder issues and who relate the views of the Group’s advisers to the Board.
Share capital structures
Details of the Company’s share capital can be found in the ‘Takeover Directive requirements’ section of the Directors’ Report andin note 22 of the Group nancial statements.
Going concern basis
The Group’s business activities, together with the factors likely to affect its future development, performance and position, are set outin the Business and Financial Review. The nancial position of the Group, its cash ows, liquidity position and borrowing facilities arealso described in the Business and Financial Review. In addition, note 20 of the Group nancial statements includes: the Group’sobjectives, policies and processes for managing its capital; its nancial risk management objectives; details of nancial instrumentsand hedging activities; and its exposure to price, interest rate, credit and liquidity risk.
The Group has an agreement with The Royal Bank of Scotland Group for senior credit facilities totalling £51.0 million, details of whichcan be found in note 19 of the Group nancial statements.
Accordingly, the Directors have a reasonable expectation that the Company and the Group have adequate resources to continuein operational existence for the foreseeable future. Thus, they continue to adopt the going concern basis of accounting in preparingthe annual nancial statements.
7/29/2019 NWF Group Plc Annual Report and Accounts 2011
http://slidepdf.com/reader/full/nwf-group-plc-annual-report-and-accounts-2011 26/72
24 | NWF Group plc Annual Report and Accounts 2011
Statement of directors’ responsibilities
The Directors are responsible for preparing the Annual Report and the Group and Parent Company nancial statements inaccordance with applicable law and regulations.
Company law requires the Directors to prepare nancial statements for each nancial year. Under that law the Directors haveprepared the Group nancial statements in accordance with International Financial Reporting Standards (‘IFRSs’) as adopted by theEuropean Union, and the Parent Company nancial statements in accordance with United Kingdom Generally Accepted AccountingPractice (United Kingdom Accounting Standards and applicable law). Under company law the Directors must not approve thenancial statements unless they are satised that they give a true and fair view of the state of affairs of the Group and the ParentCompany and of the prot or loss of the Group for that period.
In preparing these nancial statements, the Directors are required to:
b select suitable accounting policies and then apply them consistently;
b make judgements and accounting estimates that are reasonable and prudent;
b state whether IFRSs as adopted by the European Union and applicable UK Accounting Standards have been followed, subject toany material departures disclosed and explained in the Group and Parent Company nancial statements respectively; and
b prepare the nancial statements on the going concern basis, unless it is inappropriate to presume that the Group and the ParentCompany will continue in business.
The Directors are responsible for keeping adequate accounting records that are sufcient to show and explain the Group and ParentCompany’s transactions and disclose with reasonable accuracy at any time the nancial position of the Group and Parent Companyand enable them to ensure that the nancial statements comply with the Companies Act 2006. They are also responsible forsafeguarding the assets of the Parent Company and the Group and hence for taking reasonable steps for the prevention anddetection of fraud and other irregularities.
The Directors are responsible for the maintenance and integrity of the Group’s website. Legislation in the United Kingdom governingthe preparation and dissemination of nancial statements may differ from legislation in other jurisdictions.
Each of the Directors conrms that, to the best of their knowledge:
b the Group nancial statements, which have been prepared in accordance with IFRSs as adopted by the European Union, and
the Parent Company nancial statements which have been prepared in accordance with United Kingdom Generally Accepted Accounting Practice, give a true and fair view of the assets, liabilities, nancial position and prot or loss of the Group and theParent Company; and
b the Business and Financial Review includes a fair review of the development and performance of the business and the positionof the Group and the Parent Company, together with a description of the principal risks and uncertainties that they face.
By order of the Board
S R Andrew
Company Secretary
WardleNantwichCheshire CW5 6BP Registered number: 2264971
9 August 2011
7/29/2019 NWF Group Plc Annual Report and Accounts 2011
http://slidepdf.com/reader/full/nwf-group-plc-annual-report-and-accounts-2011 27/72
NWF Group plc Annual Report and Accounts 2011 | 25
A b o u t N
WF
C or p or a t e G ov er n an c
e
F i n an c i al S t a t em en t s
N o t i c e o
f A GM
Independent auditors’ report
to the members of NWF Group plc
We have audited the Group nancial statements of NWF Group plc for the year ended 31 May 2011 which comprise the ConsolidatedIncome Statement, the Consolidated Statement of Comprehensive Income, the Consolidated Balance Sheet, the Consolidated
Statement of Changes in Equity, the Consolidated Cash Flow Statement and the related notes. The nancial reporting framework thathas been applied in their preparation is applicable law and International Financial Reporting Standards (IFRSs) as adopted by theEuropean Union.
Respective responsibilities of directors and auditors
As explained more fully in the Statement of Directors’ Responsibilities on page 24, the Directors are responsible for the preparation ofthe nancial statements and for being satised that they give a true and fair view. Our responsibility is to audit and express an opinionon the nancial statements in accordance with applicable law and International Standards on Auditing (UK and Ireland). Thosestandards require us to comply with the Auditing Practices Board’s Ethical Standards for Auditors.
This report, including the opinion, has been prepared for and only for the Company’s members as a body in accordance with Chapter 3of Part 16 of the Companies Act 2006 and for no other purpose. We do not, in giving these opinions, accept or assume responsibilityfor any other purpose or to any other person to whom this report is shown or into whose hands it may come save where expresslyagreed by our prior consent in writing.
Scope of the audit of the nancial statements
An audit involves obtaining evidence about the amounts and disclosures in the nancial statements sufcient to give reasonableassurance that the nancial statements are free from material misstatement, whether caused by fraud or error. This includes anassessment of: whether the accounting policies are appropriate to the Group’s circumstances and have been consistently appliedand adequately disclosed; the reasonableness of signicant accounting estimates made by the Directors; and the overall presentationof the nancial statements. In addition, we read all the nancial and non-nancial information in the annual report to identify materialinconsistencies with the audited nancial statements. If we become aware of any apparent material misstatements or inconsistencieswe consider the implications for our report.
Opinion on nancial statements
In our opinion the Group nancial statements:
b give a true and fair view of the state of the Group’s affairs as at 31 May 2011 and of its prot and cash ows for the year then ended;
b have been properly prepared in accordance with IFRSs as adopted by the European Union; and
b have been prepared in accordance with the requirements of the Companies Act 2006.
Opinion on other matter prescribed by the Companies Act 2006
In our opinion the information given in the Directors’ Report for the nancial year for which the Group nancial statements are preparedis consistent with the Group nancial statements.
Matters on which we are required to report by exception
We have nothing to report in respect of the following matters where the Companies Act 2006 requires us to report to you if, in our opinion:
b certain disclosures of Directors’ remuneration specied by law are not made; or
b we have not received all the information and explanations we require for our audit.
Other matter
We have reported separately on the Parent Company nancial statements of NWF Group plc for the year ended 31 May 2011.
Martin Heath (Senior Statutory Auditor)
for and on behalf of PricewaterhouseCoopers LLP
Chartered Accountants and Statutory AuditorsManchester 9 August 2011
7/29/2019 NWF Group Plc Annual Report and Accounts 2011
http://slidepdf.com/reader/full/nwf-group-plc-annual-report-and-accounts-2011 28/72
26 | NWF Group plc Annual Report and Accounts 2011
Consolidated income statement
for the year ended 31 May 2011
2011 2010
Note £m £m
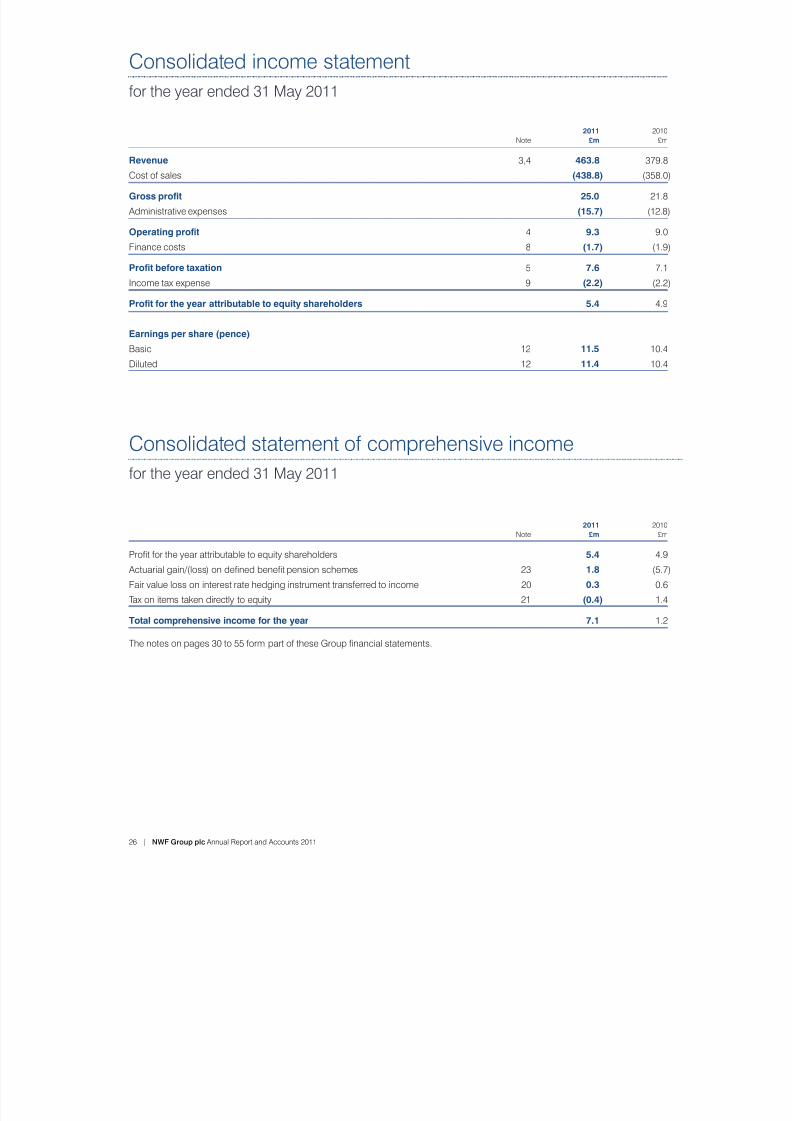
Revenue 3,4 463.8 379.8
Cost of sales (438.8) (358.0)
Gross prot 25.0 21.8
Administrative expenses (15.7) (12.8)
Operating prot 4 9.3 9.0
Finance costs 8 (1.7) (1.9)
Prot before taxation 5 7.6 7.1
Income tax expense 9 (2.2) (2.2)
Prot for the year attributable to equity shareholders 5.4 4.9
Earnings per share (pence)
Basic 12 11.5 10.4
Diluted 12 11.4 10.4
Consolidated statement of comprehensive income
for the year ended 31 May 2011
2011 2010
Note £m £m
Prot for the year attributable to equity shareholders 5.4 4.9
Actuarial gain/(loss) on dened benet pension schemes 23 1.8 (5.7)
Fair value loss on interest rate hedging instrument transferred to income 20 0.3 0.6
Tax on items taken directly to equity 21 (0.4) 1.4
Total comprehensive income for the year 7.1 1.2
The notes on pages 30 to 55 form part of these Group nancial statements.
7/29/2019 NWF Group Plc Annual Report and Accounts 2011
http://slidepdf.com/reader/full/nwf-group-plc-annual-report-and-accounts-2011 29/72
NWF Group plc Annual Report and Accounts 2011 | 27
A b o u t N
WF
C or p or a t e G ov er n an c
e
F i n an c i al S t a t em en t s
N o t i c e o
f A GM
Consolidated balance sheet
as at 31 May 2011
2011 2010
Note £m £m
Non-current assets
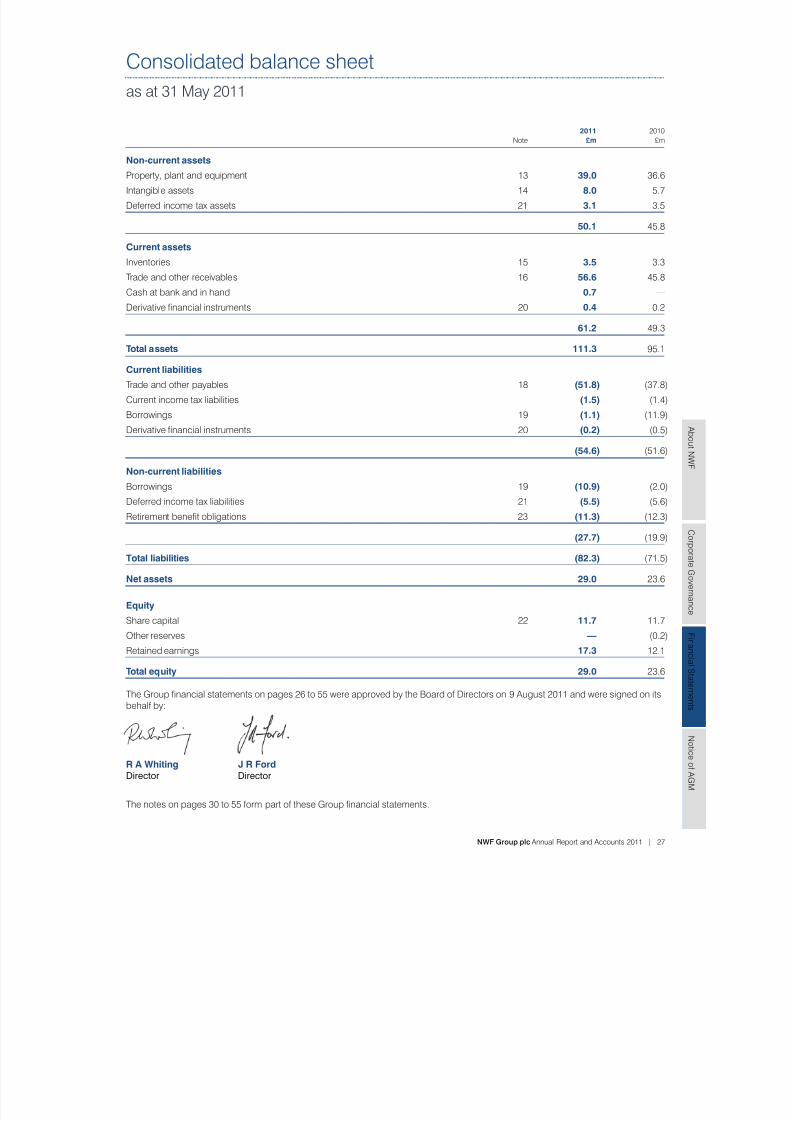
Property, plant and equipment 13 39.0 36.6
Intangible assets 14 8.0 5.7
Deferred income tax assets 21 3.1 3.5
50.1 45.8
Current assets
Inventories 15 3.5 3.3
Trade and other receivables 16 56.6 45.8
Cash at bank and in hand 0.7 —
Derivative nancial instruments 20 0.4 0.2
61.2 49.3
Total assets 111.3 95.1
Current liabilities
Trade and other payables 18 (51.8) (37.8)
Current income tax liabilities (1.5) (1.4)
Borrowings 19 (1.1) (11.9)
Derivative nancial instruments 20 (0.2) (0.5)
(54.6) (51.6)
Non-current liabilities
Borrowings 19 (10.9) (2.0)
Deferred income tax liabilities 21 (5.5) (5.6)
Retirement benet obligations 23 (11.3) (12.3)
(27.7) (19.9)
Total liabilities (82.3) (71.5)
Net assets 29.0 23.6
Equity
Share capital 22 11.7 11.7
Other reserves — (0.2)
Retained earnings 17.3 12.1
Total equity 29.0 23.6
The Group nancial statements on pages 26 to 55 were approved by the Board of Directors on 9 August 2011 and were signed on itsbehalf by:
R A Whiting J R Ford
Director Director
The notes on pages 30 to 55 form part of these Group nancial statements.
7/29/2019 NWF Group Plc Annual Report and Accounts 2011
http://slidepdf.com/reader/full/nwf-group-plc-annual-report-and-accounts-2011 30/72
28 | NWF Group plc Annual Report and Accounts 2011
Consolidated statement of changes in equity
as at 31 May 2011
Share Other Retained Total
capital reserves earnings equity
£m £m £m £m
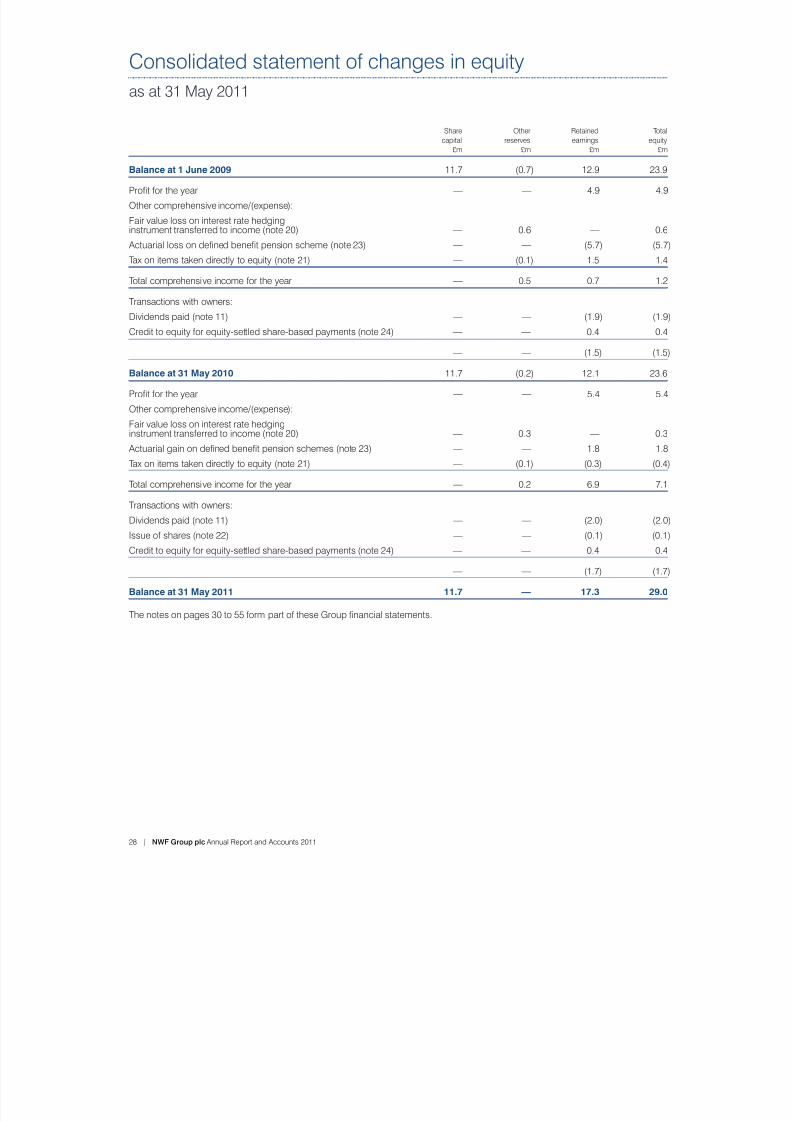
Balance at 1 June 2009 11.7 (0.7) 12.9 23.9
Prot for the year — — 4.9 4.9
Other comprehensive income/(expense):
Fair value loss on interest rate hedginginstrument transferred to income (note 20) — 0.6 — 0.6
Actuarial loss on dened benet pension scheme (note 23) — — (5.7) (5.7)
Tax on items taken directly to equity (note 21) — (0.1) 1.5 1.4
Total comprehensive income for the year — 0.5 0.7 1.2
Transactions with owners:
Dividends paid (note 11) — — (1.9) (1.9)
Credit to equity for equity-settled share-based payments (note 24) — — 0.4 0.4
— — (1.5) (1.5)
Balance at 31 May 2010 11.7 (0.2) 12.1 23.6
Prot for the year — — 5.4 5.4
Other comprehensive income/(expense):
Fair value loss on interest rate hedginginstrument transferred to income (note 20) — 0.3 — 0.3
Actuarial gain on dened benet pension schemes (note 23) — — 1.8 1.8
Tax on items taken directly to equity (note 21) — (0.1) (0.3) (0.4)
Total comprehensive income for the year — 0.2 6.9 7.1
Transactions with owners:
Dividends paid (note 11) — — (2.0) (2.0)
Issue of shares (note 22) — — (0.1) (0.1)
Credit to equity for equity-settled share-based payments (note 24) — — 0.4 0.4
— — (1.7) (1.7)
Balance at 31 May 2011 11.7 — 17.3 29.0
The notes on pages 30 to 55 form part of these Group nancial statements.
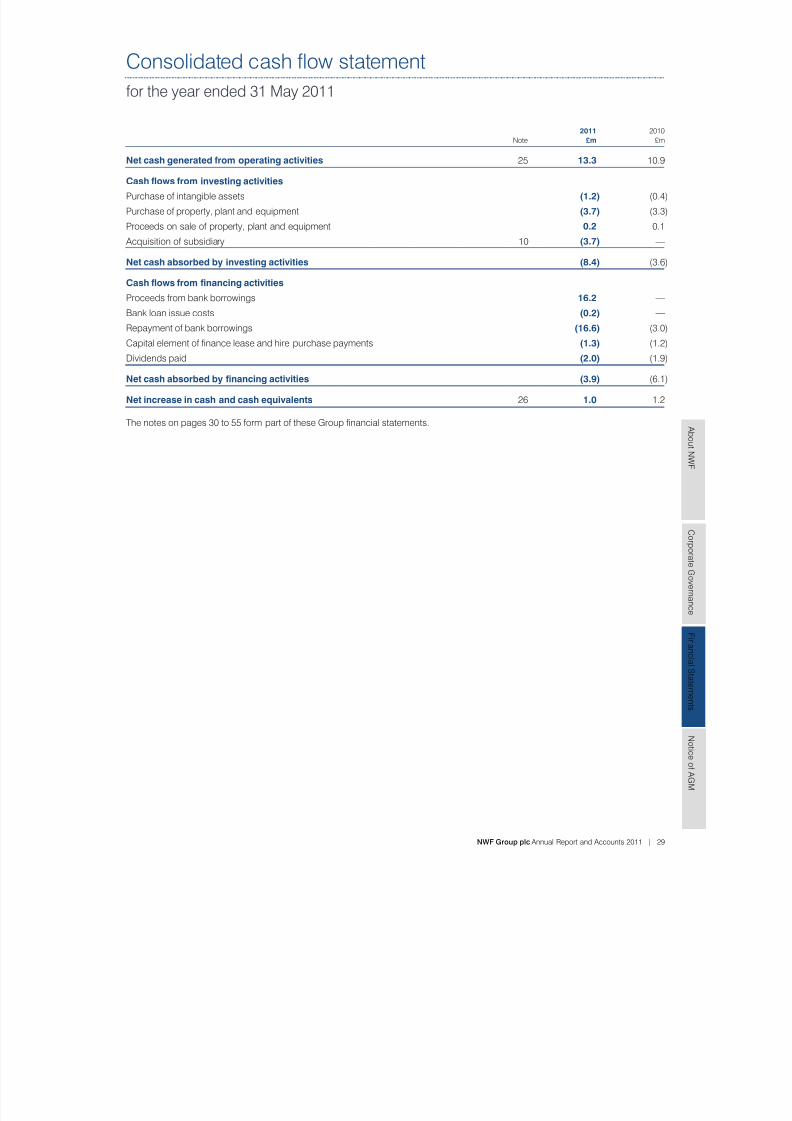
7/29/2019 NWF Group Plc Annual Report and Accounts 2011
http://slidepdf.com/reader/full/nwf-group-plc-annual-report-and-accounts-2011 31/72
NWF Group plc Annual Report and Accounts 2011 | 29
A b o u t N
WF
C or p or a t e G ov er n an c
e
F i n an c i al S t a t em en t s
N o t i c e o
f A GM
Consolidated cash ow statement
for the year ended 31 May 2011
2011 2010
Note £m £m
Net cash generated from operating activities 25 13.3 10.9
Cash ows from investing activities
Purchase of intangible assets (1.2) (0.4)
Purchase of property, plant and equipment (3.7) (3.3)
Proceeds on sale of property, plant and equipment 0.2 0.1
Acquisition of subsidiary 10 (3.7) —
Net cash absorbed by investing activities (8.4) (3.6)
Cash ows from nancing activities
Proceeds from bank borrowings 16.2 —
Bank loan issue costs (0.2) —
Repayment of bank borrowings (16.6) (3.0)
Capital element of nance lease and hire purchase payments (1.3) (1.2)
Dividends paid (2.0) (1.9)
Net cash absorbed by nancing activities (3.9) (6.1)
Net increase in cash and cash equivalents 26 1.0 1.2
The notes on pages 30 to 55 form part of these Group nancial statements.
7/29/2019 NWF Group Plc Annual Report and Accounts 2011
http://slidepdf.com/reader/full/nwf-group-plc-annual-report-and-accounts-2011 32/72
30 | NWF Group plc Annual Report and Accounts 2011
Notes to the group nancial statements
for the year ended 31 May 2011
1. General information
NWF Group plc (‘the Company’) is a public limited company incorporated and domiciled in the UK under the Companies Act 2006.
The principal activities of NWF Group plc and its subsidiaries (together ‘the Group’) are the warehousing and distribution of ambientgroceries, the manufacture and sale of animal feeds and the sale and distribution of fuel oils. Further details of the nature of theGroup’s operations and principal activities are set out in note 4 of the Group nancial statements.
The address of the Company’s registered ofce is NWF Group plc, Wardle, Nantwich, Cheshire CW5 6BP.
The Company has its primary listing on AIM, part of the London Stock Exchange.
The Group nancial statements were authorised for issue by the Board of Directors on 9 August 2011.
2. Signicant accounting policies
The Group’s principal accounting policies, all of which have been applied consistently to all the years presented, are set out below.
Basis of preparation
The Group nancial statements have been prepared in accordance with International Financial Reporting Standards as endorsed by
the European Union (‘IFRS’), International Financial Reporting Interpretation Committee (‘IFRIC’) interpretations and those provisionsof the Companies Act 2006 applicable to companies reporting under IFRS. The Group nancial statements have been prepared onthe historical cost convention modied for the revaluation of certain nancial instruments.
The preparation of nancial statements in conformity with IFRS requires the use of certain critical accounting estimates, which areoutlined in the critical accounting estimates and judgements section of these accounting policies. It also requires management toexercise its judgement in the process of applying the Group’s accounting policies.
Adoption of new and revised standards
The following new standards, amendments to standards and interpretations are mandatory for the rst time for the nancial yearbeginning 1 June 2010:
Amendment to IFRS 2 ‘Group Cash-settled Share-based Payment Transactions’
IFRS 3 (revised) ‘Business Combinations’
IAS 27 (revised) ‘Consolidated and Separate Financial Statements’
IAS 28 (revised) ‘Investments in Associates’
Amendment to IAS 32 ‘Classication of Rights Issues’
Amendment to IAS 39 ‘Financial Instruments: Eligible Hedged Items’
IFRIC 17 ‘Distributions of Non-cash Assets to Owners’
IFRIC 18 ‘Transfers of Assets from Customers’
Annual Improvements 2008–2009
With the exception of IFRS 3 (revised), none of the above standards, amendments to standards and interpretations have had animpact on the amounts reported in these Group nancial statements.
IFRS 3 (revised) is effective prospectively to business combinations for which the acquisition date is on or after the beginning of the
accounting period starting on or after 1 July 2009. The revised standard was applied to the acquisition of Evesons Fuels Limited on17 January 2011. As a result, acquisition-related costs of £0.2 million have been recognised in the consolidated income statementin the year ended 31 May 2011, which previously would have been included in the consideration for the acquisition. See note 10of the Group nancial statements for further details of the acquisition of Evesons Fuels Limited.
Further, IAS 24 (revised) ‘Related Party Transactions’ has been issued but is not effective for the nancial year beginning on 1 June 2010and has not been early adopted. The Directors anticipate that the adoption of IAS 24 (revised) in future periods will not have a materialimpact on the amounts reported in the Group nancial statements.
7/29/2019 NWF Group Plc Annual Report and Accounts 2011
http://slidepdf.com/reader/full/nwf-group-plc-annual-report-and-accounts-2011 33/72
NWF Group plc Annual Report and Accounts 2011 | 31
A b o u t N
WF
C or p or a t e G ov er n an c
e
F i n an c i al S t a t em en t s
N o t i c e o
f A GM
2. Signicant accounting policies continued
Consolidation
The Group nancial statements incorporate the nancial statements of NWF Group plc (‘the Company’) and entities controlled by theCompany (its ‘subsidiaries’) made up to 31 May each year. Control is achieved where the Company has the power to govern the nancialand operating policies of an investee entity so as to obtain benets from its activities.
Subsidiaries are fully consolidated from the date on which control is transferred to the Group. They are de-consolidated from the datethat control ceases.
The acquisition of subsidiaries is accounted for using the acquisition method. The consideration transferred for the acquisitionof a subsidiary is the fair value of the assets transferred, the liabilities incurred and the equity interests issued by the Group.The consideration transferred includes the fair value of any asset or liability resulting from a contingent consideration arrangement. Acquisi tion-related costs are expensed as incurred. Identiable assets acquired and liabi lities and contingent l iabil ities assumedin a business combination are measured initially at their fair values at the acquisition date. On an acquisition-by-acquisition basis, theGroup recognises any non-controlling interest in the acquiree either at fair value or at the non-controlling interest’s proportionate shareof the acquiree’s net assets.
The excess of the consideration transferred, the amount of any non-controlling interest in the acquiree and the acquisition date fairvalue of any previous equity interest in the acquiree over the fair value of the Group’s share of the identiable net assets acquired isrecorded as goodwill. If this is less than the fair value of the net assets of the subsidiary acquired in the case of a bargain purchase,the difference is recognised directly in the income statement.
Inter-company transactions, balances and unrealised gains on transactions between Group companies are eliminated. Unrealisedlosses are also eliminated. Accounting policies of subsidiaries have been changed where necessary to ensure consistency with thepolicies adopted by the Group.
Revenue recognition
Revenue comprises the fair value of the consideration received or receivable for the sale of goods and services in the ordinary courseof the Group’s activities. Revenue is shown net of value added tax, estimated returns, rebates and discounts and after eliminatingsales within the Group. Specic types of revenue are recognised as follows:
Food
Revenue from storage, distribution, handling and re-packaging of clients’ products is recognised when the relevant service hasbeen performed.
Feeds and FuelsRevenue from the sale of goods in each of these segments is recognised when they are delivered to the customer and title has passed.
Revenue from sale of fuels includes fuel duty.
Interest incomeInterest income is recognised on a time proportion basis using the effective interest rate method.
Segment reporting
A business segment is a group of assets and operations engaged in providing products or services that are subject to risks andreturns that are different from those of other business segments. A geographical segment is engaged in providing products andservices within a particular economic environment that are subject to risks and returns which are different from those of segmentsoperating in other economic environments. Segment reporting information is shown in note 4 of the Group nancial statements.
Taxation
The income tax expense represents the sum of current and deferred income tax.
Current income tax is based on taxable prots for the year. Taxable prot differs from prot as reported in the income statementbecause it excludes items of income and expense that are taxable or deductible in other years and it further excludes items that arenever taxable or deductible. The Group’s liability for current tax is calculated using tax rates that have been enacted or substantivelyenacted by the balance sheet date.
Deferred income tax is provided in full, using the liability method, on temporary differences arising between the tax bases of assetsand liabilities and their carrying amounts in the Group nancial statements. However, deferred income tax is not accounted for if itarises from initial recognition of an asset or liability in a transaction other than a business combination that at the time of thetransaction affects neither accounting nor taxable prots or losses.
7/29/2019 NWF Group Plc Annual Report and Accounts 2011
http://slidepdf.com/reader/full/nwf-group-plc-annual-report-and-accounts-2011 34/72
32 | NWF Group plc Annual Report and Accounts 2011
Notes to the group nancial statements continued
for the year ended 31 May 2011
2. Signicant accounting policies continued
Taxation continued
Deferred income tax is determined using tax rates (and laws) that have been enacted or substantively enacted by the balance sheetdate and are expected to apply when the related deferred income tax asset is realised or the deferred income tax liability is settled.
Deferred income tax assets are recognised to the extent that it is probable that future taxable prots will be available against whichthe temporary differences can be utilised.
Borrowing costs
Borrowing costs that are directly attributable to the construction of qualifying assets, which are assets that necessarily take asubstantial period of time to get ready for their intended use, are added to the cost of those assets, until such time as the assetsare substantially ready for their intended use.
All other borrowing costs are recognised in the income statement in the period in which they are incurred.
Dividend distribution
The distribution of a dividend to the Company’s shareholders is recognised as a liability in the Group’s nancial statements in the
period in which it is approved by the Company’s shareholders.Property, plant and equipment
Certain revalued freehold land and buildings are stated at deemed cost in accordance with the exemption on transition to IFRSpermitted by IFRS 1. All other property, plant and equipment is stated at historical cost less accumulated depreciation. Historical costincludes expenditure that is directly related to the acquisition of the items.
Subsequent costs are included in the asset’s carrying amount, or recognised as a separate asset, as appropriate, only when it is probablethat future economic benets associated with the asset will ow to the Group, and the cost of the asset can be measured reliably. All otherrepairs and maintenance expenditure is charged to the income statement during the nancial period in which it is incurred.
Land is not depreciated. Depreciation on other assets is calculated, using the straight-line method, to reduce their cost to theirresidual values over their useful economic lives, as follows:
Freehold and long leasehold buildings 10 – 50 years
Plant, machinery and equipment 3 – 10 years
Commercial vehicles 4 – 8 years
Motor vehicles 4 years
Residual values and useful lives are reviewed, and adjusted if appropriate, at each balance sheet date. An asset’s carrying amount is writtendown immediately to its estimated recoverable amount, if the asset’s carrying amount is greater than its estimated recoverable amount.
Gains and losses on disposal are determined by comparing the proceeds of disposal with the carrying value and are recognised inthe income statement.
Intangible assets
GoodwillGoodwill represents the excess of the cost of an acquisition over the fair value of the Group’s share of the identiable net assetsof the acquired subsidiary at the date of acquisition.
Goodwill on acquisitions of subsidiaries is included within ‘intangible assets’. Goodwill is tested annually for impairment and carriedat cost less accumulated impairment losses. Impairment losses on goodwill are recognised immediately in the income statementand are not subsequently reversed. Gains and losses on the disposal of an entity include the carrying amount of goodwill relatingto the entity sold.
Goodwill is allocated to each of the Group’s cash-generating units for the purpose of impairment testing. The allocation is made tothose cash-generating units or groups of cash-generating units that are expected to benet from the business combination in whichthey arose, identied according to operating segment.
Goodwill arising on acquisitions before the transition date to IFRS has been retained at the previous UK GAAP amount, subject tobeing tested for impairment at that date. Goodwill written off to reserves under UK GAAP prior to 1998 has not been reinstated andis not included in determining any subsequent prot or loss on disposal.
BrandsSeparately acquired brands are shown at historical cost. Brands acquired in a business combination are recognised at fair value
at the date of acquisition. Brands have a nite useful life and are carried at cost less accumulated amortisation. Amortisation iscalculated, using the straight-line method, to allocate the cost of brands over their estimated useful lives (10–20 years).
7/29/2019 NWF Group Plc Annual Report and Accounts 2011
http://slidepdf.com/reader/full/nwf-group-plc-annual-report-and-accounts-2011 35/72
NWF Group plc Annual Report and Accounts 2011 | 33
A b o u t N
WF
C or p or a t e G ov er n an c
e
F i n an c i al S t a t em en t s
N o t i c e o
f A GM
2. Signicant accounting policies continued
Intangible assets continued
Computer softwareCosts associated with maintaining computer software programs are recognised as an expense as incurred. Costs incurred to acquirecomputer software licences and directly attributable costs incurred to bring the software into use are capitalised. Directly attributablecosts include software development employee costs. Capitalised computer software costs are amortised over their estimated usefullives (3–5 years).
Impairment of non-nancial assets
Assets that have an indenite useful life, for example goodwill, are not subject to amortisation and are tested annually for impairment. Assets that are subject to amortisation are reviewed for impairment whenever events or changes in circumstances indicate that the carryingamount may not be recoverable. An impairment loss is recognised as the amount by which the asset’s carrying amount exceeds therecoverable amount. The recoverable amount is the higher of the asset’s fair value less costs to sell and its value in use. Non-nancialassets, other than goodwill, that suffer an impairment are reviewed for possible reversal of the impairment at each reporting date.
Inventories
Inventories are stated at the lower of cost and net realisable value. Cost is determined using the rst in rst out (‘FIFO’) method.The cost of raw materials, consumables, nished goods and goods for resale comprises purchase cost and, in the case of nishedgoods, the cost of transporting the goods to their stock location.
Net realisable value comprises the estimated selling price in the ordinary course of business less applicable variable selling expenses.Provision is made for obsolete, slow moving or defective items where appropriate.
Trade and other receivables
Trade and other receivables are recognised initially at fair value less provision for impairment. Subsequent to initial recognition,receivables are measured at amortised cost, using the effective interest method.
A provision for impairment is established when there is objective evidence that the Group will not be able to collect all amountsdue according to the original terms of the receivables. The amount of the provision is charged to the income statement withinadministrative expenses.
Derivative nancial instruments and hedging activities
A derivative is initially recognised at fair value on the date that the associated contract is entered into and then is re-measured at fairvalue at each subsequent balance sheet date. The method of recognising the resulting gain or loss depends on whether or not thederivative is designated as a hedging instrument and, if so, the nature of the item being hedged.
Changes in the fair value of derivative nancial instruments that are designated and effective as hedges of future cash ows arerecognised directly in equity and the ineffective portion is recognised immediately in the income statement. If the cash ow hedgeof a rm commitment or forecasted transaction results in the recognition of an asset or a liability, then, at the time the asset or liabilityis recognised, the associated gains or losses on the derivative that had previously been recognised in equity are included in the initialmeasurement of the asset or liability. For hedges that do not result in the recognition of an asset or a liability, amounts deferredin equity are recognised in the income statement in the same period in which the hedged item effects net prot or loss.
Changes in the fair value of derivative nancial instruments that do not qualify for hedge accounting are recognised in the incomestatement as they arise.
Hedge accounting is discontinued when the hedging instrument expires or is sold, terminated, or exercised, or no longer qualies for
hedge accounting. At that time, any cumulative gain or loss on the hedging instrument recognised in equity is retained in equity untilthe forecasted transaction occurs. If a hedging transaction is no longer expected to occur, the net cumulative gain or loss recognisedin equity is transferred to net prot or loss for the period.
Cash and cash equivalents
Cash and cash equivalents include cash in hand, deposits held at call with banks and bank overdrafts. Bank overdrafts are shownwithin borrowings in current liabilities on the balance sheet.
Trade and other payables
Trade and other payables are recognised initially at fair value and subsequently measured at amortised cost using the effectiveinterest method.
Bank borrowings
Borrowings are recognised initially at fair value, net of transaction costs incurred. Borrowings are subsequently stated at amortisedcost. Any difference between the proceeds (net of transaction costs) and the redemption value is recognised in the income statement
over the period of the borrowings, using the effective interest method.
Borrowings are classied as current liabilities unless the Group has an unconditional right to defer settlement of the liability for at leastone year after the balance sheet date.
7/29/2019 NWF Group Plc Annual Report and Accounts 2011
http://slidepdf.com/reader/full/nwf-group-plc-annual-report-and-accounts-2011 36/72
34 | NWF Group plc Annual Report and Accounts 2011
Notes to the group nancial statements continued
for the year ended 31 May 2011
2. Signicant accounting policies continued
Retirement benet obligations
The Group operates various pension schemes, including dened contribution and dened benet schemes.
For dened contribution schemes, the Group pays contributions to publicly or privately administered pension insurance schemeson a mandatory, contractual or voluntary basis. The contributions are recognised as an employee benet expense in the incomestatement when they are due.
The liability recognised in the balance sheet in respect of dened benet schemes is the present value of the dened benet obligationat the balance sheet date less the fair value of scheme assets, together with adjustments for unrecognised actuarial gains or lossesand past service costs. The dened benet obligation is calculated annually by independent actuaries using the Projected Unit CreditMethod. The present value of the dened benet obligation is determined by discounting the estimated future cash outows usinginterest rates of high quality corporate bonds that are denominated in the currency in which the benets will be paid and that haveterms to maturity approximating to the terms of the related pension liability.
The interest cost and expected return on the assets are shown as a net amount within either nance costs or nance income in theincome statement. Actuarial gains and losses are recognised immediately in the statement of comprehensive income. Net dened
benet pension scheme decits before tax relief are presented separately on the balance sheet within non-current liabilities. Theattributable deferred income tax asset is included within deferred income tax asset and is subject to the recognition criteria as setout in the accounting policy on deferred income tax.
Share-based payments
The Group has applied the requirements of IFRS 2 ‘Share-based Payments’.
In the year ended 31 May 2011, the Group operated two (2010: two) equity-settled share-based compensation plans. The fair valueof the employee services received in exchange for the grant of share awards is recognised as an expense. Equity-settled share-basedpayments are measured at fair value (excluding the effect of non market-based vesting conditions) at the date of grant. The fair valuedetermined at the grant date of the equity-settled share-based payments is expensed on a straight-line basis over the vesting period,based on the Group’s estimate of shares that will eventually vest and adjusted for the effect of non market-based vesting conditions.
Fair value is measured by the use of a Black Scholes model. The expected life used in the model has been adjusted, basedon management’s best estimate, for the effects of non-transferability, exercise restrictions and behavioural considerations.
Employer social security contributions payable in connection with the grant of share awards is considered an integral part of the grantitself and the charge is treated as a cash-settled transaction.
Provisions
Provisions are recognised when the Group has a present legal or constructive obligation as a result of past events, it is probablethat an outow of resources will be required to settle the obligation and the amount has been reliably estimated. Provisions are notrecognised for future operating losses.
Leases and hire purchase agreements
Leases in which a signicant proportion of the risks and rewards of ownership are retained by the lessor are classied as operatingleases. Payments made under operating leases (net of any incentives received from the lessor) are charged to the income statementon a straight-line basis over the period of the lease.
Other leases are classied as nance leases.
Assets and liabilities under nance leases and hire purchase agreements are recognised in the balance sheet at the inception of theagreement at amounts equal to their fair value or, if lower, the net present value of the minimum payments under the agreement.Depreciation on hire purchase and leased assets is provided at rates consistent with that for similar assets that are owned by the Group.
Subsequent to initial recognition, payments made are apportioned between the nance charge element and the reduction in thecapital value of the outstanding liability. The nance charge is allocated to each period so as to produce a constant periodic rateof interest on the remaining balance of the liability.
Share capital
Ordinary shares are classied as equity. Incremental costs directly attributable to the issue of new shares are shown in equityas a deduction, net of tax, from the proceeds of issue.
Critical accounting estimates and judgements
The Group makes estimates and assumptions concerning the future. The resulting accounting estimates will, by denition, seldomequal the related actual results. The estimates and assumptions that have a signicant risk of causing a material adjustment to the
carrying amounts of assets and liabilities within the next nancial year are discussed overleaf.
7/29/2019 NWF Group Plc Annual Report and Accounts 2011
http://slidepdf.com/reader/full/nwf-group-plc-annual-report-and-accounts-2011 37/72
NWF Group plc Annual Report and Accounts 2011 | 35
A b o u t N
WF
C or p or a t e G ov er n an c
e
F i n an c i al S t a t em en t s
N o t i c e o
f A GM
2. Signicant accounting policies continued
Critical accounting estimates and judgements continued
Estimated impairment of goodwillThe Group annually tests whether goodwill has suffered any impairment, in accordance with the accounting policy stated on page 32.The recoverable amounts of cash-generating units have been determined based on value in use calculations. These calculations requirethe use of estimates, both in arriving at expected future cash ows and a suitable discount rate in order to calculate the present valueof these ows.
Estimated impairment of trade receivablesThe Group regularly reviews the recoverability of trade receivables. A provision for impairment is made where the Group believesthat it will not be able to collect amounts due according to the original terms of sale. Provisions for impairment are estimatesof future events and are therefore uncertain.
Dened benet pension schemes – valuation assumptionsThe balance sheet carrying values of dened benet pension scheme surpluses or decits are calculated using independentlycommissioned actuarial valuations. These valuations are based on a number of assumptions, including the most appropriate mortality
rates to apply to the prole of scheme members and the nancial assumptions regarding discount rates and ination. All of these areestimates of future events and are therefore uncertain.
Estimated fair value of derivatives and other nancial instrumentsThe Group has certain nancial instruments (forward supply contracts) that are not in an active market and cannot be valued byreference to unadjusted quoted prices for identical instruments. The Group, therefore, uses its judgement to select valuationtechniques and makes assumptions that are mainly based on observable market data in respect of equivalent instruments at thebalance sheet date. Further details can be found in note 20 of the Group nancial statements.
3. Revenue
An analysis of the Group’s revenue is as follows:
2011 2010£m £m
Sale of goods 419.6 337.6
Rendering of services 44.2 42.2 463.8 379.8
4. Segment information
The chief operating decision-maker has been identied as the Board of Directors (‘the Board’). The Board reviews the Group’s internalreporting in order to assess performance and allocate resources. The Board has determined that the operating segments, based onthese reports, are Food, Feeds and Fuels.
The Board considers the business from a product/services perspective. In the Board’s opinion, all of the Group’s operations arecarried out in the same geographical segment, namely the UK.
The nature of the products/services provided by the operating segments is summarised below:
Food – warehousing and distribution of clients’ ambient grocery and other products to supermarket and other retaildistribution centres
Feeds – manufacture and sale of animal feeds and other agricultural products
Fuels – sale and distribution of domestic heating, industrial and road fuels
Segment information about the above businesses is presented overleaf.
The Board assesses the performance of the operating segments based on a measure of operating prot. Finance income and costsare not included in the segment result that is assessed by the Board. Other information provided to the Board is measured in a mannerconsistent with that in the nancial statements.
Inter-segment transactions are entered into under the normal commercial terms and conditions that would also be availableto unrelated third parties.
Segment assets exclude deferred income tax assets and cash at bank and in hand. Segment liabilities exclude taxation, borrowings,retirement benet obligations and certain derivative nancial instruments. Excluded items are part of the reconciliation to consolidated
total assets and liabilities.
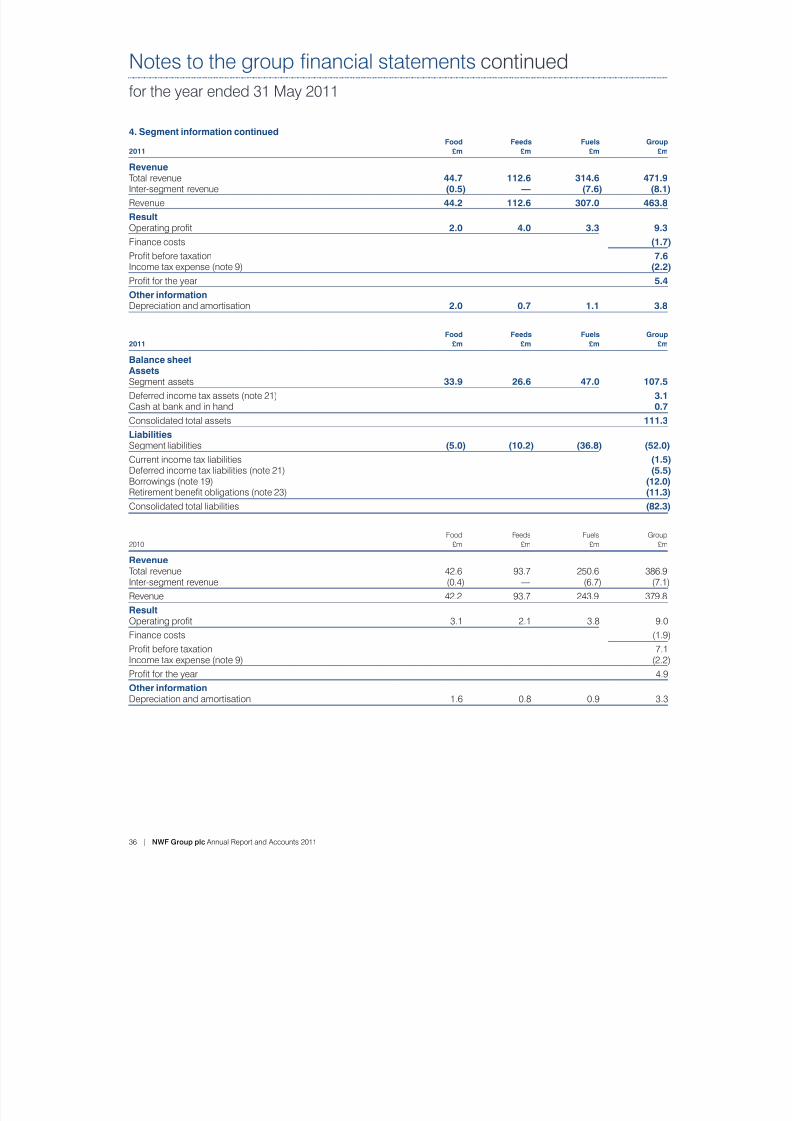
7/29/2019 NWF Group Plc Annual Report and Accounts 2011
http://slidepdf.com/reader/full/nwf-group-plc-annual-report-and-accounts-2011 38/72
36 | NWF Group plc Annual Report and Accounts 2011
Notes to the group nancial statements continued
for the year ended 31 May 2011
4. Segment information continued Food Feeds Fuels Group
2011 £m £m £m £m
Revenue Total revenue 44.7 112.6 314.6 471.9Inter-segment revenue (0.5) — (7.6) (8.1)
Revenue 44.2 112.6 307.0 463.8
Result Operating prot 2.0 4.0 3.3 9.3
Finance costs (1.7)
Prot before taxation 7.6Income tax expense (note 9) (2.2)
Prot for the year 5.4
Other information
Depreciation and amortisation 2.0 0.7 1.1 3.8
Food Feeds Fuels Group
2011 £m £m £m £m
Balance sheet Assets Segment assets 33.9 26.6 47.0 107.5
Deferred income tax assets (note 21) 3.1Cash at bank and in hand 0.7
Consolidated total assets 111.3
Liabilities Segment liabilities (5.0) (10.2) (36.8) (52.0)
Current income tax liabilities (1.5)Deferred income tax liabilities (note 21) (5.5)Borrowings (note 19) (12.0)Retirement benet obligations (note 23) (11.3)
Consolidated total liabilities (82.3)
Food Feeds Fuels Group
2010 £m £m £m £m
RevenueTotal revenue 42.6 93.7 250.6 386.9Inter-segment revenue (0.4) — (6.7) (7.1)
Revenue 42.2 93.7 243.9 379.8
Result Operating prot 3.1 2.1 3.8 9.0
Finance costs (1.9)
Prot before taxation 7.1Income tax expense (note 9) (2.2)
Prot for the year 4.9
Other information Depreciation and amortisation 1.6 0.8 0.9 3.3
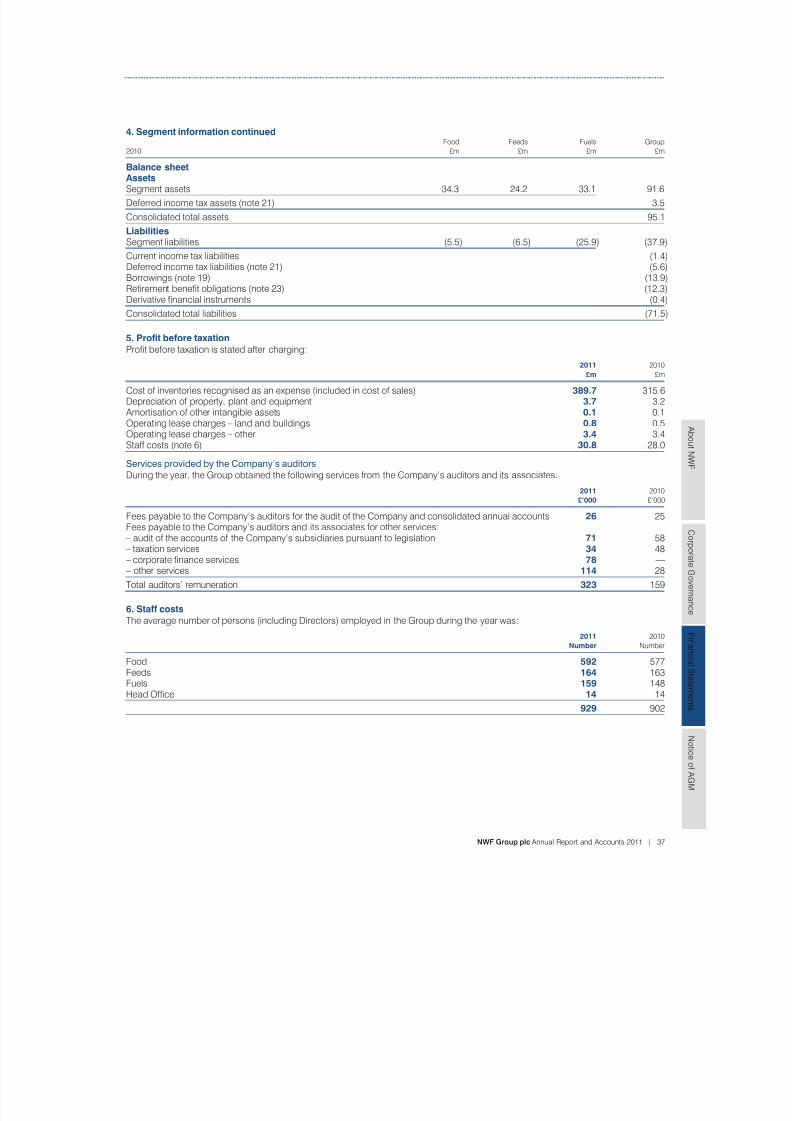
7/29/2019 NWF Group Plc Annual Report and Accounts 2011
http://slidepdf.com/reader/full/nwf-group-plc-annual-report-and-accounts-2011 39/72
NWF Group plc Annual Report and Accounts 2011 | 37
A b o u t N
WF
C or p or a t e G ov er n an c
e
F i n an c i al S t a t em en t s
N o t i c e o
f A GM
4. Segment information continuedFood Feeds Fuels Group
2010 £m £m £m £m
Balance sheet Assets Segment assets 34.3 24.2 33.1 91.6
Deferred income tax assets (note 21) 3.5
Consolidated total assets 95.1
Liabilities Segment liabilities (5.5) (6.5) (25.9) (37.9)
Current income tax liabilities (1.4)Deferred income tax liabilities (note 21) (5.6)Borrowings (note 19) (13.9)Retirement benet obligations (note 23) (12.3)Derivative nancial instruments (0.4)
Consolidated total liabilities (71.5)
5. Prot before taxation
Prot before taxation is stated after charging:
2011 2010
£m £m
Cost of inventories recognised as an expense (included in cost of sales) 389.7 315.6Depreciation of property, plant and equipment 3.7 3.2 Amortisation of other intangible assets 0.1 0.1Operating lease charges – land and buildings 0.8 0.5Operating lease charges – other 3.4 3.4Staff costs (note 6) 30.8 28.0
Services provided by the Company’s auditorsDuring the year, the Group obtained the following services from the Company’s auditors and its associates:
2011 2010
£’000 £’000
Fees payable to the Company’s auditors for the audit of the Company and consolidated annual accounts 26 25Fees payable to the Company’s auditors and its associates for other services:– audit of the accounts of the Company’s subsidiaries pursuant to legislation 71 58– taxation services 34 48– corporate nance services 78 —– other services 114 28
Total auditors’ remuneration 323 159
6. Staff costs
The average number of persons (including Directors) employed in the Group during the year was:
2011 2010
Number Number
Food 592 577Feeds 164 163Fuels 159 148Head Ofce 14 14
929 902
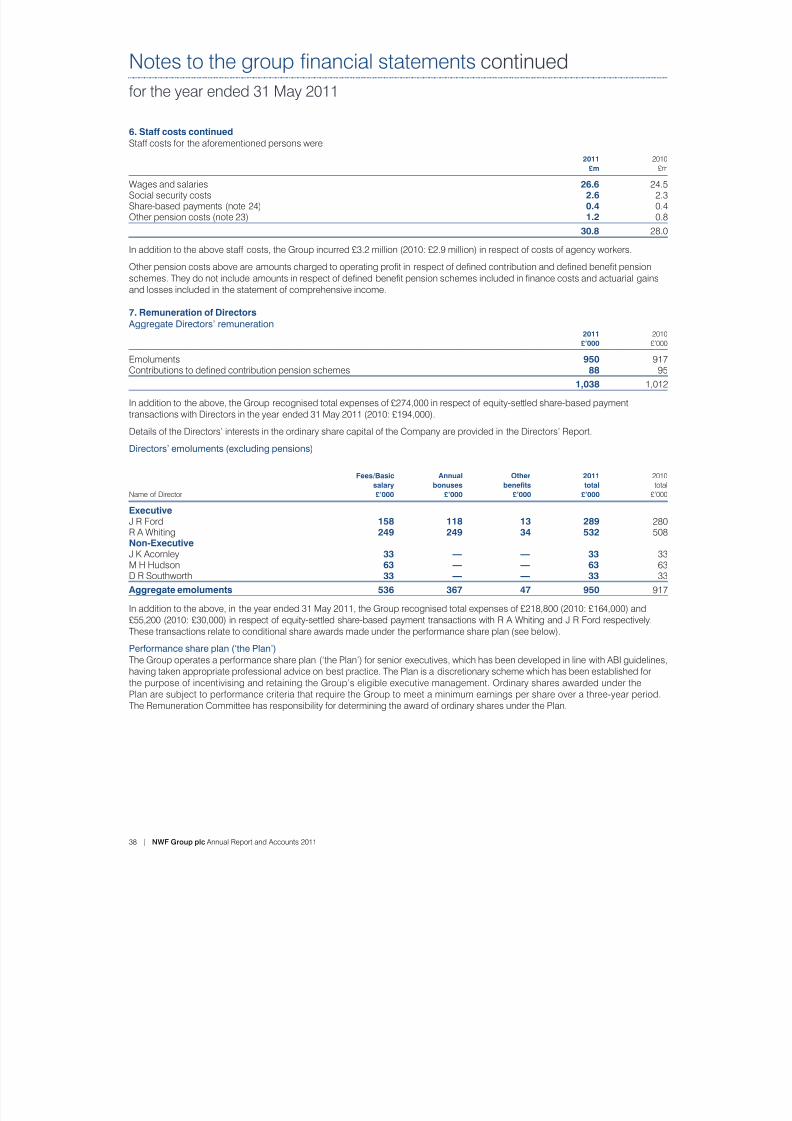
7/29/2019 NWF Group Plc Annual Report and Accounts 2011
http://slidepdf.com/reader/full/nwf-group-plc-annual-report-and-accounts-2011 40/72
38 | NWF Group plc Annual Report and Accounts 2011
Notes to the group nancial statements continued
for the year ended 31 May 2011
6. Staff costs continued
Staff costs for the aforementioned persons were:
2011 2010
£m £m
Wages and salaries 26.6 24.5Social security costs 2.6 2.3Share-based payments (note 24) 0.4 0.4Other pension costs (note 23) 1.2 0.8
30.8 28.0
In addition to the above staff costs, the Group incurred £3.2 million (2010: £2.9 million) in respect of costs of agency workers.
Other pension costs above are amounts charged to operating prot in respect of dened contribution and dened benet pensionschemes. They do not include amounts in respect of dened benet pension schemes included in nance costs and actuarial gainsand losses included in the statement of comprehensive income.
7. Remuneration of Directors
Aggregate Directors’ remuneration 2011 2010
£’000 £’000
Emoluments 950 917Contributions to dened contribution pension schemes 88 95
1,038 1,012
In addition to the above, the Group recognised total expenses of £274,000 in respect of equity-settled share-based paymenttransactions with Directors in the year ended 31 May 2011 (2010: £194,000).
Details of the Directors’ interests in the ordinary share capital of the Company are provided in the Directors’ Report.
Directors’ emoluments (excluding pensions)
Fees/Basic Annual Other 2011 2010
salary bonuses benets total total
Name of Director £’000 £’000 £’000 £’000 £’000
Executive J R Ford 158 118 13 289 280R A Whiting 249 249 34 532 508Non-Executive J K Acornley 33 — — 33 33M H Hudson 63 — — 63 63D R Southworth 33 — — 33 33
Aggregate emoluments 536 367 47 950 917
In addition to the above, in the year ended 31 May 2011, the Group recognised total expenses of £218,800 (2010: £164,000) and
£55,200 (2010: £30,000) in respect of equity-settled share-based payment transactions with R A Whiting and J R Ford respectively.These transactions relate to conditional share awards made under the performance share plan (see below).
Performance share plan (‘the Plan’)
The Group operates a performance share plan (‘the Plan’) for senior executives, which has been developed in line with ABI guidelines,having taken appropriate professional advice on best practice. The Plan is a discretionary scheme which has been established forthe purpose of incentivising and retaining the Group’s eligible executive management. Ordinary shares awarded under thePlan are subject to performance criteria that require the Group to meet a minimum earnings per share over a three-year period.The Remuneration Committee has responsibility for determining the award of ordinary shares under the Plan.
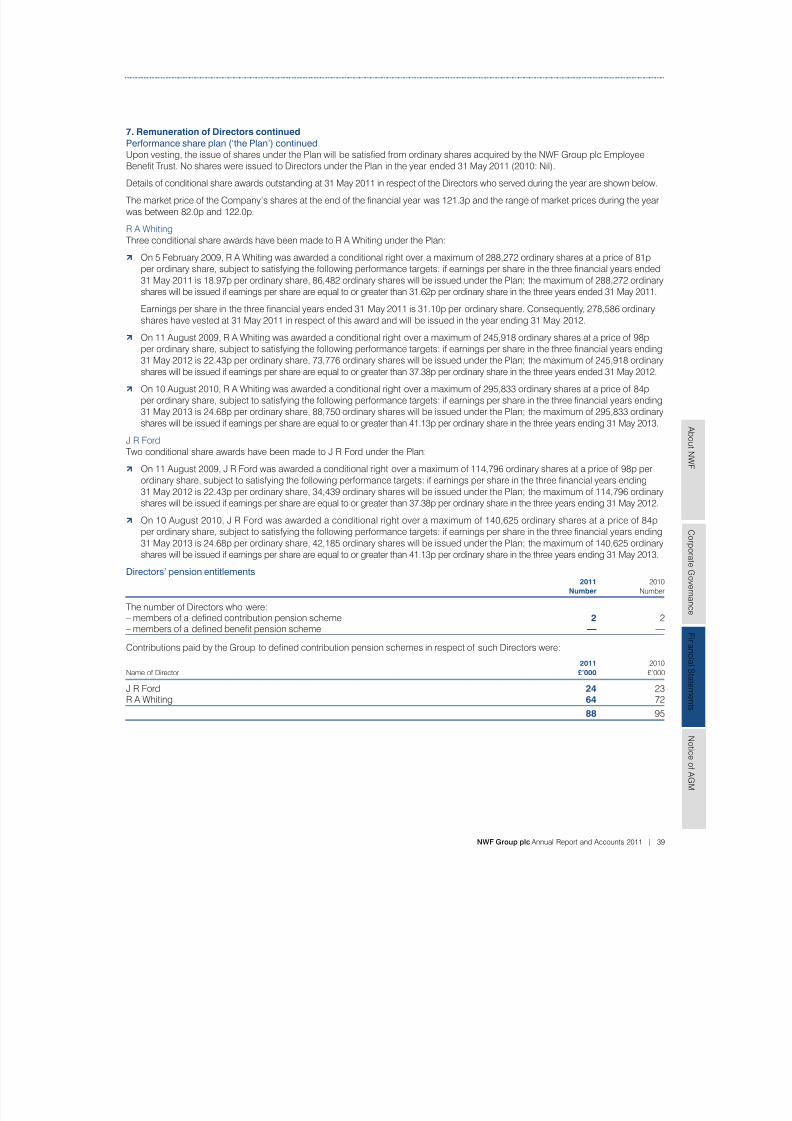
7/29/2019 NWF Group Plc Annual Report and Accounts 2011
http://slidepdf.com/reader/full/nwf-group-plc-annual-report-and-accounts-2011 41/72
NWF Group plc Annual Report and Accounts 2011 | 39
A b o u t N
WF
C or p or a t e G ov er n an c
e
F i n an c i al S t a t em en t s
N o t i c e o
f A GM
7. Remuneration of Directors continued
Performance share plan (‘the Plan’) continued
Upon vesting, the issue of shares under the Plan will be satised from ordinary shares acquired by the NWF Group plc EmployeeBenet Trust. No shares were issued to Directors under the Plan in the year ended 31 May 2011 (2010: Nil).
Details of conditional share awards outstanding at 31 May 2011 in respect of the Directors who served during the year are shown below.
The market price of the Company’s shares at the end of the nancial year was 121.3p and the range of market prices during the yearwas between 82.0p and 122.0p.
R A WhitingThree conditional share awards have been made to R A Whiting under the Plan:
b On 5 February 2009, R A Whiting was awarded a conditional right over a maximum of 288,272 ordinary shares at a price of 81pper ordinary share, subject to satisfying the following performance targets: if earnings per share in the three nancial years ended31 May 2011 is 18.97p per ordinary share, 86,482 ordinary shares will be issued under the Plan; the maximum of 288,272 ordinaryshares will be issued if earnings per share are equal to or greater than 31.62p per ordinary share in the three years ended 31 May 2011.
Earnings per share in the three nancial years ended 31 May 2011 is 31.10p per ordinary share. Consequently, 278,586 ordinaryshares have vested at 31 May 2011 in respect of this award and will be issued in the year ending 31 May 2012.
b On 11 August 2009, R A Whiting was awarded a conditional right over a maximum of 245,918 ordinary shares at a price of 98pper ordinary share, subject to satisfying the following performance targets: if earnings per share in the three nancial years ending31 May 2012 is 22.43p per ordinary share, 73,776 ordinary shares will be issued under the Plan; the maximum of 245,918 ordinaryshares will be issued if earnings per share are equal to or greater than 37.38p per ordinary share in the three years ended 31 May 2012.
b On 10 August 2010, R A Whiting was awarded a conditional right over a maximum of 295,833 ordinary shares at a price of 84pper ordinary share, subject to satisfying the following performance targets: if earnings per share in the three nancial years ending31 May 2013 is 24.68p per ordinary share, 88,750 ordinary shares will be issued under the Plan; the maximum of 295,833 ordinaryshares will be issued if earnings per share are equal to or greater than 41.13p per ordinary share in the three years ending 31 May 2013.
J R FordTwo conditional share awards have been made to J R Ford under the Plan:
b On 11 August 2009, J R Ford was awarded a conditional right over a maximum of 114,796 ordinary shares at a price of 98p perordinary share, subject to satisfying the following performance targets: if earnings per share in the three nancial years ending31 May 2012 is 22.43p per ordinary share, 34,439 ordinary shares will be issued under the Plan; the maximum of 114,796 ordinaryshares will be issued if earnings per share are equal to or greater than 37.38p per ordinary share in the three years ending 31 May 2012.
b On 10 August 2010, J R Ford was awarded a conditional right over a maximum of 140,625 ordinary shares at a price of 84pper ordinary share, subject to satisfying the following performance targets: if earnings per share in the three nancial years ending31 May 2013 is 24.68p per ordinary share, 42,185 ordinary shares will be issued under the Plan; the maximum of 140,625 ordinaryshares will be issued if earnings per share are equal to or greater than 41.13p per ordinary share in the three years ending 31 May 2013.
Directors’ pension entitlements 2011 2010
Number Number
The number of Directors who were:
– members of a dened contribution pension scheme 2 2– members of a dened benet pension scheme — —
Contributions paid by the Group to dened contribution pension schemes in respect of such Directors were:
2011 2010
Name of Director £’000 £’000
J R Ford 24 23R A Whiting 64 72
88 95
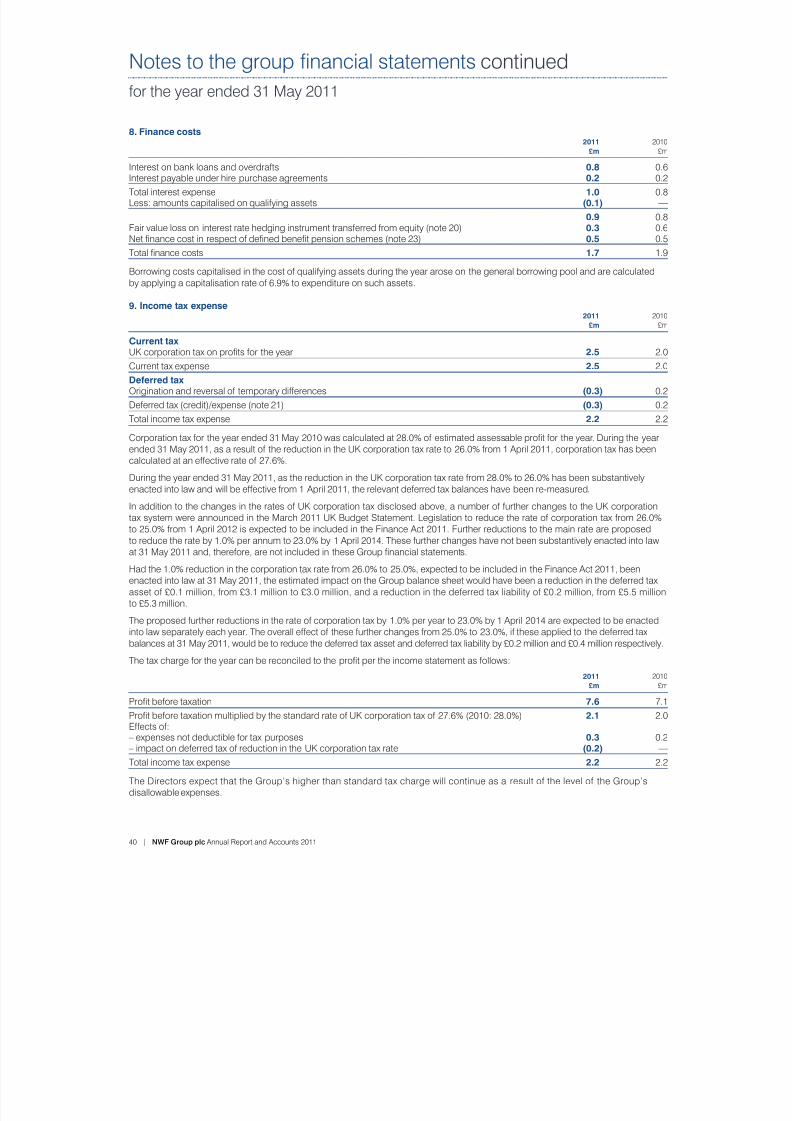
7/29/2019 NWF Group Plc Annual Report and Accounts 2011
http://slidepdf.com/reader/full/nwf-group-plc-annual-report-and-accounts-2011 42/72
40 | NWF Group plc Annual Report and Accounts 2011
Notes to the group nancial statements continued
for the year ended 31 May 2011
8. Finance costs 2011 2010
£m £m
Interest on bank loans and overdrafts 0.8 0.6Interest payable under hire purchase agreements 0.2 0.2
Total interest expense 1.0 0.8Less: amounts capitalised on qualifying assets (0.1) —
0.9 0.8Fair value loss on interest rate hedging instrument transferred from equity (note 20) 0.3 0.6Net nance cost in respect of dened benet pension schemes (note 23) 0.5 0.5
Total nance costs 1.7 1.9
Borrowing costs capitalised in the cost of qualifying assets during the year arose on the general borrowing pool and are calculatedby applying a capitalisation rate of 6.9% to expenditure on such assets.
9. Income tax expense 2011 2010
£m £m
Current tax UK corporation tax on prots for the year 2.5 2.0
Current tax expense 2.5 2.0
Deferred tax Origination and reversal of temporary differences (0.3) 0.2
Deferred tax (credit)/expense (note 21) (0.3) 0.2
Total income tax expense 2.2 2.2
Corporation tax for the year ended 31 May 2010 was calculated at 28.0% of estimated assessable prot for the year. During the yearended 31 May 2011, as a result of the reduction in the UK corporation tax rate to 26.0% from 1 April 2011, corporation tax has been
calculated at an effective rate of 27.6%.During the year ended 31 May 2011, as the reduction in the UK corporation tax rate from 28.0% to 26.0% has been substantivelyenacted into law and will be effective from 1 April 2011, the relevant deferred tax balances have been re-measured.
In addition to the changes in the rates of UK corporation tax disclosed above, a number of further changes to the UK corporationtax system were announced in the March 2011 UK Budget Statement. Legislation to reduce the rate of corporation tax from 26.0%to 25.0% from 1 April 2012 is expected to be included in the Finance Act 2011. Further reductions to the main rate are proposedto reduce the rate by 1.0% per annum to 23.0% by 1 April 2014. These further changes have not been substantively enacted into lawat 31 May 2011 and, therefore, are not included in these Group nancial statements.
Had the 1.0% reduction in the corporation tax rate from 26.0% to 25.0%, expected to be included in the Finance Act 2011, beenenacted into law at 31 May 2011, the estimated impact on the Group balance sheet would have been a reduction in the deferred taxasset of £0.1 million, from £3.1 million to £3.0 million, and a reduction in the deferred tax liability of £0.2 million, from £5.5 millionto £5.3 million.
The proposed further reductions in the rate of corporation tax by 1.0% per year to 23.0% by 1 April 2014 are expected to be enactedinto law separately each year. The overall effect of these further changes from 25.0% to 23.0%, if these applied to the deferred taxbalances at 31 May 2011, would be to reduce the deferred tax asset and deferred tax liability by £0.2 million and £0.4 million respectively.
The tax charge for the year can be reconciled to the prot per the income statement as follows:
2011 2010
£m £m
Prot before taxation 7.6 7.1
Prot before taxation multiplied by the standard rate of UK corporation tax of 27.6% (2010: 28.0%) 2.1 2.0Effects of:– expenses not deductible for tax purposes 0.3 0.2– impact on deferred tax of reduction in the UK corporation tax rate (0.2) —
Total income tax expense 2.2 2.2
The Directors expect that the Group’s higher than standard tax charge will continue as a result of the level of the Group’sdisallowable expenses.
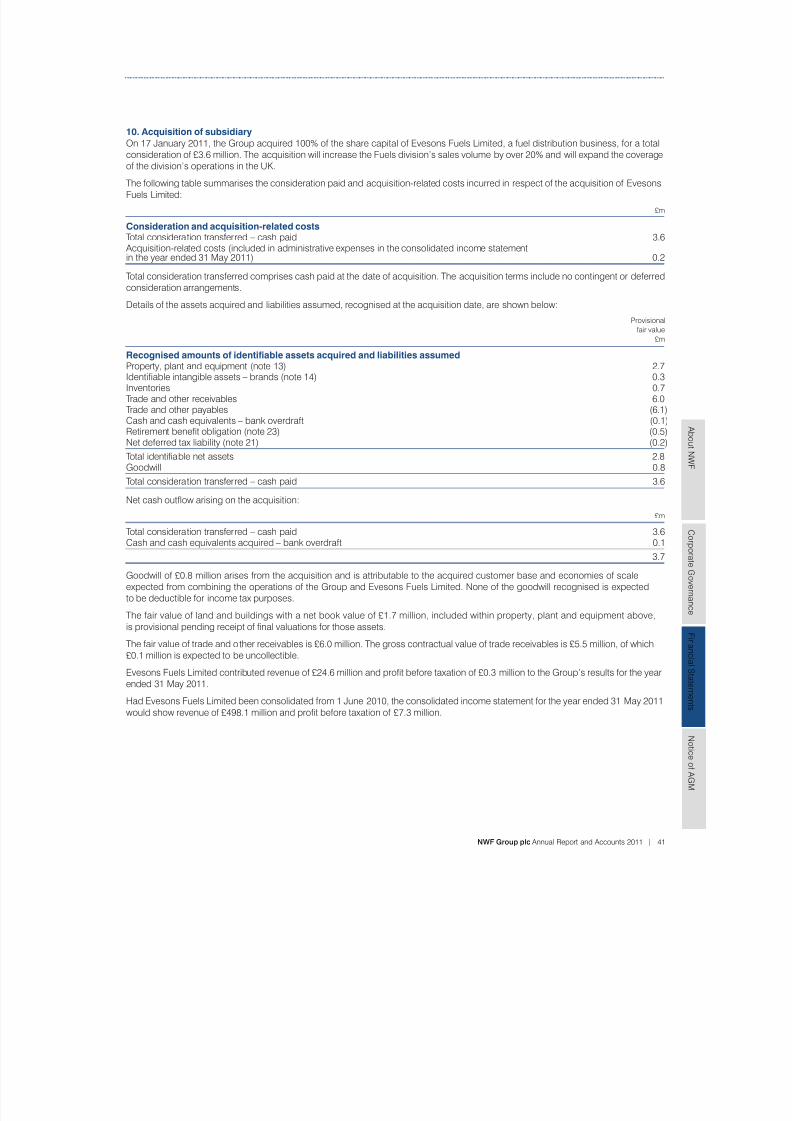
7/29/2019 NWF Group Plc Annual Report and Accounts 2011
http://slidepdf.com/reader/full/nwf-group-plc-annual-report-and-accounts-2011 43/72
NWF Group plc Annual Report and Accounts 2011 | 41
A b o u t N
WF
C or p or a t e G ov er n an c
e
F i n an c i al S t a t em en t s
N o t i c e o
f A GM
10. Acquisition of subsidiary
On 17 January 2011, the Group acquired 100% of the share capital of Evesons Fuels Limited, a fuel distribution business, for a total
consideration of £3.6 million. The acquisition will increase the Fuels division’s sales volume by over 20% and will expand the coverageof the division’s operations in the UK.
The following table summarises the consideration paid and acquisition-related costs incurred in respect of the acquisition of EvesonsFuels Limited:
£m
Consideration and acquisition-related costs Total consideration transferred – cash paid 3.6 Acquisition-related costs (included in administrative expenses in the consolidated income statement in the year ended 31 May 2011) 0.2
Total consideration transferred comprises cash paid at the date of acquisition. The acquisition terms include no contingent or deferredconsideration arrangements.
Details of the assets acquired and liabilities assumed, recognised at the acquisition date, are shown below:Provisional
fair value
£m
Recognised amounts of identiable assets acquired and liabilities assumedProperty, plant and equipment (note 13) 2.7Identiable intangible assets – brands (note 14) 0.3Inventories 0.7Trade and other receivables 6.0Trade and other payables (6.1)Cash and cash equivalents – bank overdraft (0.1)Retirement benet obligation (note 23) (0.5)Net deferred tax liability (note 21) (0.2)
Total identiable net assets 2.8Goodwill 0.8
Total consideration transferred – cash paid 3.6
Net cash outow arising on the acquisition:
£m
Total consideration transferred – cash paid 3.6Cash and cash equivalents acquired – bank overdraft 0.1
3.7
Goodwill of £0.8 million arises from the acquisition and is attributable to the acquired customer base and economies of scaleexpected from combining the operations of the Group and Evesons Fuels Limited. None of the goodwill recognised is expectedto be deductible for income tax purposes.
The fair value of land and buildings with a net book value of £1.7 million, included within property, plant and equipment above,is provisional pending receipt of nal valuations for those assets.
The fair value of trade and other receivables is £6.0 million. The gross contractual value of trade receivables is £5.5 million, of which£0.1 million is expected to be uncollectible.
Evesons Fuels Limited contributed revenue of £24.6 million and prot before taxation of £0.3 million to the Group’s results for the yearended 31 May 2011.
Had Evesons Fuels Limited been consolidated from 1 June 2010, the consolidated income statement for the year ended 31 May 2011would show revenue of £498.1 million and prot before taxation of £7.3 million.
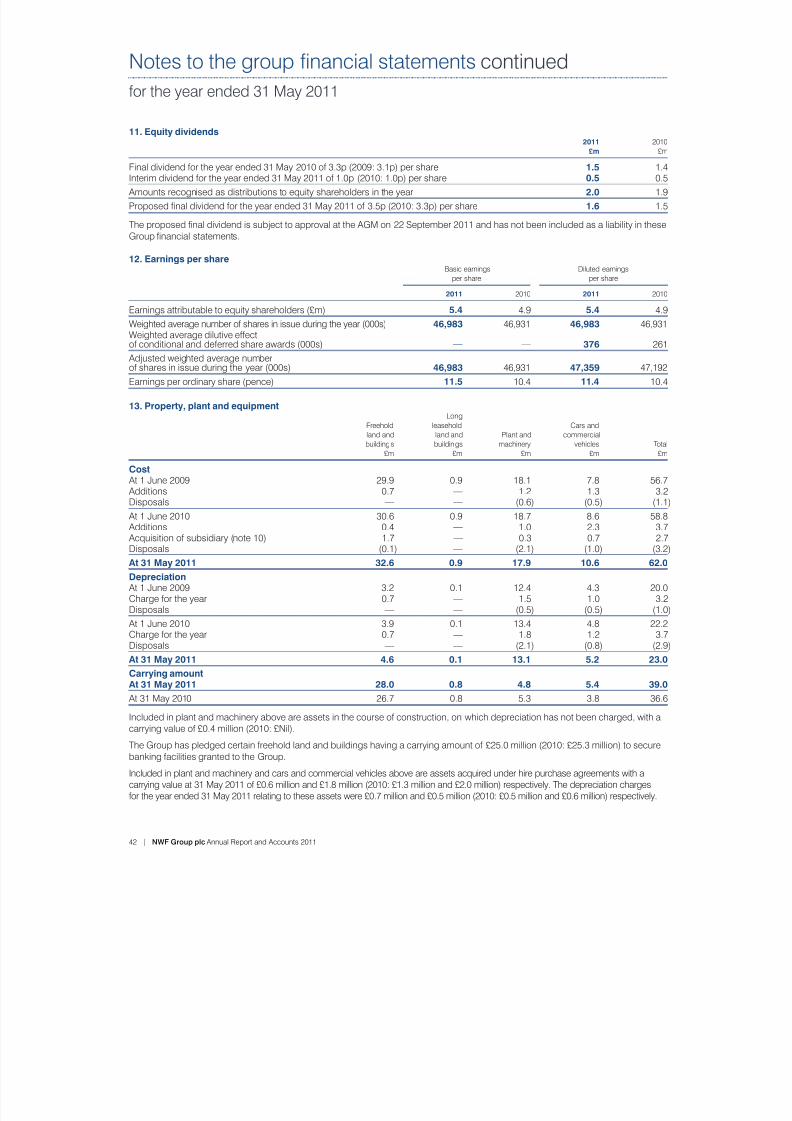
7/29/2019 NWF Group Plc Annual Report and Accounts 2011
http://slidepdf.com/reader/full/nwf-group-plc-annual-report-and-accounts-2011 44/72
42 | NWF Group plc Annual Report and Accounts 2011
Notes to the group nancial statements continued
for the year ended 31 May 2011
11. Equity dividends 2011 2010
£m £m
Final dividend for the year ended 31 May 2010 of 3.3p (2009: 3.1p) per share 1.5 1.4Interim dividend for the year ended 31 May 2011 of 1.0p (2010: 1.0p) per share 0.5 0.5
Amounts recognised as distributions to equity shareholders in the year 2.0 1.9
Proposed nal dividend for the year ended 31 May 2011 of 3.5p (2010: 3.3p) per share 1.6 1.5
The proposed nal dividend is subject to approval at the AGM on 22 September 2011 and has not been included as a liability in theseGroup nancial statements.
12. Earnings per shareBasic earnings Diluted earnings
per share per share
2011 2010 2011 2010
Earnings attributable to equity shareholders (£m) 5.4 4.9 5.4 4.9Weighted average number of shares in issue during the year (000s) 46,983 46,931 46,983 46,931Weighted average dilutive effectof conditional and deferred share awards (000s) — — 376 261
Adjusted weighted average numberof shares in issue during the year (000s) 46,983 46,931 47,359 47,192
Earnings per ordinary share (pence) 11.5 10.4 11.4 10.4
13. Property, plant and equipmentLong
Freehold leasehold Cars and
land and land and Plant and commercial
buildings buildings machinery vehicles Total
£m £m £m £m £m
Cost At 1 June 2009 29.9 0.9 18.1 7.8 56.7 Additions 0.7 — 1.2 1.3 3.2Disposals — — (0.6) (0.5) (1.1)
At 1 June 2010 30.6 0.9 18.7 8.6 58.8 Additions 0.4 — 1.0 2.3 3.7 Acquisition of subsidiary (note 10) 1.7 — 0.3 0.7 2.7Disposals (0.1) — (2.1) (1.0) (3.2)
At 31 May 2011 32.6 0.9 17.9 10.6 62.0
Depreciation At 1 June 2009 3.2 0.1 12.4 4.3 20.0Charge for the year 0.7 — 1.5 1.0 3.2Disposals — — (0.5) (0.5) (1.0)
At 1 June 2010 3.9 0.1 13.4 4.8 22.2Charge for the year 0.7 — 1.8 1.2 3.7Disposals — — (2.1) (0.8) (2.9)
At 31 May 2011 4.6 0.1 13.1 5.2 23.0
Carrying amountAt 31 May 2011 28.0 0.8 4.8 5.4 39.0
At 31 May 2010 26.7 0.8 5.3 3.8 36.6
Included in plant and machinery above are assets in the course of construction, on which depreciation has not been charged, with acarrying value of £0.4 million (2010: £Nil).
The Group has pledged certain freehold land and buildings having a carrying amount of £25.0 million (2010: £25.3 million) to securebanking facilities granted to the Group.
Included in plant and machinery and cars and commercial vehicles above are assets acquired under hire purchase agreements with acarrying value at 31 May 2011 of £0.6 million and £1.8 million (2010: £1.3 million and £2.0 million) respectively. The depreciation chargesfor the year ended 31 May 2011 relating to these assets were £0.7 million and £0.5 million (2010: £0.5 million and £0.6 million) respectively.
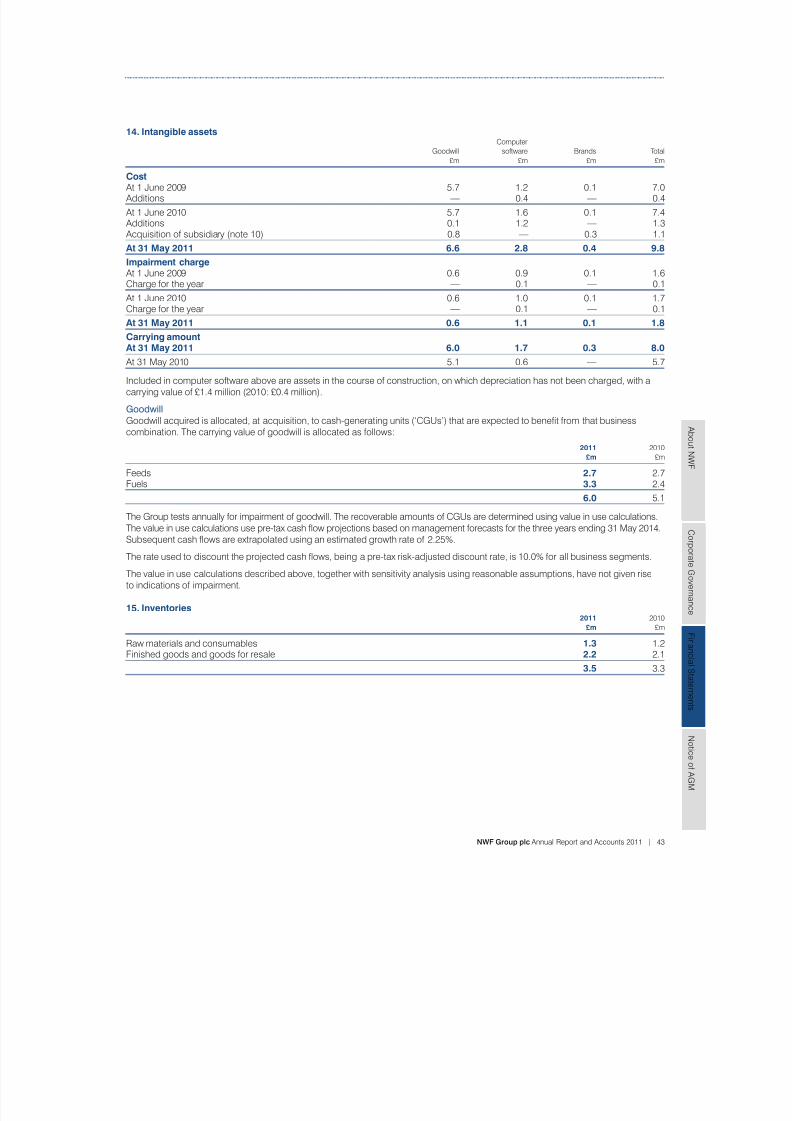
7/29/2019 NWF Group Plc Annual Report and Accounts 2011
http://slidepdf.com/reader/full/nwf-group-plc-annual-report-and-accounts-2011 45/72
NWF Group plc Annual Report and Accounts 2011 | 43
A b o u t N
WF
C or p or a t e G ov er n an c
e
F i n an c i al S t a t em en t s
N o t i c e o
f A GM
14. Intangible assetsComputer
Goodwill software Brands Total £m £m £m £m
Cost At 1 June 2009 5.7 1.2 0.1 7.0 Additions — 0.4 — 0.4
At 1 June 2010 5.7 1.6 0.1 7.4 Additions 0.1 1.2 — 1.3 Acquisition of subsidiary (note 10) 0.8 — 0.3 1.1
At 31 May 2011 6.6 2.8 0.4 9.8
Impairment charge At 1 June 2009 0.6 0.9 0.1 1.6Charge for the year — 0.1 — 0.1
At 1 June 2010 0.6 1.0 0.1 1.7
Charge for the year — 0.1 — 0.1At 31 May 2011 0.6 1.1 0.1 1.8
Carrying amountAt 31 May 2011 6.0 1.7 0.3 8.0
At 31 May 2010 5.1 0.6 — 5.7
Included in computer software above are assets in the course of construction, on which depreciation has not been charged, with acarrying value of £1.4 million (2010: £0.4 million).
Goodwill
Goodwill acquired is allocated, at acquisition, to cash-generating units (‘CGUs’) that are expected to benet from that businesscombination. The carrying value of goodwill is allocated as follows:
2011 2010
£m £m
Feeds 2.7 2.7Fuels 3.3 2.4
6.0 5.1
The Group tests annually for impairment of goodwill. The recoverable amounts of CGUs are determined using value in use calculations.The value in use calculations use pre-tax cash ow projections based on management forecasts for the three years ending 31 May 2014.Subsequent cash ows are extrapolated using an estimated growth rate of 2.25%.
The rate used to discount the projected cash ows, being a pre-tax risk-adjusted discount rate, is 10.0% for all business segments.
The value in use calculations described above, together with sensitivity analysis using reasonable assumptions, have not given riseto indications of impairment.
15. Inventories
2011 2010 £m £m
Raw materials and consumables 1.3 1.2Finished goods and goods for resale 2.2 2.1
3.5 3.3
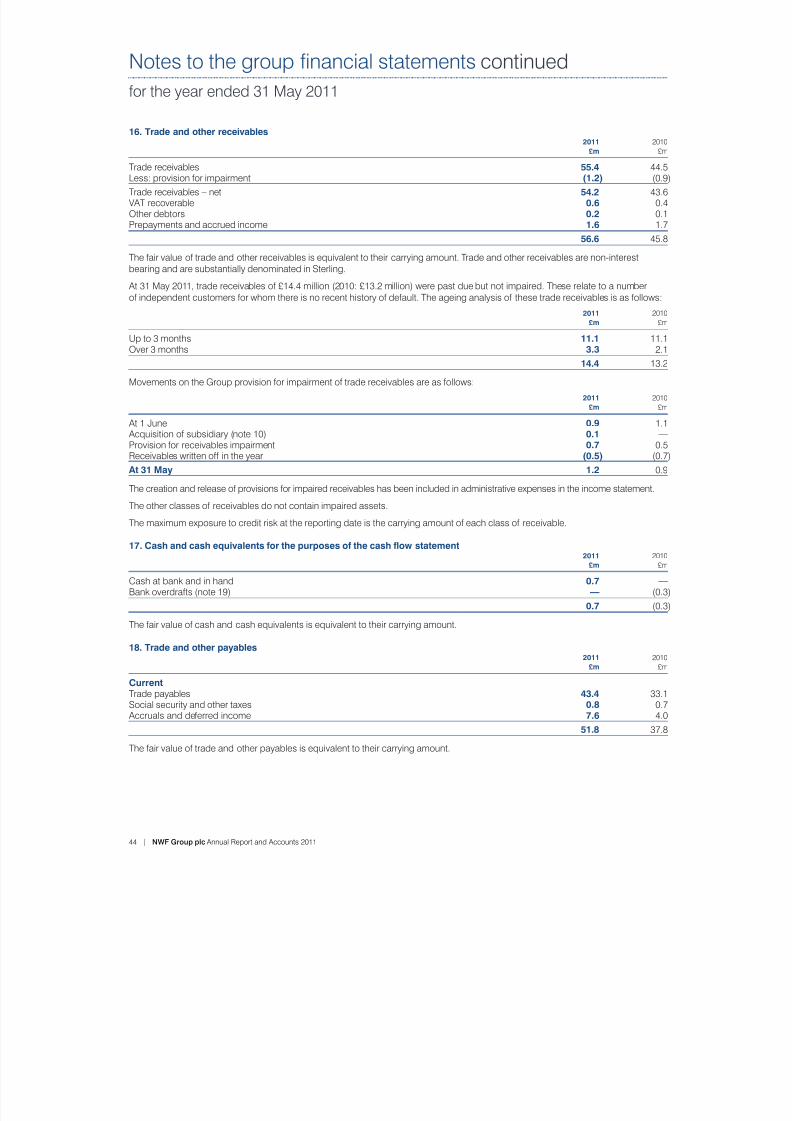
7/29/2019 NWF Group Plc Annual Report and Accounts 2011
http://slidepdf.com/reader/full/nwf-group-plc-annual-report-and-accounts-2011 46/72
44 | NWF Group plc Annual Report and Accounts 2011
Notes to the group nancial statements continued
for the year ended 31 May 2011
16. Trade and other receivables2011 2010
£m £m
Trade receivables 55.4 44.5Less: provision for impairment (1.2) (0.9)
Trade receivables – net 54.2 43.6VAT recoverable 0.6 0.4Other debtors 0.2 0.1Prepayments and accrued income 1.6 1.7
56.6 45.8
The fair value of trade and other receivables is equivalent to their carrying amount. Trade and other receivables are non-interestbearing and are substantially denominated in Sterling.
At 31 May 2011, trade receivables of £14.4 million (2010: £13.2 million) were past due but not impaired. These relate to a numberof independent customers for whom there is no recent history of default. The ageing analysis of these trade receivables is as follows:
2011 2010
£m £m
Up to 3 months 11.1 11.1Over 3 months 3.3 2.1
14.4 13.2
Movements on the Group provision for impairment of trade receivables are as follows:
2011 2010
£m £m
At 1 June 0.9 1.1 Acquisition of subsidiary (note 10) 0.1 —Provision for receivables impairment 0.7 0.5Receivables written off in the year (0.5) (0.7)
At 31 May 1.2 0.9
The creation and release of provisions for impaired receivables has been included in administrative expenses in the income statement.
The other classes of receivables do not contain impaired assets.
The maximum exposure to credit risk at the reporting date is the carrying amount of each class of receivable.
17. Cash and cash equivalents for the purposes of the cash ow statement 2011 2010
£m £m
Cash at bank and in hand 0.7 —Bank overdrafts (note 19) — (0.3)
0.7 (0.3)
The fair value of cash and cash equivalents is equivalent to their carrying amount.
18. Trade and other payables 2011 2010
£m £m
CurrentTrade payables 43.4 33.1Social security and other taxes 0.8 0.7 Accruals and deferred income 7.6 4.0
51.8 37.8
The fair value of trade and other payables is equivalent to their carrying amount.
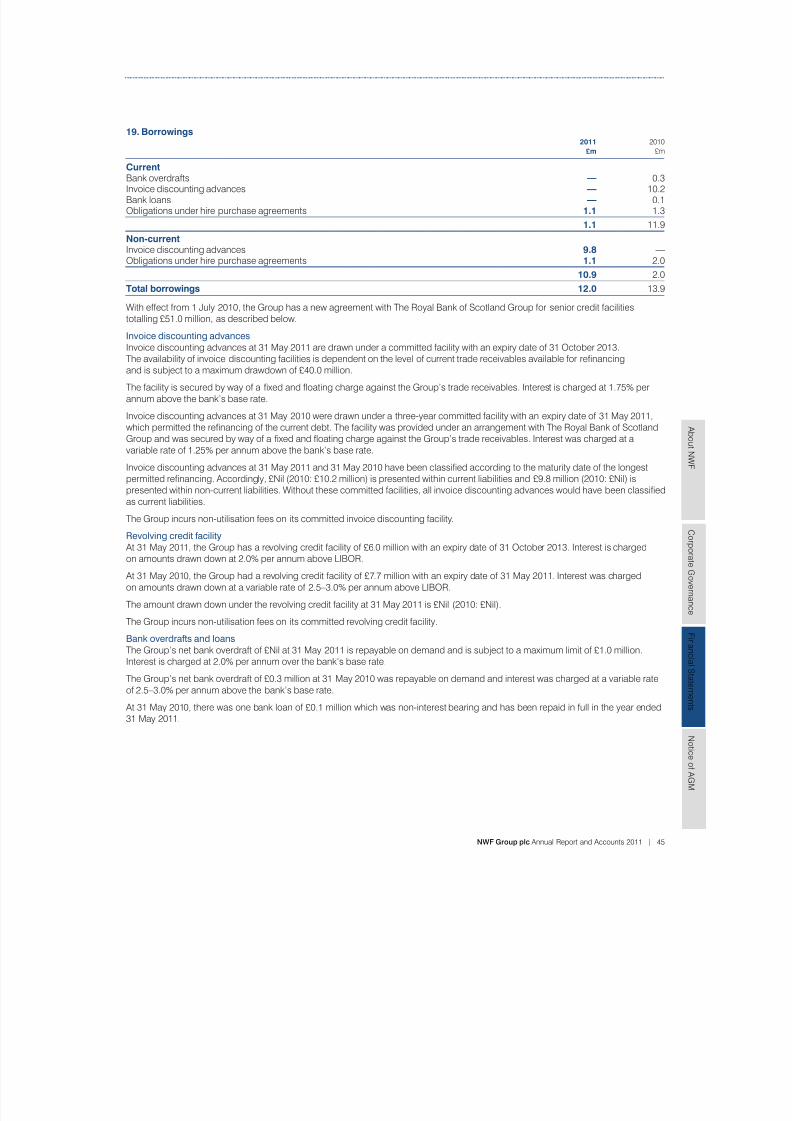
7/29/2019 NWF Group Plc Annual Report and Accounts 2011
http://slidepdf.com/reader/full/nwf-group-plc-annual-report-and-accounts-2011 47/72
NWF Group plc Annual Report and Accounts 2011 | 45
A b o u t N
WF
C or p or a t e G ov er n an c
e
F i n an c i al S t a t em en t s
N o t i c e o
f A GM
19. Borrowings 2011 2010
£m £m
Current Bank overdrafts — 0.3Invoice discounting advances — 10.2Bank loans — 0.1Obligations under hire purchase agreements 1.1 1.3
1.1 11.9
Non-current Invoice discounting advances 9.8 —Obligations under hire purchase agreements 1.1 2.0
10.9 2.0
Total borrowings 12.0 13.9
With effect from 1 July 2010, the Group has a new agreement with The Royal Bank of Scotland Group for senior credit facilitiestotalling £51.0 million, as described below.
Invoice discounting advances
Invoice discounting advances at 31 May 2011 are drawn under a committed facility with an expiry date of 31 October 2013.The availability of invoice discounting facilities is dependent on the level of current trade receivables available for renancingand is subject to a maximum drawdown of £40.0 million.
The facility is secured by way of a xed and oating charge against the Group’s trade receivables. Interest is charged at 1.75% perannum above the bank’s base rate.
Invoice discounting advances at 31 May 2010 were drawn under a three-year committed facility with an expiry date of 31 May 2011,which permitted the renancing of the current debt. The facility was provided under an arrangement with The Royal Bank of ScotlandGroup and was secured by way of a xed and oating charge against the Group’s trade receivables. Interest was charged at avariable rate of 1.25% per annum above the bank’s base rate.
Invoice discounting advances at 31 May 2011 and 31 May 2010 have been classied according to the maturity date of the longestpermitted renancing. Accordingly, £Nil (2010: £10.2 million) is presented within current liabilities and £9.8 million (2010: £Nil) ispresented within non-current liabilities. Without these committed facilities, all invoice discounting advances would have been classiedas current liabilities.
The Group incurs non-utilisation fees on its committed invoice discounting facility.
Revolving credit facility
At 31 May 2011, the Group has a revolving credit facility of £6.0 million with an expiry date of 31 October 2013. Interest is chargedon amounts drawn down at 2.0% per annum above LIBOR.
At 31 May 2010, the Group had a revolving credit facility of £7.7 million with an expiry date of 31 May 2011. Interest was chargedon amounts drawn down at a variable rate of 2.5–3.0% per annum above LIBOR.
The amount drawn down under the revolving credit facility at 31 May 2011 is £Nil (2010: £Nil).
The Group incurs non-utilisation fees on its committed revolving credit facility.
Bank overdrafts and loans
The Group’s net bank overdraft of £Nil at 31 May 2011 is repayable on demand and is subject to a maximum limit of £1.0 million.Interest is charged at 2.0% per annum over the bank’s base rate.
The Group’s net bank overdraft of £0.3 million at 31 May 2010 was repayable on demand and interest was charged at a variable rateof 2.5–3.0% per annum above the bank’s base rate.
At 31 May 2010, there was one bank loan of £0.1 million which was non-interest bearing and has been repaid in full in the year ended31 May 2011.
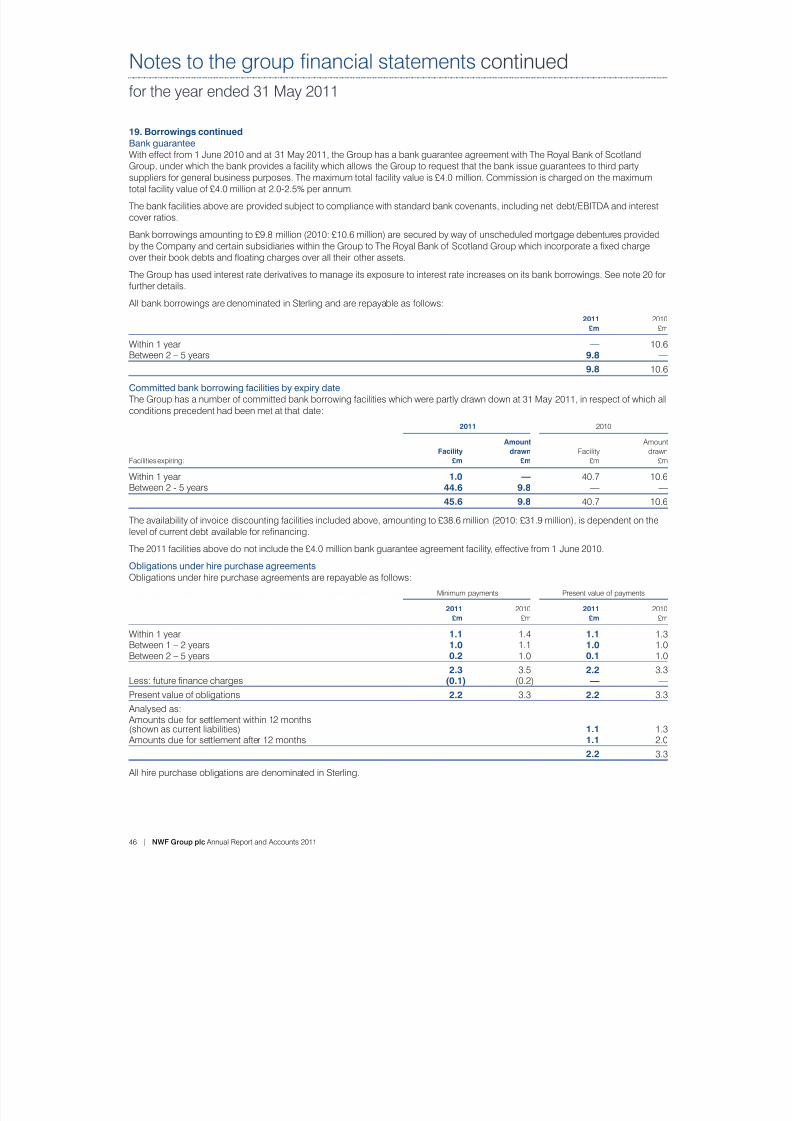
7/29/2019 NWF Group Plc Annual Report and Accounts 2011
http://slidepdf.com/reader/full/nwf-group-plc-annual-report-and-accounts-2011 48/72
46 | NWF Group plc Annual Report and Accounts 2011
Notes to the group nancial statements continued
for the year ended 31 May 2011
19. Borrowings continued
Bank guarantee
With effect from 1 June 2010 and at 31 May 2011, the Group has a bank guarantee agreement with The Royal Bank of ScotlandGroup, under which the bank provides a facility which allows the Group to request that the bank issue guarantees to third partysuppliers for general business purposes. The maximum total facility value is £4.0 million. Commission is charged on the maximumtotal facility value of £4.0 million at 2.0-2.5% per annum.
The bank facilities above are provided subject to compliance with standard bank covenants, including net debt/EBITDA and interestcover ratios.
Bank borrowings amounting to £9.8 million (2010: £10.6 million) are secured by way of unscheduled mortgage debentures providedby the Company and certain subsidiaries within the Group to The Royal Bank of Scotland Group which incorporate a xed chargeover their book debts and oating charges over all their other assets.
The Group has used interest rate derivatives to manage its exposure to interest rate increases on its bank borrowings. See note 20 forfurther details.
All bank borrowings are denominated in Sterling and are repayable as follows: 2011 2010
£m £m
Within 1 year — 10.6Between 2 – 5 years 9.8 —
9.8 10.6
Committed bank borrowing facilities by expiry date
The Group has a number of committed bank borrowing facilities which were partly drawn down at 31 May 2011, in respect of which allconditions precedent had been met at that date:
2011 2010
Amount AmountFacility drawn Facility drawn
Facilities expiring: £m £m £m £m
Within 1 year 1.0 — 40.7 10.6Between 2 - 5 years 44.6 9.8 — —
45.6 9.8 40.7 10.6
The availability of invoice discounting facilities included above, amounting to £38.6 million (2010: £31.9 million), is dependent on thelevel of current debt available for renancing.
The 2011 facilities above do not include the £4.0 million bank guarantee agreement facility, effective from 1 June 2010.
Obligations under hire purchase agreements
Obligations under hire purchase agreements are repayable as follows:
Minimum payments Present value of payments
2011 2010 2011 2010
£m £m £m £m
Within 1 year 1.1 1.4 1.1 1.3Between 1 – 2 years 1.0 1.1 1.0 1.0Between 2 – 5 years 0.2 1.0 0.1 1.0
2.3 3.5 2.2 3.3Less: future nance charges (0.1) (0.2) — —
Present value of obligations 2.2 3.3 2.2 3.3
Analysed as: Amounts due for settlement within 12 months(shown as current liabilities) 1.1 1.3 Amounts due for settlement after 12 months 1.1 2.0
2.2 3.3
All hire purchase obligations are denominated in Sterling.
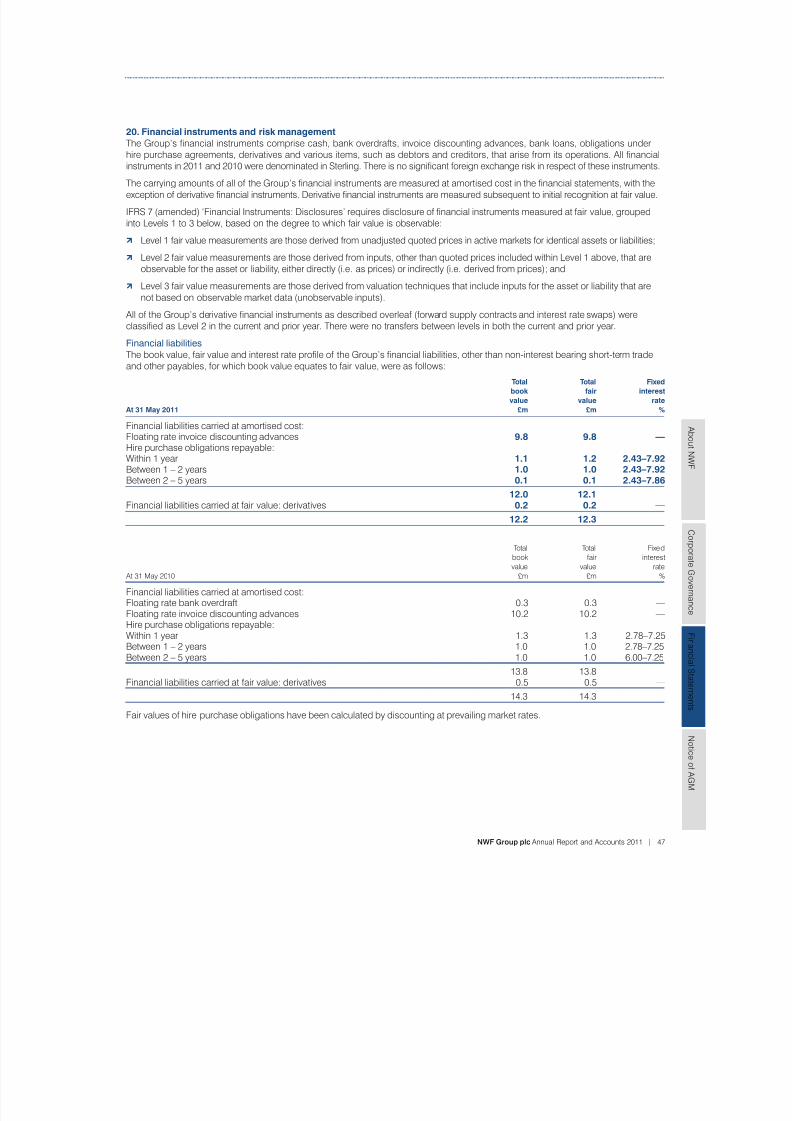
7/29/2019 NWF Group Plc Annual Report and Accounts 2011
http://slidepdf.com/reader/full/nwf-group-plc-annual-report-and-accounts-2011 49/72
NWF Group plc Annual Report and Accounts 2011 | 47
A b o u t N
WF
C or p or a t e G ov er n an c
e
F i n an c i al S t a t em en t s
N o t i c e o
f A GM
20. Financial instruments and risk management
The Group’s nancial instruments comprise cash, bank overdrafts, invoice discounting advances, bank loans, obligations under
hire purchase agreements, derivatives and various items, such as debtors and creditors, that arise from its operations. All nancialinstruments in 2011 and 2010 were denominated in Sterling. There is no signicant foreign exchange risk in respect of these instruments.
The carrying amounts of all of the Group’s nancial instruments are measured at amortised cost in the nancial statements, with theexception of derivative nancial instruments. Derivative nancial instruments are measured subsequent to initial recognition at fair value.
IFRS 7 (amended) ‘Financial Instruments: Disclosures’ requires disclosure of nancial instruments measured at fair value, groupedinto Levels 1 to 3 below, based on the degree to which fair value is observable:
b Level 1 fair value measurements are those derived from unadjusted quoted prices in active markets for identical assets or liabilities;
b Level 2 fair value measurements are those derived from inputs, other than quoted prices included within Level 1 above, that areobservable for the asset or liability, either directly (i.e. as prices) or indirectly (i.e. derived from prices); and
b Level 3 fair value measurements are those derived from valuation techniques that include inputs for the asset or liability that arenot based on observable market data (unobservable inputs).
All of the Group’s derivative nancial instruments as described overleaf (forward supply contracts and interest rate swaps) wereclassied as Level 2 in the current and prior year. There were no transfers between levels in both the current and prior year.
Financial liabilities
The book value, fair value and interest rate prole of the Group’s nancial liabilities, other than non-interest bearing short-term tradeand other payables, for which book value equates to fair value, were as follows:
Total Total Fixed
book fair interest
value value rate
At 31 May 2011 £m £m %
Financial liabilities carried at amortised cost:Floating rate invoice discounting advances 9.8 9.8 —Hire purchase obligations repayable:
Within 1 year 1.1 1.2 2.43–7.92Between 1 – 2 years 1.0 1.0 2.43–7.92Between 2 – 5 years 0.1 0.1 2.43–7.86
12.0 12.1Financial liabilities carried at fair value: derivatives 0.2 0.2 —
12.2 12.3
Total Total Fixed
book fair interest
value value rate
At 31 May 2010 £m £m %
Financial liabilities carried at amortised cost:Floating rate bank overdraft 0.3 0.3 —
Floating rate invoice discounting advances 10.2 10.2 —Hire purchase obligations repayable:Within 1 year 1.3 1.3 2.78–7.25Between 1 – 2 years 1.0 1.0 2.78–7.25Between 2 – 5 years 1.0 1.0 6.00–7.25
13.8 13.8Financial liabilities carried at fair value: derivatives 0.5 0.5 —
14.3 14.3
Fair values of hire purchase obligations have been calculated by discounting at prevailing market rates.
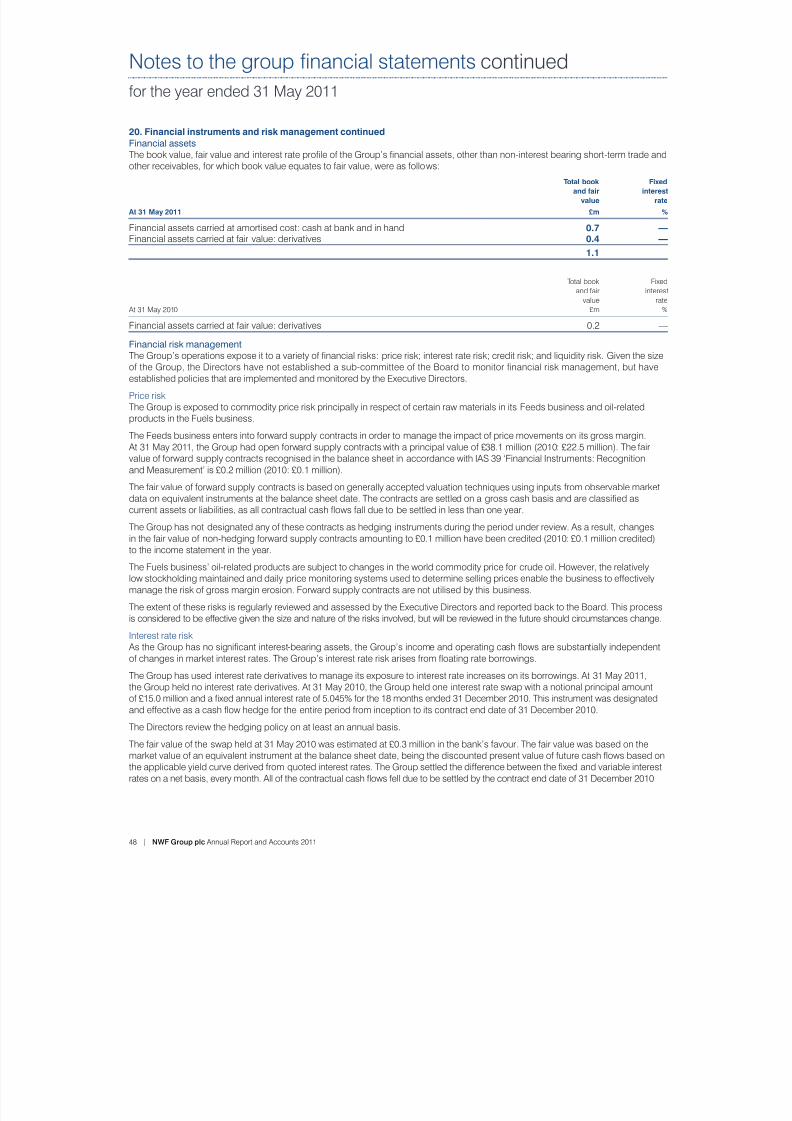
7/29/2019 NWF Group Plc Annual Report and Accounts 2011
http://slidepdf.com/reader/full/nwf-group-plc-annual-report-and-accounts-2011 50/72
48 | NWF Group plc Annual Report and Accounts 2011
Notes to the group nancial statements continued
for the year ended 31 May 2011
20. Financial instruments and risk management continued
Financial assets
The book value, fair value and interest rate prole of the Group’s nancial assets, other than non-interest bearing short-term trade andother receivables, for which book value equates to fair value, were as follows:
Total book Fixed
and fair interest
value rate
At 31 May 2011 £m %
Financial assets carried at amortised cost: cash at bank and in hand 0.7 —Financial assets carried at fair value: derivatives 0.4 —
1.1
Total book Fixed
and fair interest
value rate
At 31 May 2010 £m %
Financial assets carried at fair value: derivatives 0.2 —
Financial risk management
The Group’s operations expose it to a variety of nancial risks: price risk; interest rate risk; credit risk; and liquidity risk. Given the sizeof the Group, the Directors have not established a sub-committee of the Board to monitor nancial risk management, but haveestablished policies that are implemented and monitored by the Executive Directors.
Price riskThe Group is exposed to commodity price risk principally in respect of certain raw materials in its Feeds business and oil-relatedproducts in the Fuels business.
The Feeds business enters into forward supply contracts in order to manage the impact of price movements on its gross margin. At 31 May 2011, the Group had open forward supply contracts with a principal value of £38.1 million (2010: £22.5 million). The fair
value of forward supply contracts recognised in the balance sheet in accordance with IAS 39 ‘Financial Instruments: Recognitionand Measurement’ is £0.2 million (2010: £0.1 million).
The fair value of forward supply contracts is based on generally accepted valuation techniques using inputs from observable marketdata on equivalent instruments at the balance sheet date. The contracts are settled on a gross cash basis and are classied ascurrent assets or liabilities, as all contractual cash ows fall due to be settled in less than one year.
The Group has not designated any of these contracts as hedging instruments during the period under review. As a result, changesin the fair value of non-hedging forward supply contracts amounting to £0.1 million have been credited (2010: £0.1 million credited)to the income statement in the year.
The Fuels business’ oil-related products are subject to changes in the world commodity price for crude oil. However, the relativelylow stockholding maintained and daily price monitoring systems used to determine selling prices enable the business to effectivelymanage the risk of gross margin erosion. Forward supply contracts are not utilised by this business.
The extent of these risks is regularly reviewed and assessed by the Executive Directors and reported back to the Board. This process
is considered to be effective given the size and nature of the risks involved, but will be reviewed in the future should circumstances change.
Interest rate risk As the Group has no signicant interest-bearing assets, the Group’s income and operating cash ows are substantially independentof changes in market interest rates. The Group’s interest rate risk arises from oating rate borrowings.
The Group has used interest rate derivatives to manage its exposure to interest rate increases on its borrowings. At 31 May 2011,the Group held no interest rate derivatives. At 31 May 2010, the Group held one interest rate swap with a notional principal amountof £15.0 million and a xed annual interest rate of 5.045% for the 18 months ended 31 December 2010. This instrument was designatedand effective as a cash ow hedge for the entire period from inception to its contract end date of 31 December 2010.
The Directors review the hedging policy on at least an annual basis.
The fair value of the swap held at 31 May 2010 was estimated at £0.3 million in the bank’s favour. The fair value was based on themarket value of an equivalent instrument at the balance sheet date, being the discounted present value of future cash ows based on
the applicable yield curve derived from quoted interest rates. The Group settled the difference between the xed and variable interestrates on a net basis, every month. All of the contractual cash ows fell due to be settled by the contract end date of 31 December 2010.
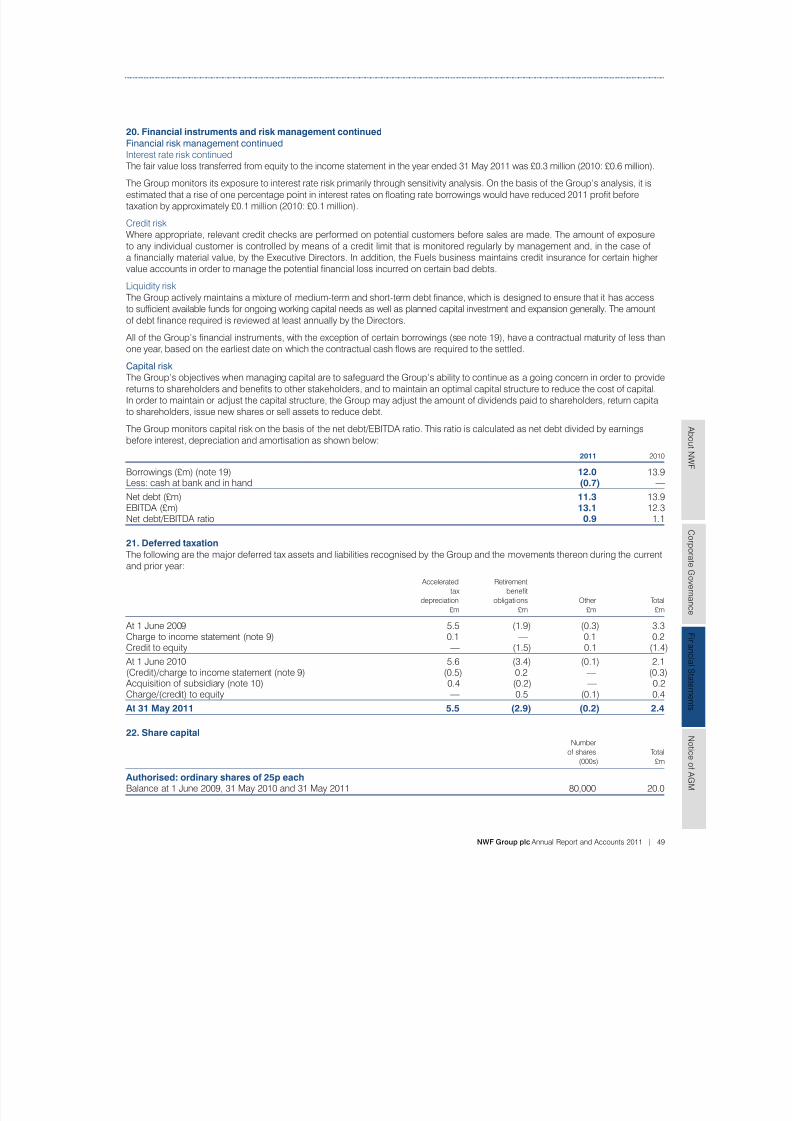
7/29/2019 NWF Group Plc Annual Report and Accounts 2011
http://slidepdf.com/reader/full/nwf-group-plc-annual-report-and-accounts-2011 51/72
NWF Group plc Annual Report and Accounts 2011 | 49
A b o u t N
WF
C or p or a t e G ov er n an c
e
F i n an c i al S t a t em en t s
N o t i c e o
f A GM
20. Financial instruments and risk management continued
Financial risk management continued
Interest rate risk continuedThe fair value loss transferred from equity to the income statement in the year ended 31 May 2011 was £0.3 million (2010: £0.6 million).
The Group monitors its exposure to interest rate risk primarily through sensitivity analysis. On the basis of the Group’s analysis, it isestimated that a rise of one percentage point in interest rates on oating rate borrowings would have reduced 2011 prot beforetaxation by approximately £0.1 million (2010: £0.1 million).
Credit riskWhere appropriate, relevant credit checks are performed on potential customers before sales are made. The amount of exposureto any individual customer is controlled by means of a credit limit that is monitored regularly by management and, in the case ofa nancially material value, by the Executive Directors. In addition, the Fuels business maintains credit insurance for certain highervalue accounts in order to manage the potential nancial loss incurred on certain bad debts.
Liquidity riskThe Group actively maintains a mixture of medium-term and short-term debt nance, which is designed to ensure that it has access
to sufcient available funds for ongoing working capital needs as well as planned capital investment and expansion generally. The amountof debt nance required is reviewed at least annually by the Directors.
All of the Group’s nancial instruments, with the exception of certain borrowings (see note 19), have a contractual maturity of less thanone year, based on the earliest date on which the contractual cash ows are required to the settled.
Capital risk
The Group’s objectives when managing capital are to safeguard the Group’s ability to continue as a going concern in order to providereturns to shareholders and benets to other stakeholders, and to maintain an optimal capital structure to reduce the cost of capital.In order to maintain or adjust the capital structure, the Group may adjust the amount of dividends paid to shareholders, return capitalto shareholders, issue new shares or sell assets to reduce debt.
The Group monitors capital risk on the basis of the net debt/EBITDA ratio. This ratio is calculated as net debt divided by earningsbefore interest, depreciation and amortisation as shown below:
2011 2010
Borrowings (£m) (note 19) 12.0 13.9Less: cash at bank and in hand (0.7) —
Net debt (£m) 11.3 13.9EBITDA (£m) 13.1 12.3Net debt/EBITDA ratio 0.9 1.1
21. Deferred taxation
The following are the major deferred tax assets and liabilities recognised by the Group and the movements thereon during the currentand prior year:
Accelerated Retirement
tax benet
depreciation obligations Other Total
£m £m £m £m
At 1 June 2009 5.5 (1.9) (0.3) 3.3Charge to income statement (note 9) 0.1 — 0.1 0.2Credit to equity — (1.5) 0.1 (1.4)
At 1 June 2010 5.6 (3.4) (0.1) 2.1(Credit)/charge to income statement (note 9) (0.5) 0.2 — (0.3) Acquisition of subsidiary (note 10) 0.4 (0.2) — 0.2Charge/(credit) to equity — 0.5 (0.1) 0.4
At 31 May 2011 5.5 (2.9) (0.2) 2.4
22. Share capitalNumber
of shares Total
(000s) £m
Authorised: ordinary shares of 25p eachBalance at 1 June 2009, 31 May 2010 and 31 May 2011 80,000 20.0
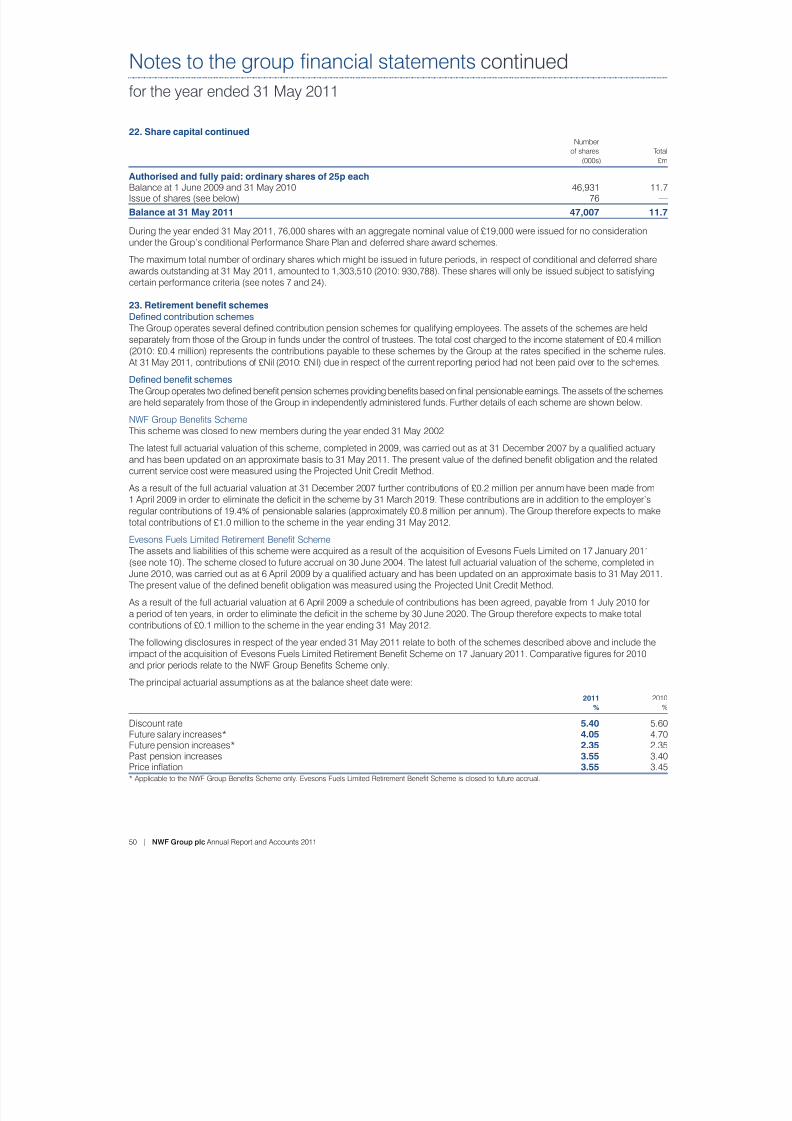
7/29/2019 NWF Group Plc Annual Report and Accounts 2011
http://slidepdf.com/reader/full/nwf-group-plc-annual-report-and-accounts-2011 52/72
50 | NWF Group plc Annual Report and Accounts 2011
Notes to the group nancial statements continued
for the year ended 31 May 2011
22. Share capital continuedNumber
of shares Total(000s) £m
Authorised and fully paid: ordinary shares of 25p eachBalance at 1 June 2009 and 31 May 2010 46,931 11.7Issue of shares (see below) 76 —
Balance at 31 May 2011 47,007 11.7
During the year ended 31 May 2011, 76,000 shares with an aggregate nominal value of £19,000 were issued for no considerationunder the Group’s conditional Performance Share Plan and deferred share award schemes.
The maximum total number of ordinary shares which might be issued in future periods, in respect of conditional and deferred shareawards outstanding at 31 May 2011, amounted to 1,303,510 (2010: 930,788). These shares will only be issued subject to satisfyingcertain performance criteria (see notes 7 and 24).
23. Retirement benet schemesDened contribution schemes
The Group operates several dened contribution pension schemes for qualifying employees. The assets of the schemes are heldseparately from those of the Group in funds under the control of trustees. The total cost charged to the income statement of £0.4 million(2010: £0.4 million) represents the contributions payable to these schemes by the Group at the rates specied in the scheme rules. At 31 May 2011, contributions of £Nil (2010: £Nil) due in respect of the current reporting period had not been paid over to the schemes.
Dened benet schemes
The Group operates two dened benet pension schemes providing benets based on nal pensionable earnings. The assets of the schemesare held separately from those of the Group in independently administered funds. Further details of each scheme are shown below.
NWF Group Benets SchemeThis scheme was closed to new members during the year ended 31 May 2002.
The latest full actuarial valuation of this scheme, completed in 2009, was carried out as at 31 December 2007 by a qualied actuary
and has been updated on an approximate basis to 31 May 2011. The present value of the dened benet obligation and the relatedcurrent service cost were measured using the Projected Unit Credit Method.
As a result of the full actuarial valuation at 31 December 2007 further contributions of £0.2 million per annum have been made from1 April 2009 in order to eliminate the decit in the scheme by 31 March 2019. These contributions are in addition to the employer’sregular contributions of 19.4% of pensionable salaries (approximately £0.8 million per annum). The Group therefore expects to maketotal contributions of £1.0 million to the scheme in the year ending 31 May 2012.
Evesons Fuels Limited Retirement Benet SchemeThe assets and liabilities of this scheme were acquired as a result of the acquisition of Evesons Fuels Limited on 17 January 2011(see note 10). The scheme closed to future accrual on 30 June 2004. The latest full actuarial valuation of the scheme, completed inJune 2010, was carried out as at 6 April 2009 by a qualied actuary and has been updated on an approximate basis to 31 May 2011.The present value of the dened benet obligation was measured using the Projected Unit Credit Method.
As a result of the full actuarial valuation at 6 April 2009 a schedule of contributions has been agreed, payable from 1 July 2010 for
a period of ten years, in order to eliminate the decit in the scheme by 30 June 2020. The Group therefore expects to make totalcontributions of £0.1 million to the scheme in the year ending 31 May 2012.
The following disclosures in respect of the year ended 31 May 2011 relate to both of the schemes described above and include theimpact of the acquisition of Evesons Fuels Limited Retirement Benet Scheme on 17 January 2011. Comparative gures for 2010and prior periods relate to the NWF Group Benets Scheme only.
The principal actuarial assumptions as at the balance sheet date were:
2011 2010
% %
Discount rate 5.40 5.60Future salary increases* 4.05 4.70Future pension increases* 2.35 2.35Past pension increases 3.55 3.40
Price ination 3.55 3.45* Applicable to the NWF Group Benets Scheme only. Evesons Fuels Limited Retirement Benet Scheme is closed to future accrual.
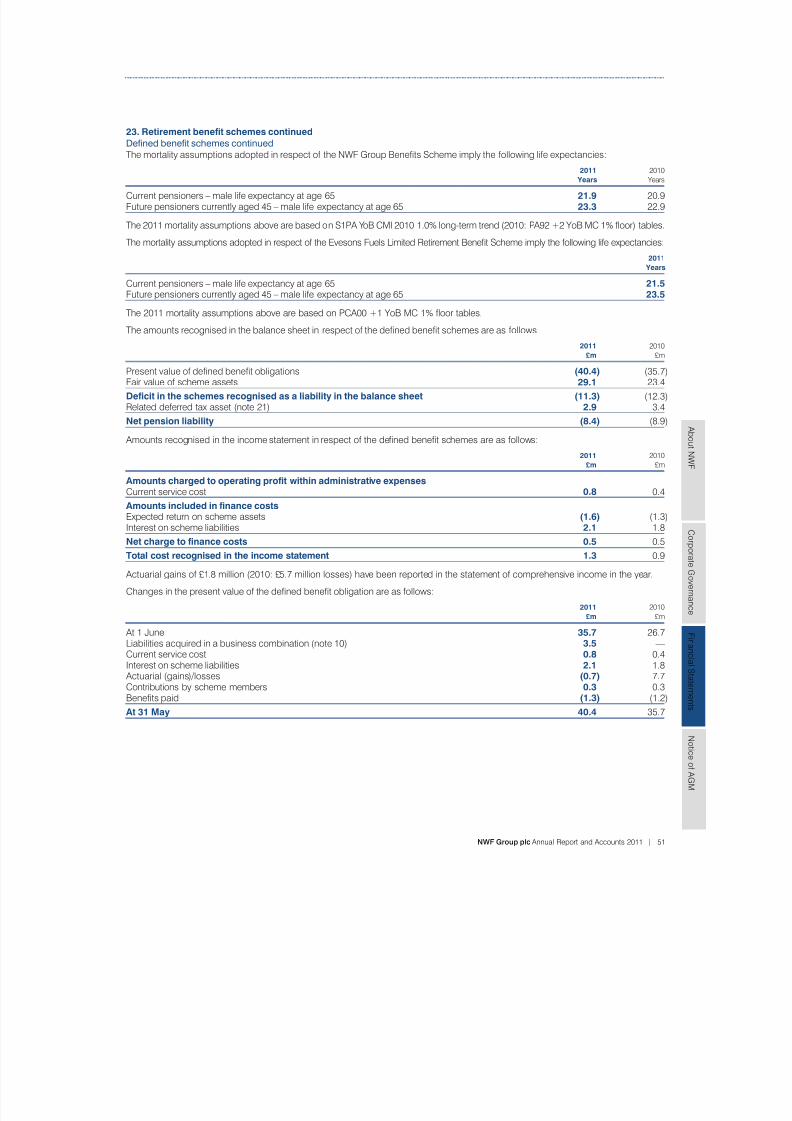
7/29/2019 NWF Group Plc Annual Report and Accounts 2011
http://slidepdf.com/reader/full/nwf-group-plc-annual-report-and-accounts-2011 53/72
NWF Group plc Annual Report and Accounts 2011 | 51
A b o u t N
WF
C or p or a t e G ov er n an c
e
F i n an c i al S t a t em en t s
N o t i c e o
f A GM
23. Retirement benet schemes continued
Dened benet schemes continued
The mortality assumptions adopted in respect of the NWF Group Benets Scheme imply the following life expectancies: 2011 2010
Years Years
Current pensioners – male life expectancy at age 65 21.9 20.9Future pensioners currently aged 45 – male life expectancy at age 65 23.3 22.9
The 2011 mortality assumptions above are based on S1PA YoB CMI 2010 1.0% long-term trend (2010: PA92 +2 YoB MC 1% oor) tables.
The mortality assumptions adopted in respect of the Evesons Fuels Limited Retirement Benet Scheme imply the following life expectancies:
2011
Years
Current pensioners – male life expectancy at age 65 21.5Future pensioners currently aged 45 – male life expectancy at age 65 23.5
The 2011 mortality assumptions above are based on PCA00 +1 YoB MC 1% oor tables.
The amounts recognised in the balance sheet in respect of the dened benet schemes are as follows:
2011 2010
£m £m
Present value of dened benet obligations (40.4) (35.7)Fair value of scheme assets 29.1 23.4
Decit in the schemes recognised as a liability in the balance sheet (11.3) (12.3)Related deferred tax asset (note 21) 2.9 3.4
Net pension liability (8.4) (8.9)
Amounts recognised in the income statement in respect of the dened benet schemes are as follows:
2011 2010
£m £m
Amounts charged to operating prot within administrative expenses Current service cost 0.8 0.4
Amounts included in nance costs Expected return on scheme assets (1.6) (1.3)Interest on scheme liabilities 2.1 1.8
Net charge to nance costs 0.5 0.5
Total cost recognised in the income statement 1.3 0.9
Actuarial gains of £1.8 million (2010: £5.7 million losses) have been reported in the statement of comprehensive income in the year.
Changes in the present value of the dened benet obligation are as follows:
2011 2010
£m £m
At 1 June 35.7 26.7Liabilities acquired in a business combination (note 10) 3.5 —Current service cost 0.8 0.4Interest on scheme liabilities 2.1 1.8 Actuarial (gains)/losses (0.7) 7.7Contributions by scheme members 0.3 0.3Benets paid (1.3) (1.2)
At 31 May 40.4 35.7
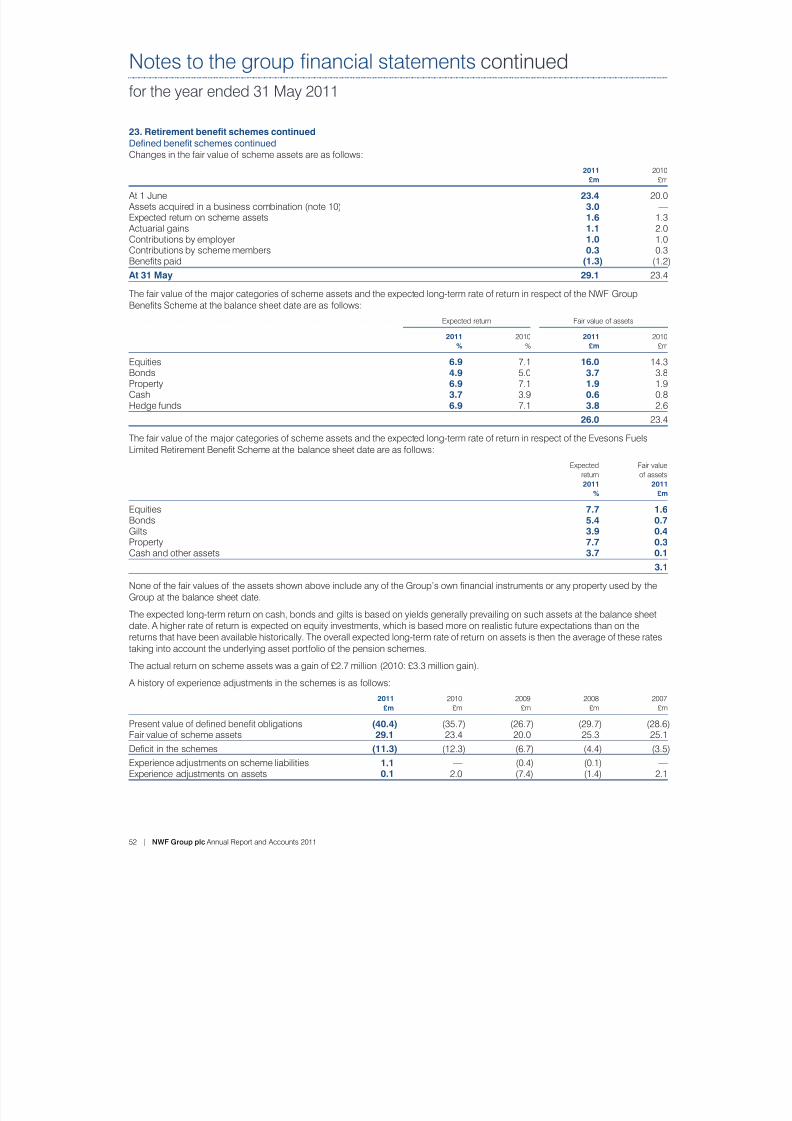
7/29/2019 NWF Group Plc Annual Report and Accounts 2011
http://slidepdf.com/reader/full/nwf-group-plc-annual-report-and-accounts-2011 54/72
52 | NWF Group plc Annual Report and Accounts 2011
Notes to the group nancial statements continued
for the year ended 31 May 2011
23. Retirement benet schemes continued
Dened benet schemes continued
Changes in the fair value of scheme assets are as follows: 2011 2010
£m £m
At 1 June 23.4 20.0 Assets acquired in a business combination (note 10) 3.0 —Expected return on scheme assets 1.6 1.3 Actuarial gains 1.1 2.0Contributions by employer 1.0 1.0Contributions by scheme members 0.3 0.3Benets paid (1.3) (1.2)
At 31 May 29.1 23.4
The fair value of the major categories of scheme assets and the expected long-term rate of return in respect of the NWF Group
Benets Scheme at the balance sheet date are as follows:Expected return Fair value of assets
2011 2010 2011 2010
% % £m £m
Equities 6.9 7.1 16.0 14.3Bonds 4.9 5.0 3.7 3.8Property 6.9 7.1 1.9 1.9Cash 3.7 3.9 0.6 0.8Hedge funds 6.9 7.1 3.8 2.6
26.0 23.4
The fair value of the major categories of scheme assets and the expected long-term rate of return in respect of the Evesons FuelsLimited Retirement Benet Scheme at the balance sheet date are as follows:
Expected Fair value return of assets
2011 2011 % £m
Equities 7.7 1.6Bonds 5.4 0.7Gilts 3.9 0.4Property 7.7 0.3Cash and other assets 3.7 0.1
3.1
None of the fair values of the assets shown above include any of the Group’s own nancial instruments or any property used by theGroup at the balance sheet date.
The expected long-term return on cash, bonds and gilts is based on yields generally prevailing on such assets at the balance sheetdate. A higher rate of return is expected on equity investments, which is based more on realistic future expectations than on thereturns that have been available historically. The overall expected long-term rate of return on assets is then the average of these ratestaking into account the underlying asset portfolio of the pension schemes.
The actual return on scheme assets was a gain of £2.7 million (2010: £3.3 million gain).
A history of experience adjustments in the schemes is as follows:
2011 2010 2009 2008 2007
£m £m £m £m £m
Present value of dened benet obligations (40.4) (35.7) (26.7) (29.7) (28.6)Fair value of scheme assets 29.1 23.4 20.0 25.3 25.1
Decit in the schemes (11.3) (12.3) (6.7) (4.4) (3.5)
Experience adjustments on scheme liabilities 1.1 — (0.4) (0.1) —
Experience adjustments on assets 0.1 2.0 (7.4) (1.4) 2.1
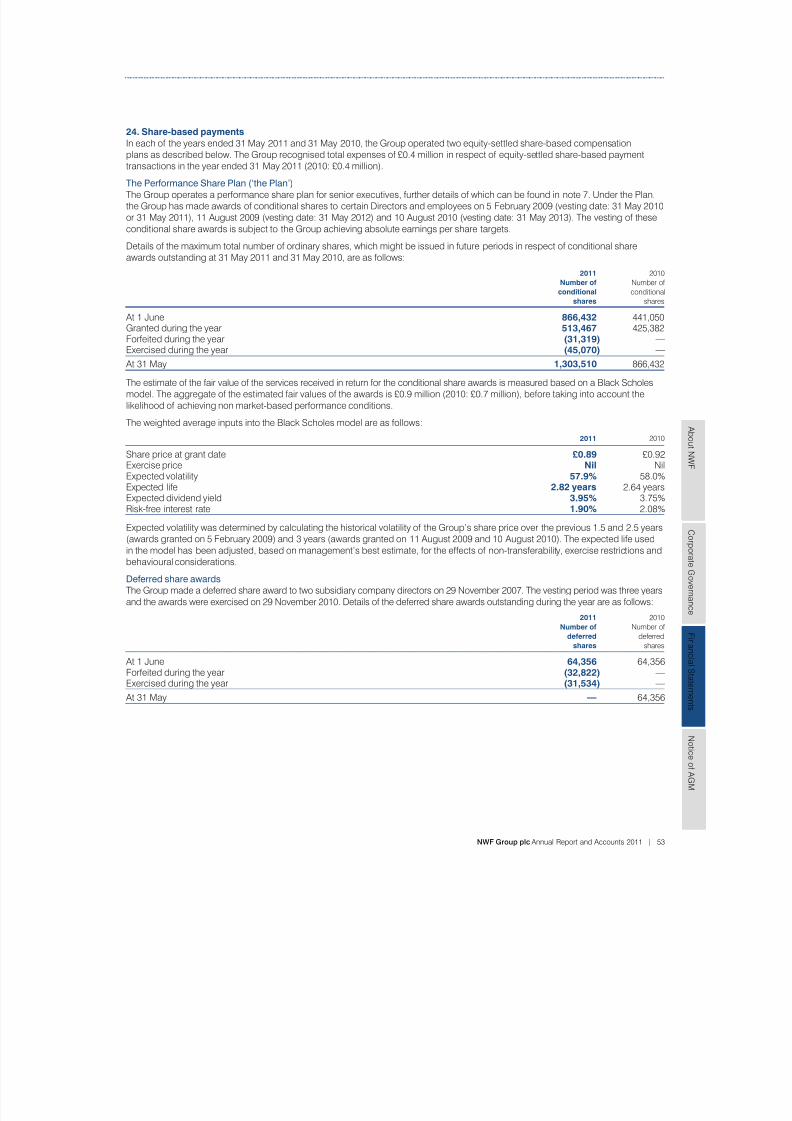
7/29/2019 NWF Group Plc Annual Report and Accounts 2011
http://slidepdf.com/reader/full/nwf-group-plc-annual-report-and-accounts-2011 55/72
NWF Group plc Annual Report and Accounts 2011 | 53
A b o u t N
WF
C or p or a t e G ov er n an c
e
F i n an c i al S t a t em en t s
N o t i c e o
f A GM
24. Share-based payments
In each of the years ended 31 May 2011 and 31 May 2010, the Group operated two equity-settled share-based compensation
plans as described below. The Group recognised total expenses of £0.4 million in respect of equity-settled share-based paymenttransactions in the year ended 31 May 2011 (2010: £0.4 million).
The Performance Share Plan (‘the Plan’)
The Group operates a performance share plan for senior executives, further details of which can be found in note 7. Under the Plan,the Group has made awards of conditional shares to certain Directors and employees on 5 February 2009 (vesting date: 31 May 2010or 31 May 2011), 11 August 2009 (vesting date: 31 May 2012) and 10 August 2010 (vesting date: 31 May 2013). The vesting of theseconditional share awards is subject to the Group achieving absolute earnings per share targets.
Details of the maximum total number of ordinary shares, which might be issued in future periods in respect of conditional shareawards outstanding at 31 May 2011 and 31 May 2010, are as follows:
2011 2010Number of Number of conditional conditional
shares shares
At 1 June 866,432 441,050Granted during the year 513,467 425,382Forfeited during the year (31,319) —Exercised during the year (45,070) —
At 31 May 1,303,510 866,432
The estimate of the fair value of the services received in return for the conditional share awards is measured based on a Black Scholesmodel. The aggregate of the estimated fair values of the awards is £0.9 million (2010: £0.7 million), before taking into account thelikelihood of achieving non market-based performance conditions.
The weighted average inputs into the Black Scholes model are as follows:
2011 2010
Share price at grant date £0.89 £0.92
Exercise price Nil NilExpected volatility 57.9% 58.0%Expected life 2.82 years 2.64 yearsExpected dividend yield 3.95% 3.75%Risk-free interest rate 1.90% 2.08%
Expected volatility was determined by calculating the historical volatility of the Group’s share price over the previous 1.5 and 2.5 years(awards granted on 5 February 2009) and 3 years (awards granted on 11 August 2009 and 10 August 2010). The expected life usedin the model has been adjusted, based on management’s best estimate, for the effects of non-transferability, exercise restrictions andbehavioural considerations.
Deferred share awards
The Group made a deferred share award to two subsidiary company directors on 29 November 2007. The vesting period was three yearsand the awards were exercised on 29 November 2010. Details of the deferred share awards outstanding during the year are as follows:
2011 2010Number of Number of
deferred deferredshares shares
At 1 June 64,356 64,356Forfeited during the year (32,822) —Exercised during the year (31,534) —
At 31 May — 64,356
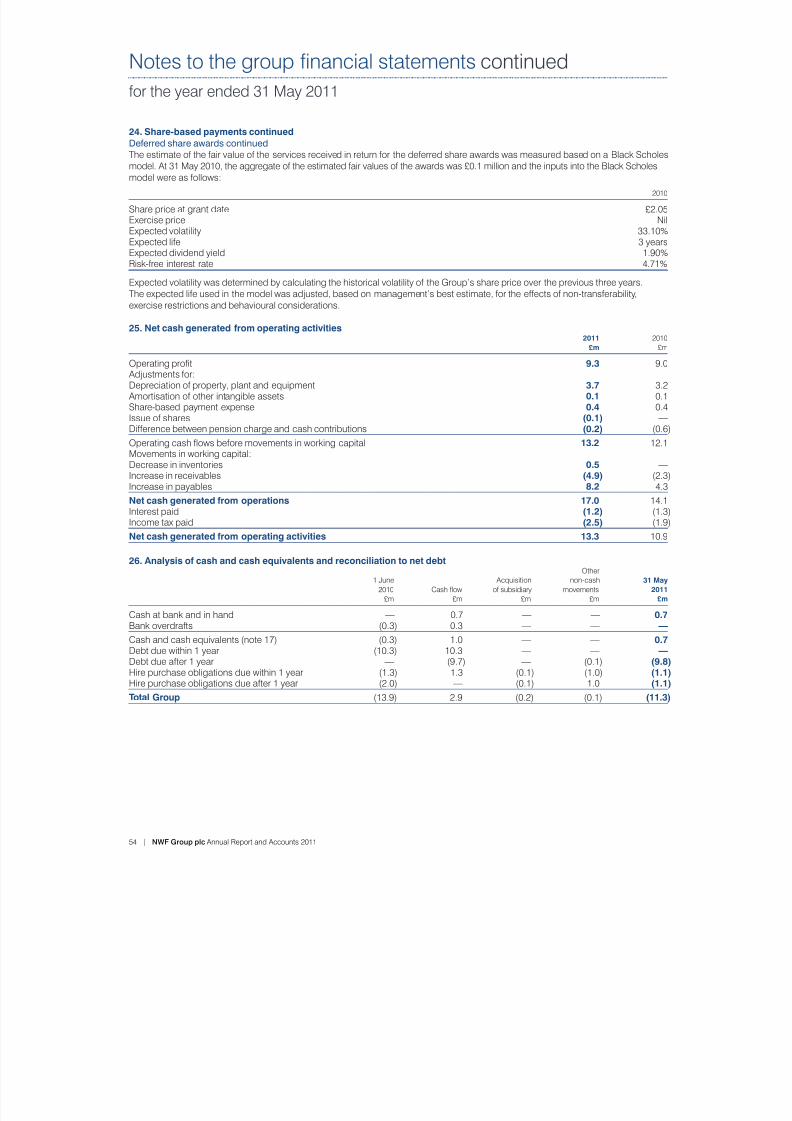
7/29/2019 NWF Group Plc Annual Report and Accounts 2011
http://slidepdf.com/reader/full/nwf-group-plc-annual-report-and-accounts-2011 56/72
54 | NWF Group plc Annual Report and Accounts 2011
Notes to the group nancial statements continued
for the year ended 31 May 2011
24. Share-based payments continued
Deferred share awards continued
The estimate of the fair value of the services received in return for the deferred share awards was measured based on a Black Scholesmodel. At 31 May 2010, the aggregate of the estimated fair values of the awards was £0.1 million and the inputs into the Black Scholesmodel were as follows:
2010
Share price at grant date £2.05Exercise price NilExpected volatility 33.10%Expected life 3 yearsExpected dividend yield 1.90%Risk-free interest rate 4.71%
Expected volatility was determined by calculating the historical volatility of the Group’s share price over the previous three years.The expected life used in the model was adjusted, based on management’s best estimate, for the effects of non-transferability,
exercise restrictions and behavioural considerations.
25. Net cash generated from operating activities 2011 2010
£m £m
Operating prot 9.3 9.0 Adjustments for:Depreciation of property, plant and equipment 3.7 3.2 Amortisation of other intangible assets 0.1 0.1Share-based payment expense 0.4 0.4Issue of shares (0.1) —Difference between pension charge and cash contributions (0.2) (0.6)
Operating cash ows before movements in working capital 13.2 12.1Movements in working capital:
Decrease in inventories 0.5 —Increase in receivables (4.9) (2.3)Increase in payables 8.2 4.3
Net cash generated from operations 17.0 14.1Interest paid (1.2) (1.3)Income tax paid (2.5) (1.9)
Net cash generated from operating activities 13.3 10.9
26. Analysis of cash and cash equivalents and reconciliation to net debtOther
1 June Acquisition non-cash 31 May
2010 Cash ow of subsidiary movements 2011
£m £m £m £m £m
Cash at bank and in hand — 0.7 — — 0.7Bank overdrafts (0.3) 0.3 — — —
Cash and cash equivalents (note 17) (0.3) 1.0 — — 0.7Debt due within 1 year (10.3) 10.3 — — — Debt due after 1 year — (9.7) — (0.1) (9.8)Hire purchase obligations due within 1 year (1.3) 1.3 (0.1) (1.0) (1.1)Hire purchase obligations due after 1 year (2.0) — (0.1) 1.0 (1.1)
Total Group (13.9) 2.9 (0.2) (0.1) (11.3)
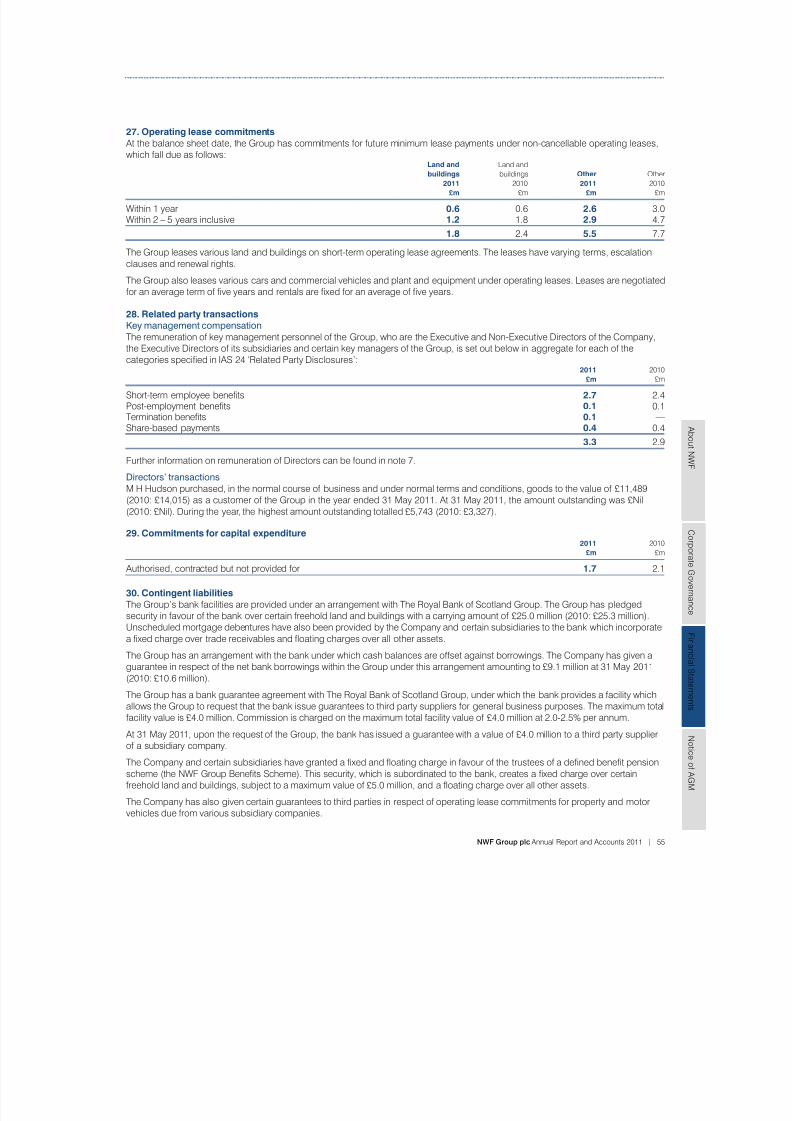
7/29/2019 NWF Group Plc Annual Report and Accounts 2011
http://slidepdf.com/reader/full/nwf-group-plc-annual-report-and-accounts-2011 57/72
NWF Group plc Annual Report and Accounts 2011 | 55
A b o u t N
WF
C or p or a t e G ov er n an c
e
F i n an c i al S t a t em en t s
N o t i c e o
f A GM
27. Operating lease commitments
At the balance sheet date, the Group has commitments for future minimum lease payments under non-cancellable operating leases,
which fall due as follows: Land and Land and
buildings buildings Other Other
2011 2010 2011 2010
£m £m £m £m
Within 1 year 0.6 0.6 2.6 3.0Within 2 – 5 years inclusive 1.2 1.8 2.9 4.7
1.8 2.4 5.5 7.7
The Group leases various land and buildings on short-term operating lease agreements. The leases have varying terms, escalationclauses and renewal rights.
The Group also leases various cars and commercial vehicles and plant and equipment under operating leases. Leases are negotiatedfor an average term of ve years and rentals are xed for an average of ve years.
28. Related party transactions
Key management compensation
The remuneration of key management personnel of the Group, who are the Executive and Non-Executive Directors of the Company,the Executive Directors of its subsidiaries and certain key managers of the Group, is set out below in aggregate for each of thecategories specied in IAS 24 ‘Related Party Disclosures’: 2011 2010
£m £m
Short-term employee benets 2.7 2.4Post-employment benets 0.1 0.1Termination benets 0.1 —Share-based payments 0.4 0.4
3.3 2.9
Further information on remuneration of Directors can be found in note 7.Directors’ transactions
M H Hudson purchased, in the normal course of business and under normal terms and conditions, goods to the value of £11,489(2010: £14,015) as a customer of the Group in the year ended 31 May 2011. At 31 May 2011, the amount outstanding was £Nil(2010: £Nil). During the year, the highest amount outstanding totalled £5,743 (2010: £3,327).
29. Commitments for capital expenditure 2011 2010
£m £m
Authorised, contracted but not provided for 1.7 2.1
30. Contingent liabilities
The Group’s bank facilities are provided under an arrangement with The Royal Bank of Scotland Group. The Group has pledged
security in favour of the bank over certain freehold land and buildings with a carrying amount of £25.0 million (2010: £25.3 million).Unscheduled mortgage debentures have also been provided by the Company and certain subsidiaries to the bank which incorporatea xed charge over trade receivables and oating charges over all other assets.
The Group has an arrangement with the bank under which cash balances are offset against borrowings. The Company has given aguarantee in respect of the net bank borrowings within the Group under this arrangement amounting to £9.1 million at 31 May 2011(2010: £10.6 million).
The Group has a bank guarantee agreement with The Royal Bank of Scotland Group, under which the bank provides a facility whichallows the Group to request that the bank issue guarantees to third party suppliers for general business purposes. The maximum totalfacility value is £4.0 million. Commission is charged on the maximum total facility value of £4.0 million at 2.0-2.5% per annum.
At 31 May 2011, upon the request of the Group, the bank has issued a guarantee with a value of £4.0 million to a third party supplierof a subsidiary company.
The Company and certain subsidiaries have granted a xed and oating charge in favour of the trustees of a dened benet pension
scheme (the NWF Group Benets Scheme). This security, which is subordinated to the bank, creates a xed charge over certainfreehold land and buildings, subject to a maximum value of £5.0 million, and a oating charge over all other assets.
The Company has also given certain guarantees to third parties in respect of operating lease commitments for property and motorvehicles due from various subsidiary companies.
7/29/2019 NWF Group Plc Annual Report and Accounts 2011
http://slidepdf.com/reader/full/nwf-group-plc-annual-report-and-accounts-2011 58/72
56 | NWF Group plc Annual Report and Accounts 2011
Independent auditors’ report
to the members of NWF Group plc
We have audited the Parent Company nancial statements of NWF Group plc for the year ended 31 May 2011 which comprise theParent Company Balance Sheet and the related notes. The nancial reporting framework that has been applied in their preparation
is applicable law and United Kingdom Accounting Standards (United Kingdom Generally Accepted Accounting Practice).
Respective responsibilities of directors and auditors
As explained more fully in the Statement of Directors’ Responsibilities on page 24, the Directors are responsible for the preparation ofthe nancial statements and for being satised that they give a true and fair view. Our responsibility is to audit and express an opinionon the nancial statements in accordance with applicable law and International Standards on Auditing (UK and Ireland). Thosestandards require us to comply with the Auditing Practices Board’s Ethical Standards for Auditors.
This report, including the opinion, has been prepared for and only for the Company’s members as a body in accordance withChapter 3 of Part 16 of the Companies Act 2006 and for no other purpose. We do not, in giving these opinions, accept or assumeresponsibility for any other purpose or to any other person to whom this report is shown or into whose hands it may come save whereexpressly agreed by our prior consent in writing.
Scope of the audit of the nancial statements
An audit involves obtaining evidence about the amounts and disclosures in the nancial statements sufcient to give reasonableassurance that the nancial statements are free from material misstatement, whether caused by fraud or error. This includes anassessment of: whether the accounting policies are appropriate to the Parent Company’s circumstances and have been consistentlyapplied and adequately disclosed; the reasonableness of signicant accounting estimates made by the Directors; and the overallpresentation of the nancial statements.
Opinion on nancial statements
In our opinion the Parent Company nancial statements:
b give a true and fair view of the state of the Company’s affairs as at 31 May 2011;
b have been properly prepared in accordance with United Kingdom Generally Accepted Accounting Practice; and
b have been prepared in accordance with the requirements of the Companies Act 2006.
Opinion on other matter prescribed by the Companies Act 2006In our opinion the information given in the Directors’ Report for the nancial year for which the Parent Company nancial statementsare prepared is consistent with the Parent Company nancial statements.
Matters on which we are required to report by exception
We have nothing to report in respect of the following matters where the Companies Act 2006 requires us to report to you if, in our opinion:
b adequate accounting records have not been kept by the Parent Company, or returns adequate for our audit have not beenreceived from branches not visited by us; or
b the Parent Company nancial statements are not in agreement with the accounting records and returns; or
b certain disclosures of Directors’ remuneration specied by law are not made; or
b we have not received all the information and explanations we require for our audit.
Other matter
We have reported separately on the Group nancial statements of NWF Group plc for the year ended 31 May 2011.
Martin Heath (Senior Statutory Auditor)
for and on behalf of PricewaterhouseCoopers LLP
Chartered Accountants and Statutory AuditorsManchester 9 August 2011
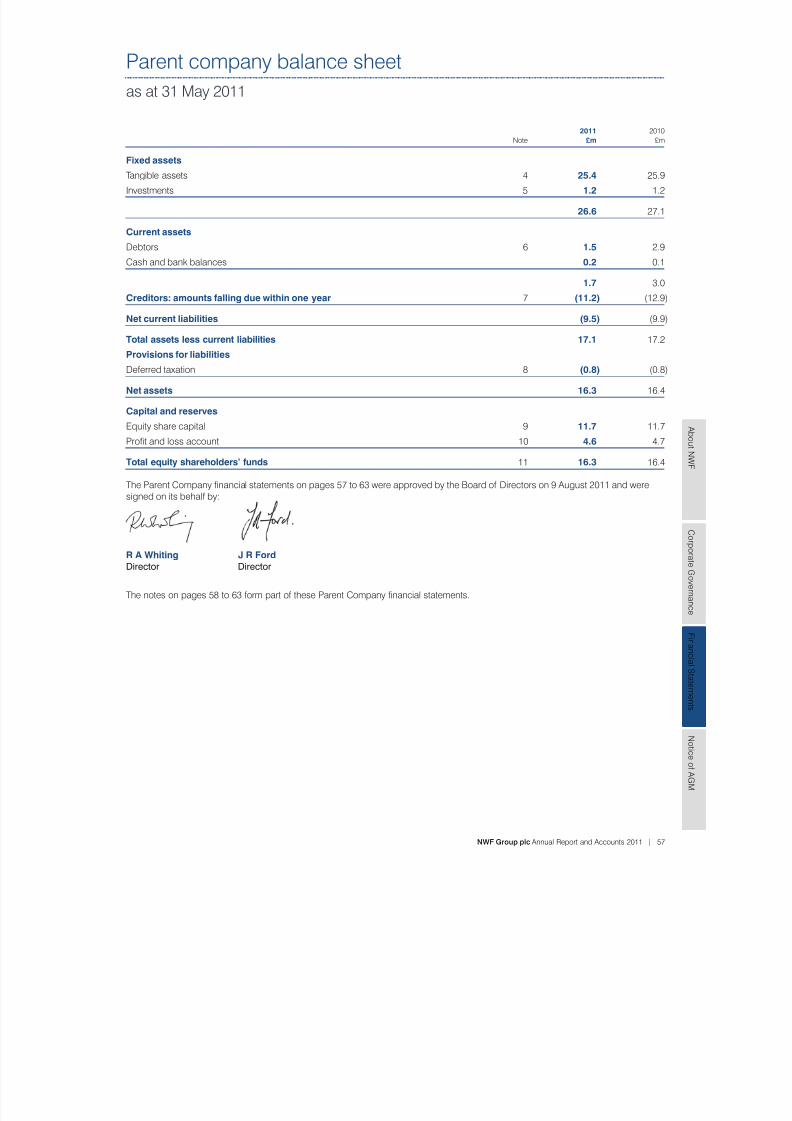
7/29/2019 NWF Group Plc Annual Report and Accounts 2011
http://slidepdf.com/reader/full/nwf-group-plc-annual-report-and-accounts-2011 59/72
NWF Group plc Annual Report and Accounts 2011 | 57
A b o u t N
WF
C or p or a t e G ov er n an c
e
F i n an c i al S t a t em en t s
N o t i c e o
f A GM
Parent company balance sheet
as at 31 May 2011
2011 2010
Note £m £m
Fixed assets
Tangible assets 4 25.4 25.9
Investments 5 1.2 1.2
26.6 27.1
Current assets
Debtors 6 1.5 2.9
Cash and bank balances 0.2 0.1
1.7 3.0
Creditors: amounts falling due within one year 7 (11.2) (12.9)
Net current liabilities (9.5) (9.9)
Total assets less current liabilities 17.1 17.2
Provisions for liabilities
Deferred taxation 8 (0.8) (0.8)
Net assets 16.3 16.4
Capital and reserves
Equity share capital 9 11.7 11.7
Prot and loss account 10 4.6 4.7
Total equity shareholders’ funds 11 16.3 16.4
The Parent Company nancial statements on pages 57 to 63 were approved by the Board of Directors on 9 August 2011 and weresigned on its behalf by:
R A Whiting J R Ford
Director Director
The notes on pages 58 to 63 form part of these Parent Company nancial statements.
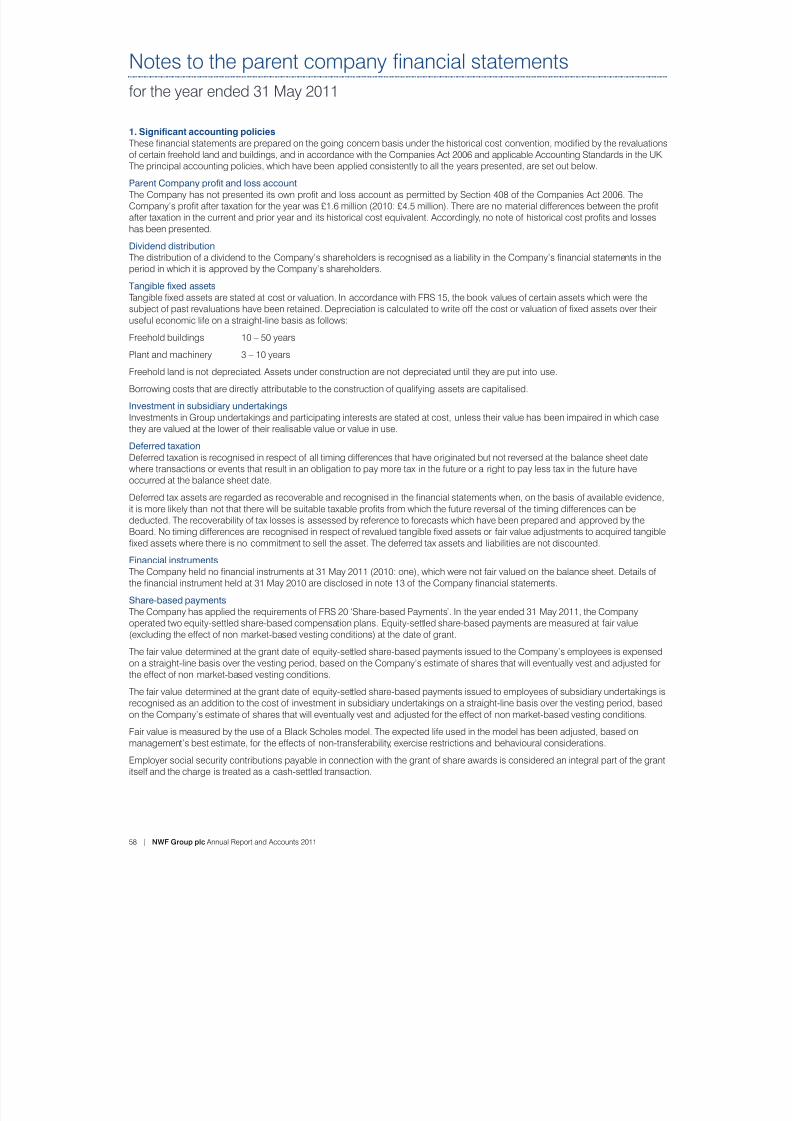
7/29/2019 NWF Group Plc Annual Report and Accounts 2011
http://slidepdf.com/reader/full/nwf-group-plc-annual-report-and-accounts-2011 60/72
58 | NWF Group plc Annual Report and Accounts 2011
Notes to the parent company nancial statements
for the year ended 31 May 2011
1. Signicant accounting policies
These nancial statements are prepared on the going concern basis under the historical cost convention, modied by the revaluations
of certain freehold land and buildings, and in accordance with the Companies Act 2006 and applicable Accounting Standards in the UK.The principal accounting policies, which have been applied consistently to all the years presented, are set out below.
Parent Company prot and loss account
The Company has not presented its own prot and loss account as permitted by Section 408 of the Companies Act 2006. TheCompany’s prot after taxation for the year was £1.6 million (2010: £4.5 million). There are no material differences between the protafter taxation in the current and prior year and its historical cost equivalent. Accordingly, no note of historical cost prots and losseshas been presented.
Dividend distribution
The distribution of a dividend to the Company’s shareholders is recognised as a liability in the Company’s nancial statements in theperiod in which it is approved by the Company’s shareholders.
Tangible xed assets
Tangible xed assets are stated at cost or valuation. In accordance with FRS 15, the book values of certain assets which were the
subject of past revaluations have been retained. Depreciation is calculated to write off the cost or valuation of xed assets over theiruseful economic life on a straight-line basis as follows:
Freehold buildings 10 – 50 years
Plant and machinery 3 – 10 years
Freehold land is not depreciated. Assets under construction are not depreciated until they are put into use.
Borrowing costs that are directly attributable to the construction of qualifying assets are capitalised.
Investment in subsidiary undertakings
Investments in Group undertakings and participating interests are stated at cost, unless their value has been impaired in which casethey are valued at the lower of their realisable value or value in use.
Deferred taxation
Deferred taxation is recognised in respect of all timing differences that have originated but not reversed at the balance sheet datewhere transactions or events that result in an obligation to pay more tax in the future or a right to pay less tax in the future haveoccurred at the balance sheet date.
Deferred tax assets are regarded as recoverable and recognised in the nancial statements when, on the basis of available evidence,it is more likely than not that there will be suitable taxable prots from which the future reversal of the timing differences can bededucted. The recoverability of tax losses is assessed by reference to forecasts which have been prepared and approved by theBoard. No timing differences are recognised in respect of revalued tangible xed assets or fair value adjustments to acquired tangiblexed assets where there is no commitment to sell the asset. The deferred tax assets and liabilities are not discounted.
Financial instruments
The Company held no nancial instruments at 31 May 2011 (2010: one), which were not fair valued on the balance sheet. Details ofthe nancial instrument held at 31 May 2010 are disclosed in note 13 of the Company nancial statements.
Share-based payments
The Company has applied the requirements of FRS 20 ‘Share-based Payments’. In the year ended 31 May 2011, the Companyoperated two equity-settled share-based compensation plans. Equity-settled share-based payments are measured at fair value(excluding the effect of non market-based vesting conditions) at the date of grant.
The fair value determined at the grant date of equity-settled share-based payments issued to the Company’s employees is expensedon a straight-line basis over the vesting period, based on the Company’s estimate of shares that will eventually vest and adjusted forthe effect of non market-based vesting conditions.
The fair value determined at the grant date of equity-settled share-based payments issued to employees of subsidiary undertakings isrecognised as an addition to the cost of investment in subsidiary undertakings on a straight-line basis over the vesting period, basedon the Company’s estimate of shares that will eventually vest and adjusted for the effect of non market-based vesting conditions.
Fair value is measured by the use of a Black Scholes model. The expected life used in the model has been adjusted, based onmanagement’s best estimate, for the effects of non-transferability, exercise restrictions and behavioural considerations.
Employer social security contributions payable in connection with the grant of share awards is considered an integral part of the grant
itself and the charge is treated as a cash-settled transaction.
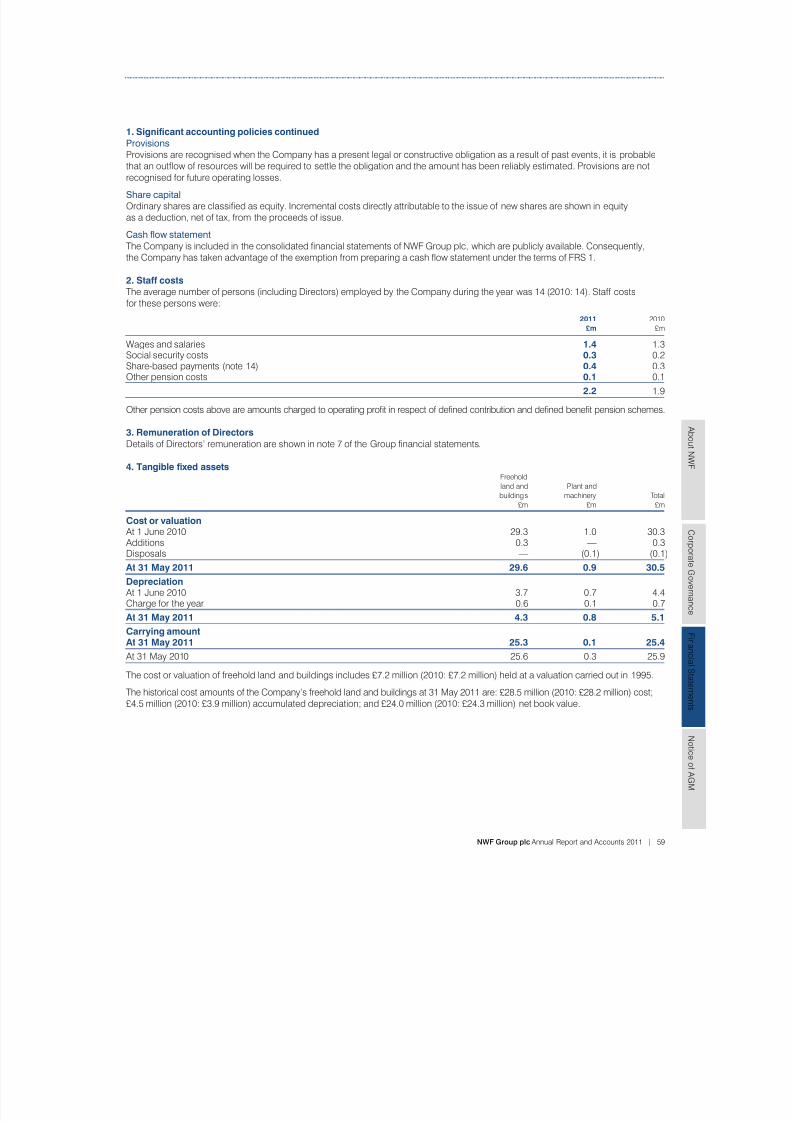
7/29/2019 NWF Group Plc Annual Report and Accounts 2011
http://slidepdf.com/reader/full/nwf-group-plc-annual-report-and-accounts-2011 61/72
NWF Group plc Annual Report and Accounts 2011 | 59
A b o u t N
WF
C or p or a t e G ov er n an c
e
F i n an c i al S t a t em en t s
N o t i c e o
f A GM
1. Signicant accounting policies continued
Provisions
Provisions are recognised when the Company has a present legal or constructive obligation as a result of past events, it is probablethat an outow of resources will be required to settle the obligation and the amount has been reliably estimated. Provisions are notrecognised for future operating losses.
Share capital
Ordinary shares are classied as equity. Incremental costs directly attributable to the issue of new shares are shown in equityas a deduction, net of tax, from the proceeds of issue.
Cash ow statement
The Company is included in the consolidated nancial statements of NWF Group plc, which are publicly available. Consequently,the Company has taken advantage of the exemption from preparing a cash ow statement under the terms of FRS 1.
2. Staff costs
The average number of persons (including Directors) employed by the Company during the year was 14 (2010: 14). Staff costs
for these persons were: 2011 2010
£m £m
Wages and salaries 1.4 1.3Social security costs 0.3 0.2Share-based payments (note 14) 0.4 0.3Other pension costs 0.1 0.1
2.2 1.9
Other pension costs above are amounts charged to operating prot in respect of dened contribution and dened benet pension schemes.
3. Remuneration of Directors
Details of Directors’ remuneration are shown in note 7 of the Group nancial statements.
4. Tangible xed assetsFreehold
land and Plant and
buildings machinery Total
£m £m £m
Cost or valuation At 1 June 2010 29.3 1.0 30.3 Additions 0.3 — 0.3Disposals — (0.1) (0.1)
At 31 May 2011 29.6 0.9 30.5
Depreciation At 1 June 2010 3.7 0.7 4.4Charge for the year 0.6 0.1 0.7
At 31 May 2011 4.3 0.8 5.1Carrying amountAt 31 May 2011 25.3 0.1 25.4
At 31 May 2010 25.6 0.3 25.9
The cost or valuation of freehold land and buildings includes £7.2 million (2010: £7.2 million) held at a valuation carried out in 1995.
The historical cost amounts of the Company’s freehold land and buildings at 31 May 2011 are: £28.5 million (2010: £28.2 million) cost;£4.5 million (2010: £3.9 million) accumulated depreciation; and £24.0 million (2010: £24.3 million) net book value.
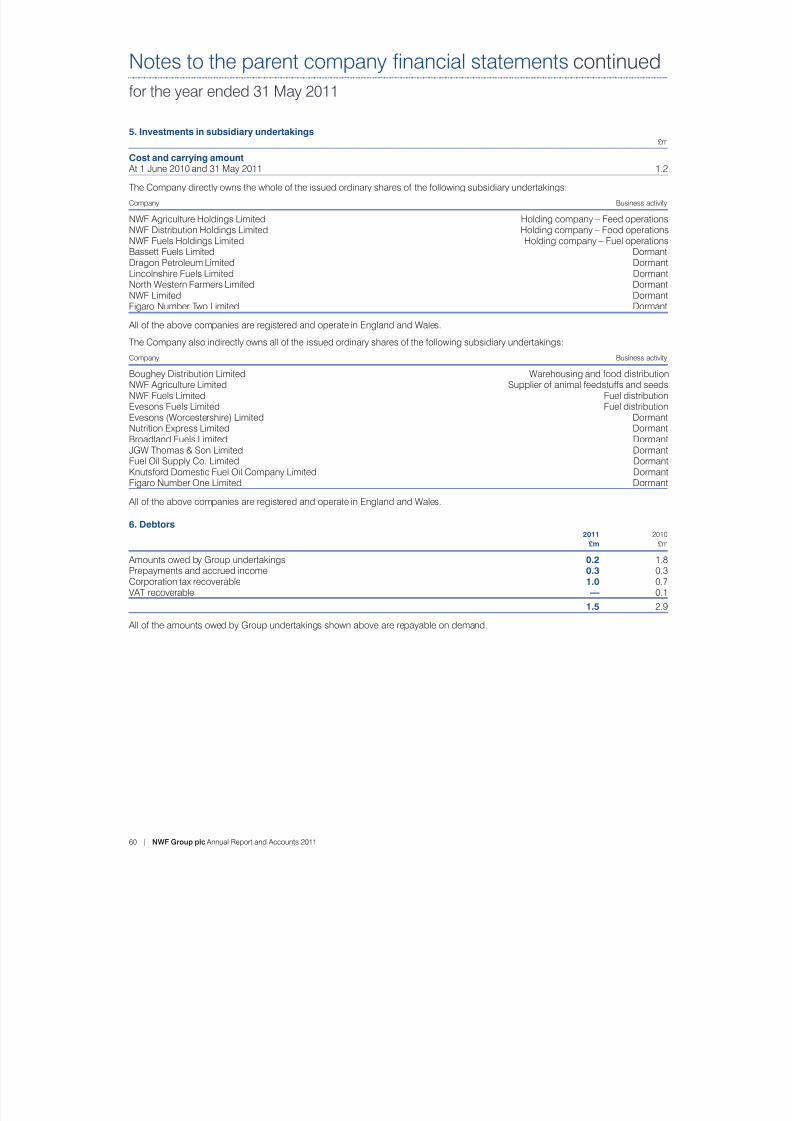
7/29/2019 NWF Group Plc Annual Report and Accounts 2011
http://slidepdf.com/reader/full/nwf-group-plc-annual-report-and-accounts-2011 62/72
60 | NWF Group plc Annual Report and Accounts 2011
Notes to the parent company nancial statements continued
for the year ended 31 May 2011
5. Investments in subsidiary undertakings£m
Cost and carrying amount At 1 June 2010 and 31 May 2011 1.2
The Company directly owns the whole of the issued ordinary shares of the following subsidiary undertakings:
Company Business activity
NWF Agriculture Holdings Limited Holding company – Feed operationsNWF Distribution Holdings Limited Holding company – Food operationsNWF Fuels Holdings Limited Holding company – Fuel operationsBassett Fuels Limited DormantDragon Petroleum Limited DormantLincolnshire Fuels Limited DormantNorth Western Farmers Limited DormantNWF Limited Dormant
Figaro Number Two Limited Dormant
All of the above companies are registered and operate in England and Wales.
The Company also indirectly owns all of the issued ordinary shares of the following subsidiary undertakings:
Company Business activity
Boughey Distribution Limited Warehousing and food distributionNWF Agriculture Limited Supplier of animal feedstuffs and seedsNWF Fuels Limited Fuel distributionEvesons Fuels Limited Fuel distributionEvesons (Worcestershire) Limited DormantNutrition Express Limited DormantBroadland Fuels Limited DormantJGW Thomas & Son Limited Dormant
Fuel Oil Supply Co. Limited DormantKnutsford Domestic Fuel Oil Company Limited DormantFigaro Number One Limited Dormant
All of the above companies are registered and operate in England and Wales.
6. Debtors 2011 2010
£m £m
Amounts owed by Group undertakings 0.2 1.8Prepayments and accrued income 0.3 0.3Corporation tax recoverable 1.0 0.7VAT recoverable — 0.1
1.5 2.9
All of the amounts owed by Group undertakings shown above are repayable on demand.
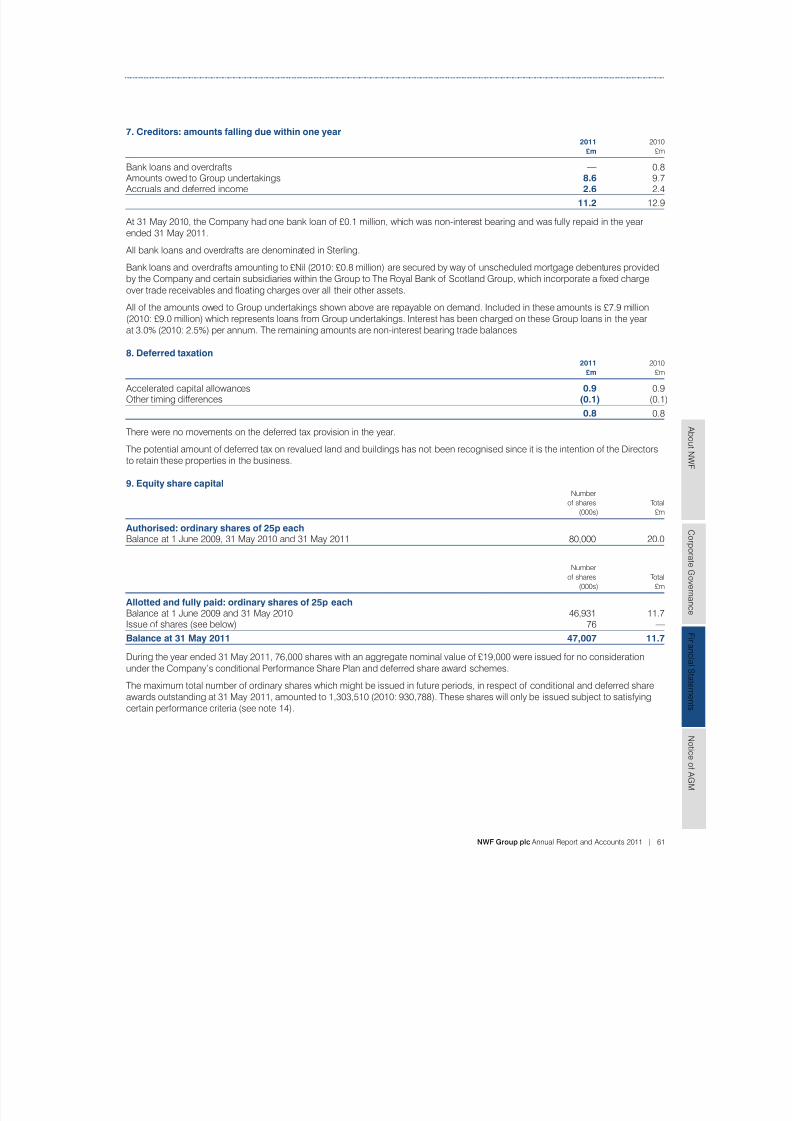
7/29/2019 NWF Group Plc Annual Report and Accounts 2011
http://slidepdf.com/reader/full/nwf-group-plc-annual-report-and-accounts-2011 63/72
NWF Group plc Annual Report and Accounts 2011 | 61
A b o u t N
WF
C or p or a t e G ov er n an c
e
F i n an c i al S t a t em en t s
N o t i c e o
f A GM
7. Creditors: amounts falling due within one year 2011 2010
£m £m
Bank loans and overdrafts — 0.8 Amounts owed to Group undertakings 8.6 9.7 Accruals and deferred income 2.6 2.4
11.2 12.9
At 31 May 2010, the Company had one bank loan of £0.1 million, which was non-interest bearing and was fully repaid in the yearended 31 May 2011.
All bank loans and overdrafts are denominated in Sterling.
Bank loans and overdrafts amounting to £Nil (2010: £0.8 million) are secured by way of unscheduled mortgage debentures providedby the Company and certain subsidiaries within the Group to The Royal Bank of Scotland Group, which incorporate a xed chargeover trade receivables and oating charges over all their other assets.
All of the amounts owed to Group undertakings shown above are repayable on demand. Included in these amounts is £7.9 million(2010: £9.0 million) which represents loans from Group undertakings. Interest has been charged on these Group loans in the yearat 3.0% (2010: 2.5%) per annum. The remaining amounts are non-interest bearing trade balances.
8. Deferred taxation2011 2010
£m £m
Accelerated capital allowances 0.9 0.9Other timing differences (0.1) (0.1)
0.8 0.8
There were no movements on the deferred tax provision in the year.
The potential amount of deferred tax on revalued land and buildings has not been recognised since it is the intention of the Directors
to retain these properties in the business.
9. Equity share capitalNumber
of shares Total
(000s) £m
Authorised: ordinary shares of 25p eachBalance at 1 June 2009, 31 May 2010 and 31 May 2011 80,000 20.0
Number
of shares Total
(000s) £m
Allotted and fully paid: ordinary shares of 25p each
Balance at 1 June 2009 and 31 May 2010 46,931 11.7Issue of shares (see below) 76 —
Balance at 31 May 2011 47,007 11.7
During the year ended 31 May 2011, 76,000 shares with an aggregate nominal value of £19,000 were issued for no considerationunder the Company’s conditional Performance Share Plan and deferred share award schemes.
The maximum total number of ordinary shares which might be issued in future periods, in respect of conditional and deferred shareawards outstanding at 31 May 2011, amounted to 1,303,510 (2010: 930,788). These shares will only be issued subject to satisfyingcertain performance criteria (see note 14).
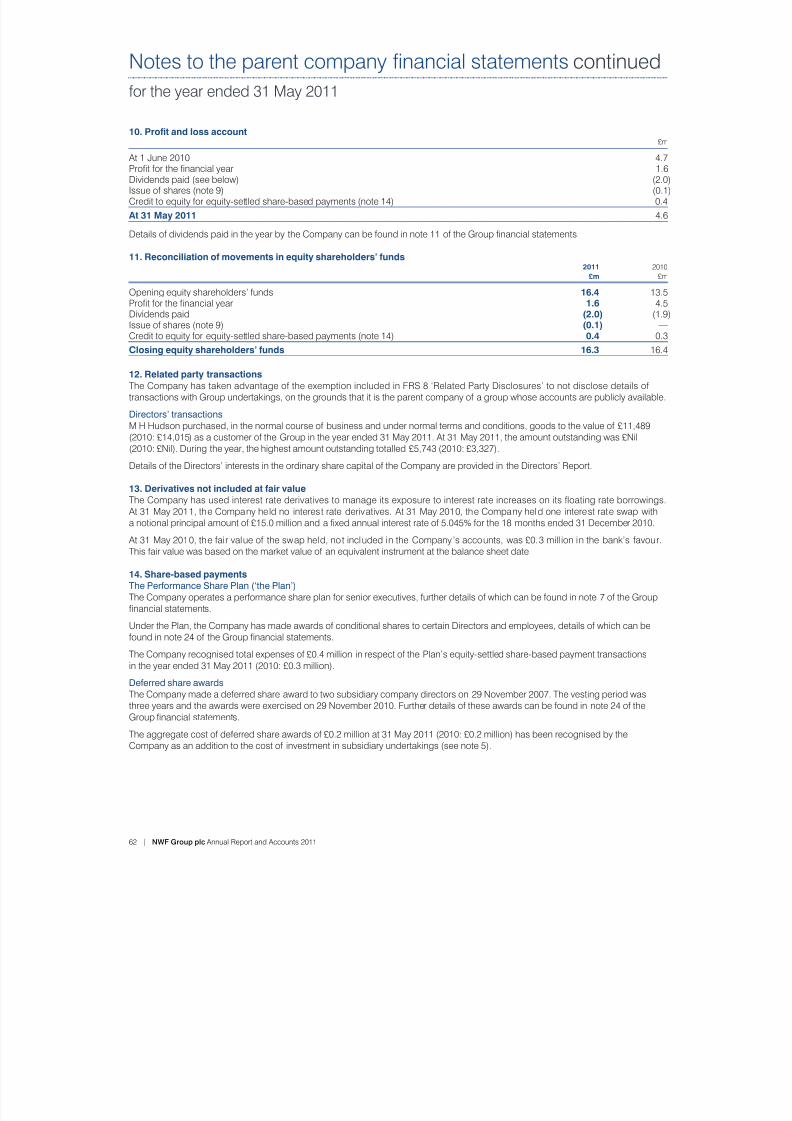
7/29/2019 NWF Group Plc Annual Report and Accounts 2011
http://slidepdf.com/reader/full/nwf-group-plc-annual-report-and-accounts-2011 64/72
62 | NWF Group plc Annual Report and Accounts 2011
Notes to the parent company nancial statements continued
for the year ended 31 May 2011
10. Prot and loss account£m
At 1 June 2010 4.7Prot for the nancial year 1.6Dividends paid (see below) (2.0)Issue of shares (note 9) (0.1)Credit to equity for equity-settled share-based payments (note 14) 0.4
At 31 May 2011 4.6
Details of dividends paid in the year by the Company can be found in note 11 of the Group nancial statements.
11. Reconciliation of movements in equity shareholders’ funds 2011 2010
£m £m
Opening equity shareholders’ funds 16.4 13.5
Prot for the nancial year1.6
4.5Dividends paid (2.0) (1.9)Issue of shares (note 9) (0.1) —Credit to equity for equity-settled share-based payments (note 14) 0.4 0.3
Closing equity shareholders’ funds 16.3 16.4
12. Related party transactions
The Company has taken advantage of the exemption included in FRS 8 ‘Related Party Disclosures’ to not disclose details oftransactions with Group undertakings, on the grounds that it is the parent company of a group whose accounts are publicly available.
Directors’ transactions
M H Hudson purchased, in the normal course of business and under normal terms and conditions, goods to the value of £11,489(2010: £14,015) as a customer of the Group in the year ended 31 May 2011. At 31 May 2011, the amount outstanding was £Nil(2010: £Nil). During the year, the highest amount outstanding totalled £5,743 (2010: £3,327).
Details of the Directors’ interests in the ordinary share capital of the Company are provided in the Directors’ Report.
13. Derivatives not included at fair value
The Company has used interest rate derivatives to manage its exposure to interest rate increases on its oating rate borrowings. At 31 May 2011, the Company held no interest rate derivatives. At 31 May 2010, the Company held one interest rate swap witha notional principal amount of £15.0 million and a xed annual interest rate of 5.045% for the 18 months ended 31 December 2010.
At 31 May 2010, the fair value of the swap held, not included in the Company’s accounts, was £0.3 mill ion in the bank’s favour.This fair value was based on the market value of an equivalent instrument at the balance sheet date.
14. Share-based payments
The Performance Share Plan (‘the Plan’)
The Company operates a performance share plan for senior executives, further details of which can be found in note 7 of the Groupnancial statements.
Under the Plan, the Company has made awards of conditional shares to certain Directors and employees, details of which can befound in note 24 of the Group nancial statements.
The Company recognised total expenses of £0.4 million in respect of the Plan’s equity-settled share-based payment transactionsin the year ended 31 May 2011 (2010: £0.3 million).
Deferred share awards
The Company made a deferred share award to two subsidiary company directors on 29 November 2007. The vesting period wasthree years and the awards were exercised on 29 November 2010. Further details of these awards can be found in note 24 of theGroup nancial statements.
The aggregate cost of deferred share awards of £0.2 million at 31 May 2011 (2010: £0.2 million) has been recognised by theCompany as an addition to the cost of investment in subsidiary undertakings (see note 5).
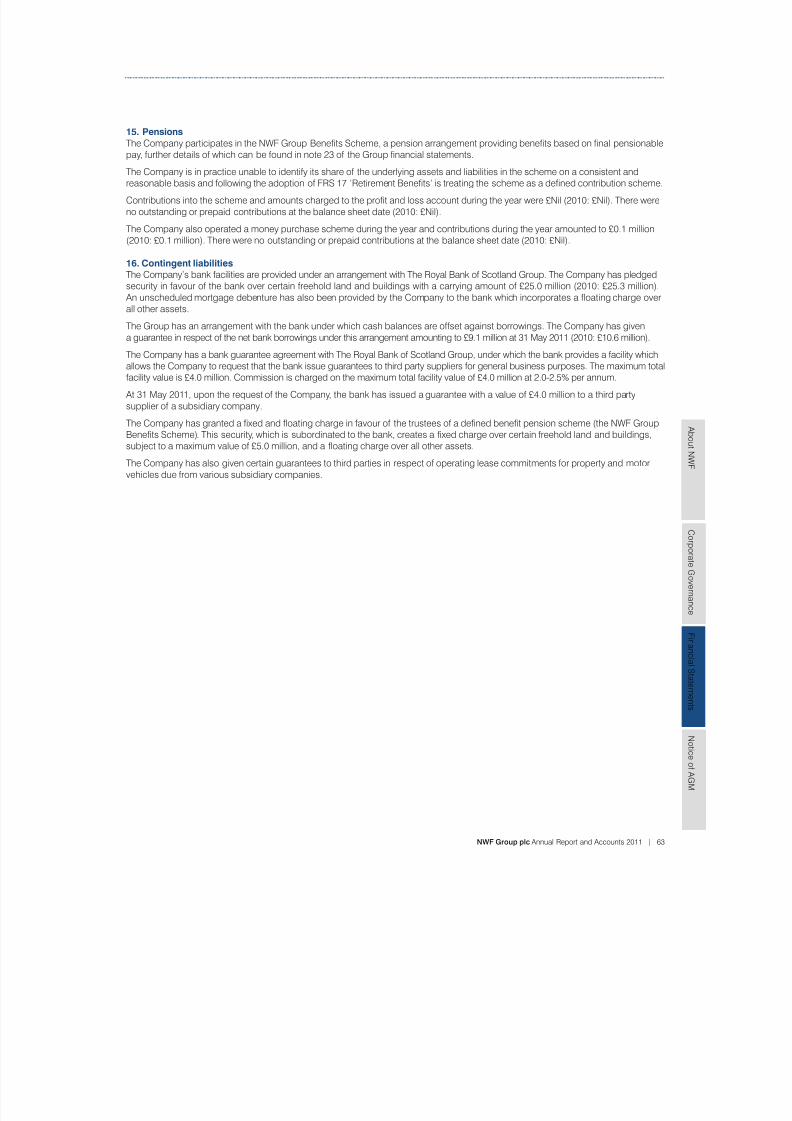
7/29/2019 NWF Group Plc Annual Report and Accounts 2011
http://slidepdf.com/reader/full/nwf-group-plc-annual-report-and-accounts-2011 65/72
NWF Group plc Annual Report and Accounts 2011 | 63
A b o u t N
WF
C or p or a t e G ov er n an c
e
F i n an c i al S t a t em en t s
N o t i c e o
f A GM
15. Pensions
The Company participates in the NWF Group Benets Scheme, a pension arrangement providing benets based on nal pensionable
pay, further details of which can be found in note 23 of the Group nancial statements.
The Company is in practice unable to identify its share of the underlying assets and liabilities in the scheme on a consistent andreasonable basis and following the adoption of FRS 17 ‘Retirement Benets’ is treating the scheme as a dened contribution scheme.
Contributions into the scheme and amounts charged to the prot and loss account during the year were £Nil (2010: £Nil). There wereno outstanding or prepaid contributions at the balance sheet date (2010: £Nil).
The Company also operated a money purchase scheme during the year and contributions during the year amounted to £0.1 million(2010: £0.1 million). There were no outstanding or prepaid contributions at the balance sheet date (2010: £Nil).
16. Contingent liabilities
The Company’s bank facilities are provided under an arrangement with The Royal Bank of Scotland Group. The Company has pledgedsecurity in favour of the bank over certain freehold land and buildings with a carrying amount of £25.0 million (2010: £25.3 million). An unscheduled mortgage debenture has also been provided by the Company to the bank which incorporates a oating charge over
all other assets.
The Group has an arrangement with the bank under which cash balances are offset against borrowings. The Company has givena guarantee in respect of the net bank borrowings under this arrangement amounting to £9.1 million at 31 May 2011 (2010: £10.6 million).
The Company has a bank guarantee agreement with The Royal Bank of Scotland Group, under which the bank provides a facility whichallows the Company to request that the bank issue guarantees to third party suppliers for general business purposes. The maximum totalfacility value is £4.0 million. Commission is charged on the maximum total facility value of £4.0 million at 2.0-2.5% per annum.
At 31 May 2011, upon the request of the Company, the bank has issued a guarantee with a value of £4.0 million to a third partysupplier of a subsidiary company.
The Company has granted a xed and oating charge in favour of the trustees of a dened benet pension scheme (the NWF GroupBenets Scheme). This security, which is subordinated to the bank, creates a xed charge over certain freehold land and buildings,subject to a maximum value of £5.0 million, and a oating charge over all other assets.
The Company has also given certain guarantees to third parties in respect of operating lease commitments for property and motorvehicles due from various subsidiary companies.
7/29/2019 NWF Group Plc Annual Report and Accounts 2011
http://slidepdf.com/reader/full/nwf-group-plc-annual-report-and-accounts-2011 66/72
64 | NWF Group plc Annual Report and Accounts 2011
Notice of annual general meeting
Notice is hereby given that the Annual General Meeting (‘the Meeting’) of NWF Group plc (‘the Company’) will be held at The Wardle Suite,Rookery Hall Hotel, Worleston, Cheshire CW5 6DQ on Thursday 22 September 2011 at 10.30 a.m. to transact the following business:
Ordinary business
1. To receive, adopt and approve the Company’s annual accounts for the nancial year ended 31 May 2011 together with theDirectors’ Report and Auditors’ Report on those accounts.
2. To declare a nal dividend of 3.5p per share for the year ended 31 May 2011.
3. To re-elect M H Hudson as a Director of the Company, who retires by rotation in accordance with the Articles of Associationof the Company.
4. To re-elect D R Southworth as a Director of the Company, who retires by rotation in accordance with the Articles of Associationof the Company.
5. To reappoint PricewaterhouseCoopers LLP as auditors to hold ofce from the conclusion of the Meeting to the conclusionof the next meeting at which accounts are laid before the Company at a remuneration to be determined by the Directors.
Special business
To consider and, if thought t, pass the following resolutions, which will be proposed as to Resolution 6 as an Ordinary Resolutionand as to Resolutions 7 and 8 as Special Resolutions:
6. That the Board of Directors of the Company (‘the Board’) be generally and unconditionally authorised to allot Relevant Securities(as hereinafter dened):
6.1 up to an aggregate nominal amount of £3,925,774 (the equivalent of 15,703,097 ordinary shares); and
6.2 comprising equity securities (as dened by Section 560 of the Companies Act 2006 (‘the Act’)) up to an aggregate nominalamount of £7,851,548 (the equivalent of 31,406,194 ordinary shares) (such amount to be reduced by the nominal amountof any Relevant Securities allotted under paragraph 6.1 above) in connection with an offer by way of a rights issue:
(a) to holders of ordinary shares in proportion (as nearly as may be practicable) to their respective holdings; and
(b) to holders of other equity securities as required by the rights of those securities or as the Board otherwise considersnecessary, but subject to such exclusions or other arrangements as the Board may deem necessary or expedient inrelation to treasury shares, fractional entitlements, record dates, legal or practical problems in or under the laws of anyterritory or the requirements of any regulatory body or stock exchange,
provided that this authority shall, unless renewed, varied or revoked by the Company, expire on the date which is 15 monthsafter the date of this Annual General Meeting or, if earlier, the date of the next Annual General Meeting of the Company save that theCompany may, before such expiry, make offers or agreements which would or might require Relevant Securities to be allotted andthe Board may allot Relevant Securities in pursuance of such offer or agreement notwithstanding that the authority conferred bythis resolution has expired.
This Resolution 6 revokes and replaces all unexercised authorities previously granted to the Board to allot Relevant Securitiesbut without prejudice to any allotment of shares or grant of rights already made, offered or agreed to be made pursuant tosuch authorities.
For the purposes of this Resolution 6, ‘Relevant Securities’ means:
b shares in the Company other than shares allotted pursuant to:
b an employee share scheme (as dened by Section 1166 of the Act);
b a right to subscribe for shares in the Company where the grant of the right itself constituted a Relevant Security; or
b a right to convert securities into shares in the Company where the grant of the right itself constituted a Relevant Security; or
b any right to subscribe for or to convert any security into shares in the Company other than rights to subscribe for or convert anysecurity into shares allotted pursuant to an employee share scheme (as dened by Section 1166 of the Act). References to theallotment of Relevant Securities in this Resolution 6 include the grant of such rights.
7/29/2019 NWF Group Plc Annual Report and Accounts 2011
http://slidepdf.com/reader/full/nwf-group-plc-annual-report-and-accounts-2011 67/72
NWF Group plc Annual Report and Accounts 2011 | 65
A b o u t N
WF
C or p or a t e G ov er n an c
e
F i n an c i al S t a t em en t s
N o t i c e o
f A GM
7. That, subject to the passing of Resolution 6 on page 64, the Board be and it is hereby empowered, pursuant to Section 570 of the Act, to allot equity securities (as dened in Section 560 of the Act) for cash pursuant to the authority conferred by Resolution 6 above
or by way of a sale of treasury shares as if Section 561 of the Act did not apply to any such allotment, provided that this power shallbe limited to:
7.1 the allotment of equity securities in connection with a rights issue or other pro rata offer in favour of holders of equity securities(but in the case of the authority granted under paragraph 6.2 of Resolution 6 on page 64, by way of a rights issue only) where theequity securities respectively attributable to the interests of all those persons at such record dates as the Board may determine areproportionate (as nearly as may be) to the respective numbers of equity securities held by them subject to such exclusionsor other arrangements as the Board may consider necessary or expedient to deal with treasury shares, fractional entitlements,record dates, practical or legal difculties under the laws of any territory or the requirements of any regulatory body or stockexchange or by virtue of equity securities being represented by depositary receipts or any other matter whatsoever; and
7.2 the allotment (otherwise than pursuant to paragraph 7.1 above) of equity securities up to an aggregate nominal amount of £588,866,
and in each case shall expire upon the expiry of the general authority conferred by Resolution 6 on page 64, except that theCompany may before such expiry make offers or agreements which would or might require equity securities to be allotted and/or
shares held by the Company in treasury to be sold or transferred after such expiry and the Board may allot equity securities and/orsell or transfer shares held by the Company in treasury in pursuance of such offers or agreements as if the power conferred by thisresolution had not expired.
8. That the Company be authorised generally and unconditionally, in accordance with Section 701 of the Act, to make market purchases(within the meaning of Section 693(4) of the Act) of ordinary shares of £0.25 each on such terms and in such manner as the Boardshall determine, provided that:
8.1 the maximum aggregate number of ordinary shares that may be purchased is 4,710,929;
8.2 the minimum price (excluding expenses) which may be paid for each ordinary share is 25p; and
8.3 the maximum price (excluding expenses) which may be paid for each ordinary share is 105% of the average market value ofan ordinary share in the Company for the ve business days immediately preceding the day on which the share is contractedto be purchased,
and such authority conferred by this resolution shall, unless reviewed, varied or revoked by the Company expire at the conclusionof the Company’s next Annual General Meeting save that the Company may, before the expiry of the authority granted by thisresolution, enter into a contract to purchase ordinary shares which will or may be executed wholly or partly after the expiry of suchauthority and may make a purchase of ordinary shares in pursuance of any such contract or contracts as if the power conferredhereby had not expired.
By order of the Board
S R Andrew
Company Secretary NWF Group plcWardleNantwichCheshireCW5 6BPRegistered number: 2264971 19 August 2011
7/29/2019 NWF Group Plc Annual Report and Accounts 2011
http://slidepdf.com/reader/full/nwf-group-plc-annual-report-and-accounts-2011 68/72
66 | NWF Group plc Annual Report and Accounts 2011
Notes to the notice of annual general meeting
These notes are important and require your immediate attention.
1. A shareholder entitled to attend and vote at the Annual General Meeting is entitled to appoint another person of his/her choice as thatshareholder’s proxy to exercise all or any of that shareholder’s rights to attend and to speak and vote at the meeting on his/her behalf. Ashareholder may appoint more than one proxy in relation to the Meeting, provided that each proxy is appointed to exercise the rightsattached to a different share or shares held by that shareholder. A proxy does not need to be a shareholder of the Company.
2. A form of proxy for use in connection with the Meeting is enclosed with the document of which this notice forms part. Completionand return of a form of proxy will not prevent a shareholder from attending and voting in person at the Meeting. Addresses (includingelectronic addresses) in this document are included strictly for the purposes specied and not for any other purpose.
3. To appoint a proxy or proxies, shareholders must complete a form of proxy, sign it and return it, together with the power of attorney orany other authority under which it is signed, or a notarially certied copy of such authority, to the Company’s registrars, Capita Registrars,PXS, The Registry, 34 Beckenham Road, Beckenham, Kent BR3 4TU so that it is received no later than 10.30 a.m. on 20 September 2011.
4. Only those members entered on the register of members of the Company at 6.00 p.m. on 20 September 2011 or, in the eventthat this meeting is adjourned, in the register of members as at 6.00 p.m. on the day two days before the date of any adjournedmeeting, shall be entitled to attend and vote at the meeting in respect of the number of ordinary shares registered in their namesat that time. Changes to the entries on the register of members by the close of business on 20 September 2011 or, in the eventthat this meeting is adjourned, in the register of members before the close of business on the day two days before the date ofthe adjourned meeting shall be disregarded in determining the rights of any person to attend or vote at the meeting.
5. CREST members who wish to appoint a proxy or proxies through the CREST electronic proxy appointment service may do sofor the Annual General Meeting to be held at 10.30 a.m. on 22 September 2011 and any adjournment(s) thereof by using theprocedures described in the CREST Manual. CREST personal members or other CREST sponsored members, and those CRESTmembers who have appointed a voting service provider, should refer to their CREST sponsors or voting service provider(s), whowill be able to take the appropriate action on their behalf.
In order for a proxy appointment or instruction made by means of CREST to be valid, the appropriate CREST message (a ‘CRESTProxy Instruction’) must be properly authenticated in accordance with Euroclear UK & Ireland Limited’s specications and mustcontain the information required for such instructions, as described in the CREST Manual. The message must be transmitted soas to be received by the Company’s agent, Capita Registrars Limited (CREST Participant ID: RA10), no later than 48 hours before
the time appointed for the Meeting. For this purpose, the time of receipt will be taken to be the time (as determined by the timestamp applied to the message by the CREST Application Host) from which the Company’s agent is able to retrieve the messageby enquiry to CREST in the manner prescribed by CREST.
CREST members and, where applicable, their CREST sponsor or voting service provider should note that Euroclear UK & IrelandLimited does not make available special procedures in CREST for any particular messages. Normal system timings and l imitationswill therefore apply in relation to the input of CREST Proxy Instructions. It is the responsibility of the CREST member concernedto take (or, if the CREST member is a CREST personal member or sponsored member or has appointed a voting service provider,to procure that his CREST sponsor or voting service provider takes) such action as shall be necessary to ensure that a messageis transmitted by means of the CREST system by any particular time. In this connection, CREST members and, where applicable,their CREST sponsor or voting service provider are referred in particular to those sections of the CREST Manual concerningpractical limitations of the CREST system and timings.
The Company may treat as invalid a CREST Proxy Instruction in the circumstances set out in Regulation 35(5)(a) of theUncerticated Securities Regulations 2001.
6. You may appoint more than one proxy provided each proxy is appointed to exercise rights attached to different shares. In theevent of a conict between a blank form of proxy and a form of proxy which states the number of shares to which it applies, thespecic form of proxy shall be counted rst, regardless of whether it was sent or received before or after the blank form of proxy,and any remaining shares in respect of which you are the registered holder will be apportioned to the blank form of proxy. You maynot appoint more than one proxy to exercise rights attached to any one share. To appoint more than one proxy, you should contactCapita Registrars, PXS, The Registry, 34 Beckenham Road, Beckenham, Kent BR3 4TU.
7. Any corporation which is a member can appoint one or more corporate representatives who may exercise on its behalf all of itspowers as a member provided that they do not do so in relation to the same shares.
8. Copies of the following documents will be available for inspection at the Company’s registered ofce during normal working hourson any weekday (Saturdays, Sundays and public holidays excepted) from the date of this notice until the date of the Annual GeneralMeeting and at the place of the Annual General Meeting for 15 minutes prior to and during the Meeting:
b copies of all service agreements or letters of appointment under which the Directors of the Company are employed by the Company.
9. Except as provided above, members who have general queries about the Meeting should use the following means of communication(no other methods of communication will be accepted):
b calling Capita Registrars: 0871 664 0300.
7/29/2019 NWF Group Plc Annual Report and Accounts 2011
http://slidepdf.com/reader/full/nwf-group-plc-annual-report-and-accounts-2011 69/72
NWF Group plc Annual Report and Accounts 2011 | 67
A b o u t N
WF
C or p or a t e G ov er n an c
e
F i n an c i al S t a t em en t s
N o t i c e o
f A GM
Ordinary business
Each resolution will be proposed as an Ordinary Resolution. This means that, for each of the resolutions to be passed, more than
half of the votes cast must be in favour of the resolution.
The Ordinary Resolutions are entirely routine and deal with the approval of the Annual Report and Accounts for the nancial yearended 31 May 2011, the declaration of a nal dividend, the reappointment of M H Hudson and D R Southworth as Directors of theCompany and the reappointment of PricewaterhouseCoopers LLP as auditors.
Special business
Resolution 6 will be proposed as an Ordinary Resolution and Resolutions 7 and 8 will be proposed as Special Resolutions. Whereresolutions are passed as Special Resolutions, in order for those Resolutions to be passed, at least three-quarters of the votes castmust be in favour of the resolution.
Resolution 6 – authority to allot shares (Ordinary Resolution)
The authority conferred on the Directors at last year’s Annual General Meeting to allot the authorised but unissued share capital of theCompany expires at the conclusion of the forthcoming Annual General Meeting. The Board recommends that this authority be renewed.
Paragraph 6.1 of Resolution 6 will, if passed, authorise the Directors to allot the Company’s unissued shares up to a maximum nominalamount of £3,925,774 which represents an amount which is equal to one-third of the aggregate nominal value of the issued andunconditionally allotted ordinary share capital of the Company (excluding treasury shares) as at close of business on 17 August 2011. As at close of business on 17 August 2011 the Company did not hold any treasury shares.
Paragraph 6.2 of Resolution 6 will, if passed, authorise the Directors to allot unissued shares in connection with a rights issue in favourof holders of equity securities (which would include ordinary shareholders) as required by the rights of those securities or as the Directorsmay otherwise consider necessary, up to a maximum aggregate nominal amount of £7,851,548, which represents an amount whichis equal to two-thirds of the aggregate nominal value of the issued and unconditionally allotted ordinary share capital of the Companyas at close of business on 17 August 2011 (such amount to be reduced by the nominal amount of any relevant securities issuedunder the authority conferred by paragraph 6.1 of Resolution 6).
The authorities sought in Resolution 6 are in substitution for all existing authorities, granted in the Company’s Articles of Association orotherwise, and without prejudice to previous allotments made under such existing authorities. The authorities will each expire 15 monthsafter the date of the Annual General Meeting or, if earlier, at the conclusion of the next Annual General Meeting of the Company. The
Directors have no present intention of exercising these authorities but believe that it is in the best interests of the Company to have theauthorities available so that the Board has the exibility to take advantage of business opportunities as they arise.
Resolution 7 – disapplication of pre-emption rights (Special Resolution)
Resolution 7, which will be proposed as a Special Resolution, seeks to renew the authority conferred on the Directors at last year’s AGMto issue equity securities of the Company for cash without application of the pre-emption rights provided by Section 561 of the Act.The authority being sought provides for non-pre-emptive allotments of equity securities: (i) to ordinary shareholders in proportion to theirexisting shareholdings; (ii) to holders of other equity securities as required by, or subject to (as the Directors consider necessary), the rightsof those securities, and to deal with treasury shares, fractional entitlements and legal and practical problems in any territory, for exampleon a rights issue or other similar share issue; and (iii) for cash up to an aggregate nominal value of £588,866, which represents 5% of theissued ordinary share capital of the Company as at close of business on 17 August 2011. The authority being sought is in substitution forall existing authorities, granted in the Company’s Articles of Association or otherwise, and without prejudice to previous allotments madeunder such authorities and will expire 15 months after the date of the Annual General Meeting or, if earlier, at the conclusion of the next Annual General Meeting of the Company. The Directors have no present intention of exercising these authorities but believe that it is inthe best interests of the Company to have the authorities available so that the Board has the exibility to take advantage of businessopportunities as they arise.
The authority sought and the limits set by this resolution will also disapply the application of Section 561 of the Act from a sale of treasuryshares to the extent also specied in this resolution.
In accordance with the guidelines issued by the Pre-Emption Group, the Board conrms its intention that no more than 7.5% of theissued share capital will be issued for cash on a non-pre-emptive basis during any rolling three year period.
Resolution 8 – authority to purchase own shares
This resolution seeks authority for the Company to make market purchases of its own ordinary shares and is proposed as a SpecialResolution. If passed, the resolution gives authority for the Company to purchase up to 4,710,929 of its ordinary shares, representing10% of the Company’s issued ordinary share capital (excluding treasury shares) as at 17 August 2011. The Directors believe that it isin the best interests of the Company to have this authority available so that the Board has the exibility to take advantage of businessopportunities as they arise.
The resolution species the minimum and maximum prices which may be paid for any ordinary shares purchased under this authority.The authority will expire at the conclusion of the Company’s next Annual General Meeting. The Directors will only exercise the authority topurchase ordinary shares where they consider that such purchases will be in the best interests of shareholders generally and will resultin an increase in earnings per ordinary share.
The Company may either cancel any shares it purchases under this authority or transfer them into treasury (and subsequently sellor transfer them out of treasury or cancel them).
Explanatory notes to the notice of annual general meeting
7/29/2019 NWF Group Plc Annual Report and Accounts 2011
http://slidepdf.com/reader/full/nwf-group-plc-annual-report-and-accounts-2011 70/72
68 | NWF Group plc Annual Report and Accounts 2011
Annual General Meeting 22 September 2011
Final dividend paid 1 November 2011
Preliminary announcement of half-year results Early February 2012
Publication of Interim Report Early February 2012
Interim dividend paid 1 May 2012
Financial year end 31 May 2012
Preliminary announcement of full-year results Mid August 2012
Publication of Annual Report and Accounts Late August 2012
Food Tel: 01829 260704 www.boughey.co.uk
Feeds Tel: 0800 262397 www.nwfagriculture.co.uk
Fuels Tel: 01829 260900 www.nwffuels.co.uk
Financial calendar
Divisional contacts

7/29/2019 NWF Group Plc Annual Report and Accounts 2011
http://slidepdf.com/reader/full/nwf-group-plc-annual-report-and-accounts-2011 71/72

7/29/2019 NWF Group Plc Annual Report and Accounts 2011
http://slidepdf.com/reader/full/nwf-group-plc-annual-report-and-accounts-2011 72/72