Nutritional Status of Institutionalized Elderly: A ...
13
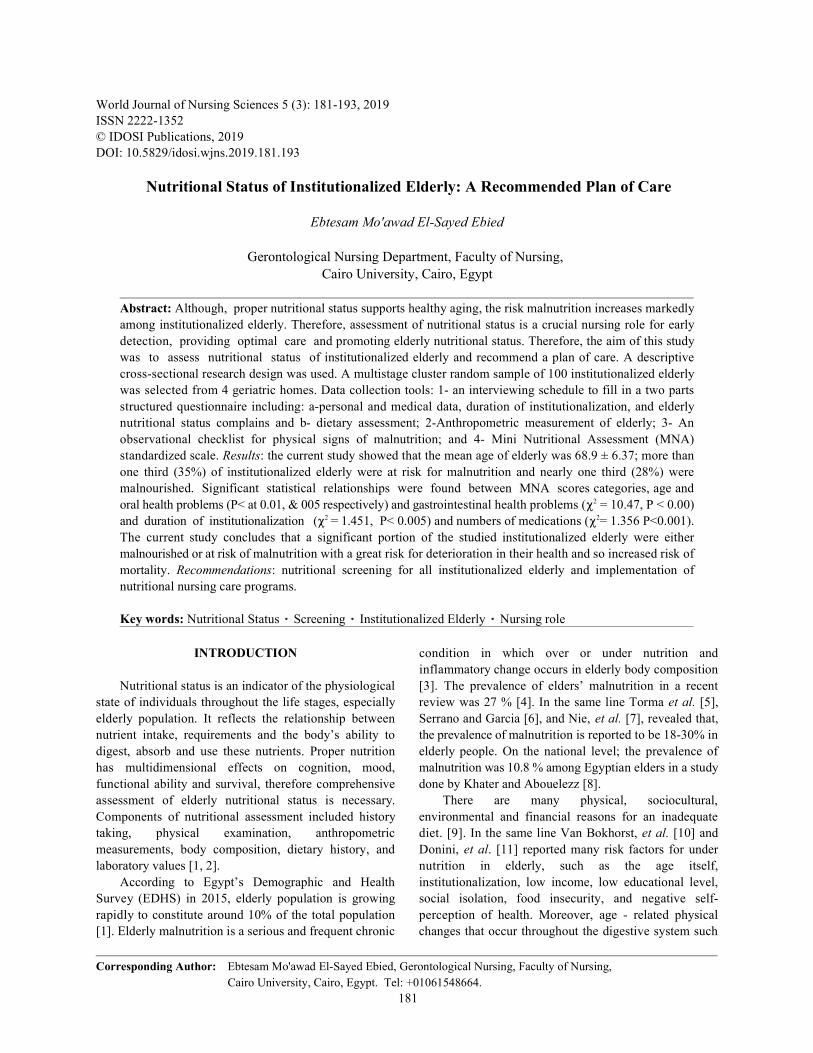
World Journal of Nursing Sciences 5 (3): 181-193, 2019 ISSN 2222-1352 © IDOSI Publications, 2019 DOI: 10.5829/idosi.wjns.2019.181.193 Corresponding Author: Ebtesam Mo'awad El-Sayed Ebied, Gerontological Nursing, Faculty of Nursing, Cairo University, Cairo, Egypt. Tel: +01061548664. 181 Nutritional Status of Institutionalized Elderly: A Recommended Plan of Care Ebtesam Mo'awad El-Sayed Ebied Gerontological Nursing Department, Faculty of Nursing, Cairo University, Cairo, Egypt Abstract: Although, proper nutritional status supports healthy aging, the risk malnutrition increases markedly among institutionalized elderly. Therefore, assessment of nutritional status is a crucial nursing role for early detection, providing optimal care and promoting elderly nutritional status. Therefore, the aim of this study was to assess nutritional status of institutionalized elderly and recommend a plan of care. A descriptive cross-sectional research design was used. A multistage cluster random sample of 100 institutionalized elderly was selected from 4 geriatric homes. Data collection tools: 1- an interviewing schedule to fill in a two parts structured questionnaire including: a-personal and medical data, duration of institutionalization, and elderly nutritional status complains and b- dietary assessment; 2-Anthropometric measurement of elderly; 3- An observational checklist for physical signs of malnutrition; and 4- Mini Nutritional Assessment (MNA) standardized scale. Results: the current study showed that the mean age of elderly was 68.9 ± 6.37; more than one third (35%) of institutionalized elderly were at risk for malnutrition and nearly one third (28%) were malnourished. Significant statistical relationships were found between MNA scores categories, age and oral health problems (P< at 0.01, & 005 respectively) and gastrointestinal health problems ( = 10.47, P < 0.00) 2 and duration of institutionalization ( = 1.451, P< 0.005) and numbers of medications ( = 1.356 P<0.001). 2 2 The current study concludes that a significant portion of the studied institutionalized elderly were either malnourished or at risk of malnutrition with a great risk for deterioration in their health and so increased risk of mortality. Recommendations: nutritional screening for all institutionalized elderly and implementation of nutritional nursing care programs. Key words: Nutritional Status Screening Institutionalized Elderly Nursing role INTRODUCTION condition in which over or under nutrition and Nutritional status is an indicator of the physiological [3]. The prevalence of elders’ malnutrition in a recent state of individuals throughout the life stages, especially review was 27 % [4]. In the same line Torma et al. [5], elderly population. It reflects the relationship between Serrano and Garcia [6], and Nie, et al. [7], revealed that, nutrient intake, requirements and the body’s ability to the prevalence of malnutrition is reported to be 18-30% in digest, absorb and use these nutrients. Proper nutrition elderly people. On the national level; the prevalence of has multidimensional effects on cognition, mood, malnutrition was 10.8 % among Egyptian elders in a study functional ability and survival, therefore comprehensive done by Khater and Abouelezz [8]. assessment of elderly nutritional status is necessary. There are many physical, sociocultural, Components of nutritional assessment included history environmental and financial reasons for an inadequate taking, physical examination, anthropometric diet. [9]. In the same line Van Bokhorst, et al. [10] and measurements, body composition, dietary history, and Donini, et al. [11] reported many risk factors for under laboratory values [1, 2]. nutrition in elderly, such as the age itself, According to Egypt’s Demographic and Health institutionalization, low income, low educational level, Survey (EDHS) in 2015, elderly population is growing social isolation, food insecurity, and negative self- rapidly to constitute around 10% of the total population perception of health. Moreover, age - related physical [1]. Elderly malnutrition is a serious and frequent chronic changes that occur throughout the digestive system such inflammatory change occurs in elderly body composition
Transcript of Nutritional Status of Institutionalized Elderly: A ...
World Journal of Nursing Sciences 5 (3): 181-193, 2019ISSN 2222-1352 © IDOSI Publications, 2019DOI: 10.5829/idosi.wjns.2019.181.193
Corresponding Author: Ebtesam Mo'awad El-Sayed Ebied, Gerontological Nursing, Faculty of Nursing,Cairo University, Cairo, Egypt. Tel: +01061548664.
181
Nutritional Status of Institutionalized Elderly: A Recommended Plan of Care
Ebtesam Mo'awad El-Sayed Ebied
Gerontological Nursing Department, Faculty of Nursing, Cairo University, Cairo, Egypt
Abstract: Although, proper nutritional status supports healthy aging, the risk malnutrition increases markedlyamong institutionalized elderly. Therefore, assessment of nutritional status is a crucial nursing role for earlydetection, providing optimal care and promoting elderly nutritional status. Therefore, the aim of this studywas to assess nutritional status of institutionalized elderly and recommend a plan of care. A descriptivecross-sectional research design was used. A multistage cluster random sample of 100 institutionalized elderlywas selected from 4 geriatric homes. Data collection tools: 1- an interviewing schedule to fill in a two partsstructured questionnaire including: a-personal and medical data, duration of institutionalization, and elderlynutritional status complains and b- dietary assessment; 2-Anthropometric measurement of elderly; 3- Anobservational checklist for physical signs of malnutrition; and 4- Mini Nutritional Assessment (MNA)standardized scale. Results: the current study showed that the mean age of elderly was 68.9 ± 6.37; more thanone third (35%) of institutionalized elderly were at risk for malnutrition and nearly one third (28%) weremalnourished. Significant statistical relationships were found between MNA scores categories, age andoral health problems (P< at 0.01, & 005 respectively) and gastrointestinal health problems ( = 10.47, P < 0.00)2
and duration of institutionalization ( = 1.451, P< 0.005) and numbers of medications ( = 1.356 P<0.001).2 2
The current study concludes that a significant portion of the studied institutionalized elderly were eithermalnourished or at risk of malnutrition with a great risk for deterioration in their health and so increased risk ofmortality. Recommendations: nutritional screening for all institutionalized elderly and implementation ofnutritional nursing care programs.
Key words: Nutritional Status Screening Institutionalized Elderly Nursing role
INTRODUCTION condition in which over or under nutrition and
Nutritional status is an indicator of the physiological [3]. The prevalence of elders’ malnutrition in a recentstate of individuals throughout the life stages, especially review was 27 % [4]. In the same line Torma et al. [5],elderly population. It reflects the relationship between Serrano and Garcia [6], and Nie, et al. [7], revealed that,nutrient intake, requirements and the body’s ability to the prevalence of malnutrition is reported to be 18-30% indigest, absorb and use these nutrients. Proper nutrition elderly people. On the national level; the prevalence ofhas multidimensional effects on cognition, mood, malnutrition was 10.8 % among Egyptian elders in a studyfunctional ability and survival, therefore comprehensive done by Khater and Abouelezz [8].assessment of elderly nutritional status is necessary. There are many physical, sociocultural,Components of nutritional assessment included history environmental and financial reasons for an inadequatetaking, physical examination, anthropometric diet. [9]. In the same line Van Bokhorst, et al. [10] andmeasurements, body composition, dietary history, and Donini, et al. [11] reported many risk factors for underlaboratory values [1, 2]. nutrition in elderly, such as the age itself,
According to Egypt’s Demographic and Health institutionalization, low income, low educational level,Survey (EDHS) in 2015, elderly population is growing social isolation, food insecurity, and negative self-rapidly to constitute around 10% of the total population perception of health. Moreover, age - related physical[1]. Elderly malnutrition is a serious and frequent chronic changes that occur throughout the digestive system such
inflammatory change occurs in elderly body composition
World J. Nursing Sci., 5 (3): 181-193, 2019
182
as a decreased saliva production (xerostomia) and The prevalence of and risk for malnutrition in older adultschanges in dentition which alter the ability to chew and across settings varies considerably to affect up to 30% inmay lead to changes in food choices and increase the risk older adults in the community [4, 18], 56-63% of olderfor malnutrition among elderly. Decreased gastric acid community dwelling adults who receive home care [4, 22],secretion can also limit the absorption of iron and vitamin 48-76% of older adults in hospitals [4, 23, 24] and up toB12. As well, slow gastric emptying with a potential 78% of older adults in nursing homes and institutionaldetrimental effect on appetite; slower peristalsis cause long-term care [4].constipation to be an issue because of decreased fluid Notably, nutritional status is influenced by medical,intake. Appetite and thirst deregulation also occur, physiological, psychological and social variables.leading to early satiety and a blunted thirst mechanism. Given these complex contributing factors, a carefulChanges in appetite (anorexia of ageing) may also occur nutritional assessment is necessary for early detectiondue to chronic diseases such as COPD, parkinsonism, and early treatment of elderly malnutrition. Despite thedementias, hypo or hyper-thyroidism, chewing problems, fact that, several studies were carried out in an attempt touse of medications, decline in skeletal muscle mass and assess nutritional status among elderly in Egypt, there istone (sarcopenia), social isolation, economic constraints, no accurate database for malnutrition amongwhich can all adversely affect nutritional status. institutionalized elderly in geriatric homes in Egypt.
In the same respect, Culross [12], and Lewis, et al. One of these Egyptian studies was carried to assess the[13] identified other risk factors for under nutrition in nutritional status of elderly and reported exposure of thatelderly such as changes associated with anorexia and the vulnerable target group to adverse risk factors forfunctional difficulties that interfere with feeding, such as malnutrition [19]. Thus, comprehensive assessmentdysphasia, decreased mobility, and changes in smell and should include not only the basic nutritional assessmenttaste. Malnutrition may also be secondary to certain but also, the overall physical, mental, and psychosocialconditions (disease-related malnutrition), such as cancer, status of the person. This will lead to a betterdepression, arthritis, diabetes, or emphysema [14, 15]. understanding of how to realistically meet the nutritionalMore specifically, Donini et al. [11] and John et al. [16] needs of the older adults [12].noted that, institutionalization of elderly was associated Despite the high prevalence of malnutritionwith under nutrition risk in many nursing homes due to among elderly, nutritional problems are not yetinadequate intake of calories, proteins, vitamins and acknowledged as a priority by nurses. The need forminerals, thus, nutritional screening is recommended in nutritional assessment and interventions are particularlyorder to identify and monitor elderly patients at risk of crucial in this vulnerable group, where the incidence ofmalnutrition. chronic illness is high and a myriad of factors enhance
Despite the high prevalence and risk of malnutrition likelihood of malnutrition [25]. From the research's clinicalamong institutionalized elderly, Sperotto and Spinelli [17], observation, institutionalized elderly people in geriatricreported that malnutrition among elderly is often homes in Egypt are more vulnerable to malnutrition due tounder-diagnosed. Johansson, et al. [18] and Ahmed and many factors including comorbidities, lack of foodHaboubi [19], also recommended proper nutritional status choices; imbalanced meals; unavailability of qualifiedand diet quality to prevent deleterious complications of caregivers and certified nutritionists. Nurses spend moremalnutrition such as cognitive decline, loss of bone and time with elderly. Observation and assessment of elderlymuscle mass, impaired muscle function, frailty, loss of nutritional status is a fundamental nursing skill. Therefore,functional ability, immune dysfunction, anemia, poor gerontological nurses should have a key active role inwound healing, delayed recovering from surgery, prevention and early detection of nutritional problemsincreased health care costs, increased morbidity and by comprehensive nutritional assessment and bymortality, poor quality of life, and higher hospital educating elderly and their caregivers about completereadmission rates. In the same line, Fávaro and Cristin [20] balanced diet. Carrying out this research will help inalso recommended nutritional screening to prevent identifying prevalence and understanding risk factorsnegative consequences of malnutrition. for malnutrition among elderly in geriatric homes that
Significance of the Study: According to Central Agency health problem among elderly in Egypt. Moreover,for Public Mobilization and Statistics (CAPMS) [21], conducting this research will add to the nursing body ofthe number of elderly people in Egypt is estimated as knowledge and will increase awareness about the6 million elderly and is expected to rise to 12% in 2030., problem.
will definitely spot the light on this significant silent
World J. Nursing Sci., 5 (3): 181-193, 2019
183
Operational Definitions and Definition of Terms: Exclusion Criteria: Elderly with any health condition thatMalnutrition is defined for the sake of the current study hinders communication or gait balance was excluded fromas “a state of elderly over or under-nutrition as measured the study.by Mini Nutritional Assessment scale, anthropometricmeasurement and observational checklist for signs of Tools for Data Collection: Four tools were used to collectmalnutrition. data of the present study: Tool (I) - A structured interview
Aim of the Study: developed by researcher:
Assess nutritional status of institutionalized elderly. Part 1: Personal and medical data sheet (15 questions) toRecommend a plan of care assess age, sex, length of hospitalization, comorbidities,
Research Question: What is the nutritional status of (11 questions about decreased appetite, loss of teeth, lossinstitutionalized elderly? of taste and smell, vision and hearing problems,
MATERIALS AND METHOD constipation, gastritis, abdominal gases, social isolation,
Research Design: A descriptive exploratory cross-sectional research design was used. Part 2: Dietary assessment sheet: It included 24 hours
Setting: Four governmental geriatric homes that follow food intake, nutritional habits, satisfaction with geriatricministry of social solidary affairs in Cairo and Giza home food services, and number of regular meals, maingovernorate were randomly selected from a list of all meal, and mealtime social activities. To calculate totalgeriatric homes. These geriatric homes provide formal care caloric food intake, first the researcher filled in theservices for the elderly such as medical, nutritional, social, 24 hours recall sheet to estimate elderly dietary intake inand cultural services. the previous 24 hours. The average daily caloric and
Sample: A multistage cluster random sample (3 stages) information gathered by means of one-day 24 hour dietaryof 100 elderly (aged 60 years or older) who agreed to recalls using food calorie calculator web site WebMDparticipate in the study was selected without restriction to available at https://www.webmd.com/diet/healthtool-food-age or gender and who reside in the geriatric home for at calorie-counter [26] then compared with food tables toleast one year. The 1 stage of selecting the sample was identify if of food dietary intake total mean scores is inst
random selection of two governorates (Cairo and Giza congruence with the reference standard or not.governorate). The 2 stage included a random selectionnd
of 4 geriatric homes (El-Ta’aroof, Om Hanee, El-Habaiband Scoring System: Responses in tool (1) are yes and no.El-Sahwa) from a list of all governmental geriatric homes Each “Yes” response was scored as 2 and no responsenames that follow the 2 previously mentioned was scored as 1.governorates. During the 3 stage, sample size wasrd
determined by free sample size calculator web site Tool (II): Anthropometric evaluation to measure elderly(https://www.calculator.net/sample-size-calculator.html) body weight, height using a standard scales. Weight andto be 100. To select this number, 25 elderly were randomly height used to calculate the body mass index (BMI)selected from each geriatric home by picking every odd utilizing the formula BMI = (Weight in kg)/ height innumber from a list of all elderly names in each geriatric meter. Mid-upper arm circumference (MUAC), calfhome. circumference (CC) and triceps skin fold thickness (TSF)
Inclusion Criteria: Fully conscious elderly who resides measurement and skin fold caliber.in geriatric home for at least one year, and who are freefrom depleting condition (such as dementias or Scoring System: BMI was categorized into four weightcerebrovascular stroke). classes (>18.5 (underweight), 18.5 to 24.9 (healthy weight),
schedule to fill in a 2 parts questionnaire that was
medications used and elderly nutritional complains
gastrointestinal complains such as vomiting, diarrhea or
insufficient food intake, total teeth loss and denture use).
dietary recall of food intake and estimation of total caloric
nutrient intake of elderly was then assessed from
2
was also measured by standard techniques using tape
World J. Nursing Sci., 5 (3): 181-193, 2019
184
and 25.0 to 29.9 (overweight), 30.0 to 39.9 (obese). for the developed tools. For the developed tools,Anthropometric measurements were also considered as Cronbach's Alpha was 0.87 for the structurednormal values when above 10th percentile (P10-reference questionnaire and was 0.89 for the observationalvalue) for age and gender. Calf circumference: <31cm, checklist. Scales (weighing scale and skin caliber) usedMid-upper arm circumference: < 22cm, Triceps skin fold for anthropometric measurement were calibrated beforethickness: male<8, female <12 cm. Scales were calibrated every use. Cronbach's Alpha was 0.83 for mini-nutritionaland cleaned before every use [30, 31]. assessment scale.
Tool (III): An observational checklist was developed by Procedure: Data of the present study was collected overresearcher to assess physical signs of malnutrition a period of 4 months. Official permissions were obtainedamong elderly such as skin color, hair, eyes, lips, tongue, from geriatric home directors then written informednails, face. It included 35 questions. consents were obtained from every elderly who agreed to
Scoring System: The total scores are 70 classified as: with every elderly per week in the morning untilhigh risk for malnutrition (56-70 scores); moderate risk for completion of the study. Each interview took about 20 tomalnutrition (45-55 scores) and low risk for malnutrition 35 minutes in every time due to elderly short attention(less than 45 scores). span. The first interview included establishing rapport
Tool (IV): An Arabic version of the standardized The second interview included filling in the structuredMini- Nutritional Assessment Scale (MNA) developed questionnaires (I, III, and IV) and clinical observation ofby Vellas [27], Rubenstein et al. [28] and Guigoz [29]. elderly nutritional status by the researcher. The thirdIt consists of 2 parts; part 1 is screening (6 questions), interview included completing tool II anthropometricand part 2 is assessment/evaluation (12 questions). measurements (Height, weight, mid-upper armPart 1 contained 6 questions (such as, food intake decline circumference (MUAC), calf circumference (CC) andover the past 3 months due to loss of appetite, digestive triceps skin fold thickness (TSF) for every elderly usingproblems, chewing or swallowing difficulties, mobility, weighting scale, skin caliber, measurement tape. Scalespsychological stress or acute disease, and body mass were calibrated before every use. Every elderly wasindex). provided with an Arabic written copy of a booklet about
Scoring System: Scoring of questions in this part ranged proper nutrition, nutritional needs of elderly, componentsfrom (0-2) in three questions and ranged from (0-3) in two of healthy diet and healthy food choices, food guidequestions and one question with (yes or no answers); pyramid and food groups, risk factors of malnutritiontotal score for this part ranged from (0-14). Scores from among institutionalized elderly (such as age- related12-14 points indicated normal nutritional status, 8-11 changes, poor dental health, medication side-effects, lackpoints indicated presence of malnutrition risk and of finances, and physical difficulty), and preventive0-7 points indicated malnutrition. Part 2 contained 12 measures and management of malnutrition.questions asks if elderly lives independently, takes morethan 3 prescription drugs per day, pressure ulcers, meal Ethical Considerations: Participation in this study isintake, mode of feeding and self -view of nutritional entirely voluntary after explanation of purpose and naturestatus. Scores ranged from (0-2) in four questions, from of the study. Each elderly had the right to accept or refuse(0-1) four questions and with yes or no answers in participation in the study and that they can withdraw fromfour questions. Total scores for this part ranged from the study at any time. An informed written consent had(24-30 points), 24 to 30 points indicated normal nutritional been obtained. Anonymity and confidentiality werestatus, 17 to 23.5 points at risk of malnutrition, less than assured through coding the data, elderly were assured17 points indicated malnutrition. that this data was not be reused in another research
Tools Validity and Reliability: Study tools were tested for for purpose the current research only.content validity by 3 experts in the field of gerontologicalnursing, nutrition and medical surgical nursing. Content Pilot Study: It was conducted on 10 institutionalizedValidity Index (CVI) was calculated to be 85 and 89% elderly (equal 10% of total sample size) who reside in
participate in the study. Three interviews were carried out
and explaining the aim, nature and purpose of the study.
proper nutrition for elderly including the importance of
without permission and that data collected will be used in
World J. Nursing Sci., 5 (3): 181-193, 2019
185
geriatric homes for at least one year and was conducted Section I. Part 2: Dietary assessment (daily meal intake,in the original study settings to assess the feasibility of nutritional habits, satisfaction with geriatric home foodthe study as well as clarity of data collection tools and to services, and mealtime social activities):determine the needed time for application of study tools. Table (1) reveals that, 51% of elderly energy intake
Statistical Data Analysis: Data were coded, scored, intake didn’t meet the reference standards among 89 andtabulated, and analyzed by computer using “Statistical 80% of elderly, respectively. Moreover 78% of elderlyPackage for Social Science” (SPSS windows) Version 22. protein intake didn’t meet the reference standard.Numerical data were expressed as mean ± SD. Quantitative Table (2) shows that, 44% of elderly reported thatdata were expressed as frequency and percentage. geriatric home serve sufficient food amount per meal.,Chi-square test was used to assess relationships between Only 15% reported that meals presented are consideringcategorical variables. Probability (p-value) less than special cases, whereas, only 10% of elderly mentioned0.05 was considered significant and less than 0.01 was that food choices are allowed in these geriatric homes.considered as highly statistically significant. Regarding dietary habits, Table (3) reveals that, 88%
RESULTS of elderly eat between meals. In relation to social mealtime
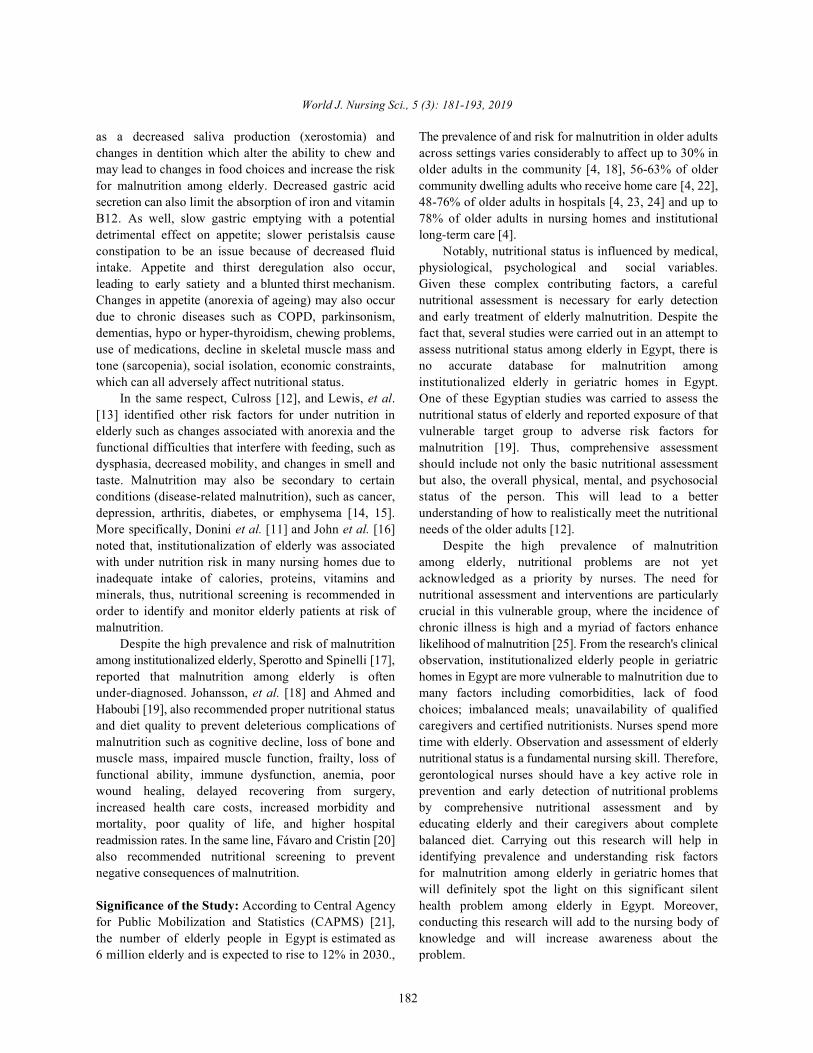
Section I. Part 1: Personal, and medical data of elderly: As regards the place where elderly took meal, 52% ofIt is clear from Figure (1) that, 32% of elderly aged elderly reported that they took meal in the specified place
from 60 to less than 65 while, 31% of them aged from 65 to of meal serving (the dining room).less than 70 years. Moreover, 62% were widow/widowed;furthermore, 52% were males. In relation to educational Section II: Anthropometric measurement:level, 32% of elderly completed primary education. Figure (5) reveals that, 35% of elderly had acceptable
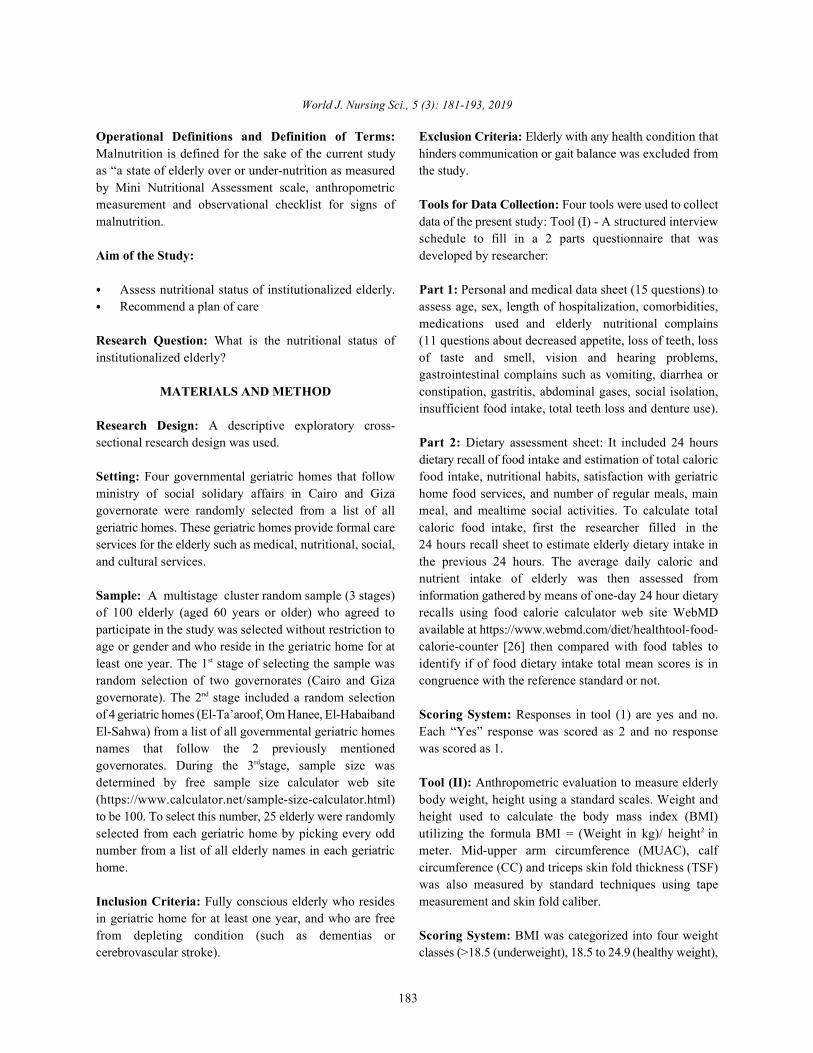
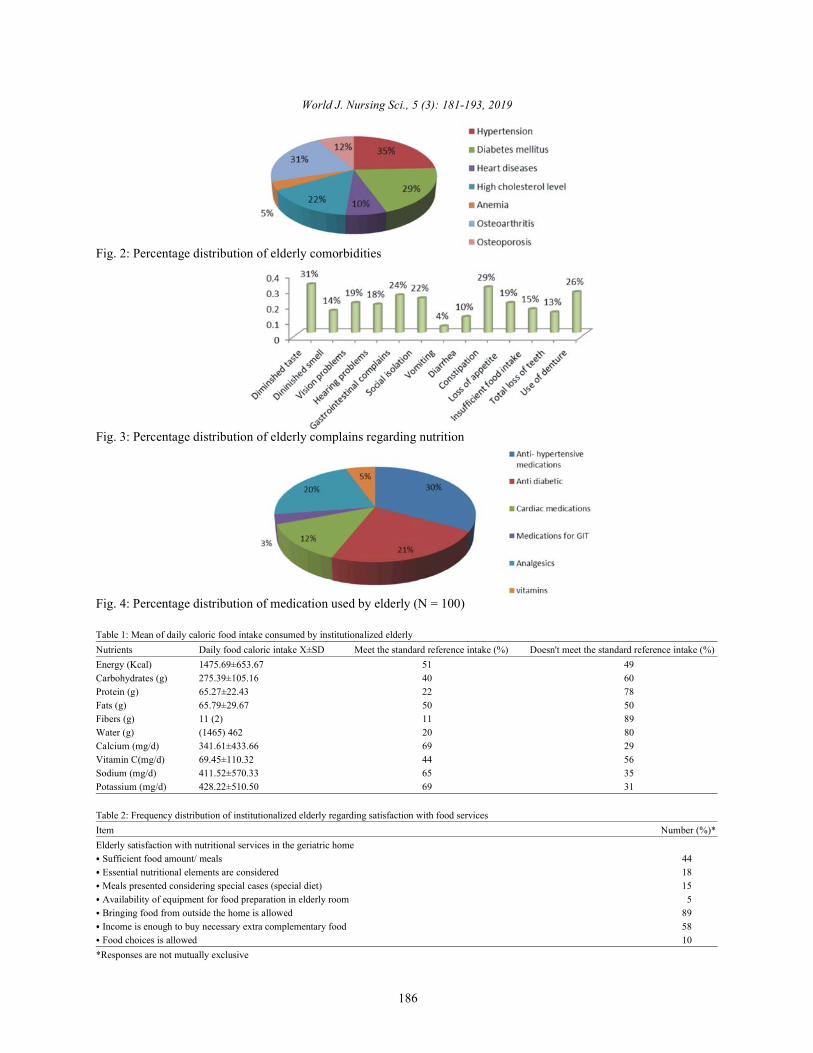
Figure (2) illustrates that, elderly complains of chronic weight for height, while 26% were obese, 22% werediseases/ comorbidities such as hypertension (35%), overweight and 17% were underweight.diabetes (29%), osteoarthritis (31%), high cholesterol level(22%) and osteoporosis (12%) and anemia (5%). Section III: Clinical observation of physical signs of
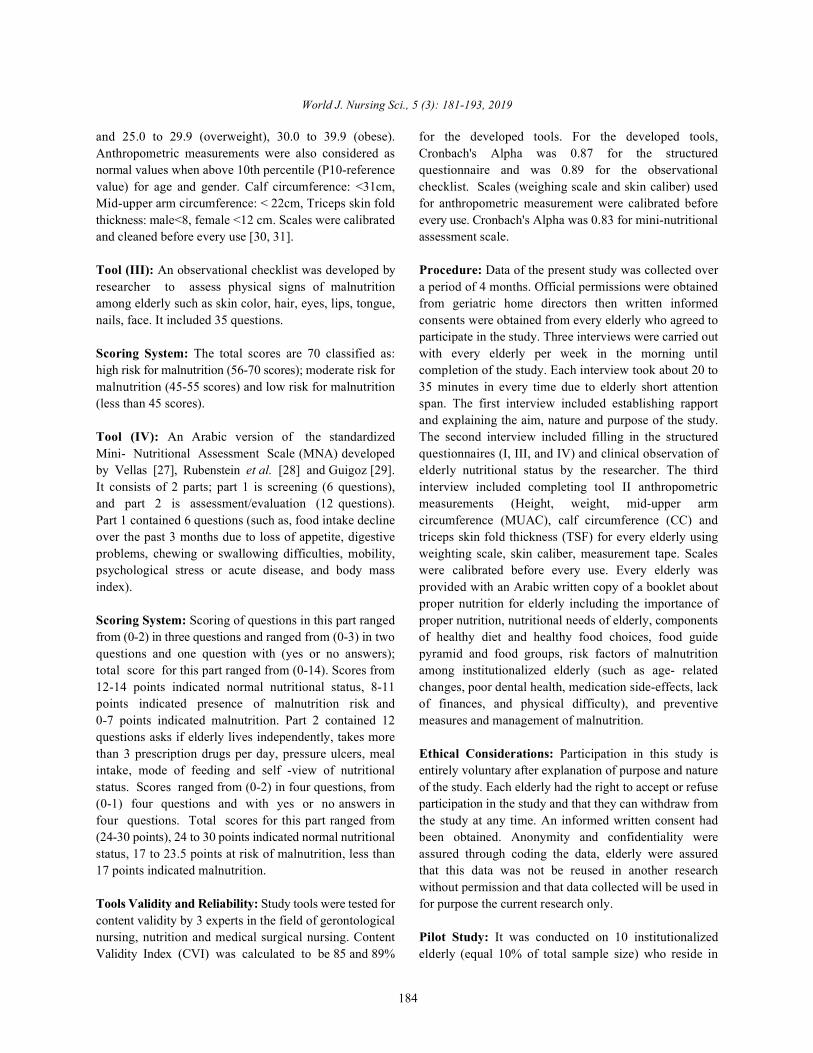
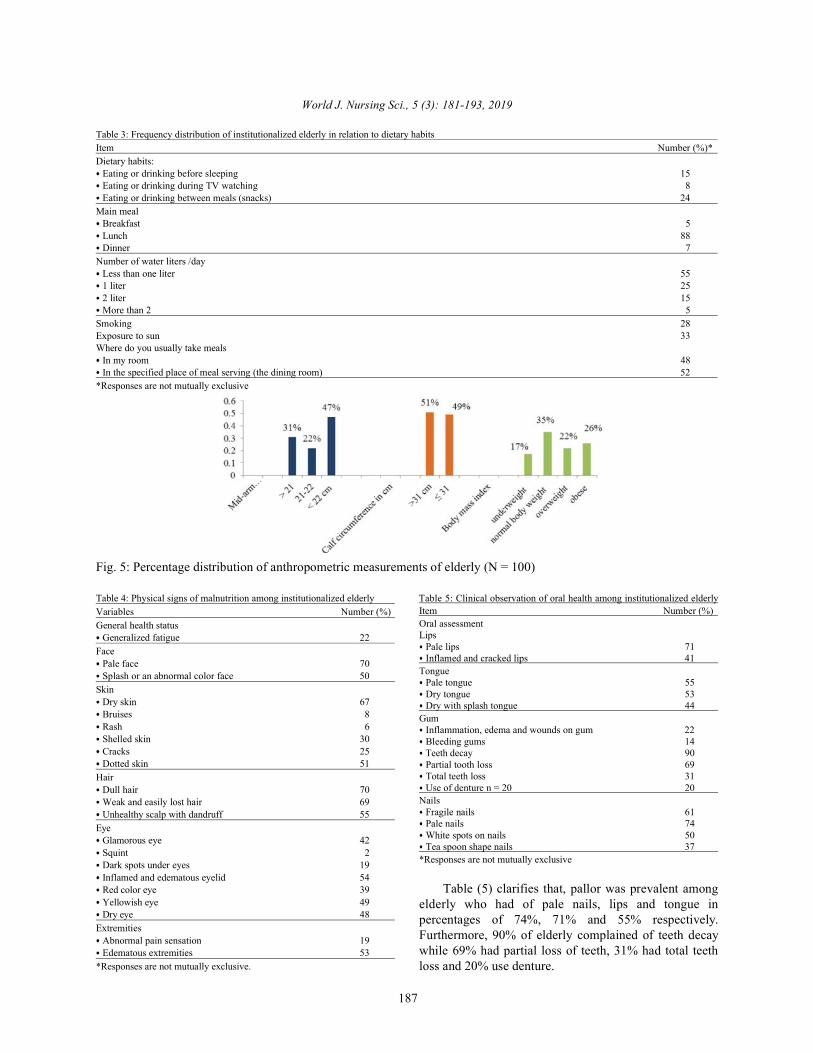
Figure (3) clarifies that, elderly complains in relation elderly malnutrition:to nutritional status were diminished taste (31%), Table (4) clarifies that, observed physical signs ofconstipation (29%), denture use (26%), gastrointestinal malnutrition were: generalized fatigue (22%), dull haircomplains (24%). (70%), dry skin (67%), weak and easily lost hair (69%),
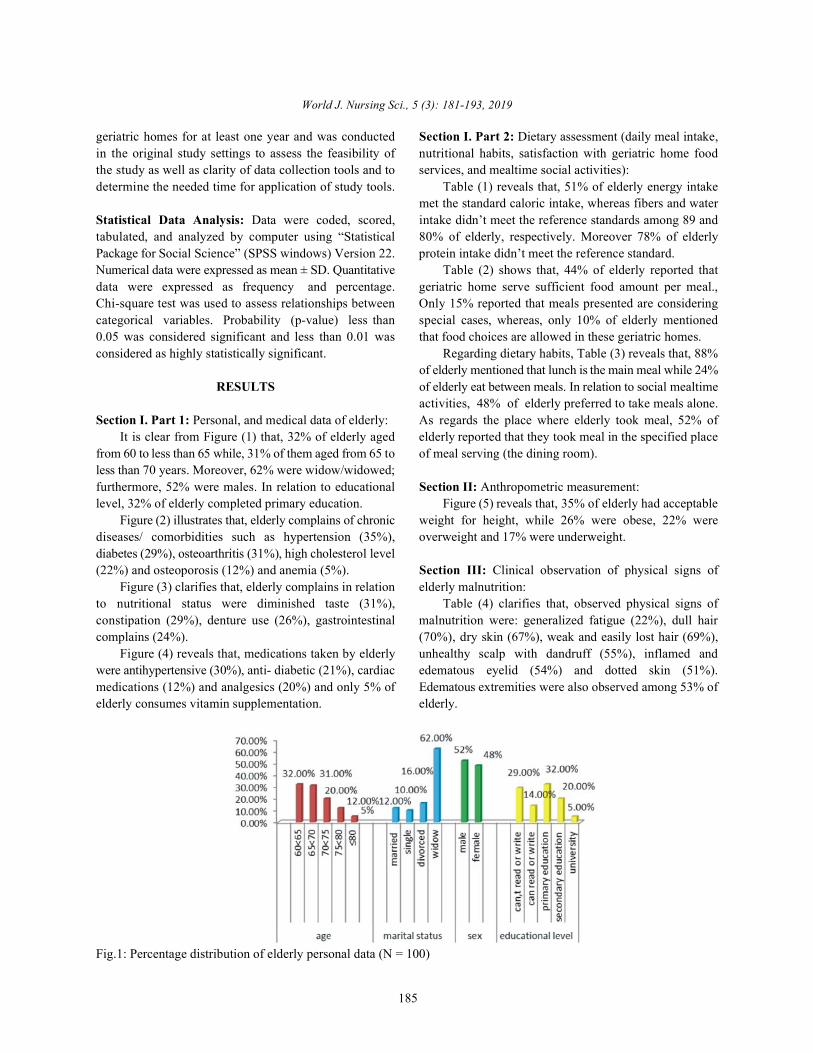
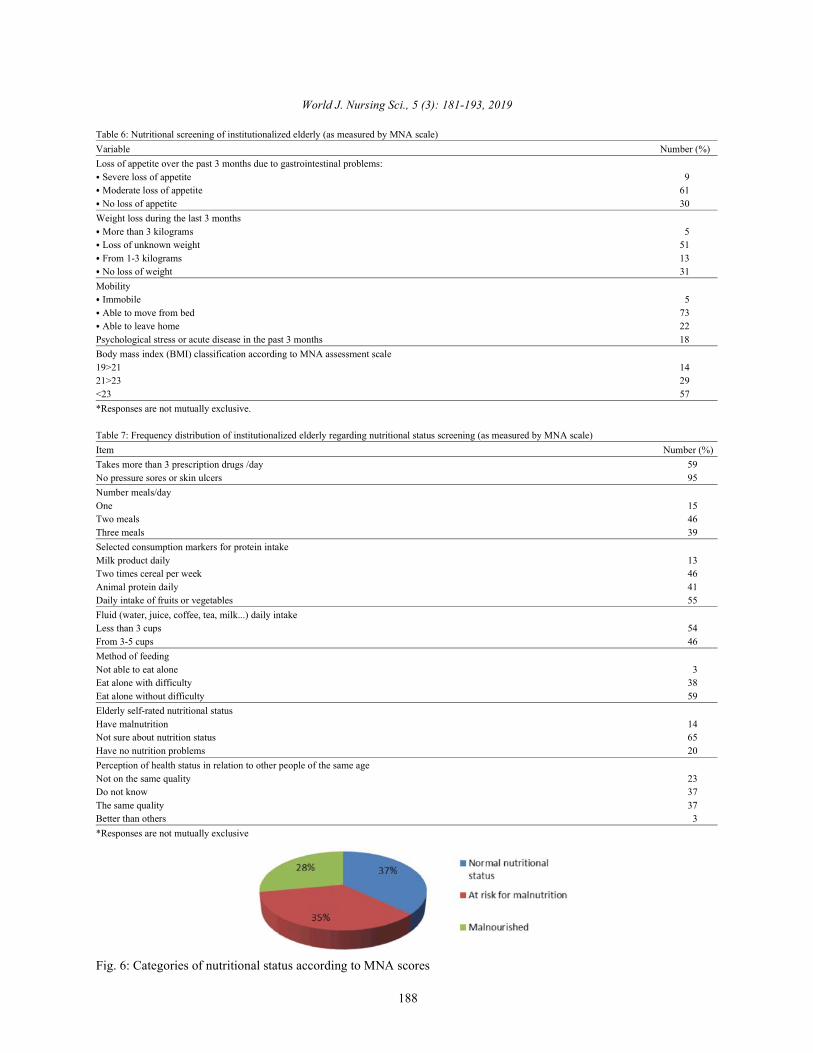
Figure (4) reveals that, medications taken by elderly unhealthy scalp with dandruff (55%), inflamed andwere antihypertensive (30%), anti- diabetic (21%), cardiac edematous eyelid (54%) and dotted skin (51%).medications (12%) and analgesics (20%) and only 5% of Edematous extremities were also observed among 53% ofelderly consumes vitamin supplementation. elderly.
met the standard caloric intake, whereas fibers and water
of elderly mentioned that lunch is the main meal while 24%
activities, 48% of elderly preferred to take meals alone.
Fig.1: Percentage distribution of elderly personal data (N = 100)
World J. Nursing Sci., 5 (3): 181-193, 2019
186
Fig. 2: Percentage distribution of elderly comorbidities
Fig. 3: Percentage distribution of elderly complains regarding nutrition
Fig. 4: Percentage distribution of medication used by elderly (N = 100)
Table 1: Mean of daily caloric food intake consumed by institutionalized elderlyNutrients Daily food caloric intake X±SD Meet the standard reference intake (%) Doesn't meet the standard reference intake (%)Energy (Kcal) 1475.69±653.67 51 49Carbohydrates (g) 275.39±105.16 40 60Protein (g) 65.27±22.43 22 78Fats (g) 65.79±29.67 50 50Fibers (g) 11 (2) 11 89Water (g) (1465) 462 20 80Calcium (mg/d) 341.61±433.66 69 29Vitamin C(mg/d) 69.45±110.32 44 56Sodium (mg/d) 411.52±570.33 65 35Potassium (mg/d) 428.22±510.50 69 31
Table 2: Frequency distribution of institutionalized elderly regarding satisfaction with food servicesItem Number (%)*Elderly satisfaction with nutritional services in the geriatric home Sufficient food amount/ meals 44 Essential nutritional elements are considered 18 Meals presented considering special cases (special diet) 15 Availability of equipment for food preparation in elderly room 5 Bringing food from outside the home is allowed 89 Income is enough to buy necessary extra complementary food 58 Food choices is allowed 10
*Responses are not mutually exclusive
World J. Nursing Sci., 5 (3): 181-193, 2019
187
Table 3: Frequency distribution of institutionalized elderly in relation to dietary habitsItem Number (%)*Dietary habits: Eating or drinking before sleeping 15 Eating or drinking during TV watching 8 Eating or drinking between meals (snacks) 24
Main meal Breakfast 5 Lunch 88 Dinner 7
Number of water liters /day Less than one liter 55 1 liter 25 2 liter 15 More than 2 5
Smoking 28Exposure to sun 33Where do you usually take meals In my room 48 In the specified place of meal serving (the dining room) 52
*Responses are not mutually exclusive
Fig. 5: Percentage distribution of anthropometric measurements of elderly (N = 100)
Table 4: Physical signs of malnutrition among institutionalized elderly Table 5: Clinical observation of oral health among institutionalized elderlyVariables Number (%)General health status Generalized fatigue 22
Face Pale face 70 Splash or an abnormal color face 50
Skin Dry skin 67 Bruises 8 Rash 6 Shelled skin 30 Cracks 25 Dotted skin 51
Hair Dull hair 70 Weak and easily lost hair 69 Unhealthy scalp with dandruff 55
Eye Glamorous eye 42 Squint 2 Dark spots under eyes 19 Inflamed and edematous eyelid 54 Red color eye 39 Yellowish eye 49 Dry eye 48
Extremities Abnormal pain sensation 19 Edematous extremities 53
*Responses are not mutually exclusive.
Item Number (%)Oral assessmentLips Pale lips 71 Inflamed and cracked lips 41
Tongue Pale tongue 55 Dry tongue 53 Dry with splash tongue 44
Gum Inflammation, edema and wounds on gum 22 Bleeding gums 14 Teeth decay 90 Partial tooth loss 69 Total teeth loss 31 Use of denture n = 20 20
Nails Fragile nails 61 Pale nails 74 White spots on nails 50 Tea spoon shape nails 37
*Responses are not mutually exclusive
Table (5) clarifies that, pallor was prevalent amongelderly who had of pale nails, lips and tongue inpercentages of 74%, 71% and 55% respectively.Furthermore, 90% of elderly complained of teeth decaywhile 69% had partial loss of teeth, 31% had total teethloss and 20% use denture.
World J. Nursing Sci., 5 (3): 181-193, 2019
188
Table 6: Nutritional screening of institutionalized elderly (as measured by MNA scale)Variable Number (%)Loss of appetite over the past 3 months due to gastrointestinal problems: Severe loss of appetite 9 Moderate loss of appetite 61 No loss of appetite 30
Weight loss during the last 3 months More than 3 kilograms 5 Loss of unknown weight 51 From 1-3 kilograms 13 No loss of weight 31
Mobility Immobile 5 Able to move from bed 73 Able to leave home 22
Psychological stress or acute disease in the past 3 months 18Body mass index (BMI) classification according to MNA assessment scale19>21 1421>23 29<23 57*Responses are not mutually exclusive.
Table 7: Frequency distribution of institutionalized elderly regarding nutritional status screening (as measured by MNA scale)Item Number (%)Takes more than 3 prescription drugs /day 59No pressure sores or skin ulcers 95Number meals/dayOne 15Two meals 46Three meals 39Selected consumption markers for protein intakeMilk product daily 13Two times cereal per week 46Animal protein daily 41Daily intake of fruits or vegetables 55Fluid (water, juice, coffee, tea, milk...) daily intakeLess than 3 cups 54From 3-5 cups 46Method of feedingNot able to eat alone 3Eat alone with difficulty 38Eat alone without difficulty 59Elderly self-rated nutritional statusHave malnutrition 14Not sure about nutrition status 65Have no nutrition problems 20Perception of health status in relation to other people of the same ageNot on the same quality 23Do not know 37The same quality 37Better than others 3*Responses are not mutually exclusive
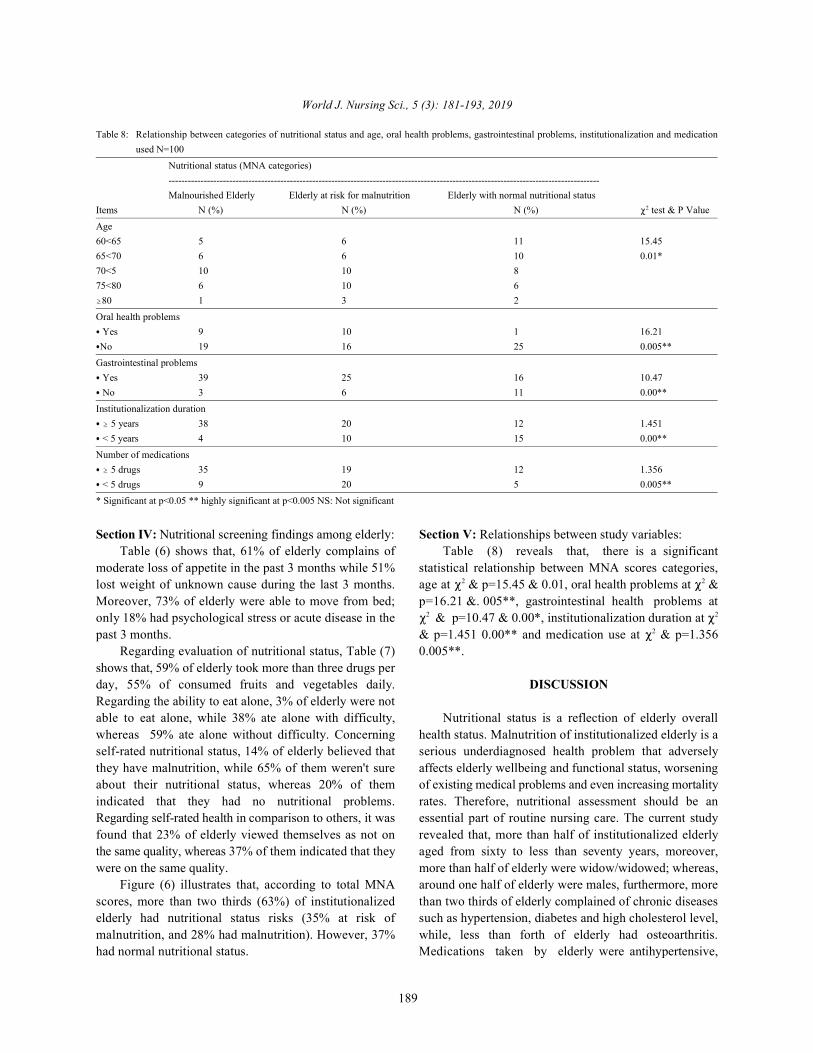
Fig. 6: Categories of nutritional status according to MNA scores
World J. Nursing Sci., 5 (3): 181-193, 2019
189
Table 8: Relationship between categories of nutritional status and age, oral health problems, gastrointestinal problems, institutionalization and medicationused N=100
Nutritional status (MNA categories)---------------------------------------------------------------------------------------------------------------------------------------Malnourished Elderly Elderly at risk for malnutrition Elderly with normal nutritional status
Items N (%) N (%) N (%) test & P Value2
Age60<65 5 6 11 15.4565<70 6 6 10 0.01*70<5 10 10 875<80 6 10 6
80 1 3 2
Oral health problems Yes 9 10 1 16.21No 19 16 25 0.005**
Gastrointestinal problems Yes 39 25 16 10.47 No 3 6 11 0.00**
Institutionalization duration 5 years 38 20 12 1.451
< 5 years 4 10 15 0.00**
Number of medications 5 drugs 35 19 12 1.356
< 5 drugs 9 20 5 0.005**
* Significant at p<0.05 ** highly significant at p<0.005 NS: Not significant
Section IV: Nutritional screening findings among elderly: Section V: Relationships between study variables:Table (6) shows that, 61% of elderly complains of Table (8) reveals that, there is a significant
moderate loss of appetite in the past 3 months while 51% statistical relationship between MNA scores categories,lost weight of unknown cause during the last 3 months. age at & p=15.45 & 0.01, oral health problems at &Moreover, 73% of elderly were able to move from bed; p=16.21 &. 005**, gastrointestinal health problems atonly 18% had psychological stress or acute disease in the & p=10.47 & 0.00*, institutionalization duration at past 3 months. & p=1.451 0.00** and medication use at & p=1.356
Regarding evaluation of nutritional status, Table (7) 0.005**.shows that, 59% of elderly took more than three drugs perday, 55% of consumed fruits and vegetables daily. DISCUSSIONRegarding the ability to eat alone, 3% of elderly were notable to eat alone, while 38% ate alone with difficulty, Nutritional status is a reflection of elderly overallwhereas 59% ate alone without difficulty. Concerning health status. Malnutrition of institutionalized elderly is aself-rated nutritional status, 14% of elderly believed that serious underdiagnosed health problem that adverselythey have malnutrition, while 65% of them weren't sure affects elderly wellbeing and functional status, worseningabout their nutritional status, whereas 20% of them of existing medical problems and even increasing mortalityindicated that they had no nutritional problems. rates. Therefore, nutritional assessment should be anRegarding self-rated health in comparison to others, it was essential part of routine nursing care. The current studyfound that 23% of elderly viewed themselves as not on revealed that, more than half of institutionalized elderlythe same quality, whereas 37% of them indicated that they aged from sixty to less than seventy years, moreover,were on the same quality. more than half of elderly were widow/widowed; whereas,
Figure (6) illustrates that, according to total MNA around one half of elderly were males, furthermore, morescores, more than two thirds (63%) of institutionalized than two thirds of elderly complained of chronic diseaseselderly had nutritional status risks (35% at risk of such as hypertension, diabetes and high cholesterol level,malnutrition, and 28% had malnutrition). However, 37% while, less than forth of elderly had osteoarthritis.had normal nutritional status. Medications taken by elderly were antihypertensive,
2 2
2 2
2
World J. Nursing Sci., 5 (3): 181-193, 2019
190
anti- diabetic, cardiac medications and analgesics among presence of qualified dieticians to consider nutritionalelderly. These findings are in agreement with a similar needs of all institutionalized elderly with different healthcomparative study carried out by El-Kady and Tayel [32], conditions, moreover continuous professional training forin Alexandria about nutritional assessment of nurses about nutritional assessment and nutritional careinstitutionalized and free-living elderly. of elderly should be an integral part of nursing education
In relation to elderly energy intake, it was found that and practice.around half of elderly consume the standard caloric Although, careful nutritional assessment is necessaryintake, whereas protein, fibers and water intake didn’t for both successful diagnosis and treatment plans ofmeet the reference standards among majority of elderly, malnutrition among elderly, it is an unrecognized aspectthis is goes with Sumaila [33], who reported similar results of elderly health assessment. In this respect, Wells andin a project in Ghana to assess dietary intake and Jyvakorpi [38, 39], reported that nutritional assessmentnutritional status of elderly people living in a care home. deserves special attention because nutrition is crucial toRegarding dietary habits, majority of elderly mentioned elderly health promotion, health maintenance andthat lunch was the main meal while, less than one fourth preservation of normal immune functioning. As regardsof elderly ate snacks between meals. Adding to that, a BMI, current study revealed a high prevalence ofsignificant portion of elderly reported unhealthy lifestyle overweight and obesity among half of the studied elderly,practices such as smoking, lack of sunlight exposure this is in the same line with De Lima et al. [35], who(two thirds of elderly) and drinking less than one liter reported similar results in their research. of water per day (more than one half of elderly). Regarding clinical observation of malnutritionFrom researcher point of view, these findings necessitate physical signs total scores, current study revealed thateducating institutionalized elderly to adopt a healthier more than half of elderly were at low (eighteen percent),dietary habits and lifestyle practices since it is an moderate (seventeen percent) or high (twenty sevenessential element of proper nutrition and health percent) risk of malnutrition. In relation to anthropometricpromotion. Current researcher also recommends measurement, more than half of the studied elderlyfood-based fortification of the standard diet served for suffered from either under or over nutrition. It is alsoelderly in geriatric homes to prevent malnutrition risk worth saying that, loss of appetite among elderly over theamong this vulnerable group. past 3 months was due to gastrointestinal problems;
Regarding satisfaction with food services in geriatric moderate loss of appetite and lost weight during the lasthomes, unfortunately, majority of elderly reported that 3 months among more than half of elderly, moreover,meals presented are not considering special cases such as majority of elderly were able to move from bed and had nodiabetics or hypertensive elderly and that food choices psychological stress or acute disease in the past 3are not allowed in these geriatric homes. Additionally, months. Additionally, regarding category of nutritionalmore than half of them mentioned that food amounts status among current studied elderly sample according toserved by the geriatric home kitchen per meal were MNA scores, it was found that more than one fourth ofinsufficient and that income was not enough to buy extra elderly suffered from malnutrition, while more than twocomplementary food other than food that is served by thirds of them were at risk of malnutrition. These findinggeriatric home kitchens. Current findings are in the is in agreement with Caçador et al. [40]. This finding alsosame line with Santelle et al. [34], who found that factors goes with El-Kady and Tayel [32], who compared thethat affect Brazilian elderly nutritional status include nutritional status of institutionalized elderly with freefood preparation and monotony of menus and living elderly in Alexandria and found also that two thirdsinstitutional feeding routine. These findings is supported of the institutionalized elderly were at risk of malnutritionby De Lima et al. [35], who assessed nutritional status but they reported lower percent of elderly who wereand its’ associated factors among institutionalized elderly actually malnourished. Current study findings also goesand reported a high percentage of malnutrition that was with, De Lima et al. [35], who reported high prevalence ofcontributed to the lower income and inability to purchase overweight according to BM and high risk for malnutritioncomplementary foods such as vegetables and fruits. according to MNA scale. Regarding evaluation ofSimilarly, Bouis et al. [36] and Ferdous et al. [37] found nutritional status among elderly in the current study,that malnutrition was more encountered among the poor around two thirds of elderly took more than threeelderly. From current researcher point of view, food drugs per day. Additionally, regarding the elderly abilitychoices should be allowed in all geriatric homes and to eat alone, almost all elderly were able to eat alone.
World J. Nursing Sci., 5 (3): 181-193, 2019
191
Regarding elderly self-rated health in comparison to studies done in 2016 by Fávaro et al. [20] who reportedothers, it was found that less than one fourth of elderly similar risk factors for elderly malnutrition includingviewed themselves as not on the same quality of other age, institutionalization, constipation, and polypharmacy.elderly health, whereas more than one third of them To sum up, the following study highlighted the crucialindicated that they were on the same quality. nursing role in comprehensive nutritional assessment of
This finding is supported by a study by institutionalized elderly for malnutrition. Using simpleAmorim et al. [41], that assessed nutritional status of routine and easy to use assessment methods,institutionalized Brazilians elderly with MNA scale, the gerontological nurses can early detect and intervene withpercentage of malnutrition among institutionalized elderly institutionalized elderly malnutrition. was much more higher than the current study findingsbecause sixty six percent of elderly where malnourished or CONCLUSIONSat risk of malnutrition, according to MNA. Another similarstudy by Nazemi et al. [42], in Tehran detected different Studied institutionalized elderly in geriatric homesgrades of malnutrition among more than 50% of elderly. suffered from malnutrition which may predispose them toEvidently, many previous studies found high prevalence detrimental health effects. Significant statisticalof under-nutrition in geriatric institutions and claim that relationships were found between MNA scores categoriesinstitutionalized older adults tend to have poorer and age, oral health problems and gastrointestinal healthnutritional status than those non-institutionalized older problems, and between length of institutionalization,adults [43]. From researcher point of view, these findings numbers of medications. These findings clearlymay signal an urgent need for nationwide nutritional necessitate the integration of elderly nutritionalassessment of all institutionalized elderly. Planning and assessment into routine nursing care. implementation of nutritional care programs forinstitutionalized elderly is also vital to tackle malnutrition Recommendations:among elderly.
Specifically, physical observation of elderly for Conduct a nation-wide nutritional screening surveyphysical signs of malnutrition revealed dull hair, dry skin, of institutionalized elderly malnutrition.weak and easily lost hair, unhealthy scalp with dandruff, Integrate multiple reliable biochemical markerdotted skin, Inflamed and edematous eyelid, pallor was a methods (blood, urine, stool, hair and nail samples)prevalent observation among majority of elderly to assess nutritional status of institutionalized elderlyinstitutionalized (pale nails, lips and face). Edematous such as laboratory investigations (albumin test andextremities were also observed among half of elderly. complete blood count).Fragile and white spots on nails were observed among Plan and implement educational programs abouttwo thirds and more than half of elderly respectively. proper nutrition for institutionalized elderly andAs regards dental problems, it was also observed caregivers.among more than two thirds of elderly including dental Introduce food-based fortification nutritionalcaries, partial loss of teach among, total loss of teeth or programs for institutionalized elderly in geriatricuse of denture, these findings are in agreement with homes.De Lima et al. [35], and Enabuleleb and Omo [44] whoobserved high prevalence of dental impairments that was REFERENCEScontributed to low intake of nutrients and decrease in theaverage intake of vitamins and minerals. Additionally, 1. El-Zanaty, F. and A. Way, 2015. Egypt DemographicToniazzo et al. [45] found that, teeth loss may induce and Health Survey. Cairo, Egypt: Ministry of Health,inappropriate food selection and texture by elderly to available at www.egypt.gov.eg.adapt for dental condition which is consequently may 2. Abdelwahed, A.Y., M.M. Algameel and D.I. Tayel,result in loss of appetite and pleasure in eating. 2018. Effect of a Nutritional Education Program on
Current study findings revealed significant statistical Nutritional Status of Elderly in Rural Areas ofrelationship between MNA scores categories and age, Damanhur City, Egypt, International Journal oforal health problems and gastrointestinal health problems Nursing Science, 8(5): 83-92.and between length of institutionalization and numbers of 3. Soeters, P.B. and A.M. Schols, 2009. Advances inmedications. Evidently, current research findings are understanding and assessing malnutrition. Curr.supported by a systematic review of 6 longitudinal Opin. Clin. Nutr. Metab. Care, 12(5): 487-494.
World J. Nursing Sci., 5 (3): 181-193, 2019
192
4. Cereda, E., C. Pedrolli, C. Klersy, C. Bonardi, 16. John, B.K., M. Bullock, L. Brenner, C. McGaw andL. Quarleri, S. Cappello and R. Caccialanza, 2016.Nutritional status in older persons according tohealthcare setting: A systematic review and meta-analysis of prevalence data using MNA®, ClinicalNutrition, 35: 1282-1290.
5. Torma, J., U. Winblad, T. Cederholm and A. Saletti,2013. Does under nutrition still prevail among nursinghome residents?, Clinical Nutrition, 32(4): 562-8.
6. Serrano, R. and J. Garcia, 2013. Malnutrition in anelderly population without cognitive impairmentliving in nursing homes in Spain: study of prevalenceusing the Mini Nutritional Assessment test.Gerontology, 59(6): 490-8.
7. Nie, C., J. Meijers, J. Schols, C. Lohrman,S. Bartholomeyczik and M. Spreeuwenberg, 2014.Which characteristics of nursing home residentsinfluence differences in malnutrition prevalence?An international comparison of The Netherlands,Germany and Austria. British Journal of Nutrition,111(6): 1129-36.
8. Khater, M.S.H. and N.F. Abouelezz, 2011. Nutritionalstatus in older adults with mild cognitive impairmentliving in elderly homes in Cairo, Egypt. Journal ofNutrition Health Aging, 15(2): 104-108.
9. Smith, J. and J. Seirafi, 2011. Delirium and dementia.Textbook of Family Medicine. 8 ed. Philadelphia,th
Pa: Saunders Elsevier.10. Van Bokhorst-de Van Der Schueren, M.A., S.
Lonterman Monasch, O.J. De Vries, S.A. Danner,M.H. Kramer and M. Muller, 2013. Prevalence anddeterminants for malnutrition in geriatric outpatients.Clin. Nutr., 32(6): 1007-11.
11. Donini, L.M., P. Scardella, L. Piombo, B. Neri,R. Asprino, A.R. Proietti, 2013. Malnutrition inelderly: Social and economic determinants. Journal ofNutritional Health Aging, 17(1): 9-15.
12. Culross, B., 2008. Nutrition?: Meeting the Needs ofthe elderly, gerontology update. ARN Nsetwork.
13. Lewis, S.L., J. Maltas, S.R. Dirksen and L. Bucher,2015. Study guide for medical surgical nursing:Assessment and management of clinical problems.Elsevier Health Sciences.
14. Abdelrahman, H.M.M. and A.E.E. Elawam, 2012.Nutrition Status in Community Dwelling OlderPopulation in an Egyptian Urban Area, Journal ofAging Research & Clinical Practice.
15. Gellar, M.C. and D. Alter, 2015. The Impact ofDentures on the Nutritional Health of the Elderly,4(1): 50-53.
J.S. Scolapio, 2013. Nutrition in the elderly, frequentlyasked questions, The American journal ofgastroenterology, 108(8): 1252, behavior, TheAmerican Journal of Gastroenterology, 108(8): 12.
17. Sperotto, F.M. and R.B. Spinelli, 2010.Nutritional assessment in independent elderlyfrom a long stay institution in the municipality ofErechim-RS city, PERSPECTIVA, Erechim,34(125): 105-116.
18. Johansson, Y., M. Bachrach-Lindstrom and J.Carstensen, 2009. Malnutrition in a home-living olderpopulation: prevalence, incidence and risk factors,aprospective study, Journal of Clinical Nursing,18(9): 1354-64.
19. Ahmed, T. and N. Haboubi, 2010. Assessment andmanagement of nutrition in older people and itsimportance to health. Clinical Interventions in Aging,5: 207-16.
20. Fávaro, M., N. Cristin, 2016. “Risk factors formalnutrition in older adults: a systematic review ofthe literature based on longitudinal data.” advancesin nutrition (Bethesda, Md.) 7: 3 507-22.16.
21. Central agency of public mobilization andstatistics (CAPMS), 2017. Available at www.CAMPS.gov.eg.
22. Yang, Y., C.J. Brown, K.L. Burgio, M.L. Kilgore,C.S. Ritchie, D.L. Roth and J.L. Locher, 2011.Under nutrition at baseline and health servicesutilization and mortality over a 1-year period in olderadults receiving Medicare home health services.Journal of the American Medical DirectorsAssociation, 12: 287-294.
23. Bell, C.L., A.S. Lee and B.K. Tamura, 2015.Malnutrition in the nursing home. Curr. Opin ClinNutr. Metab Care, 18(1): 17-23.
24. Vanderwee, K., E. Clays, I. Bocquaert, M. Gobert,B. Folens and T. Defloor, 2010. Malnutrition andassociated factors in elderly hospital patients: ABelgian cross-sectional, multi-centre study. ClinicalNutrition, 29: 469-476.
25. WHO, 2015. Older people and Primary Health Care(PHC). Global Health and Aging.
26. W e b M D , 2 0 1 5 . a v a i l a b l e a thttps://www.webmd.com/diet/healthtool-food-calorie-counter.
27. Vellas, B., H. Villars and G. Abellan, 2006. Overviewof the MNA® - Its History and Challenges. J. Nutr.Health Aging, 10: 456-465.
World J. Nursing Sci., 5 (3): 181-193, 2019
193
28. Rubenstein, L.Z., J.O. Harker, A. Salva, Y. Guigoz and 38. Wells, J.L. and A.C. Dumbrell, 2006. Nutrition andB. Vellas, 2001. Screening for under nutrition in aging: assessment and treatment of compromisedgeriatric practice: developing the short-form Mini nutritional status in frail elderly patients. Clin Interv.Nutritional Assessment (MNA-SF). J. Geront., Aging., 1(1): 67-79.56A: M366-377. 39. Jyväkorpi, S., 2016. Nutrition of older people and the
29. Guigoz, Y., 2006. The Mini-Nutritional Assessment effect of nutritional interventions on nutrient intake,(MNA®) Review of the Literature - What does it tell diet quality and quality of life, doctoral dissertationus? J. Nutr. Health Aging., 10: 466-487. (article-based).
30. Kuczmarski, M.F., R.J. Kuczmarski and M. Najjar, 40. Caçador,C., Edite Teixeira-Lemos, Jorge Oliveira, Luís2000. Descriptive anthropometric reference data for Pedro Teixeira-Lemos, João Pinheiro, Filipaolder Americans. J. Am. Diet Assoc., 100: 59-66. 9. Mascarenhas-MELO, Rosa Martins E. Maria and
31. Barendregt, K.S.P., S.P. Allison and J. Kondrup, 2004. C. Castilho, 2019. Assessment of nutritional statusDiagnosis of malnutrition-screening and assessment. and dietary intake of institutionalized elderlyIn: ESPEN: Basics in Clinical Nutrition Third ed. people in Viseu, International Congress of Health andEditor-in-Chief LubosSobotka. Publ. House Galen Well-being Intervention, Instituto Piaget UniversityPrague Czech Republic., pp: 1-20. Campus of Viseu.
32. El-Kady, H.A.N.D. and D. Tayel, 2011. Nutritional 41. Amorim, M.L., Sena Pereira, Pricilla De AlmeidaAssessment of Institutionalized and Free-living Moreira, Carolina Cunha De Oliveira, Anna KarlaElderly in Alexandria: A Comparative Study, Bulletin Carneiro Roriz, Magali Teresópolis Reis Amaral andof High Institute of Public Health, 41(1): Adriana Lima Mello and Lílian Barbosa Ramos, 2015.
33. Sumaila, 2018. Dietary intake and nutritional status of Nutritional status of institutionalized elderlyelderly people living in a care home in ACCRA, a Brazilians: a study with the Mini Nutritionalbacholer project, GHANA University, Department of Assessment, Nutr Hosp., 31(3): 1198-1204 ISSN 0212-Dietetics, College of Health Sciences. 1611 CodenNuhoeq S.V.R. 318.
34. Santelle, O., A.M.C. Lefevre and A.M Cervato, 2007. 42. Nazemi, L., Ingmar Skoog, Ingvar Karlsson, SaeedIn Luiz Amorim Sena Pereira, Pricilla de Almeida Hosseini, Mohammad Reza Mohammadi, MostafaMoreira, Carolina Cunha de Oliveira, Anna Karla Hosseini, Mohammad Javad Hosseinzade, SeyedCarneiro Roriz, Magali Teresópolis Reis Amaral, Alireza Mesbah-Namin and Masoud Baikpour, 2015.Adriana Lima Mello and Lílian Barbosa Ramos, 2015. Malnutrition Prevalence and Relation to Some RiskNutritional status of institutionalized elderly Factors among Elderly Residents of Nursing HomesBrazilians: a study with the Mini Nutritional in Tehran, Iran, Iran J. Public Health, 44(2): 218-227.Assessment, Nutr. Hosp, 31(3): 1198-1204. 43. Pereira Machado, R.S. and M.A. Santa Cruz Coelho,
35. De Lima, C.B.V., F.L. Moraes and L.A. Cristine Souza, 2011. Risk of malnutrition among Brazilian2012. Nutritional status and associated factors in institutionalized elderly: A study with the Miniinstitutionalized elderly. J. Nutr. Disorders Ther., Nutritional Assessment (MNA) questionnaire. J.2: 116. Nutr. Health Aging., 15(7): 532-5.
36. Bouis, E., P. Eozenou and A. Rahman, 2011. Food 44. Enabuleleb and Omo, 2016. Socio-demographicprices, household income, and resource allocation: determinants of demand for fixed and removablesocioeconomic perspectives on their effects on partial dentures. International Journal of Biomedicaldietary quality and nutritional status. Food Nutrition and Health Science, 21(1): 19-24. Bulletin, 32(1): 14-23. 45. Toniazzo, M., P. Amorim, F. Munizad and P.
37. Ferdous, T., T. Cederholm, N. Kabir, D. Hamadani and Weidilichi, 2018. Relationship of nutritional statusA. Wahlin, 2010. Nutritional status and cognitive and oral health in elderly: systematic review withfunction in community-living rural Bangladeshi older meta-analysis, Clinical Nutrition, 37(3): 824-830.adults: data from the poverty and health in ageingproject. Journal of American Geriatric Society,58(5): 919-24.