Nutritional Status of Adults with HIV in Outpatient ... MAM...in Outpatient Clinics in Vietnam...
53
Nutritional Status of Adults with HIV in Outpatient Clinics in Vietnam Assessment Report National Institute of Nutrition May 2014
Transcript of Nutritional Status of Adults with HIV in Outpatient ... MAM...in Outpatient Clinics in Vietnam...

1
Nutritional Status of Adults with HIV
in Outpatient Clinics in Vietnam
Assessment Report
National Institute of Nutrition
May 2014
i
This report is made possible by the generous support of the American people through the support of
the Office of Health, Infectious Diseases, and Nutrition, Bureau for Global Health, U.S. Agency for
International Development (USAID) and USAID/Vietnam, under terms of Cooperative Agreement No.
AID-OAA-A-12-00005, through the Food and Nutrition Technical Assistance III Project (FANTA),
managed by FHI 360.
The contents are the responsibility of FHI 360 and do not necessarily reflect the views of USAID or
the United States Government.
Contact Information
National Institute of Nutrition 48B Tang Bat Ho Street, Hanoi, Vietnam Tel: (84-4) 39713784, (84-4) 39717090 Fax: (84-4) 39717885 Email: [email protected]; [email protected] Website: http://www.nutrition.org.vn
ii
CONTENTS
LIST OF TABLES AND FIGURES ........................................................................................................................................... iii
ABBREVIATIONS AND ACRONYMS ..................................................................................................................................iv
ACKNOWLEDGMENTS ........................................................................................................................................................ v
EXECUTIVE SUMMARY ....................................................................................................................................................... 1
1. BACKGROUND ................................................................................................................................................................ 1
2. METHODOLOGY ............................................................................................................................................................. 2
2.1. Questionnaire Design, Training and Data Collection .................................................... 3
2.2. Sampling ........................................................................................................................ 3
2.3. Data Collection Methods and Tools .............................................................................. 6
2.4. Data Analysis ................................................................................................................. 7
2.5. Ethical Considerations................................................................................................... 7
3. FINDINGS.......................................................................................................................................................................... 9
3.1. Sample Characteristics .................................................................................................. 9
3.2. Clinical and Sub-clinical Signs...................................................................................... 10
3.3. Anthropometric Measurements and Nutritional Status ............................................ 14
3.4. Dietary Intake .............................................................................................................. 21
4. DISCUSSION ................................................................................................................................................................... 29
4.1. Nutritional Status ........................................................................................................ 30
4.2. Dietary Intake .............................................................................................................. 31
4.3. Factors Affecting Nutritional Status ............................................................................ 32
5. CONCLUSIONS ............................................................................................................................................................... 34
6. RECOMMENDATIONS ................................................................................................................................................ 35
ANNEX 1. DATA COLLECTION FORM ............................................................................................................................. 36
ANNEX 2. OUTPATIENT CLINICS INVOLVED IN THE STUDY ...................................................................................... 41
ANNEX 3. INFORMED CONSENT FORM ........................................................................................................................ 43
ENDNOTES ........................................................................................................................................................................... 44

iii
LIST OF TABLES AND FIGURES
Table 1. General characteristics of the study participants ........................................................ 9
Table 2. CD4 counts of the study participants ......................................................................... 10
Table 3. WHO clinical staging of established HIV infection ..................................................... 11
Table 4. Distribution of clinical stage, ART and pre-ART group ............................................... 12
Table 5. Distribution of opportunistic infections among study participants by treatment
group ........................................................................................................................................ 13
Table 6. Mean height and weight of participants by age group .............................................. 14
Table 7. Nutritional status of participants by BMI ................................................................... 15
Table 8. Classification of nutritional status by age group........................................................ 15
Table 9. Comparison of mean weight and height by treatment group ................................... 16
Table 10. Classification of nutritional status in by treatment group and age group............... 17
Table 11. Nutritional status of participants by sex .................................................................. 19
Table 12. Nutritional status of participants by CD4 count ...................................................... 20
Table 13. Nutritional status of participants by clinical stage ................................................... 20
Table 14. Nutritional status of participants by presence of opportunistic infections and HIV-
related symptoms .................................................................................................................... 21
Table 15. Dietary characteristics of PLHIV ............................................................................... 22
Table 16. Nutritive values and dietary balance of participants’ dietary intake compared with
NIN RDAs (2012) ...................................................................................................................... 23
Table 17. Food frequency ........................................................................................................ 24
Table 18. Comparision of food intake between the ART and pre-ART groups ........................ 24
Table 19. Nutritive values of food intake of study groups by sex ........................................... 26
Table 20. Association between food intake and nutritional status of study participants ...... 27
Table 21. Association of food intake and clinical stages ......................................................... 28
Figure 1. Distribution of participants by clinical stage ............................................................ 11
Figure 2. Distribution of HIV-related symptoms among study participants ............................ 13
Figure 3. Comparison of nutritional status by treatment groups ............................................ 16
Figure 4. Severity of undernutrition by age group, ART group ............................................... 18
Figure 5. Severity of undernutrition by age group, pre-ART group ......................................... 18
Figure 6. Comparison of nutritional status of 2 treatment groups by sex .............................. 19

iv
ABBREVIATIONS AND ACRONYMS
AIDS Acquired Immune Deficiency Syndrome
ARV Antiretroviral drug
ART Antiretroviral therapy
BMI Body mass index
CED Chronic energy deficiency
FANTA Food and Nutrition Technical Assistance III Project
FAO Food and Agriculture Organization of the United Nations
HIV Human Immunodeficiency Virus
NIN National Institute of Nutrition, Vietnam
OI Opportunistic infection
OPC Outpatient clinic
RDA Recommended dietary allowance
SD Standard deviation
UNAIDS Joint United Nations Program on HIV/AIDS
USAID United States Agency for International Development
WHO World Health Organization
v
ACKNOWLEDGMENTS
The National Institute of Nutrition (NIN) would like to express its appreciation for the
financial support of the U.S. Agency for International Development (USAID)/Vietnam
through the FHI 360 Food and Nutrition Technical Assistance III Project (FANTA).
The following people contributed to or participated in the study of the prevalence of
malnutrition among pre-ART and ART patients in Vietnam:
Dr. Pham Thi Thuy Hoa, Former Director, Food and Nutrition Training Center, NIN,
Principal Investigator
Mai-Anh Hoang, Nutrition and HIV Specialist, FHI 360/FANTA, Co-investigator and
Technical Manager
Dr. Gaston Arnolda, consultant, study design
Dr. Huynh Nam Phuong, Deputy Director, Food and Nutrition Training Center, NIN,
Researcher
Nguyen Thi Van Anh, Food and Nutrition Training Center, NIN, Researcher
Dr. Tran Thanh Do, Deputy Head, Nutrition Surveillance and Policy, NIN, data analysis
Dr. Diana Stukel, Scientist, Survey Methods, FHI 360/FANTA, sampling
Wendy Hammond, Technical Officer, Nutrition and Infectious Diseases, FHI 360/FANTA
Finally, the authors would like to thank the many people living with HIV who graciously
agreed to participate in the study.

1
EXECUTIVE SUMMARY Vietnam had an estimated 260,000 people living with HIV in 2012 (UNAIDS 2012). Nutrition
assessment, counseling, and support are key components of care of people living with HIV
(PLHIV). HIV can cause or worsen malnutrition by increasing energy needs while reducing
appetite and nutrient absorption and utilization. Adequate diet or treatment of malnutrition
can help recover lost weight, strengthen immunity, manage symptoms, increase the
effectiveness of antiretroviral therapy (ART), and delay the progression of HIV to AIDS.
Few data have been available on the prevalence of acute malnutrition among PLHIV in
Vietnam to inform nutrition programming. In 2011 the National Institute of Nutrition (NIN),
with support from the FHI 360 Food and Nutrition Technical Assistance III Project (FANTA),
conducted an assessment of nutritional status, food consumption, and factors affecting
nutritional status among adult PLHIV in 29 outpatient clinics (OPCs) providing HIV services.
Methodology
The study used two-stage cluster sampling—probability proportional to size, with pre-
stratification by location (North/South) and funding source (Government of Vietnam/Global
Fund to Fight AIDS, Tuberculosis and Malaria/U.S. President’s Emergency Fund for AIDS
Relief [PEPFAR]). Participants included 3,912 male and non-pregnant/non-lactating female
PLHIV 18 years and older registered at OPCs who either had not initiated ART (1,776) or
were active ART patients (2,136). Thirty OPCs were selected for assessment of nutritional
status, and fifteen of these were selected for dietary intake assessment.
For the assessment of nutritional status (height and weight and body mass index [BMI]), 160
participants were selected in each OPC (40 males and 40 females on ART and 40 males and
40 females not on ART). For the dietary assessment, 150 participants (75 pre-ART and 75 on
ART) were selected for 24-hour dietary recall and 300 (150 pre-ART and 150 on ART) were
selected for administration of a food frequency questionnaire. OPC staff were trained to
administer the questionnaires, and NIN compared reported dietary intake with the 2012
recommended daily allowance (RDA) for Vietnamese adults and PLHIV.
Interview and anthropometric data were cleaned, coded, and double entered to minimize
data entry errors. Food data were converted to edible raw foods based on the NIN food
album. Food nutrition values were calculated using the 2007 Food Composition Table of
Vietnam. Epidata and Access were used for data entry and STATA for analysis. A common
statistical test (Anova, t-test, χ) was used where appropriate.
NIN and the FHI 360 Office of International Research Ethics reviewed and approved the
protocol for the study. Before the assessment, NIN and FANTA trained the data collectors in
research ethics. Informed consent was sought from all participants. Minimal identifiable

2
information was collected during the study to protect participants’ identity, and participants
were informed of potential risks and benefits.
Findings
Nutritional status was normal for 69.4 percent of the participants; 26.8 percent were
undernourished (18.4 percent mildly, 5.3 percent moderately, and 3.1 percent severely),
and 3.8 percent were overweight or obese. The prevalence of undernutrition was highest in
participants 20–29 years (29.2 percent) and the second highest in participants 50 years and
older (27.6 percent), although the latter had the highest prevalence of severe acute
malnutrition (SAM) (6.6 percent). Rates of undernutrition and overnutrition did not differ
significantly between males and females or by treatment group. The prevalence of
undernutrition among the participants was higher than that reported among Vietnamese
adults in the National Nutrition Survey 2009–2010.
In general, reported food consumption did not meet the NIN RDA. Participants with CD4
count <200 had the highest rate of undernutrition (34.3 percent, with 4.5 percent severely
undernourished). Patients at Stage 4 of HIV disease had a higher total undernutrition rate
(33.8 percent) and rate of SAM (8.9) than those at earlier stages.
Recommendations
1. Integrate nutrition assessment, counseling, and support into routine OPC care and
treatment to prevent and manage malnutrition in this vulnerable population group.
Support should include specialized food products (ready-to-use therapeutic food for
treatment of SAM and fortified-blended food for treatment of moderate malnutrition
and prevention of SAM) prescribed for a limited duration, with clear eligibility and exit
criteria based on anthropometric measurement.
2. Focus nutrition counseling for ART patients on eating a balanced diet with adequate
energy and micronutrients.
3. Prioritize OPC patients less than 25 years old and 50 years and older for nutrition
assessment, counseling, and support.
4. Formulate and enforce a strategic government policy to ensure equitable access to food
support for groups vulnerable to food insecurity, including PLHIV.

1
1. BACKGROUND
HIV not only affects the health and economic status of individuals but also has economic,
educational, and social impacts on countries over the long term. Despite intense global
efforts and evidence of decreasing prevalence in many countries, an estimated 35.3 million
people were living with HIV in 2012.1
According to UNAIDS, Vietnam had an estimated 260,000 people living with HIV (PLHIV) in
2012.2 A reported 48,368 people have died of AIDS. Ho Chi Minh City has the highest
population of PLHIV, accounting for 23 percent of the total.3
Nutrition assessment, counseling, and support are key components of the comprehensive
care of people living with HIV (PLHIV). HIV infection can cause or worsen malnutrition by
increasing energy needs while at the same time HIV-related symptoms and antiretroviral
therapy (ART) side effects decrease appetite, as well as reducing the body’s ability to absorb
and utilize nutrients. Weakened immunity leaves PLHIV susceptible to opportunistic
infections that further deplete nutrient stores. Adequate and balanced food intake or
treatment of malnutrition with specialized therapeutic food products are needed to recover
lost weight, strengthen the immune system, manage HIV-related symptoms, increase the
effectiveness of treatment, and prolong the progression of HIV infection to AIDS.3,4
In Vietnam, few donors support nutrition interventions for PLHIV, and such services are not
routinely provided in outpatient clinics (OPCs) that provide ART. Although U.S. President’s
Emergency Fund for AIDS Relief (PEPFAR) implementing partners in Vietnam report high
levels of malnutrition among OPC patients, the lack of systematic nutrition assessment as
part of routine care and treatment means that few data have been available on the
prevalence of acute malnutrition among PLHIV. Studies of nutrition knowledge and dietary
practices of PLHIV have been mainly qualitative and among small populations.5, 6, 7, 8 In order
to inform nutrition programming and counseling for PLHIV and procurement of specialized
food products to treat malnutrition, evidence was needed on the nutritional status and food
intake of this population.
Since 2009 USAID/Vietnam has funded the Food and Nutrition Technical Assistance III
Project (FANTA), managed by FHI 360, to work with the Vietnam Administration of HIV/AIDS
Control (VAAC), the National Institute of Nutrition (NIN), and PEPFAR/Vietnam partners to
strengthen nutrition programming for PLHIV and orphans and vulnerable children (OVC). In
2011 FANTA supported NIN in conducting a study of the prevalence of severe and moderate
malnutrition among adult pre-ART and ART patients in 29 OPCs.
2
Objectives
1. To assess nutritional status and food consumption among non-pregnant/postpartum
pre-ART and ART patients registered in OPCs
2. To explore factors affecting the nutritional status of PLHIV
2. METHODOLOGY
The study questions are listed below.
A. What is the point prevalence of severe acute malnutrition (SAM, defined as BMI <
16) and moderate malnutrition (defined as BMI 16.0–18.49) in adult non-
pregnant/post-partum PLHIV receiving ART at OPCs in Vietnam?
B. What is the point prevalence of severe acute malnutrition (SAM); defined as BMI <
16) and moderate acute malnutrition (MAM; defined as BMI 16-18.49) in adult non-
pregnant PLHIV registered at OPCs in Vietnam, but who have not yet initiated ART?
C. What are the average food consumption patterns and intake of adult PLHIV
attending ART clinics, both pre-ART and ART?
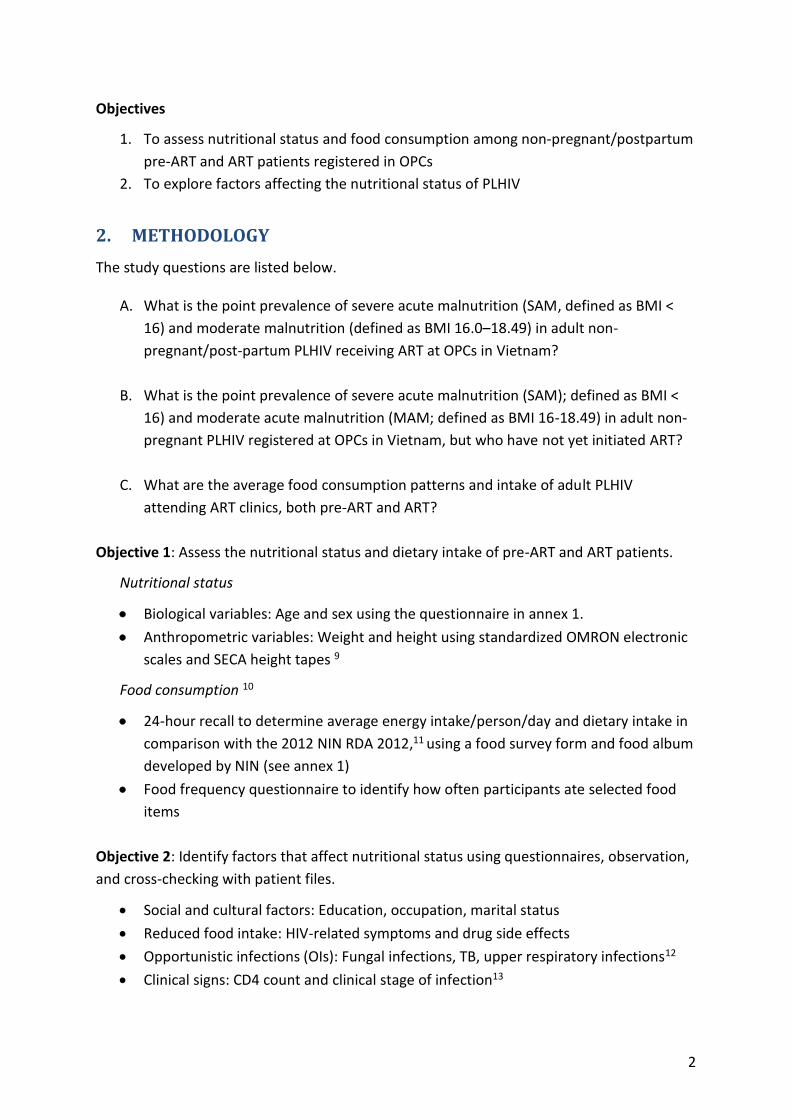
Objective 1: Assess the nutritional status and dietary intake of pre-ART and ART patients.
Nutritional status
Biological variables: Age and sex using the questionnaire in annex 1.
Anthropometric variables: Weight and height using standardized OMRON electronic
scales and SECA height tapes 9
Food consumption 10
24-hour recall to determine average energy intake/person/day and dietary intake in
comparison with the 2012 NIN RDA 2012,11 using a food survey form and food album
developed by NIN (see annex 1)
Food frequency questionnaire to identify how often participants ate selected food
items
Objective 2: Identify factors that affect nutritional status using questionnaires, observation,
and cross-checking with patient files.
Social and cultural factors: Education, occupation, marital status
Reduced food intake: HIV-related symptoms and drug side effects
Opportunistic infections (OIs): Fungal infections, TB, upper respiratory infections12
Clinical signs: CD4 count and clinical stage of infection13

3
The study population was adult non-pregnant/post-partum PLHIV registered for ART at
OPCs in Vietnam.
Data for the study were collected in 29 OPCs between August and November 2011 (annex
2). One OPC in Ho Chi Minh City dropped out of the assessment because of a lack of staff to
assist with data collection. The criterion for inclusion of OPCs in the assessment was at least
75 active ART patients as of 30 June 2010.
The study used a two-stage cluster sample survey—probability proportional to size, with
pre-stratification by two variables plausibly associated with malnutrition rates: geographical
location (North/South) and funding source (Government of Vietnam [GOV}/Global Fund to
Fight AIDS, Tuberculosis and Malaria [GFATM]/U.S. President’s Emergency Fund for AIDs
Relief [PEPFAR]).
2.1. Questionnaire Design, Training and Data Collection
Data collection forms for anthropometric and dietary assessments (see annex 1) were
prepared separately for each OPC, with clear identifiers. NIN and FANTA trained supervisors
in the study objectives, research ethics, and methods for the anthropometric and dietary
assessments. NAN and FANTA then trained two data collectors from each participating OPC
in the study objectives and anthropometric measurement in two courses, one in Hanoi and
another in Ho Chi Minh City. NIN staff were trained to administer the 24-hour recall and
food frequency questionnaires. NIN and FANTA made site visits to Than Ha in the north and
Ben Tre in the south in November 2011 to supervise the assessments.
2.2. Sampling
In this two stage cluster-sample survey, the primary sampling units were randomly selected
clusters from OPCs pre-stratified by region (north, south) and funding source (GOV, GFATM,
PEPFAR). The secondary sampling units were all PLHIV in the OPCs (those on ART and not
yet on ART), and a simple random sample of these individuals
Inclusion criteria
All non-pregnant adult PLHIV (18 years and over) registered at the OPCs who had not yet initiated ART
All non-pregnant adults (18 years and over) who had initiated ART at an OPC and had not died, transferred, or been lost to follow-up (active patients).
Exclusion criteria
OPCs with fewer than 75 active ART patients were excluded from the study for
logistical reasons. At the time of the study, 285 OPCs were providing ART, but 155 of

4
these (54 percent) supported fewer than 75 active ART patients. These ‘smaller’
OPCs, however, only provide services to 9.5% of the PLHIV receiving ART at OPCs
(3,948 of the 41,546 PLHIV as of 30 June 2010). To reduce the administrative load for
the study team, it was agreed to limit the size of OPCs to be included to those with at
least 75 active ART patients as at 30 June 2010.
OPCs and participants that did not meet the above criteria and were not willing to
attend the study or comply with the technical requirements of the study were also
excluded.
2.2.1. Sample size
Stage 1: Primary sampling units (OPCs): A sample of 30 clusters (OPCs) 14 was
selected for assessment of nutritional status, of which 15 were selected to collect
additional dietary intake data.
Stage 2: Selection of study participants
– Assessment of nutritional status: In each OPC, 160 participants were selected, of
whom 80 (40 males and 40 females) were on ART and 80 (40 males and 40
females) were not on ART.
– 24-hour dietary recall: In 15 selected OPCs, 150 participants were selected, of
whom 75 were on ART and 75 were not, based on the sampling method of
Beaton (1979) with a confidence interval (CI) of 95 percent and individual
variation of energy intake of 10 percent.15
– Food frequency questionnaire: In 15 selected OPCs, 300 participants were
selected, 20 participants in each OPC, or whom 10 were on ART and 10 were not
on ART.
2.2.2. Sampling method
Selection of OPCs
– Assessment of nutritional status: selection of 30 OPCs. The sampling frame for
primary sampling units (OPCs) was a list of all OPCs in Vietnam with 75 or more
active ART patients. Sampling was with replacement—a single OPC could be
selected more than once. Application of this method could therefore have meant
that the number of OPCs ultimately selected would be smaller than the number
of ‘clusters’ specified in the sample size calculation, as large OPCs could
contribute two or more clusters. To avoid including large OPCs several times by
chance, a restriction was placed on the maximum number of times each OPC
could be selected.
5
While VAAC has information on the number of PLHIV on ART, it does not have
information on those registered who are not on ART (pre-ART). Thus the
selection of OPCs was based solely on the number of PLHIV receiving ART. The
selected OPCs were used for the sampling of both target groups: PLHIV on ART
and PLHIV registered at the OPC but not yet receiving ART. The 30 OPCs selected
were ordered by client size within each stratum.
The selection of OPCs from the sampling frame was by probability proportional
to size (PPS), performed in SAS 9.1 using the SURVEYSELECT procedure with a
randomly chosen seed.
– Food consumption surveys. A sub-set of OPCs from the first-phase of sampling
was sampled for the 24-hour recall and food frequency questionnaires. To
identify the OPCs to be sampled for the dietary assessment component of the
study, every other OPC per strata was taken (half the OPCs per strata that were
selected at the first phase), giving 15 of the 30 sampled OPCs.
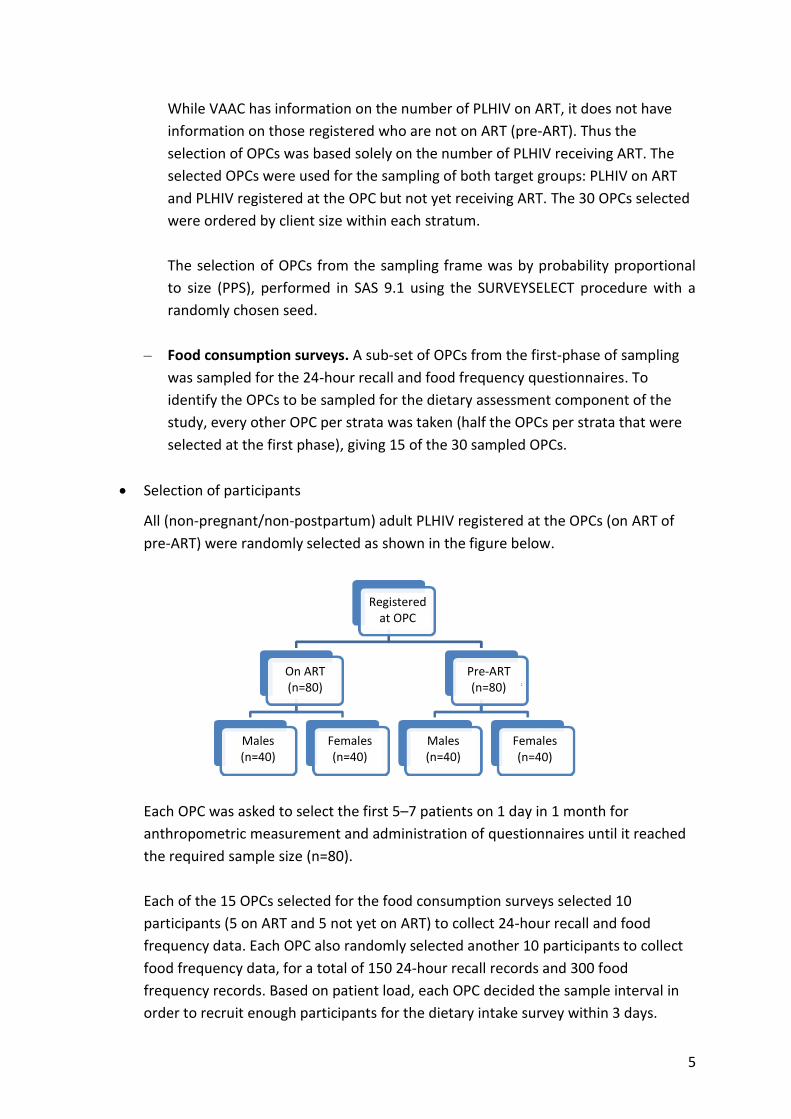
Selection of participants
All (non-pregnant/non-postpartum) adult PLHIV registered at the OPCs (on ART of
pre-ART) were randomly selected as shown in the figure below.
Each OPC was asked to select the first 5–7 patients on 1 day in 1 month for
anthropometric measurement and administration of questionnaires until it reached
the required sample size (n=80).
Each of the 15 OPCs selected for the food consumption surveys selected 10
participants (5 on ART and 5 not yet on ART) to collect 24-hour recall and food
frequency data. Each OPC also randomly selected another 10 participants to collect
food frequency data, for a total of 150 24-hour recall records and 300 food
frequency records. Based on patient load, each OPC decided the sample interval in
order to recruit enough participants for the dietary intake survey within 3 days.
Registered at OPC
On ART (n=80)
Pre-ART (n=80)
Males (n=40)
Females (n=40)
Males (n=40)
Females (n=40)

6
2.3. Data Collection Methods and Tools
2.3.1. Anthropometric measurement16, 17
Staff at each OPC were trained to collect anthropometric data using standardized
equipment provided by the study.
Weight was measured using OMRON electronic scales with the precision of 100 g.
The scales were checked and adjusted before and during use. They were placed on a
hard surface and calibrated to zero. Participants were asked to remove extraneous
clothing and stand with body weight evenly distributed between both feet. An
average weight of clothes was subtracted from the result. Weight was recorded to
the nearest 0.1 kg.
Height was measured using stadiometers with the precision of 0.1 cm. Height rules
were taped vertically to hard, flat wall surfaces with the bases at floor level.
Participants were asked to remove shoes and hair ornaments and to stand with their
backs to the height rules and feet together, with the backs of their heads, backs,
buttocks, calves, and heels touching the upright, and to look straight ahead. The
head pieces of the stadiometers or the sliding parts of the measuring rods were
lowered so that hair was pressed flat. Height was recorded to the nearest 0.1 cm.
Body mass index (BMI) was calculated using the formula weight (kg)/height (m)2.
Data collectors classified nutritional status using the 2005 WHO BMI cutoffs (table 1).
Classification BMI
Malnutrition < 18.50
Severe acute malnutrition (SAM) < 16.00
Moderate malnutrition 16.00–16.99
Mild malnutrition 17.00–18.49
Normal nutritional status 18.50–24.99
Overweight ≥ 25.00
Pre-obesity 25.00–29.99
Obesity ≥ 30.00
Source: WHO. 1999. Management of Severe Malnutrition: A Manual For Physicians and Other Senior Health Workers. Geneva: WHO.

7
2.3.2. Dietary assessment (see annex 1)18, 19, 20
24-hour recall was used to collect data on participants’ food intake during the
previous 24 hours, including drinks and snacks, and quantities of food consumed.
NIN used the same standard methods and measurements that are used during
Annual National Nutrition Surveys. Data collectors took to each OPC a set of
measuring utensils and pictures of different quantities (e.g., bowls, spoons, cups), as
well as a conversion table for measurements.
Food frequency questionaires were used to ask about food items eaten the previous
day, week, and month or never eaten.
Questionnaires on nutrition-related factors were administered to collect data on
individual/family characteristics and factors influencing health and nutrition status.
Reported dietary intake was compared with the recommended daily allowance (RDA) for
Vietnamese adults and PLHIV issued by NIN in 2012.21
Statistical tests (Anova, t-test, and X2) for significance (p<0.05) were used to describe the
association between nutritional status and food consumption and relevant factors (e.g.,
clinical/sub-clinical signs).22, 23
2.4. Data Analysis
Interview and anthropometric data were cleaned, coded, and double entered to minimize
data entry errors. Food data were converted to edible raw foods based on the NIN food
album. Food nutrition values were calculated using the 2007 Food Composition Table of
Vietnam.24 Epidata and Access were used for data entry and STATA for analysis.
2.5. Ethical Considerations
NIN and the FHI 360 Office of International Research Ethics reviewed and approved the
protocol for the study. Before the assessment, NIN and FANTA trained all data collectors in
research ethics. Informed consent was sought from all participants. OPC directors provided
consent to conduct nutrition assessment and interviews. The data collectors sought verbal
informed consent from all patients who participated in the interviews and assessment. All
interviews were conducted with adults 18 years or older. Minimal identifiable information
was collected during the study to protect the identity of participants. Participants were
informed of potential risks and benefits.
Potential risks
Minimal risk. Measurements of weight and height were normal procedures in OPCs.

8
Potential benefits
Study findings could help advocate for nutrition care and treatment of PLHIV.
Study findings would inform national nutrition and HIV guidelines, counseling
materials, and job aids.
Informed consent was requested from each study participant using the form in Annex 3. The
researchers provided information to participants in a manner that was understandable. The
researchers did not enroll anyone who they were not confident comprehended all
information disclosed and who did not agree to procedures described during the informed
consent process. All measures to ensure confidentiality of information were taken. Data
were in a locked cabinet and only investigators had access.

9
3. FINDINGS
This section summarizes the results of the study of nutritional status and dietary intake
among adult PLHIV in Vietnam. The source of the findings (the specific component) is
indicated in each section.
3.1. Sample Characteristics
The study recruited 3,912 non-pregnant, non-lactating adult PLHIV, of whom 2,136 were on
ART and 1,776 were not yet on ART and 2,311 were male and 1,601 were female. All the
participants were registered in 29 OPCs1 in Vietnam. Table 1 lists the general characteristics
of the study participants.
Table 1 shows that most (53.4 percent) of the participants were between 30 and 39 years
old, 31.1 percent were between 20 and 29 years old, and the mean age of the participants
was 33.3. Most participants (47.5 percent) had studied only through middle school, 33.9
percent had completed high school, and 16.8 percent had completed only primary school.
The smallest group was university students (0.4 percent). Most of the participants (22.2
percent) were farmers, 14.1 percent were small traders, 13.1 percent were laborers, and
13.7 percent were unemployed. Only 9.3 percent were housewives, 2.6 percent were
government workers, and 0.9 percent were teachers. Most of the participants (56.9
percent) were married, 22.4 percent were single, 10.2 percent were widowed, 6/2 percent
were divorced or separated, and 3.7 percent were living with partners. Three times more
participants lived with families than those who lived alone. These characteristics did not
differ much between the ART and pre-ART groups.
Table 1. General characteristics of the study participants
Characteristics Total ART Pre-ART
n % n % n %
Age
20–29 1,216 31.1 522 24.4 694 39.1
30–39 2,087 53.4 1227 57.4 860 48.4
40–49 486 12.4 307 14.4 179 10.1
≥ 50 123 3.1 80 3.8 43 2.4
Total 3,912 100.0 2,136 100.0 1,776 100.0
Mean age 33.3±6.9 34.3±6.8 32.1±6.8
Education
No schooling 56 1.4 31 1.5 25 1.4
1 One OPC in Ho Chi Minh City dropped out of the study because it did not have enough staff to conduct data collection.

10
Characteristics Total ART Pre-ART
n % n % n %
Primary school (1–5 years) 652 16.8 352 16.6 300 17.0
Middle school (6–9 years) 1,845 47.5 1,023 48.2 822 46.7
High school (10–12 years) 1,315 33.9 708 33.4 607 34.5
Undergraduate 17 0.4 9 0.4 8 0.5
Occupation
Farmer
Government worker
Teacher
Businessperson
Laborer
Housewife
Other
Unemployed
868
100
36
550
512
364
947
535
22.2
2.6
0.9
14.1
13.1
9.3
24.2
13.7
461
55
16
282
284
193
542
303
21.6
2.6
0.8
13.2
13.3
9.0
25.4
14.2
407
45
20
268
228
171
405
232
22.9
2.5
1.1
15.1
12.8
9.6
22.8
13.1
Marital status
Single
Married
Living with partner
Divorced/separated
Widowed
Other
875
2,222
144
241
398
24
22.4
56.9
3.7
6.2
10.2
0.6
486
1,155
80
143
256
13
22.8
54.2
3.8
6.7
12.0
0.6
389
1,067
64
98
142
11
22.0
60.3
3.6
5.5
8.0
0.6
3.2. Clinical and Sub-clinical Signs
CD4+ T-cell level is an important criterion for categorizing HIV-related clinical conditions and
for initiation of antiretroviral therapy (ART) and prophylaxis for opportunistic infections
(OIs) among PLHIV. In 2013 WHO recommended raising the CD4 threshold for initiating ART
from 350 to 500 cell/mm3. Table 2 shows that 46.8 percent of the participants had CD4
counts between 200 and 500, 24.3 percent had CD4 counts < 200, and 19.9 percent had CD4
counts > 500. There was a significant difference between the ART and pre-ART groups in
CD4 counts < 200 (29.8 percent in the ART group and 17.6 percent in the pre-ART group,
p<0.001).
Table 2. CD4 counts of the study participants
CD4 count
Total ART Pre-ART
n % n % n %
No test/no results 354 9.1 54 2.5 300 16.9

11
< 200 950 24.3 637 29.8** 313 17.6**
200–500 1,829 46.8 1,059 49.6* 770 43.4*
> 500 779 19.9 386 18.1 393 22.1
Total 3,912 100 2,136 100 1,776 100
*p<0.01. **p<0.001
Once HIV infection is confirmed by testing, clinical staging is used to monitor progression of
the disease. Clinical staging is useful at first diagnosis, or entry into long-term HIV care and
in the follow-up of patients in care and treatment. It is used to guide decisions when to start
Cotrimoxazole prophylaxis and other HIV-related interventions, including ART. Table 3
shows the WHO clinical stages of HIV infection. 25
Table 3. WHO clinical staging of established HIV infection
HIV-associated symptoms
Clinical stage
Asymptomatic 1
Mild symptoms 2
Advanced symptoms 3
Severe symptoms 4
Source: WHO. 2007. WHO Case Definitions of HIV for Surveillance
and Revised Clinical Staging and Immunological Classification of
HIV-Related Disease in Adults and Children. Geneva: WHO
Figure 1 shows that 59 percent of the participants were at clinical stage 1, 15 percent were
at stage 2, 16 percent were at stage 3, and 10 percent were at stage 4.
Figure 1. Distribution of participants by clinical stage
12
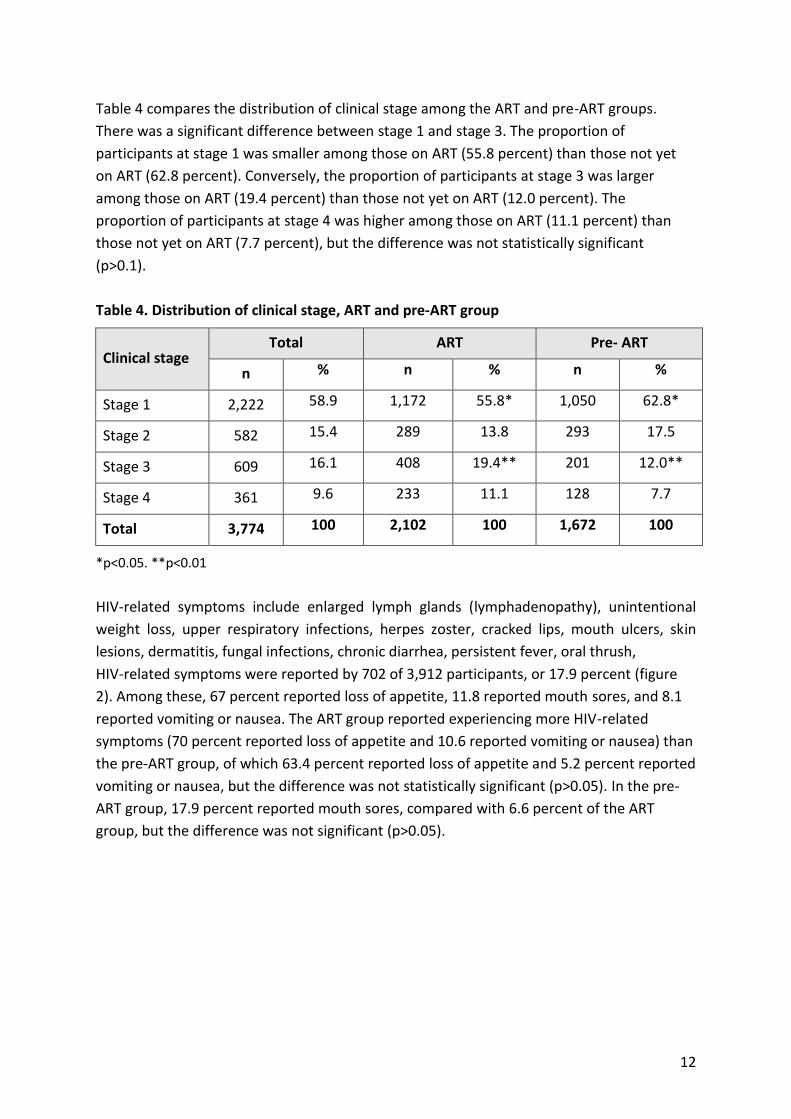
Table 4 compares the distribution of clinical stage among the ART and pre-ART groups.
There was a significant difference between stage 1 and stage 3. The proportion of
participants at stage 1 was smaller among those on ART (55.8 percent) than those not yet
on ART (62.8 percent). Conversely, the proportion of participants at stage 3 was larger
among those on ART (19.4 percent) than those not yet on ART (12.0 percent). The
proportion of participants at stage 4 was higher among those on ART (11.1 percent) than
those not yet on ART (7.7 percent), but the difference was not statistically significant
(p>0.1).
Table 4. Distribution of clinical stage, ART and pre-ART group
Clinical stage Total ART Pre- ART
n % n % n %
Stage 1 2,222 58.9 1,172 55.8* 1,050 62.8*
Stage 2 582 15.4 289 13.8 293 17.5
Stage 3 609 16.1 408 19.4** 201 12.0**
Stage 4 361 9.6 233 11.1 128 7.7
Total 3,774 100 2,102 100 1,672 100
*p<0.05. **p<0.01
HIV-related symptoms include enlarged lymph glands (lymphadenopathy), unintentional
weight loss, upper respiratory infections, herpes zoster, cracked lips, mouth ulcers, skin
lesions, dermatitis, fungal infections, chronic diarrhea, persistent fever, oral thrush,
HIV-related symptoms were reported by 702 of 3,912 participants, or 17.9 percent (figure
2). Among these, 67 percent reported loss of appetite, 11.8 reported mouth sores, and 8.1
reported vomiting or nausea. The ART group reported experiencing more HIV-related
symptoms (70 percent reported loss of appetite and 10.6 reported vomiting or nausea) than
the pre-ART group, of which 63.4 percent reported loss of appetite and 5.2 percent reported
vomiting or nausea, but the difference was not statistically significant (p>0.05). In the pre-
ART group, 17.9 percent reported mouth sores, compared with 6.6 percent of the ART
group, but the difference was not significant (p>0.05).

13
Figure 2. Distribution of HIV-related symptoms among study participants
People with advanced HIV infection are vulnerable to infections and malignancies that are
called “opportunistic” because they take advantage of the weakened immune system. The
most common HIV-related opportunistic infections (OIs) are bacterial infections
(tuberculosis[TB], bacterial pneumonia, blood poisoning), protozoan diseases (e.g.,
toxoplasmosis), fungal diseases (e.g., oral thrush), viral diseases (e.g., herpes), and cancer
(Kaposi’s sarcoma, lymphoma, and squamous cell carcinoma).
Table 5 shows that 24.21 percent of the participants (945 out of 3,912) reported OIs. There
was no difference between the ART and pre-ART groups. TB was the most commonly
reported OI (4.4 percent), followed by respiratory infections (3.4 percent), oral thrush (2.9
percent), and combined OIs (2.2 percent). The distribution of OIs in the ART and pre-ART
groups was similar (p>0.05).
Table 5. Distribution of opportunistic infections among study participants by treatment
group
Opportunistic infection Total ART Pre-ART
n % n % n %
Oral thrush 114 2.9 46 2.2 68 3.8
TB 172 4.4 105 4.9 67 3.8
Upper respiratory
infections 131 3.4 73 3.4 58 3.3
Penicillin 9 0.2 7 0.3 2 0.1

14
Opportunistic infection Total ART Pre-ART
n % n % n %
Other (hepatitis, mouth
ulcers) 492 12.6 279 13.1 213 12.0
More than two OIs 86 2.2 51 2.4 35 2.0
Opportunistic infection
Total with OIs 945 24.2 513 24.0 432 24.3
Total without OIs or
unaware of any OIs 2,967 75.8 1,623 76.0 1,344 75.7
Total 3,912 2,136 1,776
3.3. Anthropometric Measurements and Nutritional Status
Table 6 shows that the mean height of the participants was 160.1 ± 7.8 cm and the mean
weight was 51.5 ± 8.0 kg. The participants in the 40–49 year age group had the highest
mean weight (52.5 kg), followed by the 30–39 year age group (52.0 kg), and the participants
in the 20–29 year age group had the lowest mean weight (50.2 kg). The difference between
the 30–39 year and 40–49 year age groups and the 20–29 year age group was statistically
significant (p<0.001). The mean height of the 30–39 year and 40–49 year age groups was
similar and significantly higher than that of the 20–29 year and over 50-year age groups
(p<0.01).
Table 6. Mean height and weight of participants by age group
Age group n Weight (kg) mean ± SD Height (cm) mean ± SD
20–29 1,216 50.2 ± 7.9 158.9 ± 7.9
30–39 2,087 52.0 ± 7.9 160.7 ± 7.9
40–49 486 52.5 ± 7.8 160.7 ± 7.7
≥ 50 123 51.4 ± 9.5 158.3 ± 8.2
Total 3,912 51.5 ± 8.0 160.1 ± 7.8
Table 7 shows that 69.4 percent of the participants had normal nutritional status, 26.8
percent were undernourished (18.4 percent mildly, 5.3 percent moderately, and 3.1 percent
severely), and 3.8 percent were overweight or obese. The mean BMI of the participants was
20.1.

15
Table 7. Nutritional status of participants by BMI
Nutritional status n Prevalence (%)
Overweight/obese 149 3.8
Normal 2,715 69.4
Undernourished (total) 1,048 26.8
Mildly 719 18.4
Moderately 208 5.3
Severely 121 3.1
Mean BMI 20.1 ± 2.5
Total 3912
Table 8 shows the nutritional status of the participants by age group. The highest rates of
undernutrition were found in participants 20–29 years old (29.2 percent), followed by
participants over 50 years old (27.6 percent), participants 30–39 years old (26.5 percent),
and participants 40–49 years old (22.0 percent). The highest rates of overnutrition were
found in participants over 50 years old (8.1 percent), followed by those 30–39 years old (3.0
percent) and those 40–49 years old (4.0 percent).
Table 8. Classification of nutritional status by age group
Nutritional
status
Age group
Malnourished Normal Overweight/obese
n % n % n %
20–29 years (n=1,216) 355 29.2 824 67.8 37 3.0
30 –39 years (n=2,087) 552 26.5 1452 69.6 83 4.0
40–49 years (n=486) 107 22.0 360 74.1 19 3.9
≥ 50 years (n=123) 34 27.6 79 64.2 10 8.1
Total (n=3,912) 1,048 26.8 2,715 69.4 149 3.8
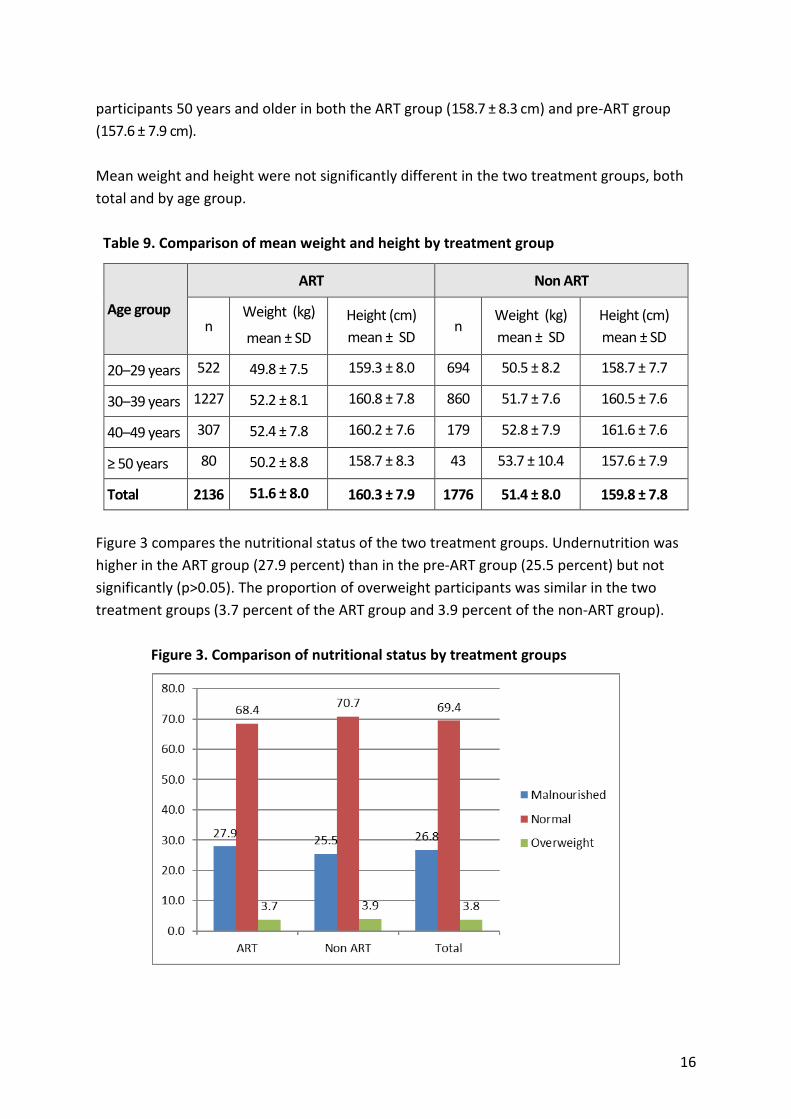
Table 9 shows the mean weight and height of the ART and pre-ART groups. ART participants
40-49 years old (52.4 ± 7.8 kg) and 30–39 years old (52.2 ± 8.1 kg) and pre-ART participants 50
years and older (53.7 ± 10.4 kg) had the highest mean weight. The lowest mean weight was
found in participants 20–29 years old (49.8 ± 7.5 kg in the ART group and 50.5 ± 8.2 kg in the pre-
ART group). The difference was significant (p<0.001).
The highest mean height was found in ART participants 30–39 years old (160.8 ± 7.8 cm) and
pre-ART participants 40–49 years old (161.6 ± 7.6 cm). The lowest mean height was found in
16
participants 50 years and older in both the ART group (158.7 ± 8.3 cm) and pre-ART group
(157.6 ± 7.9 cm).
Mean weight and height were not significantly different in the two treatment groups, both
total and by age group.
Table 9. Comparison of mean weight and height by treatment group
Age group
ART Non ART
n Weight (kg)
mean ± SD
Height (cm)
mean ± SD n
Weight (kg)
mean ± SD
Height (cm)
mean ± SD
20–29 years 522 49.8 ± 7.5 159.3 ± 8.0 694 50.5 ± 8.2 158.7 ± 7.7
30–39 years 1227 52.2 ± 8.1 160.8 ± 7.8 860 51.7 ± 7.6 160.5 ± 7.6
40–49 years 307 52.4 ± 7.8 160.2 ± 7.6 179 52.8 ± 7.9 161.6 ± 7.6
≥ 50 years 80 50.2 ± 8.8 158.7 ± 8.3 43 53.7 ± 10.4 157.6 ± 7.9
Total 2136 51.6 ± 8.0 160.3 ± 7.9 1776 51.4 ± 8.0 159.8 ± 7.8
Figure 3 compares the nutritional status of the two treatment groups. Undernutrition was
higher in the ART group (27.9 percent) than in the pre-ART group (25.5 percent) but not
significantly (p>0.05). The proportion of overweight participants was similar in the two
treatment groups (3.7 percent of the ART group and 3.9 percent of the non-ART group).
Figure 3. Comparison of nutritional status by treatment groups

17
Table 10 compares the nutritional status of the two treatment groups by age group. The
rate of undernutrition was highest among participants 50 years and older in the ART group
(32.5 percent) and participants 20-29 years old in the pre-ART group (27.1 percent),
followed by participants 20–29 years old in the ART group (32.0 percent) and participants
30–39 years old in the pre-ART group (25.4 percent). The lowest rate of undernutrition was
found in participants 40–49 years old in the ART group (22.5 percent) and participants 50
years and older in the pre-ART group (18.6 percent). In the ART group, participants 50 years
and older in the ART group had the highest rate of overweight (5.0 percent) and participants
20–29 years old had the lowest (1.9 percent). In the pre-ART group, the highest rate of
overweight was found in participants 50 years and older (14.0 percent) and the lowest rate
in participants 40–49 years old (3.4 percent). In general, underweight was more common in
the younger groups and overweight was more common in the older groups.
Table 10. Classification of nutritional status in by treatment group and age group
Nutritional
status
ART Non ART
Undernourished Normal Overnourished Undernourished Normal Overnourishe
d
Age group n % n % n % n % n % n %
20–29 years
(n=1,216) 167 32.0 345 66.1 10 1.9 188 27.1 479 69.0 27 3.9
30–39 years
(n=2,087) 334 27.2 840 68.5 53 4.3 218 25.4 612 71.2 30 3.5
40–49 years
(n=486) 69 22.5 225 73.3 13 4.2 38 21.2 135 75.4 6 3.4
≥ 50
years(n=123) 26 32.5 50 62.5 4 5.0 8 18.6 29 67.4 6 14.0
Total
(n=3,912) 596 27.9 1460 68.4 80 3.7 452 25.5 1255 70.7 69 3.9
Figures 4 and 5 show the severity of undernutrition in the ART and pre-ART groups (in
general and by age group). In the ART group, 19.8 percent of participants were mildly
undernourished, 5.1 percent were moderately undernourished, and 2.9 percent were
severely undernourished (figure 4). The rate of severe acute malnutrition (SAM) was highest
in participants 50 years and older (6.4 percent), followed by those 20–29 years old (4.5.
percent), and lowest in participants 40–49 years old (1.6. percent).

18
Figure 4. Severity of undernutrition by age group, ART group
In the pre-ART group, 16.8 percent were mildly undernourished, 5.3 percent were
moderately undernourished, and 3.4 percent were severely undernourished (figure 5). The
rate of SAM was highest in participants 50 years and older (7.0 percent), followed by those
20–29 years old (3.7 percent), and lowest in those 30–39 years old (2.8 percent).
Figure 5. Severity of undernutrition by age group, pre-ART group
Table 11 compares the nutritional status of male and female participants. Rates of
undernutrition and overweight did not differ between males and females (p>0.05).

19
Table 11. Nutritional status of participants by sex
Nutritional status Male Female
n % n %
Undernourished 624 27.0 424 26.5
Normal 1599 69.2 1116 69.7
Overweight/obese 88 3.8 61 3.8
Total 2311 100.0 1601 100.0
Figure 6 compares the nutritional status of males and females in each treatment group. No
difference was found between the two sexes or the two treatment groups.
Figure 6. Comparison of nutritional status of 2 treatment groups by sex
Table 12 shows the nutritional status of the participants by CD4 count. Participants with CD4
< 200 had the highest rates of undernutrition in general (34.3 percent) and SAM (4.5
percent). Those with CD4 > 500 had the lowest rates of undernutrition (22.3 percent, with
2.2 percent SAM), but the difference from those with CD-4 200–500 was not significant
(p>0.05).

20
Table 12. Nutritional status of participants by CD4 count
Undernourished Normal Overweight
CD4 count Total Mild Moderate Severe
No test/don’t know 28.8 18.1 5.7 5.1 69.2 2.0
< 200 34.3 a.b 22.5 c.d 7.3 e.f 4.5 g.h 62.8 2.8
200–500 24.4 a 17.2 c 4.8 e 2.4 g 71.2 4.4
> 500 22.3 b 16.2 d 4.0 f 2.2 h 73.3 4.4
p a,b<0.001 c,d<0.001 e,f<0.001 g,h<0.01
Table 13 shows the nutritional status of the participants by clinical stage. Rates of
undernutrition (total and SAM) increased by clinical stage and were highest in participants
at stage 4 (33.8 percent total undernutrition and 8.9 percent SAM). There were significant
differences in total, mild, and moderate undernutrition between stage 1 and the other
stages, but no difference was found among stages 2, 3, and 4. SAM was highest at stage 4
and significantly different from stage 3.
Table 13. Nutritional status of participants by clinical stage
Clinical stage Undernourished
Normal Overweight Total Mild Moderate Severe
Stage 1 22.8 a 16.5 b 4.5 c 1.8 d.e 71.7 5.5
Stage 2 30.4 a 21.8 b 6.4 c 2.2 68.0 1.6
Stage 3 34.2 21.8 7.4 4.9 d.f 64.9 1.0
Stage 4 33.8 19.1 5.8 8.9 e.f 63.4 2.8
p a<0.001 b<0.001 c<0.001 d,e,f<0.01
Table 14 shows the classification of nutritional status by the presence of OIs and HIV-related
digestive symptoms (diarrhea, nausea, or vomiting). The prevalence of undernutrition was
surprisingly lower among the 945 patients with OIs than among those without OI (23.5% vs.
27.8%, p<0.01). Among 702 patients with nausea, diarrhea, or vomiting, the prevalence and
severeity of undernutrition was significantly higher than among those without these
symptoms (38.9% vs. 24.1%).

21
Table 14. Nutritional status of participants by presence of opportunistic infections and HIV-related symptoms
Factor
Undernourished (%) Normal
Overweight/ obese Total Mild Moderate Severe
Opportunistic infections
No (n=2,967) 27.8 18.8 5.8 3.2 68.3 3.9
Yes (n=945) 23.5 16.9 3.9 2.7 73.0 3.5
p <0.01
HIV-related symptoms
No (n=3210) 24.1 17.2 4.4 2.5 71.7 4.1
Yes (n=702) 38.9 23.8 9.4 5.7 58.8 2.3
p <0.001 <0.001 <0.001 <0.001
3.4. Dietary Intake
Nutrient needs depend on age, physical changes such as pregnancy and breastfeeding,
and level of activity. For PLHIV, energy requirements are influenced by viral load.
Asymptomatic adults with HIV need to consume 10 percent more energy than healthy
adults, and symptomatic PLHIV need to consume 20–30 percent more energy than HIV-
negative people of the same age, sex, and physical activity level. According to WHO, PLHIV
should consume the same proportion of protein in their diet as healthy non-infected people
of the same age, sex and physical activity level. They should increase protein intake
proportionally as they increase fat and carbohydrate intake to meet their increased energy
needs. There is no evidence that PLHIV need more fat than the normal requirements, but
they may consume additional fat as they increase their energy intake. People on ART or with
persistent diarrhea may need to eat less fat when they have diarrhea or are taking certain
drugs.26
Table 15 shows the dietary characteristics of the adult PLHIV in this study. The average total
energy intake was 1849.8 kcal/person/day. The average protein intake was 84.4
g/person/day, of which 51.1 g was from animal sources. The average lipid (fat) intake was
46.3 g/person/day, of which 14.0 g was from plant sources.
According to WHO, PLHIV have the same micronutrient requirements as people without
HIV, that is, 1 recommended dietary allowance (RDA) per day. Average calcium intake was
558.6 mg/person/day and average iron intake was 13.7 mg/person/day, both lower than the
2102 NIN RDA. Average vitamin intake was 646.8 mcg/person/day for vitamin A, 129.1

22
g/person/day for vitamin C, 17.1 g/person/day for vitamin B3, 1.4 g/person/day for vitamin
B1, and 0.9 g/person/day for vitamin B2. Most of the vitamin intake met 1 RDA.
Table 15. Dietary characteristics of PLHIV
*NIN RDA for asymptomatic adult PLHIV
Table 15 compares the participants’ dietary intake with the NIN RDA. Food intake met 77.1
percent of the RDA for adult PLHIV. Energy intake met 65.9 percent of the requirement for
symptomatic PLHIV. Protein intake met 122 percent of the RDA. The average
Indicators Nutritive values NIN RDA* 2012
Mean ± SD
Energy (kcal) 1849.8 ± 737.8 2376
Ratio protein:fat: carbohydrates 18.3:21.7:60.0 12-14:18-25: 60–65
Protein
Total (g) 84.4 ± 42.9 72.6
Animal-source protein (g) 51.1 ± 38.7 30-35%
Lipid
Total (g) 46.3 ± 34.5
Plant-source lipids (g) 14.0 ± 16.4 >40%
Carbohydrates 272.7 ± 105.0
Minerals
Calcium (mg) 558.6 ± 568.4 1,000
Phosphorus (mg) 1029.0 ± 501.3 700 (male),
1250 (female)
Iron (mg) 13.7 ± 7.0 18.3 (male)
39.2 (female)
Vitamin
Vitamin A (mcg) 646.8± 863.5 600
Vitamin C (mg) 126.4 ± 99.0 70
Vitamin B3 (mg) 15.6 ± 10.2 16
Vitamin B1 (mg) 1.4 ± 0.8 1.2
Vitamin B2 (mg) 0.9 ± 0.5 1.3

23
protein:fat:carbohydrate ratio was 18.3:21.7:60.0. The proportion of protein was higher
than the NIN recommendation (12–14 percent). The ratio of animal-source protein to total
protein was 115.6 percent higher than the NIN recommendation. The proportion of fat was
within the range recommended by NIN (18–25 percent), but the ratio of plant-source fats to
total fat intake was lower than the NIN recommendation. Participants reported consuming
more foods providing protein and fat than foods providing carbohydrates. The ratio of
calcium and phosphorus was 0.54, lower than recommended.
Table 16. Nutritive values and dietary balance of participants’ dietary intake compared
with NIN RDAs (2012)
Indicator Study results NIN RDA 2012* % meeting the RDA
Energy (kcal) 1849.8 2,376 77.1
Protein (g) 84.4 72.6 115.6
Ratio animal-source protein:total protein
56% 30–35% 187
Ratio plant-based lipids:total lipids
34% > 40% 85
Ratio protein:fat: carbohydrates
18.3:21.7:60.0 12–14:18–25:60–65
Ration calcium: phosphorus
0.54 > 0.8
*NIN RDA for asymptomatic adult PLHIV
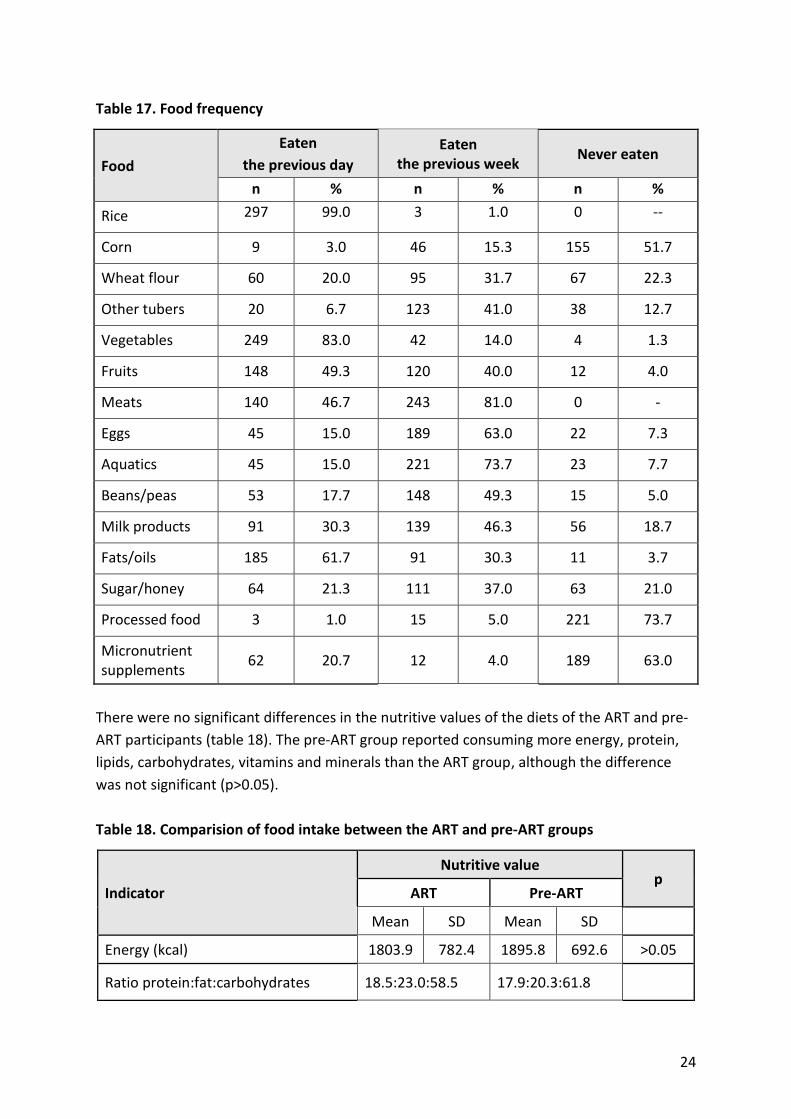
Table 17 shows how often the study participants reported eating different foods. Rice was
the main food participants (99.0 percent) reported eating the previous day, followed by
vegetables (83.0 percent) and fruit (49.3 percent). Among animal-source protein foods,
meat was reported most frequently (by 46.7 percent), followed by eggs (15 percent), and
seafood (15 percent). Consumption of beans/peas the previous day was reported by 17.7
percent and consumption of fats/oils was reported by 61.7 percent; 20.7 percent reported
taking a micronutrient supplement the previous day; 73.7 percent of participants reported
never eating processed food, 63.0 percent reported never taking micronutrient
supplements, 51.7 percent reported never eating corn, 22.3 percent reported never eating
wheat flour, and 18.7 percent reported never consuming milk or milk products.
24
Table 17. Food frequency
Food
Eaten
the previous day
Eaten the previous week
Never eaten
n % n % n %
Rice 297 99.0 3 1.0 0 --
Corn 9 3.0 46 15.3 155 51.7
Wheat flour 60 20.0 95 31.7 67 22.3
Other tubers 20 6.7 123 41.0 38 12.7
Vegetables 249 83.0 42 14.0 4 1.3
Fruits 148 49.3 120 40.0 12 4.0
Meats 140 46.7 243 81.0 0 -
Eggs 45 15.0 189 63.0 22 7.3
Aquatics 45 15.0 221 73.7 23 7.7
Beans/peas 53 17.7 148 49.3 15 5.0
Milk products 91 30.3 139 46.3 56 18.7
Fats/oils 185 61.7 91 30.3 11 3.7
Sugar/honey 64 21.3 111 37.0 63 21.0
Processed food 3 1.0 15 5.0 221 73.7
Micronutrient supplements
62 20.7 12 4.0 189 63.0
There were no significant differences in the nutritive values of the diets of the ART and pre-
ART participants (table 18). The pre-ART group reported consuming more energy, protein,
lipids, carbohydrates, vitamins and minerals than the ART group, although the difference
was not significant (p>0.05).
Table 18. Comparision of food intake between the ART and pre-ART groups
Indicator
Nutritive value p
ART Pre-ART
Mean SD Mean SD
Energy (kcal) 1803.9 782.4 1895.8 692.6 >0.05
Ratio protein:fat:carbohydrates 18.5:23.0:58.5 17.9:20.3:61.8

25
Indicator
Nutritive value p
ART Pre-ART
Mean SD Mean SD
Protein
Total (g) 82.8 43.2 86.1 42.8 >0.05
Animal-source protein (g) 49.4 38.8 52.9 38.8 >0.05
Animal-source protein/total protein 59.7% 61.4%
Lipid
Total (g) 48.1 34.6 44.4 34.6 >0.05
Plant-based lipids (g) 16.3 20.4 11.7 10.7 >0.05
Plant-based lipids/total lipids 33.9% 26.4%
Carbohydrates 259.9 108.9 285.4 100.0 >0.05
Minerals
Calcium (mg) 523.4 408.6 593.4 692.1 >0.05
Phosphorus (mg) 998.4 469.5 1059.1 532.1 >0.05
Iron (mg) 14.4 7.6 13.0 6.3 >0.05
Vitamins
Vitamin A (mcg) 575.9 633.3 717.7 1044.1 >0.05
Vitamin C (mg) 127.2 110.2 125.6 87.1 >0.05
Vitamin B3 (mg) 15.3 9.7 15.9 10.7 >0.05
Vitamin B1 (mg) 1.3 0.8 1.3 0.8 >0.05
Vitamin B2 (mg) 0.9 0.5 0.9 0.6 >0.05
Table 19 shows a significant difference between the diets of male and female participants,
with nutrient intake higher in females than in males. Energy intake was also higher in
females (2,003.5 kcal) than in males (1,741.6 kcal) (p<0.01). The same was true of protein
and lipid intake (p<0.01). Females consumed a higher proportion of animal-source protein
(58 percent of total protein) than males (54 percent of total protein). Intake of important
minerals and vitamins was also significantly higher in females than in males.

26
Table 19. Nutritive values of food intake of study groups by sex
Indicators
Nutritive values
p Male n=88 Female n=62
Mean SD Mean SD
Energy (kcal) 1741.6 629.4 2003.5 850.8 <0.05
Ratio protein:fat:carbohydrates 17.7:19.8:62.5 19.9:24.1:56.0
Protein
Total (g) 76.4 32.7 95.8 52.4 <0.01
Animal-source protein (g) 43.6 26.3 61.8 49.8 <0.01
Animal-source protein/total protein 54% 58%
Lipid
Total (g) 38.8 24.8 56.8 42.9 <0.01
Plant-based lipids (g) 13.0 13.9 15.4 19.5 >0.05
Plant-based lipids/total lipids 36% 31%
Carbohydrates 271.3 103.0 274.6 108.6 >0.05
Minerals
Calcium (mg) 525.0 472.7 607.2 684.7 >0.1
Phosphorus (mg) 937.4 394.3 1161.1 603.6 <0.01
Iron (mg) 13.1 6.9 14.6 7.0 >0.05
Vitamins
Vitamin A (mcg) 531.8 591.3 810.1 1129.8 >0.05
Vitamin C (mg) 121.2 91.5 133.8 109.0 >0.1
Vitamin B3 (mg) 14.0 8.1 17.8 12.3 <0.05
Vitamin B1 (mg) 1.2 0.8 1.4 0.8 >0.05
Vitamin B2 (mg) 0.8 0.5 1.0 0.7 >0.05
Table 20 shows the association between food intake and nutritional status in the adult
PLHIV who participated in this study. There was no significant difference in the nutritive
values of food consumed by participants with different nutritional status, but the
overweight group tended to have higher energy intake (2,120.0 kcal) than the groups with
undernutrition (1,863.0 kcal) and normal nutritional status (1,822.2 kcal) and proportionally
higher protein, fat, and carbohydrate intake (p>0.05). There were no clearly observed
differences in food intake between the groups with undernutrition and normal nutritional
status (p>0.05).

27
Table 20. Association between food intake and nutritional status of study participants
Nutritional status
Nutritive values
Malnourished n=36
Normal n=105
Overweight/obese n=9
p Mean SD Mean SD Mean SD
Energy (kcal) 1863.0 796.7 1822.2 721.0 2120.2 714.9 >0.05
Ratio
protein:fat:carbohydrates 17.1:18.5:64.4 18.6:22.8:58.6 17.6:20.5:61.9
Protein
Total (g) 81.6 49.6 84.8 41.5 91.7 32.1 >0.05
Animal-source protein (g) 48.2 43.5 52.0 38.0 51.9 28.3 >0.05
Animal-source
protein/total protein 52% 57% 55%
Lipid
Total (g) 39.8 32.4 48.1 35.3 50.4 33.9 >0.05
Plant-based lipids (g) 11.2 9.6 15.2 17.9 11.3 19.4 >0.05
Plant-based lipids/total
lipids 37% 34% 23%
Carbohydrates 292.3 114.4 261.3 99.5 326.7 112.5 >0.05
Minerals
Calcium (mg) 517.5 386.8 573.9 640.4 547.1 176.4 >0.05
Phosphorus (mg) 1027.3 573.5 1021.3 481.8 1124.6 457.9 >0.05
Iron (mg) 13.8 8.0 13.7 6.8 14.4 5.4 >0.05
Vitamins
Vitamin A (mcg) 818.0 1449.5 579.6 578.3 746.6 381.9 >0.05
Vitamin C (mg) 140.3 103.9 121.2 100.4 132.1 55.5 >0.05
Vitamin B3 (mg) 14.7 9.8 15.9 10.7 16.0 5.8 >0.05
Vitamin B1 (mg) 1.2 0.7 1.3 0.8 1.7 1.1 >0.05
Vitamin B2 (mg) 0.9 0.8 0.9 0.5 1.1 0.6 >0.05
Table 21 shows the nutritive values of the reported diets of the participants by clinical stage.
Although no significant difference was found, participants at stage 2 tended to have higher
intake of both macronutrients and micronutrients than those at other stages.

28
Table 21. Association of food intake and clinical stages
Clinical stage Mean SD Mean SD
Food intake (n=145) Energy (kcal) Protein (g) Carbohydrates (g) Lipid (g)
1 (n= 80) 1856.0 756.3 86.0 41.5 274.7 108.9 44.5 33.4
2 (n=18) 2095.4 1057.2 97.6 62.6 291.9 130.9 60.5 54.9
3 (n=37) 1773.2 516.2 77.0 38.2 273.6 80.1 41.7 25.5
4 (n=10) 1737.6 737.3 81.6 34.6 250.7 108.8 43.8 28.5
p (ANOVA) 0.468 0.417 0.801 0.279
Food intake (n=145) Iron (g) Vitamin A (mcg) Calcium (g) Vitamin C (g)
Clinical stage MEAN SD MEAN SD MEAN SD MEAN SD
1 (n= 80) 13.6 6.6 635.3 736.5 13.6 6.6 635.3 33.4
2 (n=18) 16.2 9.2 970.1 1770.3 16.2 9.2 970.1 54.9
3 (n=37) 12.4 5.5 546.5 505.1 12.4 5.5 546.5 25.5
4 (n=10) 15.6 9.4 601.5 480.6 15.6 9.4 601.5 28.5
p (ANOVA) 0.225 0.396 0.225 0.396

29
4. DISCUSSION
There is an established cyclical relationship between poor nutrition and infections such as
HIV. Malnutrition weakens the immune system, which worsens the effects of infection,
which increases the likelihood of malnutrition. Infections can reduce appetite, decrease the
body’s absorption of nutrients, and make the body use nutrients faster than usual to repair
the immune system. Because a severely malnourished person does not consume enough
nutrients, the body meets energy needs by mobilizing tissue reserves of fat and protein
from muscle, skin, and the gut. To conserve energy, the body reduces physical activity and
growth, turnover of protein, functional organ reserves, the number of cell membranes, and
inflammatory and immune responses. This process:
1. Reduces the liver’s ability to make glucose and excrete excess dietary protein and
toxins
2. Reduces the kidney’s ability to excrete excess fluid and sodium
3. Reduces the size, strength, and output of the heart
4. Slows the body’s sodium/potassium chemical pump, causing sodium to leak into the
cells and potassium to leak out of the cells and be lost in the urine
5. Reduces the gut’s acid and enzyme production, flattening the villi and reducing their
motility
6. Affects safe storage of iron liberated from red blood cells, promoting the growth of
pathogens and harmful free radicals
7. Reduces muscle mass, leading to loss of intracellular nutrients and glucose stores
8. Reduces the immune system’s ability to respond to infection2
Inadequate intake of protein and energy results in proportional loss of skeletal and
myocardial muscle. As myocardial mass decreases, the ability to generate cardiac output
decreases.
As PLHIV people are staying on ART for longer periods, new nutrition challenges are
emerging, including high blood pressure, dyslipidemia, insulin resistance, heart disease, and
osteoporosis. Diabetes is part of a growing epidemic of non-communicable diseases that
impose a double burden of malnutrition (undernutrition and overweight/obesity).
TB is the leading bacterial cause of death in humans and the second leading cause of death
among infectious diseases after HIV. People with active TB often have decreased appetite,
weight loss, and micronutrient deficiencies, which increase the risk of progression from TB
infection to active TB. The dual epidemics of TB and HIV are of growing concern in Asia. TB is
2 Tomkins, A, and F Watson. 1989. Malnutrition and Infection–A Review. Nutrition Policy Discussion Paper No. 5. Geneva: United Nations Administrative Committee on Coordination–Subcommittee on Nutrition (ACC/SCN).

30
a major cause of death among PLHIV. Management of TB/HIV co-infection and increasing
levels of multi-drug resistant TB are a growing challenge in Asia.
4.1. Nutritional Status
The prevalence of undernutrition among the pre-ART and ART patients assessed was 26.8
percent, with 3.1 percent severely undernourished. The highest prevalence of
undernutrition was found in participants 20–29 years (29.2 percent) and the second highest
in participants 50 years and older (27.6 percent), although the latter had the highest
prevalence of SAM (6.6 percent).
The prevalence of undernutrition was higher in the ART group than in the pre-ART group,
but the difference was not statistically significant. The severity of undernutrition was similar
in the two groups.
Rates of undernutrition and overnutrition (overweight) were not significantly different
between males and females in general or by treatment group. The prevalence of
undernutrition among the adult PLHIV in the study was higher than that found among
Vietnamese adults in the National Nutrition Survey 2009–2010, both for males (27.0 percent
vs. 15.8 percent) and females (26.5 percent vs. 18.5 percent).27 The study found the highest
prevalence of undernutrition in participants less than 25 years old and more than 55 years
old. The prevalence of overweight in the adult PLHIV in the study was lower (3.8 percent in
both males and females) than that in the general Vietnamese adult population (4.9 percent
in males and 36.3 percent in females). In both population groups, the prevalence of
overweight was highest in people more than 50 years old. Undernutrition was more
common in the younger participants in the study, similar to findings in the general
population. Younger people work more and are more active, but they often pay insufficient
attentio to eating a balanced diet. PLHIV over 50 years old in the study had a higher rate of
underweight but also the highest rate of overweight, indicating nutritional imbalances at
both ends of the spectrum.
The mean weight of adult PLHIV in this study was comparable to that found in a study by Le
and Nguyen (2005) in Hanoi among non-pregnant female patients (n=300) over 16 years old
(52.7 ± 5.1 kg).28 A study in two districts in Kenya (Kuria et al. 2008) found that 23.6 percent
of PLHIV (n=174 both males and females) had BMI < 18.5.29 Another study in Botswana
(Nyepi et al. 2008) found that 28.5 percent of 145 HIV-positive patients were
undernourished.30 Those findings are not much different from those of this study. The
prevalence of undernutrition among the HIV-positive population studied in Botswana was a
bit higher than that among the PLHIV in this study (26.8 percent). A possible reason could be
the higher incidence of HIV-related digestive symptoms (42.2 percent) than in the NIN study
(17.9 percent).

31
Nutritional status was associated with CD4 count, clinical stage of HIV disease, and the
presence of OIs and HIV-related digestive symptoms. Specifically, participants with CD4
count <200 had the highest rate of undernutrition (34.3 percent, with 4.5 percent severely
undernourished). Patients at Stage 4 had a higher total undernutrition rate (33.8 percent)
and SAM rate (8.9) than those at earlier stages. However, participants with OIs had a lower
rate of undernutrition than those without. A possible reason is that they may have received
more health and nutrition care and support than those without symptoms. These findings
again highlight the links between nutrition and HIV: severity, clinical stage, and symptoms
influence nutritional status and vice versa.
4.2. Dietary Intake
Reported food intake varied among study participants, but the small sample size for the
dietary survey did not allow an association between food intake and related factors.
In general, the reported food consumption did not meet the NIN RDA. Carbohydrates
accounted for 77.1 percent of dietary intake reported by asymptomatic participants and
65.9 percent reported by symptomatic participants without weight loss. Protein accounted
for 122 percent, particularly animal protein, which more than the recommended allowance.
Reported mineral intake (calcium, iron) was lower than the RDA, but most reported vitamin
intake met the recommended requirements for healthy adults.
The results also showed that PLHIV in the pre-ART group tended to have higher food intake
(see table 17) and better nutritional status (see figure 6) than those on ART. As ART usually
increases appetite and weight gain, the reason may be decreased appetite and nutrient
absorption from ARV side effects.
The proportion of carbohydrates (60 percent) in total food intake reported by the
particiants was at the lower end of the recommended 60–65 percent. Rice was the main
staple food, reportedly eaten by 99 percent of participants the day before the study. Other
starchy foods were reportedly consumed weekly or monthy. The second most commonly
consumed food was green vegetables (reportedly eaten by 83 percent the day before the
study), followed by fats and oils (reportedly eaten by 61.7 percent) and fruit (reportedly
eaten by 49.3) (see table 16). High intake of rice and vegetables/fruit provided PLHIV with
adequate nutrients from the energy and protective food groups. Among protein-rich foods,
meat was reportedly eaten most often the day before the study (reported by 46.7 percent),
followed by milk and milk products (reported by 30.3 percent), eggs (reported by 15.0
percent), and seafood (reported by 15.0 percent).
WHO does not recommend that PLHIV consume a higher proportion of protein in their diets
than people without HIV. The proportion of protein in the total food intake reported by

32
participants in this study was higher than the recommended amount, possibly because
PLHIV with appetite loss ate fewer staple foods while maintaining or even increasing their
intake of protein- and fat-rich foods. The high proportion of protein consumed led to lower
calcium intake than recommended and loss of body calcium, concomitant with high energy
intake. The ratio of calcium to phosphorus was 0.54, compared with the recommended ratio
of over 0.8. Body calcium would be lost because of a disproportionately high intake of
protein. WHO does not recommend that PLHIV consume a higher proportion of protein in
their diets than peole without HIV.
A study in South Africa of dietary intake of PLHIV by Vorster et al. (2004) found calcium
intake of 408–448 mg and phosphorus intake of 955–1214 mg, lower than the 558.6 mg of
calcium and 1,029 mg of phosphorus reported by participants in this study. The South Africa
study also found an imbalance in the ratio of calcium to phosphorus.31 A study by Tran in
2005 among 170 HIV-positive women of reproductive age in Hanoi found that the average
energy intake was 1785.3 ± 568.4 kcal, lower than that among women in this study (2003,5
± 805,8). Fat in Tran’s study accounted for 68.5 percent of dietary intake, compared with
69.0 percent in this study. Vitamin A intake in Tran’s study was 100.9 mg/capita/day, lower
than the 133.8 mg/capita/day in this study, and iron intake was 11.2 mg/capita/day, lower
than the 14.6 mg/capita/day in this study32 (see table 18).
4.3. Factors Affecting Nutritional Status
The study found an association between poor nutritional status and CD4 count, clinical
stage, and presence of digestive disorders. The prevalence and severity of undernutrition
was highest in participants with CD4 < 200 (34.3 percent undernourished and 4.5 percent
severely undernourished) and lowest in those with CD4 > 500 (22.3 percent undernourished
and 2.2 percent severely undernourished).
The prevalence of undernutrition (total and SAM) tended to increase with clinical stage,
highest in Stage 4 (33.8 percent total and 8.9 percent SAM) and lowest in Stage 1 (22.8
percent total and 1.8 percent SAM). The prevalence of SAM in participants with Stage 4
disease was significantly different from that in participants with Stage 3 and earlier (p<0.01).
The prevalence of undernutrition was suprisingly lower in the 945 participants with OIs
(23.5 percent) than in those without OIs (27.8 percent, p<0.01). Among the 702 participants
with one or more digestive disorders, the prevalence and severity of undernutrition were
significantly higher (38.9 percent) than in those without such disorders (24.1 percent).
These findings are consistent with the vicious circle of undernutrition: impaired immune
function (indicated by low CD4 count) reduces the body’s capacity to fight disease and
nutrient needs increase to fight infection, but HIV-related symptoms and ART side effects
33
reduce appetite and nutrient absorption, making it difficult to meet nutrient needs
(especially the increased energy needs caused by HIV).

34
5. CONCLUSIONS
The average weight of the study participants was 51.5 ± 8.0 kg, and the average height was
160.1±7.8 cm. According to their BMI, 3.8 percent of the participants were overweight, 69.4
percent had normal nutritional status, and 26.8 percent were undernourished. Of the
undernourished participants, 18.4 percent were mildly undernourished, 5.3 percent were
moderately undernourished, and 3.1 percent were severely undernourished. There was no
significant difference in nutritional status between the undernourished men and women.
Percentage of study participants who were malnourished, by age group and ART status
Nutritional status 20–29 years 30–39 years 40–49 years 50 years and
older
Undernutrition (BMI < 18.5) 29.2% 26.5% 22.0% 27.6%
Overnutrition (overweight;
BMI ≥ 25.0) 3% 4% 3.9% 8.1%
The difference in the proportion of ART patients (27.9 percent) and pre-ART patients (25.5
percent) who were malnourished was not statistically significant.
Percentage of study participants who were undernourished, by ART status
ART status 20–29 years 30–39 years 40–49 years 50 years and
older
Pre-ART (25.5%) 27.1% 25.4% 18.6%
ART (27.9%) 32.0% 22.5% 32.5%
The prevalence of overweight was similar in the pre-ART and ART groups and highest in
those over 50 (14 percent among pre-ART patients and 5 percent among ART patients).
The food intake of the adult PLHIV participating in the study was inadequate in both
quantity and quality. Energy intake was low (1849.8 ± 737.8 kcal/person/day), meeting 77.1
percent of the 2012 NIN RDA for adult asymptomatic PLHIV. Participants reported
consuming more protein in relation to other macronutrients than the NIN recommendation.
Consumption of some nutrients important for immune function, including iron and calcium,
did not meet the 2012 NIN RDA.
An association was found between poor nutritional status and higher CD4 count, higher
clinical stage, and the presence of HIV-related symptoms and OIs. No association was found
between nutritional status and food intake, but participants on ART tended to consume less
than those not yet on ART.

35
6. RECOMMENDATIONS
Good nutrition is especially important for PLHIV because of their reduced food intake,
increased energy needs, and poor nutrient absorption. Malnutrition can hasten the
progression of HIV and worsen its impact by weakening the immune system and reducing
the effectiveness of treatment. Malnutrition can also increase the risk of mother-to-child
transmission of HIV. Stunted growth, failure to thrive, and frequent common childhood
illnesses are common in HIV-positive children.
Nutrition assessment of PLHIV can identify nutrition problems early, inform counseling on
dietary intake and management of HIV-related symptoms and drug side effects that affect
nutritional status in order to improve nutritional status, boost immune response, and
improve response to treatment. People whose malnutrition is not treated early have longer
hospital stays, slower recovery from infection and complications, and higher morbidity and
mortality.
Recommendation 1. Nutrition care and support should be integrated into both clinic- and
community-based services for PLHIV to prevent and manage malnutrition in this vulnerable
population group. The components of this support should include:
Nutrition assessment, counseling, and support provided as part of routine OPC care
and treatment
Specialized food products (RUTF for treatment of SAM and fortified-blended food for
treatment of moderate malnutrition and prevention of SAM) prescribed for a limited
duration, with clear eligibility and exit criteria based on anthropometric
measurement. Such products must be safe, effective, of consistent high quality,
palatable, easy to digest, culturally appropriate, cost effective, and feasible to deliver to
clients. They must be simple to prepare without requiring large amounts of water,
nutrient dense, and free of contamination and meet acceptable standards for daily
energy, micronutrient and protein content and microbiological safety.
Recommendation 2. Nutrition counseling for ART patients should focus on a balanced diet,
with adequate energy and micronutrient intake.
Recommendation 3. OPC patients less than 25 years old and 50 years and older should be
prioritized for nutrition assessment, counseling, and support, given that these age groups
had the highest prevalence of undernutrition in this study.
Recommendation 3. The Government and its development partners should formulate and
enforce a strategic policy to ensure equitable access to food support for groups vulnerable
to food insecurity, including PLHIV.

36
ANNEX 1. DATA COLLECTION FORM
I. GENERAL INFORMATION
N QUESTIONS RESPONSE (CODING)
1. Province (filled by the respondent) … … … … … … … … … … … … … … … | _ _ _ |
2. Name of OPC (filled by the respondent) … … … … … … … … … … … … … … … | _ _ _ | | _ _ _ |
3. Funding source (filled by the respondent) P E P F A R … … … … … … … … … … … … . . 1
G l o b a l F u n d … … … … … … … … … … … … … … … 2
G o v e r n m e n t … … … … … … … … … … … … … … … 3
4. Full name
5. On ARVs? Y e s … … … … … … . . … … … … … … … … … … … 1
N o … … … … … . . … … … … … … … … … … … . . 2
6. Gender M a l e … … … … … … . . … … … … … … … … … … … 1
F e m a l e … … … … … . . … … … … … … … … … … … . . 2
7. Age |___|___||
8. Ethnic group
9. Education Grade finished......................................…|___|___|
D o n ’ t k n o w … . . … … … … … … … … … … … … … . . 9 7
N o r e s p o n s e … … … … … … … … … … … … … … . . 9 8
10. Current job F a r m e r … … … … … … … … . . … … … … … … . 1
G o v e r n m e n t O f f i c e r . . . . . . . . … … … … … … … … … . 2
T e a c h e r … … … … … … … … … … … … . … … . … . . 3
Business...........................................…............ 4
Worker............................................................. 5
H o u s e w i f e … . … … … … … … . . . . . . . . . . . . . . . . . . . . . . . . . . 6
O t h e r s ( D e t a i l e d ) . 7 .
U n e m p l o y e d … … … … … … … … … … . 8
D o n ’ t k n o w … . . … … … … … … … … … … … … … . . 9 7
N o r e s p o n s e … … … … … … … … … … … … … … . . 9 8
11. Marrital status S i n g l e . . . . . . . . . . . . . . . . . . . . . . . . . . . . . . . . . . . . . . . . . . . . . . . . . 1
M a r r i e d . . . . . . . . . . . . . . . . . . . . . . . . . . . . . . . . . . . . . . . . . . . . . . . . 2
Live without marriage..…………………………….... . .. .. .. .. .. .. .. .. .. .. .. 3
D i v o r c e d … … … … … … … … … … … … … . . . . . . . . . . . . . . . . . 4
S e p a r a t e … … … … …… ……… … … . . . . . . . . . . . . . . . . . . . . 5
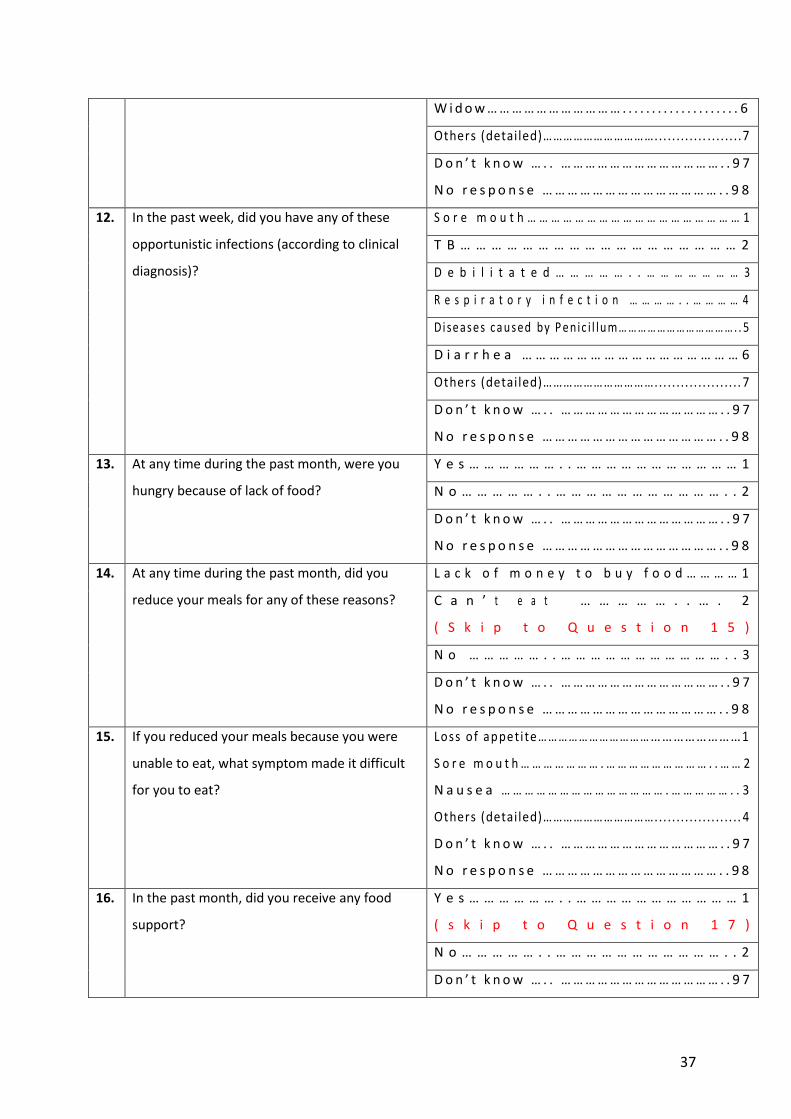
37
W i d o w … … … … … … … … … … … . . . . . . . . . . . . . . . . . . . . 6
Others (detailed)……………………………... .. ... .. .. .. .. .. ..7
D o n ’ t k n o w … . . … … … … … … … … … … … … … . . 9 7
N o r e s p o n s e … … … … … … … … … … … … … … . . 9 8
12. In the past week, did you have any of these
opportunistic infections (according to clinical
diagnosis)?
S o r e m o u t h … … … … … … … … … … … … … … … … … … 1
T B … … … … … … … … … … … … … … … … … … 2
D e b i l i t a t e d … … … … … . . … … … … … … … 3
R e s p i r a t o r y i n f e c t i o n … … … … . . … … … … 4
Di se as e s ca u s ed by P e nic i l lu m… …… ……… …… …… …….. 5
D i a r r h e a … … … … … … … … … … … … … … … … 6
Others (detailed)……………………………... .. ... .. .. .. .. .. .. 7
D o n ’ t k n o w … . . … … … … … … … … … … … … … . . 9 7
N o r e s p o n s e … … … … … … … … … … … … … … . . 9 8
13. At any time during the past month, were you
hungry because of lack of food?
Y e s … … … … … … . . … … … … … … … … … … … 1
N o … … … … … . . … … … … … … … … … … … . . 2
D o n ’ t k n o w … . . … … … … … … … … … … … … … . . 9 7
N o r e s p o n s e … … … … … … … … … … … … … … . . 9 8
14. At any time during the past month, did you
reduce your meals for any of these reasons?
L a c k o f m o n e y t o b u y f o o d … … … … 1
C a n ’ t e a t … … … … … . . … . 2
( S k i p t o Q u e s t i o n 1 5 )
N o … … … … … . . … … … … … … … … … … … . . 3
D o n ’ t k n o w … . . … … … … … … … … … … … … … . . 9 7
N o r e s p o n s e … … … … … … … … … … … … … … . . 9 8
15. If you reduced your meals because you were
unable to eat, what symptom made it difficult
for you to eat?
Loss of appet i te…………… ……………………………………1
S o r e m o u t h … … … … … … … . … … … … … … … … … . . … … 2
N a u s e a … … … … … … … … … … … … … … . … … … … … . . 3
Others (detailed)……………………………... .. ... .. .. .. .. .. .. 4
D o n ’ t k n o w … . . … … … … … … … … … … … … … . . 9 7
N o r e s p o n s e … … … … … … … … … … … … … … . . 9 8
16. In the past month, did you receive any food
support?
Y e s … … … … … … . . … … … … … … … … … … … 1
( s k i p t o Q u e s t i o n 1 7 )
N o … … … … … . . … … … … … … … … … … … . . 2
D o n ’ t k n o w … . . … … … … … … … … … … … … … . . 9 7

38
N o r e s p o n s e … … … … … … … … … … … … … … . . 9 8
17. If you received food support, what was the
reason?
M a l n u t r i t i o n … … … … … … … … … … . 1
L a c k o f f o o d … … … … … … … … … 2
D o n ’ t k n o w … . . … … … … … … … … … … … … … . . 9 7
N o r e s p o n s e … … … … … … … … … … … … … … . . 9 8
18. Have you ever been counseled on nutrition? Y e s … … … … … … . . … … … … … … … … … … … 1
N o … … … … … . . … … … … … … … … … … … . . 2
D o n ’ t k n o w … . . … … … … … … … … … … … … … . . 9 7
N o r e s p o n s e … … … … … … … … … … … … … … . . 9 8
II. ANTHROPOMETRIC AND CLINICAL DATA
19. Weight (kg) ………………………………………|___||___||___| . |___|___||
20. Height (cm) ………………………………………|___||___||___| . |___|___||
21. Mid-upper arm circumference
(cm) … … … … … … … … … … … … … … … | _ _ _ | | _ _ _ | . | _ _ _ |
22. CD4 (latest test)
(Check the records of the OPC)
… … … … … … … … … … … … … … . … c e l l / m m 3
D a t e : … … … … … … … … … … … … … … …
23. Clinical period
(Check the records of the OPC) 1. 2. 3. 4.
O t h e r s :
24. Current clinical symptoms
(detailed) (Check the records of
the OPC)
III. FOOD CONSUMPTION
Which of the following foods did you eat yesterday/last week/last month?
No. Food group
Food Last month
Yesterday Last
week Last month Did not eat
A Cereals Rice
Corn
Wheat flour (bread…)
B Tubers Sweet potatoes
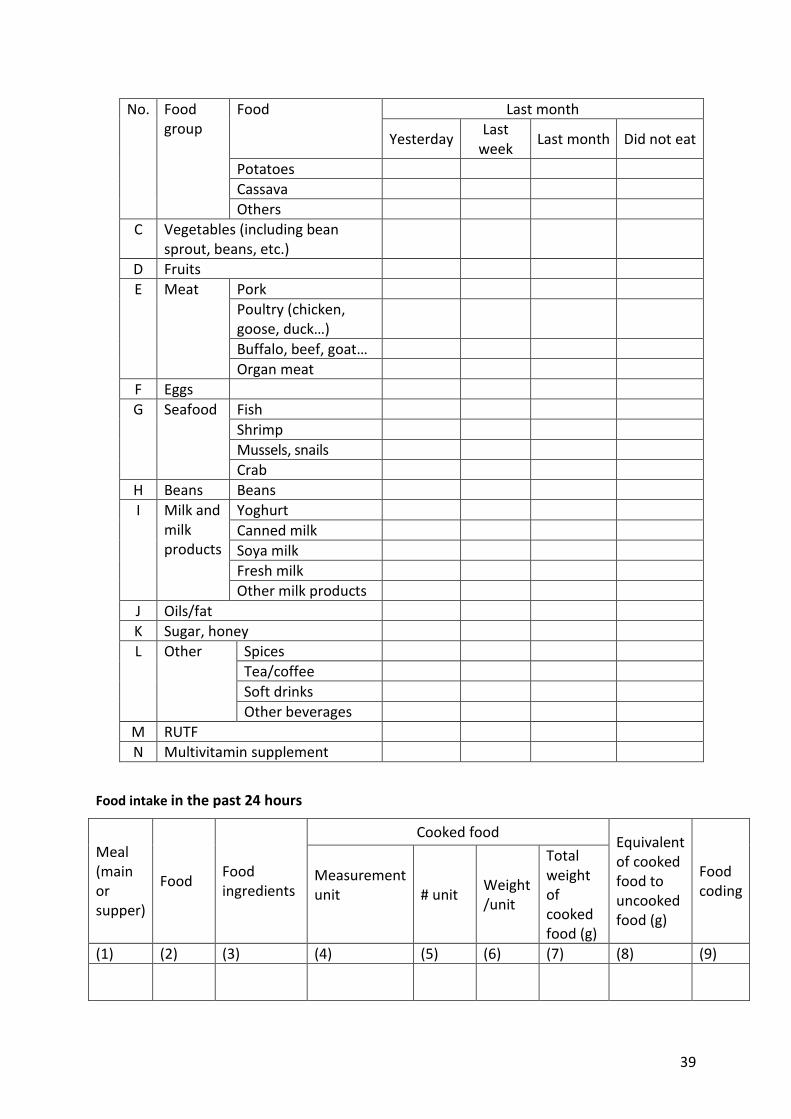
39
No. Food group
Food Last month
Yesterday Last
week Last month Did not eat
Potatoes
Cassava
Others
C Vegetables (including bean sprout, beans, etc.)
D Fruits
E Meat Pork
Poultry (chicken, goose, duck…)
Buffalo, beef, goat…
Organ meat
F Eggs
G Seafood Fish
Shrimp
Mussels, snails
Crab
H Beans Beans
I Milk and milk products
Yoghurt
Canned milk
Soya milk
Fresh milk
Other milk products
J Oils/fat
K Sugar, honey
L Other Spices
Tea/coffee
Soft drinks
Other beverages
M RUTF
N Multivitamin supplement
Food intake in the past 24 hours
Meal (main or supper)
Food Food ingredients
Cooked food Equivalent of cooked food to uncooked food (g)
Food coding
Measurement unit
# unit Weight /unit
Total weight of cooked food (g)
(1) (2) (3) (4) (5) (6) (7) (8) (9)

40
Meal (main or supper)
Food Food ingredients
Cooked food Equivalent of cooked food to uncooked food (g)
Food coding
Measurement unit
# unit Weight /unit
Total weight of cooked food (g)

41
ANNEX 2. OUTPATIENT CLINICS INVOLVED IN THE STUDY
Code Province Outpatient Clinic (OPC) Number of
participants Male Female ART
Pre-ART
1 Bac Ninh Provincial Hospital 142 77 65 68 74
2 Ha Noi Central Hospital for Tropical Diseases
143 72 71 73 70
3 Hoa Binh Provincial Hospital 119 76 43 74 45
4 Nghe An Provincial Hospital 149 95 54 75 74
5 Quang Ninh Provincial Hospital 150 76 74 75 75
6 Quang Ninh Cam Pha District Hospital 148 124 24 75 73
7 Ba Ria – Vung Tau Le Loi Hospital 129 71 58 64 65
8 Ho Chi Minh City Hospital for Tropical Diseases
137 43 94 70 67
9 Ho Chi Minh City District 4 OPC 145 89 56 75 70
10 Ho Chi Minh City District 10 OPC 142 95 47 72 70
11 Ho Chi Minh City Binh Thanh District OPC 141 69 72 74 67
12 Ho Chi Minh City Hoc Mon Health Center 145 80 65 75 70
13 Ho Chi Minh City District 1 Health Center 148 87 61 74 74
14 Ho Chi Minh City Pham Ngoc Thach Hospital 150 102 48 75 75
15 Bac Giang Provincial Hospital 116 48 68 75 41
16 Hung Yen Provincial AIDS Committee (PAC)
147 84 63 75 72
17 Ninh Binh PAC 150 83 67 75 75
18 Ben Tre Nguyen Dinh Chieu Hospital 129 71 58 75 54
19 Binh Duong Provincial Hospital 146 95 51 72 74
20 Da Nang Dermatology Hospital 109 55 54 73 36
21 Hai Duong Chi Linh Health Center 104 63 41 75 29
22 Hai Phong Hong Bang Health Center 142 109 33 86 56
23 Thai Nguyen Dai Tu Health Center 147 103 44 75 72
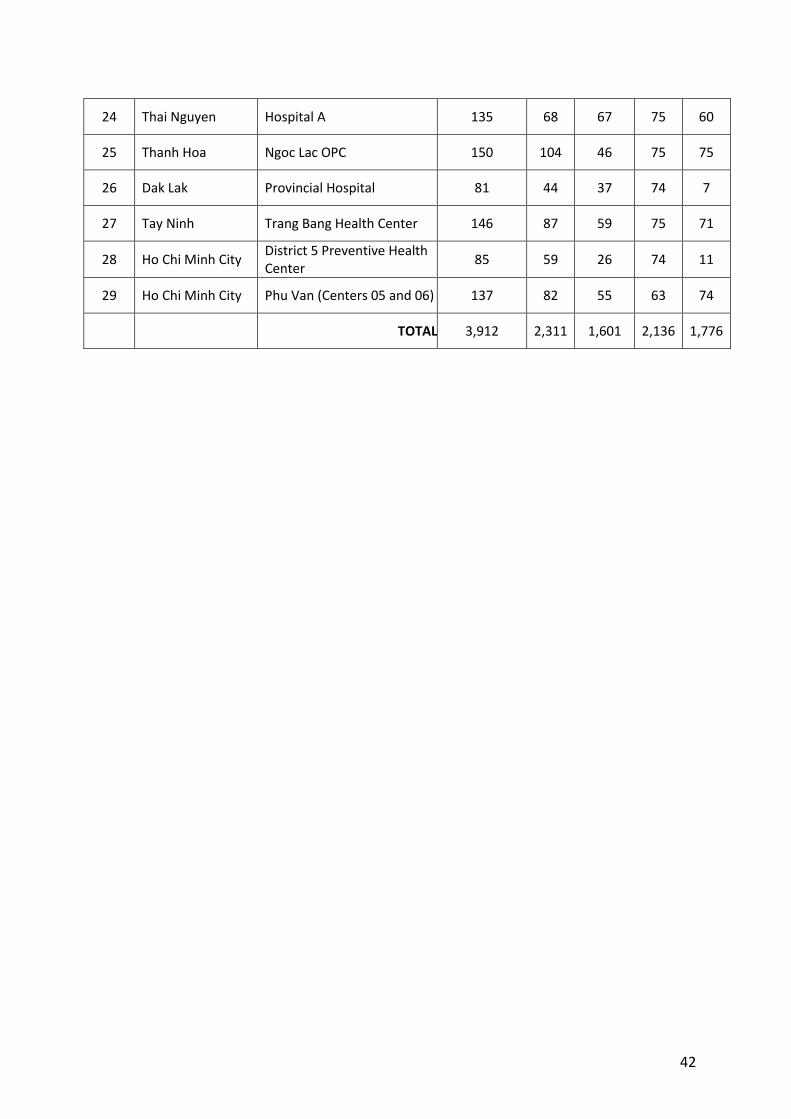
42
24 Thai Nguyen Hospital A 135 68 67 75 60
25 Thanh Hoa Ngoc Lac OPC 150 104 46 75 75
26 Dak Lak Provincial Hospital 81 44 37 74 7
27 Tay Ninh Trang Bang Health Center 146 87 59 75 71
28 Ho Chi Minh City District 5 Preventive Health Center
85 59 26 74 11
29 Ho Chi Minh City Phu Van (Centers 05 and 06) 137 82 55 63 74
TOTAL 3,912 2,311 1,601 2,136 1,776

43
ANNEX 3. INFORMED CONSENT FORM
Name of the research: Assessment of the nutritional status of adult PLHIV registered at outpatient clinics in Vietnam
The National Institute of Nutrition (NIN) is responsible for developing and providing guidance on the implementation of nutrition programs in Vietnam. NIN would like to develop guidelines and materials that improve the nutritional status of people living with HIV (PLHIV).
NIN would like do an assessment of the nutritional status of adult PLHIV registered at outpatient clinics in Vietnam. This study will look at the prevalence of malnutrition and household food insecurity among PLHIV and the dietary quality of PLHIV.
You are invited to participate in this study by having your weight, height, and mid-upper arm circumference (MUAC) recorded during a visit to the OPC. You may also be asked what you ate the past month and/or past 24 hours.
All anthropometric data will be collected by staff at this OPC. Dietary information (if requested) will be collected by NIN staff. None of the procedures are experimental.
Although you will not benefit directly from participating in this study, you will make a major contribution to knowledge about the prevalence of malnutrition among people living with HIV and AIDS as well as the factors related to malnutrition. In the future, other people living with HIV and AIDS may benefit because there may be better care and treatment guidelines and materials on nutrition care and treatment for PLHIV.
A research assistant at this OPC will keep your information in a secure database. Only the professional staff at the NIN will know the identity of study participants.
If you are asked to participate in the dietary assessment, you will be paid VND 20,000 for your time. If you
have any questions about the study, please contact Dr. Pham Thi Thuy Hoa of NIN (48A Tang Bat Ho, Ha
Noi, tel. 84-912357799).
Your signature on this form means that you understand the information presented and that you want to participate in the study. You understand that participation is voluntary and you may withdraw from the study at any time.
____________________________________ ______________________ Signature of participant Date
Full name: Age:
Address:
CODE |___|___||___|___|
44
ENDNOTES 1 Joint United Nations Programme on HIV/AIDS (UNAIDS). 2013. Global Report. UNAIDS Report on the Global AIDS Epidemice 2013. Geneva: UNAIDS. 2 http://www.unaids.org/en/Regionscountries/Countries/VietNam/. 3 Friis, H. 2005. “Micronutrients and HIV Infection: A Review of Current Evidence.”
Consultation on Nutrition and HIV/AIDS in Africa: Evidence, Lessons and Recommendations
for Action, Durban, South Africa, 10−13 April 2005. Geneva: WHO. 4 Hsu, J W-C, PB Pencharz, D Macallan, and A Tomkins. 2005. “Macronutrients and HIV/AIDS:
A Review of Current Evidence.” Consultation on Nutrition and HIV/AIDS in Africa: Evidence,
Lessons and Recommendations for Action, Durban, South Africa, 10−13 April. Geneva: WHO. 5 Hoa, PTT, TA Nguyen, and P Oosterhoff. 2005. Ten Menus for Patients with Infection. Hanoi: Medical Publishing House 2007. 6 Tran TBT, LM Nguyen, and Le AKA. 2005. “Description of Compliance Practices for Care, Nutrition and Treatment of PLHIV and Community Support in Thai Nguyen Province in 2005.” Practical Medicine Journal 556. 7 Tran, TBT, TL Nguyen, PM Dang, PTT Hoa, TM Ho, XN Nguyen, et al. 2010. “Current Situation of Vitamin and Mineral Supplementation in Women with HIV in Hanoi.” Practical Medicine Journal 742/743: 152–56. 8 Tran, TBT, TL Nguyen, CK Nguyen, et al. 2010. “Study of Nutrition Knowledge, Attitudes and Practices of Women with HIV in Hanoi.” Practical Medicine Journal 742/743: 134–38. 9 James, WP, A Ferro-Luzzi, and JC Waterlow. 1988. “Definition of Chronic Energy Deficiency in Adults.” Report of a Working Party of the International Dietary Energy Consultative Group.” European Journal of Clinical Nutrition 42(12):969–81. 10 Ha, HK. 1997. Op cit. 11 Vietnam Ministry of Health, National Institute of Nutrition. 2012. Recomended Dietary
Allowance for Vietnamese People. Hanoi: Medical Publishing House.
12 Bui Dai, VM Nguyen, and HT Nguyen. 2009. Pathology of Infections. Hanoi: Medical Publishing House, 377–406. 13 Ibid. 14 Kumar, R, and A Indrayan. 2002. “A Nomograma for Single-Stage Cluster-Sample Surveys in a Community for Estimation of a Prevalence Rate.” International Journal of Epidemiology 31(2):463–67. 15 Beaton GH, J Milner, P Corey, V McGuire, M Cousins, E Stewart, et al. 1979. “Sources of
Variance in 24-H Dietary Recall Data: Implications for Nutrition Study Design and Interpretation.” American Journal of Clinical Nutrition 32:2546–559. 16 Hanoi Medical University Department of Nutrition and Food Safety. 2004. Nutrition and
Food Safety. Hanoi, 12–18, 173–90.
17 Ha, HK. 1996. Op cit. 18 Hanoi Medical University Department of Nutrition and Food Safety. 2006. Manual on Nutrition Practicums in the Community. Hanoi, 15–55, 173–190. 19 Hanoi Medical University Department of Nutrition and Food Safety. 2004. Op cit. 20 Ha, HK. 1997. Op cit. 21 Vietnam Ministry of Health, National Institute of Nutrition. 2012. Op cit.

45
22 Luu, NH. 2001. “Population and Sampling in Research.” In Epidemiology and Practical Statistics in Scientific Research. Hanoi: Hanoi Medical University, 99–121. 23 Hanoi Medical University. 2006. Op cit. 24 Vietnam Ministry of Health, National Institute of Nutrition. 2007. Vietnam Food Composition Table. Hanoi: Medical Publishing House. 25 WHO. 2007. WHO Case Definitions of HIV for Surveillance and Revised Clinical Staging and Immunological Classification of HIV-Related Disease in Adults and Children. Geneva: WHO. 26 WHO. 2009. Nutritional Care and Support for People Living with HIV/AIDS: A Training Course. Participant’s Manual. Geneva: WHO. 27 Vietnam Ministry of Health, National Institute of Nutrition. 2010. General Nutrition Survey 2009–2010. Hanoi: Medical Publishing House. 28 Le, AT, and TBD Nguyen. 2005. “Study of Clinical and Sub-clinical Characteristics of HIV/AIDS Patients in Hanoi. Scientific Research on HIV/AIDS for the Period 2000–2005.” Practical Medicine Journal 528/529:176–79. 29 Kuria EN. 2009. “Food Consumption and Nutritional Status of People Living with HIV/AIDS
(PLWHA): A Case of Thika and Bungoma Districts, Kenya.” Public Health Nutrition 13(4), 475–79. 30 Nnyepi MS. 2009. “The Risk of Developing Malnutrition in People Living with HIV/AIDS: Observation from Six Support Groups in Botswana.” South African Journal of Clinical Nutrition 22(2):89–93. 31 Vorster HH, A Kruger, BM Margetts, CS Venter, HS Kruger, FJ Veldman, and UE MacIntyre.
2004. “The Nutritional Status of Asymptomatic HIV-Infected Africans: Directions for Dietary
Intervention?” Public Health Nutrition 7(8), 1055–64. 32 Tran, TBT, et al. 2010. Op cit.