NUTRITIONAL STATUS AND SURVIVAL IN THE SIEGE OF … · Kareem Daari Department of Medicine and...
89
1 NUTRITIONAL STATUS AND SURVIVAL IN THE SIEGE OF TURMANBURG-LIBERIA A thesis presented in partial fulfillment for the degree of Masters of Science in International Nutrition By Kareem Daari Department of Medicine and Therapeutics University of Aberdeen Medical School-Palwarth Building Foresterhill Aberdeen AB9 2ZD Scotland August 1999
Transcript of NUTRITIONAL STATUS AND SURVIVAL IN THE SIEGE OF … · Kareem Daari Department of Medicine and...
1
NUTRITIONAL STATUS AND SURVIVAL IN THE SIEGEOF TURMANBURG-LIBERIA
A thesis presented in partial fulfillment for the degree of Masters ofScience in International Nutrition
By
Kareem Daari
Department of Medicine and TherapeuticsUniversity of Aberdeen
Medical School-Palwarth BuildingForesterhill
Aberdeen AB9 2ZDScotland
August 1999

2
DEDICATION
In memory of my dear Mother who died when I was doing this work. Rest
In Peace Mum, I miss you.

3
Declaration
I declare that the following thesis has been put together entirely by myself,
under the supervision of Professor MHN Golden, and has not been accepted
in any previous application for a degree. The research and background work
leading up to the thesis was carried out exclusively by myself. Quotations
have been distinguished by quotation marks and all sources of information
have been specifically acknowledged.
4
Acknowledgements
First of all, I wish to thank my Government (Government of Ghana) for nominating me
for these studies in the University of Aberdeen. I also thank the Human Resource
Division, MOH, Ghana for recommending me for further studies.
I owe a special debt of gratitude to the World Health Organisation (WHO), for sponsoringme to do this course.
I wish to express my heart felt gratitude to all those who have worked to generate and
preserve the data upon which this work is based. Especially all the local staff of ACF and
the expatriate staff who worked with such dedication and commitment during the relieve
operation in Tubmanburg, Liberia.
Yvonne Grellety and Anne-Sophie Fournier of ACF Paris, need to be congratulated for
their foresight and ability to adapt the protocols for the treatment at the TFC’s in
Tubmanburg and also for mobilising human, material, and technical support for the
programme in Tubmanburg, Liberia. From the results of this study it is clear that their
professionalism prevented many deaths and alleviated misery, suffering, hunger and
disease in a population that has been totally besieged for months. Yvonne Grellety,
please convey to all those who supported you in this humanitarian venture, my deepest
appreciation and best wishes.
Isabelle Beauquesne of ACF deserves special mention. But for her leadership on the
ground (of the expatriate nurses), commitment, hard work, professional excellence and
bravery at the war front, nothing much could have been achieved at the TFC’s. She was
responsible for organisation and training of the local staff in a few short days. Her cool
ability shows through in the quality of the data that was available for this analysis. She
has

5
also generously provided photographs and the actual protocols formulated at the time of
this crisis.
Gille Couard, ACF logistics department was responsible for constructing the TFC,s in
Tubmanburg, and organisation of the water and sanitation facilities. He did a remarkable
job, without which, the story told in this thesis would not have happened. Gille, well done
and thank you.
I am extremely grateful to my supervisor, Prof. MHN Golden of the
Department of Medicine and Therapeutics, University of Aberdeen, first
of all for his technical support in making the operation in Tubmanburg
successful. Second, I have been delighted and privileged to have worked
under his supervision in this project. Privileged because of his extensive
(nutrition) research experience, contribution, personal commitment and
sacrifice to improve nutrition worldwide. The learning experiences that I
have gone through under him, are immense and extremely valuable. The
only way I can made him proud, is to apply this improved knowledge and
the skills I have gained to improve the nutrition of people in my home
country, Ghana, Africa and the International Community.
I also thank Dr. Geraldine McNeil ( Msc Human Nutrition) Course
organiser and Heather Peace ( Assistant Course Organiser), for their good
organisational skills to facilitate learning in the department. Without their
contribution, I could not come this far.
To all the numerous people who have facilitated my studies here, I say thank you.

6
Finally, I thank my wife and entire family for their sacrifice for my one-year stay here for
this noble venture.

7
Contents Page(s)
Dedication i
Declaration ii
Acknowledgement iii-iv
Contents v-vii
List of Abbreviations viii
Summary ix-x
Chapter 11.0 Introduction 1
1.1 Management of Severe malnutrition 3
1.2 Therapeutic foods 10
1.3 Mortality Risk Assessment 10
1.4 Background to the situation in Liberia 12
1.5 Hypothesis 16
1.6 Aims and objectives 16
Chapter 22.0 Materials and methods 17
2.1 Patients 17
2.2 Planned Protocol and criteria 17
2.2.1 Criteria for admission 17
2.3 Clinical Screening 18
2.4 Anthropometry 18
2.5 Medical Treatment 18
2.6 Diets 19
2.7 Outcome measures 22
2.7.1 Cured 22
2.7.2 Defaulters 23
2.7.3 Dead 23
2.7.4 Transferred 23

8
2.8 Follow-up 23
2.9 Patient records 24
2.10 Data Handling and storage 24
2.11 Statistical Analysis 24
Chapter 33.0 Results 28
3.1 The therapeutic feeding centres
after the relief of Tubmanburg 28
3.2 General Statistics 34
3.3 Coverage 34
3.4 Length of stay and timing of recovery 34
3.5 Nutritional Status on admission 36
3.6 Recovery Pattern 38
3.7 Cumulative weight gain (0-21days) 40
3.8 Clinical Signs 43
3.8.1 Infections 43
3.9 Mortality and Case fatality 53
Chapter 44.0 Discussion 56
4.1 Rate of Weight Gain 56
4.2 Rate of loss of oedema 58
4.3 Mean length of stay 58
4.4 Incidence and Treatment of Infections 59
4.5 Mortality rate 61
4.6 Conclusion 62
References 64-66
Original Protocol 67-71
Appendices 72-85
9
List of abbreviations
ACF-Action Contre le Faim
ECOMOG- Economic Community of West African States, peace keeping soldiers
ECOWAS- Economic Community of West African States
FAO-WHO-UNU-Food and Agricultural Organisation-World Health Organisation-
United Nations University
MUAC- Mid- Upper Arm Circunference
NCHS- National Centre for Health StatisticsORS- Oral Rehydration Salt
TFC- Therapeutic Feeding Centres
TM- Therapeutic milk
WHO- World Health Organisation
10
Summary
A civil war erupted in Liberia between from 1989 to September 1996, involving 5 main
warring factions. In August 1996, a cease-fire was signed between the warring factions,
and ECOMOG force were sent by the Economic Community of West African
States(ECOWAS) to monitor (actually enforce) peace.
In September 1996, a town, Tubmanburg, in Bomi County, 50km North of Monrovia (the
Capital), which was totally besieged for 4 months was relieved by Ecomog forces.
During the siege 19% of the population had died (57% of the children and 12% of adults).
About 30% of the remaining population were severely malnourished.
Two therapeutic feeding centres were set up by ACF, in Tubmanburg, to cater for the
large numbers of patients, most of them having oedema. The treatment period was
restricted to 7-8 hours per day, and patients returned “home” at night without supervision
or care. The standard treatment protocols had to be simplified and modified to the
restricted time period.
It was observed that there were remarkably few deaths and the rate of recovery was
excellent. To investigate this, clinical records of 918 consecutive patients were examined
in detail.
The case fatality rate was very low compared with other centres with better facilities. Of
918 patients treated, only 16 died (CFR,1.7%). Prudhon’s index was used to calculate the
expected number of deaths. Only 4 infants, 4 children and 2 juveniles died; the expected
number of deaths were 18,14 and 7 respectively (p<0.05 for each category). Six of 232
adults died.
The mean length of stay at the centre for all categories of patient was about 3 weeks. The
growth rate of patients was between 10-16 g/kg/day for each group, despite the restricted

11
feeding period. Diarrhoea & vomiting and fever were uncommon, however, a significant
number of patients had recorded hypothermia and anaemia.
The remarkable results of this study need to be replicated elsewhere to determine whether
the simple and relatively cheap techniques used in Tubmanburg can lead to a reduced
mortality in other circumstances.
12
Introduction
The major problems faced by people displaced by complex emergencies are insecurity
and malnutrition. The Liberian civil war (December 1989-September 1996), was one of
the major wars in Africa, South of the Sahara. Here health workers were confronted with
managing large numbers of severely malnourished people in highly insecure conditions.
During the Liberian Civil War, Liberian refugees were spread all over the West African
Sub-Region, in countries such as Guinea, Ghana, Cote d’Ivoire, and Nigeria. ‘Refugee’
has been defined under International convention as “any person who owing to well-
founded fear of being persecuted…is outside the country of his nationality…”(Toole and
Waldman, 1988). Concentrations of refugees are often characterised by low nutritional
status and poor environmental conditions (overcrowding, inadequate water, and lack of
sanitation), which promote the transmission of infectious diseases (Toole and Waldman,
1988).
The main causes of refugee death based on examination of the magnitude and the time
trends of crude, age –specific and cause -specific mortality rates in three refugee
emergencies in Somalia, Sudan and eastern Thailand are acute respiratory infections,
diarrhoeal diseases, measles and undernutrition (Toole and Waldman, 1988).
Considering the main causes of refugee deaths in emergencies, the definition of technical
principles for health interventions in refugee settings (Males S, 1996) are a multi-sectorial
approach; involving the refugees; meeting specific needs of refugee children and women;
instituting a simple and reliable health information system; and ensuring proper
management and co-ordination among all partners. Males S, 1996, emphasised that
health assistance in refugee situations takes place in a context which is complex and
comprises many variables. In addition to their qualifications and experience, health
professionals must also be aware of the global dynamics of a conflict situation. Their
13
leading principle should be that all human beings have the right to appropriate health
care.
One of the main causes of ill-health among refugees is malnutrition. Refugee camps have
a rapidly expanding population with a high prevalence of malnutrition, stretched logistic
services, poor kitchen, laboratory, sanitary and storage facilities, a shortage of skilled
manpower and major security problems. Therefore complicated treatment protocols for
severe child hood malnutrition which have been developed in metabolic wards of
research units need to be adapted for use in refugee camps (Briend and Golden,
1993).The median case fatality rate of severely malnourished children treated in hospitals
is 23.5%, a rate which has not changed for the last 50 years. This is probably related to
the use of inappropriate or even unsafe treatment protocols (Desjeux DF et al, 1998) .
A review of literature that has appeared over the past five decades indicate that the
median case fatality from severe malnutrition has remained unchanged over this period -
is typically 20-30% with the highest levels(50-60%) being among those with oedematous
malnutrition. A likely cause of this continuing high mortality according to Schofield and
Ashworth, 1996, is faulty case management. A survey of treatment centres
worldwide(n=79) by Schofield and Ashworth, 1996, indicate that for acutely ill children
inappropriate diets that are high in protein, energy, and sodium, and low in micronutrients
are common place. Brewster M and Manary M, 1995 also reported a case fatality rate of
malnutrition of over 30% at the Balantyre hospital nutrition ward and compared this to
their experience in the Gambia where the case fatality rate for 1078 cases of severe
malnutrition was 19.6 %. The principles of standard treatment are well known, but are not
being put into practice in many developing countries because of poor resources, support
and initiative (Brewster M and Manary M, 1995). They concluded that improvement of
hospital and clinic case management of severe malnutrition by standard treatment
protocols is an essential first step to reducing the high case fatality rates of severe
malnutrition.
14
This faulty case management of (oedematous) malnutrition (kwashiorkor) could be partly
attributed to the failure to accept that protein deficiency does not cause kwashiorkor
despite mounting evidence. This has led to the treatment with high protein diets
.Oedematous malnutrition in the child or adult is not caused by protein deficiency and in
kwashiorkor, the deficiency is more likely to be due to one or several type I nutrients,
particularly those involved in anti-oxidant protection (Golden, 1998).
Schofield and Ashworth, 1996, have recommended the use of appropriate treatment
regimens and updated treatment guidelines, which are practical and prescriptive rather
than descriptive, through a comprehensive training programme to achieve low mortality
levels from malnutrition.
1.1 Management of Severe malnutrition
Recommendations for the management of severe malnutrition are clearly spelt out
(Golden, 1996; WHO,1999). The principles of management according to WHO, 1999
include:
a) Initial Treatment(Phase I )- to treat or prevent hypoglycaemia and hypothermia;
to treat or prevent dehydration and restore electrolyte balance; to treat incipient
or developed septic shock if present; to start to feed the child; to treat infection;
to identify and treat any other problems including vitamin deficiency, severe
anaemia and heart failure.
b) Rehabilitation(Phase II- to encourage the child to eat as much possible; to
initiate and / encourage breast feeding as necessary to stimulate emotional and
physical development and to prepare the mother or carer to continue to look
after the child or patient after discharge.
c) Follow-up- to ensure complete rehabilitation and preventing the recurrence of
severe malnutrition.
The treatment of severe malnutrition has therefore been divided into phases based
on these management principles

15
Treatment protocols including therapeutic foods have been developed (WHO,1999;
Desjeux DF et al, 1998) aimed at reducing case fatality rates of severe malnutrition
especially during humanitarian crises . The therapeutic foods are F-75 and F-100. The F-
75 (75 Kcalth or 315 kJ/100 ml) is used during the initial Phase of treatment, while the F-
100 (100 Kcalth or 420 kJ/100 ml) is used during the rehabilitation phase, after the
appetite has returned. The design of these formula diets have taken into account the fact
that almost all severely malnourished children have infections, impaired liver and
intestinal function and problems related to imbalance of electrolytes when first admitted
to hospital. Because of these problems, they are unable to tolerate the usual amounts of
dietary protein, fat and sodium.
In theory, low-protein diets are preferable at the beginning of treatment when there are
signs of hepatic insufficiency, whereas higher protein ,energy –dense diets are needed
during the recovery phase for rapid catch-up (Jackson and Golden,1987). For practical
purposes of rehabilitation in refugee camps, a standard formula of 80g dried skimmed
milk, 50g sugar and 60g oil per litre feed was recommended at a meeting in Paris, May
1993, on the treatment of severe childhood malnutrition amongst refugees, hosted by
Medicins Sans Frontiere with Epicentre and the Institut National de la Sante et de la
Recherche Medicale (INSERM Unit 290) ( Briend and Golden, 1993). Its energy density
of 1 kcal/ml , according to Briend and Golden, 1993 is sufficient for rapid catch- up
growth and could be used for all phases of treatment. This is the F-100 diet.
Collins S et al, 1998, compared the effect of two diets differing primarily in protein
content, on the nutritional rehabilitation of malnourished adults in the Concern
Worldwide adult Therapeutic feeding centre, in Baidoa, the town at the Epicentre of the
1992 famine in Somalia. The response to treatment in 573 patients admitted to the center
between November 1992 and March 1993 was studied. Mortality, appetite, rate of
oedema loss and weight gain in two groups of patients receiving either a higher- protein
(16.4% of energy from protein) or lower protein (8.5 % of energy from protein) diet were
compared. Among oedematous patients the use of the lower protein diet during the initial
phase of treatment was associated with a three fold decrease in mortality (P<0.05) and

16
accelerated resolution of edema (P<0.05). Among marasmic patients, no differences in
mortality or rate of weight gain were observed.. The large reduction in mortality
associated with the use of lower protein diet in oedematous patients appeared to be due
to the lower amount of dietary protein. However differences in the 2 diets other than or in
addition to the protein content may have contributed. The data obtained by Collins S et al,
1998, therefore suggested that severely malnourished adults particularly those with
oedema recover more successfully with a diet of lower protein content than usually
recommended.
Collins S et al, 1998 have also reported that due the extreme levels of disruption and
insecurity, the mean rate of weight gain (5-6 g/kg/day) during the recovery phase of
rehabilitation probably represent the lower end of the spectrum of reasonable rates of
weight gain in adults recovering from severe malnutrition. This rate of weight gain was
compared to the rate of weight gain of severely malnourished ex-inmates of the Sanbostel
concentration camp receiving 31.5 MJ and 297 g protein/day (PE 15.8% ) and gained ~
7.0g/kg/day.
However, in children recovering from severe malnutrition the maximum rate of weight
gain reported is 10-20 g/kg/day (Waterlow,1993). WHO, 1999, has also reported a rate of
weight gain of about 10- 15 g/kg/day. A child who does not gain at least 5 g/kg/day for 3
consecutive days is failing to respond to treatment
Graham et al, 1996 evaluated the adequacy of protein intakes now recommended as safe
for infants and toddlers using malnourished infants aged 5.3 to 17.9 months, length age
(LA) 2.5 to 6.4 months, weight age (WA) 1.5 to 5.2 moths, weight /length (WL) 78% to
100% of the National Centre for Health Statistics Data; and age 11.4 to 31.6 months, LA
6.1 to 17.9 months, WA 3.9 to 12.9 months, W/L 79 % to 99%.
Infants were assigned at random to formulas with 5.5% ,6.7%, or 8.0% energy as 60:40
whey:casein protein. The 5.5% was based on FAO-WHO-UNU safe protein and average
energy for ages 2.5 to 6.0 months. Toddlers received 4.7 % (recommended for 6-18
months), 6.4 ,or 8.0%. intakes were adjusted weekly to reach, in 90 days, the 50th
17
percentile or weight for a LA 3months greater than the initial one. The results obtained
indicate that there were no significant protein-related differences in growth. In both
infants and toddlers , high energy intake resulted in obesity, with lean body mass still
deficient. Protein intakes two SD below the mean in the lowest protein/energy cells,1.5 g.
kg-1. d-1 for infants and 1.1 g times kg-1. d-1 for toddlers should still be safe for nearly all
children of comparable biological ages.
Earlier on Golden,1982 studied 6 different diets given to 103 children with oedematous
malnutrition, and found out that the rate of loss of oedema was strongly correlated with
the dietary energy intake(r=0.75) but not with the protein intake (r=0.03). 66 patients with
a very low protein diet (2.5% protein energy) lost oedema as fast as those given 5 times as
much protein. The energy intake above which oedema resolved and below which oedema
accumulated was 245-270 KJ/kg/day. This energy level is approximately the basal
metabolic rate of a malnourished child. If the intake falls below this the child cannot
achieve energy balance by cessation of growth and activity. Many children after infection
fail to achieve this reduced intake, so that, not withstanding the other components of the
diet, they would be primed to develop oedematous malnutrition. Golden , 1982,
explained that because energy deficiency is not invariably associated with oedema, it
cannot be the only factor involved, and the other necessary dietary component(s) must
therefore have been present in surfeit in all the therapeutic diets. This could be potassium
together with factors necessary for its retention.
Between 1 February 1987 and 31 May 1988. Pecoul B. et al (1992) conducted
an evaluation of a nutritional rehabilitation centre in Tahoua, Niger. Among the 381
children admitted to the centre, 61 (16%) had kwashiorkor and 347 (91.3%) were aged
between 6 and 29 months. Recovery and death rates were 46.2% and 14.4%, respectively.
The median duration of stay until recovery was 21 days. Sixty-two per cent of deaths
occurred during the 1st week of hospitalization. Three risk factors for death were
identified by the study: patients with kwashiorkor with a weight/height (W/H) less than -3
SD, those with marasmus with a W/H less than -5 SD, and those dehydrated with

18
marasmus. Among children included in the follow-up study after leaving the centre, the
risk of dying during the follow-up period among children who absconded was 7.1 times
higher than the risk observed among children who recovered. Among the children who
recovered, no relapse was observed 3-18 months after they left the centre. This
investigation indicates the importance of intensive therapeutic feeding centres in areas
with a high prevalence of malnutrition.
What criteria then, can be used to measure the adequacy of a diet as a
whole?.Golden,1996, has tried to answer this question in using the type II nutrient
concept to improve dietary supplementation. The gross inefficiency of supplementary
diets is almost universal as reported by Beaten and Ghassemi,1982. Golden, 1996
explained that when a dietary supplement is given which does not contain all nutrients
required for new tissue synthesis, the rate of growth and the efficiency of growth will be
determined by the most limiting nutrient in the new diet(basic diet plus supplement), not
in the original diet or in the supplement alone. If an unbalanced supplement is given the
other nutrients in the supplement will be used inefficiently, just as a diet with protein
which has an amino acid score of zero., because it lacks an essential amino acid, is totally
useless and wasted. The degree of inefficiency is related to the magnitude of the
imbalance between the actual limiting nutrient in the diet as a whole and the nutrient
under consideration. When we observe an inefficient use of a nutrient or energy, we can
infer that the diet may be imbalanced with respect to one of the type II nutrients that is
limiting growth and efficiency, particularly potassium, magnesium, zinc and available
phosphorus. As supplementation trials concentrate on supplying protein and energy while
ignoring these type II nutrients e.g. potassium, magnesium, zinc and phosphorus it is
therefore not surprising that these trials are characterised by gross inefficiency
(Golden,1996).
Apart from growth promotion, Zn also plays a role in maintaining appetite. WHO,1999,
has empasised that in the phases of treatment of severe malnutrition outlined above, the
child’s appetite and general condition are the determinants of the phase of treatment and

19
not the length of time since admission. Thus if the child’s appetite improves, treatment
has been successful and the initial phase of treatment end when the child becomes
hungry. This also indicates that infection is under control, the liver is able to metabolise
the diet and other metabolic abnormalities are improving.
During treatment, as whole tissue has been lost, all the components for the tissue to be
resynthesised need to be given irrespective of the cause of the negative balance and
weight loss (Golden, 1996).
Some relief foods for emergencies lack some of these type II nutrients. Analysis of relief
food during the drought relief operation in Ethiopia, May-August 1985, showed that
because of food refinement, 6 out of 10 samples of cereals contained too little potassium
and magnesium (Machaelsen and Clause,1987). Potassium and Magnesium required for
protein synthesis, growth and tissue repair, yet they are deficient in some relief foods.
Oedema
Dempster et al, 1995, employed bleomycin assay method for the quantitation of free or
loosely bound iron in venous blood samples of 50 children on admission with
kwashiorkor, 6 with marasmus and 12 healthy well nourished controls. Non protein
bound iron was found in the plasma of 58% of the patients with kwashiorkor, but not in
any of the other children. In further studies, Sive et al,1997 related the plasma
concentration of ‘free’ iron to the degree of oedema in patients with kwashiorkor. The
degree of oedema was made by a single observer and recorded as mild (+), moderate (++)
or severe (+++). Patients with severe oedema had generalised swelling of the face and
limbs. Finger pressure of the legs left an indentation of at least 0.5 cm in depth. Oedema
was assessed as mild when pitting of the legs could just be detected whereas patients with
moderate oedema had readily detectable oedema which was intermediate between mild
and severe bleomycin-detectable-iron was significantly higher in the patients with severe
oedema(20.5 v 6.75 umol/l whereas the albumin concentration were similar (16 v 17 g/l).
Bleomycin-detectable-iron was no longer present in any patient 30 days after admission..
Sive et al,1996, therefore concluded that ‘free’ circulating iron may contribute to the
oedema of kwashiorkor, and its sequestration could hasten recovery and decrease

20
morbidity and mortality. This study confirms the poor correlation between the plasma
albumin concentration and the degree of oedema or plasma transferrin concentration . The
oedema often resolves despite continued hypoalbuminaemia, during recovery. Leaky cell
membranes, low capillary filtration rate, which appear to be unique manifestation of
kwashiorkor, and free radicals which may increase the permeability of capillaries could
all contribute to the oedema.
These data strongly support the hypothesis of Golden and Ramdath, 1987 of a dominant
role for free radicals in the pathogenesis of kwashiorkor.
The lack of full understanding of the cause of oedema, has frequently led to faulty case
management. Schofield and Ashworth, 1996, found out that practices such as prescribing
diuretics for oedema were found to be widespread and could have fatal consequences.
1.2 Therapeutic foods
The evaluation of the use of F-100 containing 100 Kcal/100 ml with 10% of its energy
derived from proteins, low in sodium and iron content but fortified with vitamins and
minerals, indicates that standardised use of F100 can markedly reduce mortality of
severely malnourished children (Desjeux DF et al, 1998). In refugee camps according to
Desjeux DF et al, 1998, F-100 was used according to strict protocol and adapted to local
conditions. Intakes started at 100 Kcal/kg/day and reached 200 Kcal/kg/day once appetite
was restored. A model to assess the risk of death according to weight, height and oedema
was developed, and the first results indicated mortality was below 5%.
1.3 Mortality risk assessment

21
Prudhon et al, 1996, showed that the risk of death among severely malnourished children
treated in therapeutic feeding centres was related to their anthropometric status on
admission assessed by a simple combination of weight and height (Optimal Ratio of
Weight to power of Height or ORWH, weight(kg)/ height (m) 1.74 ) and Oedema. They
compared different anthropometric indices based on weight and height to predict the risk
of death among severely malnourished children. Anthropometric data of 1047 children
who survived were compared with those of 147 children who died during treatment in
therapeutic feeding centres set up in African countries in 1993. The optimal ratio of
weight to height determined by logistic regression was weight (kg)/ height (m) 1.74 (95 %
confidence interval β estimate 1.65-1.84).
Prudhon et al, 1996, also observed that anthropometric indices seem to have a better
predictive value for mortality among children without oedema than those with oedema.
This was attributed to the fact that metabolic abnormalities such as hepatic dysfunction,
immuno- competence, and electrolyte disturbance are more commonly in oedematous
children. Also the weight recorded on admission includes the weight of oedema fluid;
thus, oedematous children are likely to have the severity of the tissue wasting
underestimated to the extend that it is itself dependent upon the degree of oedema and
hence to be highly variable.
The treatment of dehydration and infection in severely malnourished children in refugee
camps has also been clearly stated (Briend & Golden 1993; WHO 1999).
In the treatment of the dehydration, the use WHO oral rehydration salt (ORS) solution
was carefully considered. Because severely malnourished children are deficient in
potassium and have abnormally high levels of sodium, the ORS solution should contain
less sodium and more potassium than the standard WHO recommended solution.
Magnesium, Zinc and copper should also be given to correct these deficiencies (WHO,
1999). The sodium content of WHO ORS (90 mmol/l) is sufficiently high to induce heart
failure in severe malnutrition particularly the oedematous form of malnutrition and the

22
potassium concentration (20 mmol/l) is too low to match the stool output of severely
malnourished children (Briend & Golden, 1993). Considering this, ReSoMal , ORS
solution for severely malnourished is recommended. ReSoMal can also be made by
diluting the standard WHO-recommended ORS in 2 litres of water, instead of 1 litre, and
adding 50g of sucrose (25g/l) and 40 ml (20 ml/l) of mineral mix solution ( WHO,1999).
It is recommended that because of the difficulty in assessing dehydration in severely
malnourished children particularly those with oedema, only those signs related to intra-
vascular volume contraction should be used. Except in hypovolaemic shock, these
children should only be rehydrated orally (Briend & Golden 1993; WHO 1999).
Nearly all malnourished children have infections and bacterial overgrowth of mucosal
surfaces which are difficult to diagnose clinically. Therefore early treatment with
antibiotics, appropriately prescribed for defined clinical infections, has an important role
in decreasing mortality and improving the nutritional response to feeding (Golden &
Briend, 1993)
Drug dosages for the treatment of infections have therefore been prescribed by WHO,
1999.
The extent to which these recommendations can be carried out, given the logistic, security
and personnel constraints, as well as the initial state of the patients, determines the
outcome of patients presenting to therapeutic feeding centres with severe malnutrition
under such disaster and famine situations as occurred during the Liberian civil war.
1.4 Background to the situation in Liberia in 1996
In December 1989, civil war broke out in Liberia: involving 5 main factions: Charles
Taylor’s NPFL, Roosevelt John’s ULIMO-J, Alhaji Kroma’s ULIMO-K, Georges Boley’s
LPC and General Bowen’s AFL, and continued, uninterrupted, for the ensuing 7 years.
23
In August 1996, after several years of violent fighting, a cease-fire was signed between
the warring factions in Abuja, Nigeria. A transitional government (Council of State), was
put in place including the 5 faction leaders, and Ruth Perry a former senator, was
nominated as the chairperson. The Council of State was tasked with demobilising and
dissolving the factions and to organise elections in May 1997.
During the transitional period, soldiers (ECOMOG force), were sent by the Economic
Community of West African States (ECOWAS) to monitor (actually enforce) the peace
process and progressively take control of the entire territory pending return to civilian
rule.
In September 1996, a town, Tubmanburg, Bomi county, which had been totally besieged
for over 4 months by the fighting forces was relieved by Ecomog forces. Initially, an
assessment mission was conducted by a joint UN-NGO team in Tubmanburg, Bomi
County. Tubmanburg is a city located 50 km North of Monrovia, the capital(Nabeth P et
al,1997). The assessment team found very large numbers of severely malnourished
children, adolescents and adults – with an initial assessment of over 1000 severely
malnourished people in urgent need of care. Three therapeutic feeding centres were
immediately established, two by Action Contre la Faim and one by Medcines Sans
Frontiere. Whilst ACF and MSF established emergency treatment facilities an
epidemiologist was engaged to do a detailed survey of the town to determine the extent of
mortality from the siege and its effect upon the demographic profile. This was done by Dr
Pierre Nabeth about 3 weeks after the start of the relief operation by ACF, between
October 4 and October 10, 1996, and showed the extent of the privation that the citizens
of Tubmanburg had suffered. Professor Michael Golden visited Tubmanburg from the
12 – 18th October 1996 to do a clinical assessment of the patients and the citizens of the
town in order to investigate a report by Nabeth that there was epidemic Beriberi in the
county. This turned out to be an incorrect interpretation by the epidemiological team,
and the cause for the epidemic oedema was kwashiorkor.
24
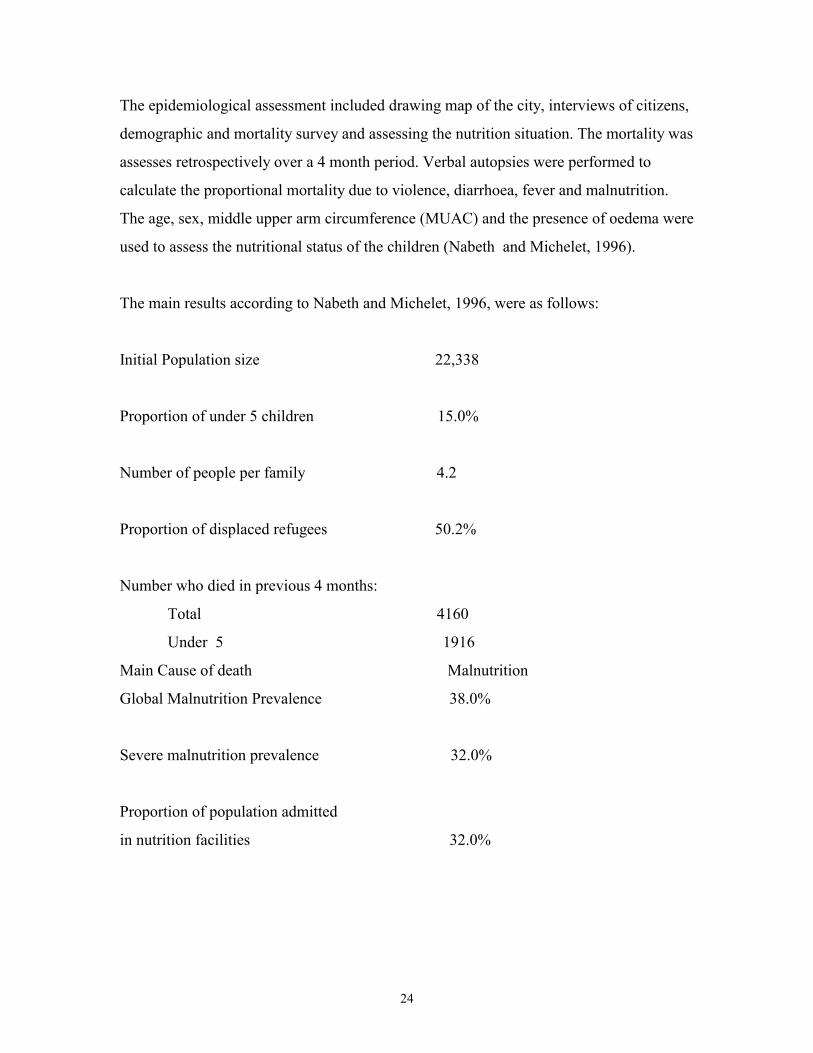
The epidemiological assessment included drawing map of the city, interviews of citizens,
demographic and mortality survey and assessing the nutrition situation. The mortality was
assesses retrospectively over a 4 month period. Verbal autopsies were performed to
calculate the proportional mortality due to violence, diarrhoea, fever and malnutrition.
The age, sex, middle upper arm circumference (MUAC) and the presence of oedema were
used to assess the nutritional status of the children (Nabeth and Michelet, 1996).
The main results according to Nabeth and Michelet, 1996, were as follows:
Initial Population size 22,338
Proportion of under 5 children 15.0%
Number of people per family 4.2
Proportion of displaced refugees 50.2%
Number who died in previous 4 months:
Total 4160
Under 5 1916
Main Cause of death Malnutrition
Global Malnutrition Prevalence 38.0%
Severe malnutrition prevalence 32.0%
Proportion of population admitted
in nutrition facilities 32.0%
25
The security situation was particularly hazardous. The relief teams could only work in
Tubmanburg from about 9 or 10 am until 4 p.m. due to the large numbers of road blocks
on the route from Monrovia, the capital 50 km away and the necessity of travelling on a
daily basis. The residents of the TFCs could not therefore be fed at night. The fighters
invaded the TFCs when the expatriate staff had left and took any available food for
themselves. Any residents who went home did not take any food with them because if it
was known that they were carrying food then the fighters would attack them to get the
provisions.
The role of military intervention by peace-keeping and peace-enforcement troops in the
provision of humanitarian aid to Liberia during the armed conflicts is seriously
questioned. The usefulness of military interventions in humanitarian emergencies is
debated especially the context of the role of the de facto safe haven which peace-keeping
and enforcing troops protected in Liberia between 1990 and 1996. It is argued that the
safe haven enabled significant humanitarian achievements but also demonstrated
fundamental failures. Central to these failures have been the absence of consent, under-
resourcing and a loss of control of the safe haven to factional interests (Outram Q, 1997).
Given these circumstances, where very large numbers of patients had to be managed
under conditions of extreme insecurity, it was observed that there were remarkably few
deaths in comparison to patients treated in other parts of Africa, and the rate and extent of
recovery were excellent. It is the objective of this project to examine the records of these
patients in detail and to compare the outcome of the patients from Tubmanburg with
those from other centres in Liberia and West Africa where much better facilities existed.
The clinical records of over 600 patients treated in ACF’s therapeutic feeding centres
after ECOMOG relieved the siege of Tubmanburg were transported back from Liberia to
Aberdeen by the staff of ACF in Liberia and Paris.
26
1.5 Hypothesis
The mortality rate was significantly lower and the rates of recovery comparable to other
centres which were able to provide 24h care in a more secure environment.
1.6 Aims/Objectives
It is the objective of this project to examine the records of these patients in detail and to
compare the outcome of the patients from Tubmanburg with those from other centres in
Liberia and West Africa where much better facilities existed.
27
2 Materials & Methods2.1Patients
The study was carried out using 920 patient records from two therapeutic feeding
centres in Tubmanburg (Bomi County, Liberia) from September 1996 to January 1997 .
2.2 The planned protocol and criteria were as follows:
2.2.1.Criteria for admission The admission criteria generally used in the centres were 1) the weight/height index of <
70 percent of the median National Centre for Health Statistics (NCHS) standard 2) the
presence of oedema in both feet or 3) a mid upper arm circumference (MUAC) of < 110
mm. For details see appendice 1-5
Patients who meet this citeria were registered and admitted .
The admission criteria used for the different categories of patients were:
i) Children < 5years
MUAC < 11cm and or weight/height < 70% of the median NCHS standard and or
oedema(2+ or 3+ grades). ). Identification: Red bracelet
ii) Children >5years
Weight/height < 70% of the median NCHS standard and or oedema(2+ or 3+ grades).
Identification: Blue bracelet
iii) Adults
Marasmus or oedema(2+ or 3+ grades). Identification: green bracelet
iv) Lactating Mothers.
Mothers were admitted where they had a malnourished baby of less than 4
months.
v) Others
28
Brothers or sisters of severely malnourished children were admitted to the centre along
with their mother – if they were malnourished they were treated as patients according to
the above criteria, otherwise they were fed with porridge and family meals.
2.3Clinical ScreeningAll patients presenting to the centre were immediately screened by a trained local
admitting officer or nurse to assess the degree of oedema, body temperature, dehydration,
respiratory rate, anaemia, diarrhoea, vomiting, signs of chest infection, ascites and
dysentry and have anthropometric measurements made.
2.4AnthropometryPatients age, sex, weight, height, and MUAC were determined on admission. Daily
weights were taken in phase one and on alternate days in phase two until discharge.
Height and MUAC were also measured on discharge.
The daily weighing of adults, however could not be done because of the heavy workload
on the staff and the lack of suitable scales and height measuring equipment in the centre
at this time.
2.5Medical TreatmentA registration team made up of nurses and clinicians identified all very sick children e.g.
with severe dehydration, diarrhoea and vomiting for priority treatment. Identification
bracelets were given on registration to all categories of patients. Mothers of children
admitted were briefed on how the TFC is run and also asked to identify newly admitted
children and relapsed children due to bad follow up after discharge to complete
rehabilitation
A protocol of treatment was followed for patients on admission. All children without
oedema were given ORS SM ( renamed ReSoMal by WHO, 1999)- (5ml/kg/hr) and
children with oedema given water with sugar( 5g sugar/100 ml water)- (5ml/kg/hr). This
was done to prevent or treat hypoglycaemia or dehydration. All severely malnourished
29
children are at risk of developing hypoglycaemic (blood glucose <54mg/dl or 3mmol/l),
an important cause of death during the first 2 days of treatment(WHO,1999) or
dehydrated on admission because they are often transported over long distances to
treatment centres without being fed for 4-6 hours. Care was taken not to give children
with oedema the ORS-SM, because salt in the ORS-SM can increase the oedema if the
child has no history of diarrhoea
All patients on admission were dewormed, except those < 1 year using mebendazole
(dewormer).For children 1-2 years, 2 tablets of mebendazole were given, once and for
children > 2 years, 2 tablets per day for 3 days were administered.
2.6DietsThe diet of patients for phase I, II and III consisted mainly of F-100 Therapeutic Milk
(TM) which were prepackaged into sachets (manufactured by Nutriset Company, France)
and transported to Liberia by air freight. Each sachet of F100 contained 456 g of the dry
F100 formula; it was manufactured from skim milk powder, vegetable fat, dextrin-
maltose, and a mineral & vitamin complex.
The therapeutic milk was prepared for feeding by following the instructions on the
sachets. The contents of each sachet of TM was added to 2 litres of boiled water, and
mixed, to obtain 2.4 litres of F-100 for use in therapeutic feeding programmes.
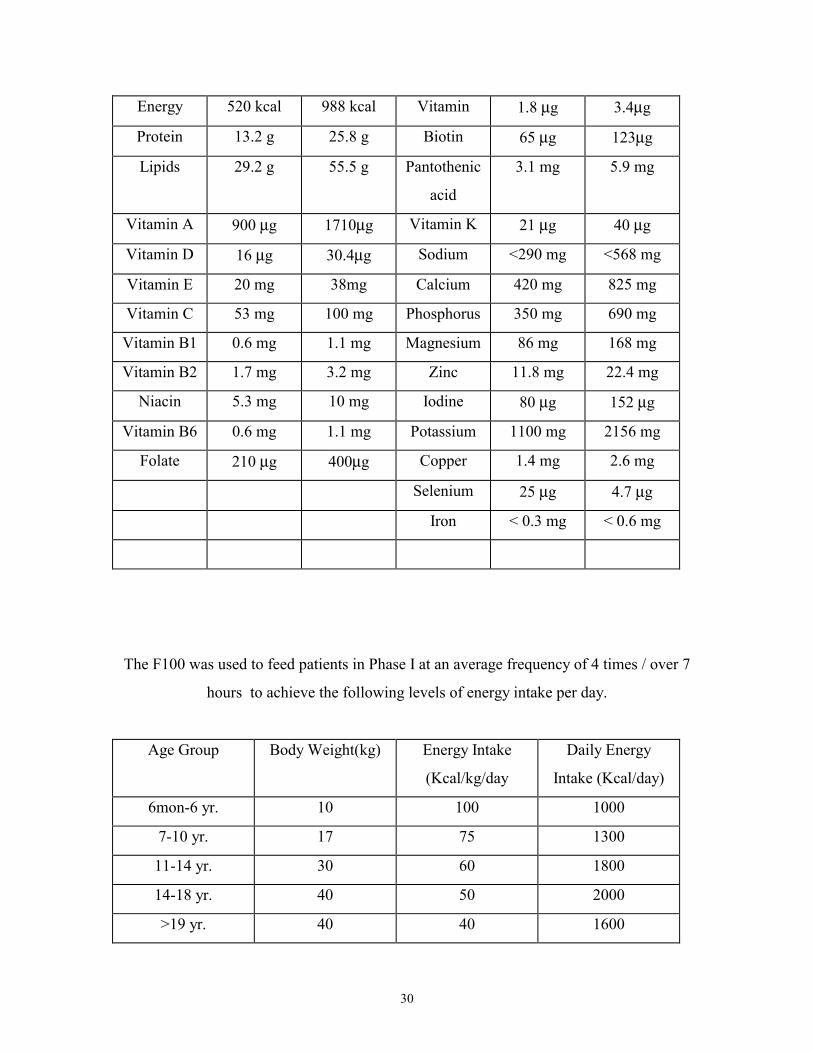
The composition of the F100 was as follows:
Nutrient Per 100 g
Powder
Per litre of
Prepared
F100
Nutrient Per 100 g
Powder
Per litre of
Prepared
F100
30
Energy 520 kcal 988 kcal Vitamin 1.8 µg 3.4µg
Protein 13.2 g 25.8 g Biotin 65 µg 123µg
Lipids 29.2 g 55.5 g Pantothenic
acid
3.1 mg 5.9 mg
Vitamin A 900 µg 1710µg Vitamin K 21 µg 40 µg
Vitamin D 16 µg 30.4µg Sodium <290 mg <568 mg
Vitamin E 20 mg 38mg Calcium 420 mg 825 mg
Vitamin C 53 mg 100 mg Phosphorus 350 mg 690 mg
Vitamin B1 0.6 mg 1.1 mg Magnesium 86 mg 168 mg
Vitamin B2 1.7 mg 3.2 mg Zinc 11.8 mg 22.4 mg
Niacin 5.3 mg 10 mg Iodine 80 µg 152 µg
Vitamin B6 0.6 mg 1.1 mg Potassium 1100 mg 2156 mg
Folate 210 µg 400µg Copper 1.4 mg 2.6 mg
Selenium 25 µg 4.7 µg
Iron < 0.3 mg < 0.6 mg
The F100 was used to feed patients in Phase I at an average frequency of 4 times / over 7
hours to achieve the following levels of energy intake per day.
Age Group Body Weight(kg) Energy Intake
(Kcal/kg/day
Daily Energy
Intake (Kcal/day)
6mon-6 yr. 10 100 1000
7-10 yr. 17 75 1300
11-14 yr. 30 60 1800
14-18 yr. 40 50 2000
>19 yr. 40 40 1600
31
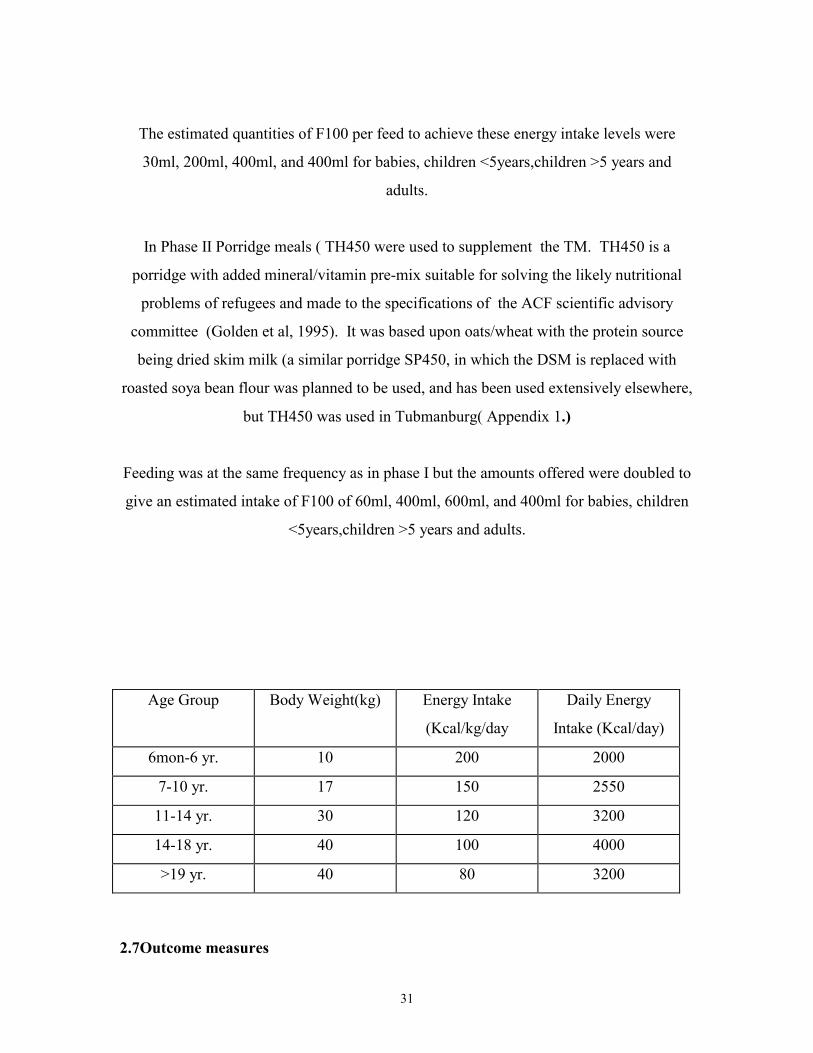
The estimated quantities of F100 per feed to achieve these energy intake levels were
30ml, 200ml, 400ml, and 400ml for babies, children <5years,children >5 years and
adults.
In Phase II Porridge meals ( TH450 were used to supplement the TM. TH450 is a
porridge with added mineral/vitamin pre-mix suitable for solving the likely nutritional
problems of refugees and made to the specifications of the ACF scientific advisory
committee (Golden et al, 1995). It was based upon oats/wheat with the protein source
being dried skim milk (a similar porridge SP450, in which the DSM is replaced with
roasted soya bean flour was planned to be used, and has been used extensively elsewhere,
but TH450 was used in Tubmanburg( Appendix 1.)
Feeding was at the same frequency as in phase I but the amounts offered were doubled to
give an estimated intake of F100 of 60ml, 400ml, 600ml, and 400ml for babies, children
<5years,children >5 years and adults.
Age Group Body Weight(kg) Energy Intake
(Kcal/kg/day
Daily Energy
Intake (Kcal/day)
6mon-6 yr. 10 200 2000
7-10 yr. 17 150 2550
11-14 yr. 30 120 3200
14-18 yr. 40 100 4000
>19 yr. 40 80 3200
2.7Outcome measures
32
The outcome of the therapeutic feeding and treatment was categorised as cured, defaulter,
dead or transferred.
2.7.1CuredThe target weight for discharge was –1.5 SD(85%) of the median NCHS/WHO reference
value for Weight-for-Height, although this was sometimes not achieved because of the
pressing nature of the large numbers of patients that had to be catered for. The children
were weighed daily or on alternate days and the weights plotted on a graph incorporated
into the fiche. All children who attained >80% of the median NCHS/WHO reference
value for Weight-for-Height, however were considered “cured” and eligible for discharge
provided that the weight was confirmed over 3 consecutive readings each on alternate
days. By this time most patients had continued to gain weight to the target weight for
discharge These criteria were to judge different categories of patients fit for discharge:
i)Children <5 years were considered cured if they attained a MUAC >11cm and Weight-
for-Height >80% of the median NCHS standard (after 3 consecutive weights) and no
oedema for at least 15 days.
ii)For children >5 years, they were considered cured if they attained Weight-for-Height
>80% of the median NCHS standard (after 3 consecutive weights) and no oedema for at
least 15 days.
iii) It was planned that adults who attained a body mass index ( BMI) of 16 kg/m2 and
were able to walk was fit for discharge. However, the criteria were changed to absence of
oedema for 15 days, good appetite, ability to walk strongly and showing obvious clear
improvement clinically.
2.7.2Defaulters
33
A patient was considered a defaulter if he/she did not attend the TFC for 4 consecutive
days. If he or she come back after 4 days he is readmitted as a new case with a new
number.
2.7.3Dead All deaths at the centres were recorded.The cause of death of all patients who died was
also investigated and recorded.
2.7.4TransferredAll cases that needed special attention were referred to the Capital Monrovia and were
considered transferred.
2.8 Follow up
When a patient was discharged from the Therapeutic Feeding Center, they were
automatically admitted to the “Wet” Supplementary feeding centers (where all those
residents of Tabmanburg who were not eligible for admission to the TFC were initially
treated). At these centers they were given a daily ration of “family” food fortified with
oil – this was eaten at the center because of the security situation. The patients from the
TFC were “followed” whilst in the SFC (average stay was for about 2 months) and if they
relapsed or deteriorated, they were readmitted to the TFC for further treatment.
2.9Patient RecordsIt was planned that data on age, sex, date of admission, weight, height, oedema would be
recorded for all patients on day of admission. MUAC on admission and discharge, daily
weight until discharge and height (on admission and discharge) were also recorded . The
health status of patients was constantly monitored and recorded on the fiche from
admission until discharge. In particular, diarrhoea, vomiting, body temperature,
34
dehydration, respiratory rate and pallor of patients were monitored daily from admission
until discharge.
2.10 Data Handling and Storage:
Data of patients admitted and treated at therapeutic feeding centres were collected on
Action Contre la Faim (ACF) treatment cards for therapeutic feeding centers (“fiche”).
The completed records were transported to the ACF base in Monrovia and brought back
to Yvonne Grellety in Paris by the returning expatriate volunteers in order to monitor the
progress of the center. They were then sent to Aberdeen for formal analysis and appraisal
in the Department of Medicine and Therapeutics, University of Aberdeen by Professor
Michael Golden.
2.11Statistical Analysis
Data from 920 records of patients admitted and treated at therapeutic feeding centres in
Tubmanburg were entered into an Excel spreadsheet using a proforma format used in the
Department for the analysis of data from other centres.
The main measures from the treatment cards entered were age, sex, date of admission and
discharge, outcome (discharged, transferred, died, abandoned), number days of diarrhoea
from admission, number of days of vomiting, body temperature measurements(< =35.5-
hypothermia,>= 39-fever), number of days of dehydration, number of days of a rapid
respiratory rate, number of days with pallor, days in phase one, days in phase two, care
practices (IV fluids given, Use of NG tube, diets used e.g. F75, F100, porridge,
breastfeeding etc.), oedema, MUAC on admission and discharge, daily weight until
discharge and height (on admission and discharge). An additional record was made in the
case of these data of the date of the first weight record taken, so that the extent of the
missing data could be assessed.
35
From the Excel entries, Software programs had been written in RS1 relational database
for the specific analysis of these data were used to generate the following variables:
Anthropometric variables, WHZ, HAZ, WAZ, on “admission” and at the time of
minimum weight, maximum weight and at discharge.
Dmin1 - the first date that the minimum weight was recorded.
Dmin2 – the last date that the minimum weight was recorded.
Dmax – the date of the maximum weight
Dlst – the date of the last weight recorded (equivalent to the discharge weight).
wt0lr8 - value of weight at time of minimum weight using the constant from the
regression equation of the weights measured over the subsequent 7 days (this technique
was used to adjust “minimum” weight on the grounds that the actual lowest recorded
reading is more like to have been an error).
rwglg8- rate of weight gain (g/kg/d) from day 0 to day 7 (8 points) calculated by linear
regression analysis
P8- probability value for linear regression being significant (rate of weight gain reliable –
values for the rate of weight gain assessed by linear regression where the line did not
reach significance were not used in the analysis)
rwglr- rate of weight gain from day 0 to day 14 (15 points) calculated by linear
regression analysis in a similar fashion to the assessment over the first 7 days.
rwgmax- rate of weight gain (g/kg/day) from minimum weight to maximum weight

36
rwglst- rate of weight gain (g/kg/day) from minimum weight to Last
weight (Discharge).
cwg 0-21-cumulative weight gain on each day from minimum weight measured in g/kg.
This is obtained by doing a linear interpolation of the weights for the alternate days so
that a “weight” is present for each day after admission. The increment from the minimum
weight is then taken and expressed in terms of grams gained per kilo of initial body
weight. This procedure was repeated for each of the first 21 days from the minimum
weight. It should be noted that this number is ten times the percentage weight gain since
admission (i e grams per kilo instead of grams per 100 grams).
Pru_oa. - This program calculated the Prudhon’s probability of death from the equations
given in Prudhon et al (1997). The risk of death is higher in the presence of oedema.
Thus, in order to obtain a conservative estimate of the number of children who would be
expected to die, where the presence or absence of oedema is not recorded on the fiche, we
have assumed that oedema was absent. In reality many of the patients had oedema and
thus the computed prudhon’s index represents the minimum number of expected deaths.
The program also generates the 95% confidence intervals for the expected count of dead
children assuming a Poisson distribution. Where the observed number of deaths lies
outside these confidence intervals, this is thus significant at the 5% level.
Further statistical analysis was done using Systat and SPSS.
37
3.Results3.1 The therapeutic feeding centers after the relief of Tubmanburg
When the ECOMOG forces relieved Tubmanburg, the population who had not died was
in a critical state. The agencies ACF and MSF were faced with many thousands of
malnourished individuals who had to be treated simultaneously. Some were transferred
to Monrovia in the first day of relief before any system could be organised and the TFCs
opened. There is some confusion about exactly how many were actually evacuated at this
time – it is thought that about 30 were brought to Monrovia of whom about 8 died.
Thereafter, a system of triage was established and the most critically ill patients admitted
to temporary accommodation in existing buildings whilst structures were constructed to
house the very large numbers of patients, simultaneously wet supplementary feeding
programs and “kitchens” were established for the less critically ill.
Although the town of Tubmanburg itself had been “relieved”, the Ecomog forces had a
minimal presence. The surrounding countryside and much of the town still contained
many “fighters” belonging to the factional forces. These fighters were themselves very
short of food. The security situation was tense and very volatile. This had a direct effect
upon the design of the relief effort. The way in which the protocols for treating the
malnourished patients were initially adapted and modified subsequently, and also the
amount and quality of information that could be recorded.
1. There were 2 expatriate nurses under the leadership of Isabelle Beauquesne and about
30 locally recruited staff for the ACF centres. The programme was adapted in Paris by
Yvonne Grellety and Anne-Sophie Fournier.
2. The Expatriate nurses had to travel each morning from Monrovia during daylight and
return each evening back to Monrovia. The journey involved negotiating many
“checkpoints”. For this reason the centres could only be run from 9 or 10 am to 4 p.m.
and all treatment had to be given during this restricted period of 7 hours. 24 hour
residential care was not possible
38
3.Although some of the mothers and patients stayed in the center overnight, most returned
to their dwellings in the town of Tubmanburg at night for security reasons.
4.The mothers refused to take food home with them for overnight feeding of the patients.
This is because they were concerned about being attacked by the fighters on their way
home or in their houses at night and when there were no expatriate witnesses. If the
fighters knew that the residents had food, they would have taken it for themselves. The
result would have been that the patient did not get the food at any rate, all the family
would have been exposed to intimidation and personal violence.
5.At the start of the operation the staff, locally recruited, were residents of Tubmanburg
who could read and write and had had some formal education. They were very committed
to learning and doing whatever they could for the starved community, and themselves
received food for their services. Nevertheless it took some time for the staff to be trained
in the organisation of a center and in the routine management of severe malnutrition, as
well as the procedure that had to be followed, and those who had to do the teaching had
many competing tasks and assessments to make. The protocols clearly had to be as
simple as possible, and based upon pre-prepared or pre-packaged products as much as
possible. There was a strict organisation and division of labour, so that each staff member
had a clear description of the tasks that had to be performed.
6.At the beginning each patient was admitted on the basis of oedema and weight-for-
height by an admitting officer. The patient was given a coloured bracelet with their name
and registration number on it. A ‘fiche’ or recording chart was issued for that patient and
they were admitted to the temporary structure to receive their first therapeutic food. Table
1 shows the number of patients that were admitted per day over the first 27 days of the
centre and the cumulative total patients under the care of the nutrition team.

39
Table 1. Number of patients admitted per day and
cumulative total over the first 27 days
Date No. Admitted Cumulative18th September 154 15419th September 119 27320th September 108 38121st September 30 41122nd September 18 42923rd September 53 48224th September 25 50725th September 3 51026th September 12 52227th September 23 54528th September 6 55129th September 2 55330th September 0 5531st October 12 5662nd October 12 5783rd October 6 5844th October 0 5845th October 0 5846th October 1 5857th October 0 5858th October 11 5969th October 3 59910th October 3 60211th October 1 60312th October 1 60413th October 5 60914th October 3 612
Last date, 9th Dec 1996 - 920
It is clear that there was a sudden influx of patients – within 4 days over 400 patients had
been admitted and their treatment started. This should be compared with many district
hospitals which have about 400 patients who have arrived in a spaced way and are
managed by at least 400 well trained staff.
7.Because of the order of priorities weights, heights and oedema were not recorded on the
fiche for the first days after opening the centre. These data are therefore absent from the
40
analysis and the “admission” weight has been taken as the first weight recorded. For this
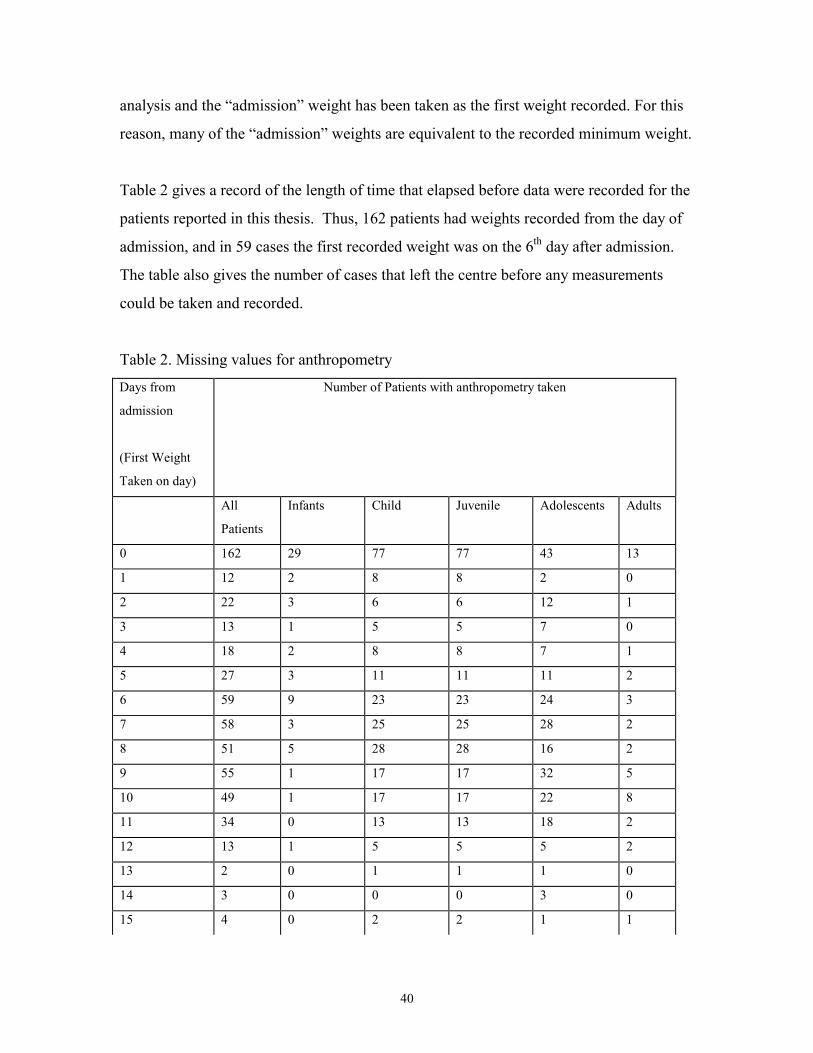
reason, many of the “admission” weights are equivalent to the recorded minimum weight.
Table 2 gives a record of the length of time that elapsed before data were recorded for the
patients reported in this thesis. Thus, 162 patients had weights recorded from the day of
admission, and in 59 cases the first recorded weight was on the 6th day after admission.
The table also gives the number of cases that left the centre before any measurements
could be taken and recorded.
Table 2. Missing values for anthropometry
Days from
admission
(First Weight
Taken on day)
Number of Patients with anthropometry taken
All
Patients
Infants Child Juvenile Adolescents Adults
0 162 29 77 77 43 13
1 12 2 8 8 2 0
2 22 3 6 6 12 1
3 13 1 5 5 7 0
4 18 2 8 8 7 1
5 27 3 11 11 11 2
6 59 9 23 23 24 3
7 58 3 25 25 28 2
8 51 5 28 28 16 2
9 55 1 17 17 32 5
10 49 1 17 17 22 8
11 34 0 13 13 18 2
12 13 1 5 5 5 2
13 2 0 1 1 1 0
14 3 0 0 0 3 0
15 4 0 2 2 1 1

41
>15 3 0 0 0 3 0
No values for
Anthropometry
335 9 49 29 16 232
8.The diets were based entirely on pre-packaged F100 diet, one packet could be opened
and mixed with 200 ml of ambient temperature water to give 2.4 l of “Therapeutic milk”.
The subjects were also given a porridge TH 450 based upon the criteria for refugee
feeding recommended by ACF Scientific committee (Golden, Briend , Grellety 1995).
CSB Unimix and other products which do not contain the full range of minerals and
vitamins required for the patients were not used.
9.In one important respect the protocol differed from that used previously in order to
simplify the regimen. The patients were ‘grouped’ together by age category and the food
was dispensed at set times giving a calculated set amount to each patient within an age
group. This was calculated to give approximately 100 kcal/kg/day to each patient,
assuming 70% weight- for -age (for the average age of the group of patients) in phase I
and 200 kcal/kg/day for phase II of treatment. Iron was not added to the therapeutic milk,
but was given separately after 15 days of treatment. The patients in phase II also received
the porridge in addition to the therapeutic milk.
Under less stressed circumstances, the diet would be dispensed according to the
weight class of the patient and there would have been the necessity to regularly weigh
each patient and calculate the amount of the diet to be dispensed to that individual
patient; each patient would thus potentially have to receive a different amount of
food. Such a procedure, although desirable and more efficient for weight gain could
have taken additional time both for the weighing and calculations and at the time of
food distribution, and would have necessitated additional training for the staff. Such
a procedure was tried in Burundi and it did not work (Yvonne Grellety, personal
communication)
42
10. Only limited stocks of food and other products could be left at the centres overnight.
There was one locked room where one or two days supply was stored, and it was and it
was made clear to the leaders of the local fighters that this stock was very small, and if it
was interfered with the operation would need to be suspended. However, this problem
created the necessity to replenish stocks frequently and posed logistic difficulties.
3.2General statistics
The analysis reported here are from the first 920 patients treated in the ACF centres. 69
were infants aged 0-6 months (2.6 + 1.7), 295 children aged 7-60 months (34.6 ±18.3),
264 juveniles aged 6- 9 years (6.9 ±1.0), 58 adolescents aged 10-18 years (11.7±± 2.4)
and 232 adults aged 20-96 years (57.5± 15.1). Two records had no age recorded and were
considered blank and excluded from all analyses.
3.3Coverage Rate
The population of Tabmanburg was 22,338 and 32.0%(7,148) of the population
was severely malnourished (Nabeth and Michelet, 1996). The proportion of severely
malnourished people admitted at the ACF therapeutic feeding centres was 12.9 % (920)
(see figures 1-17)
3.4Length of stay and timing of recovery
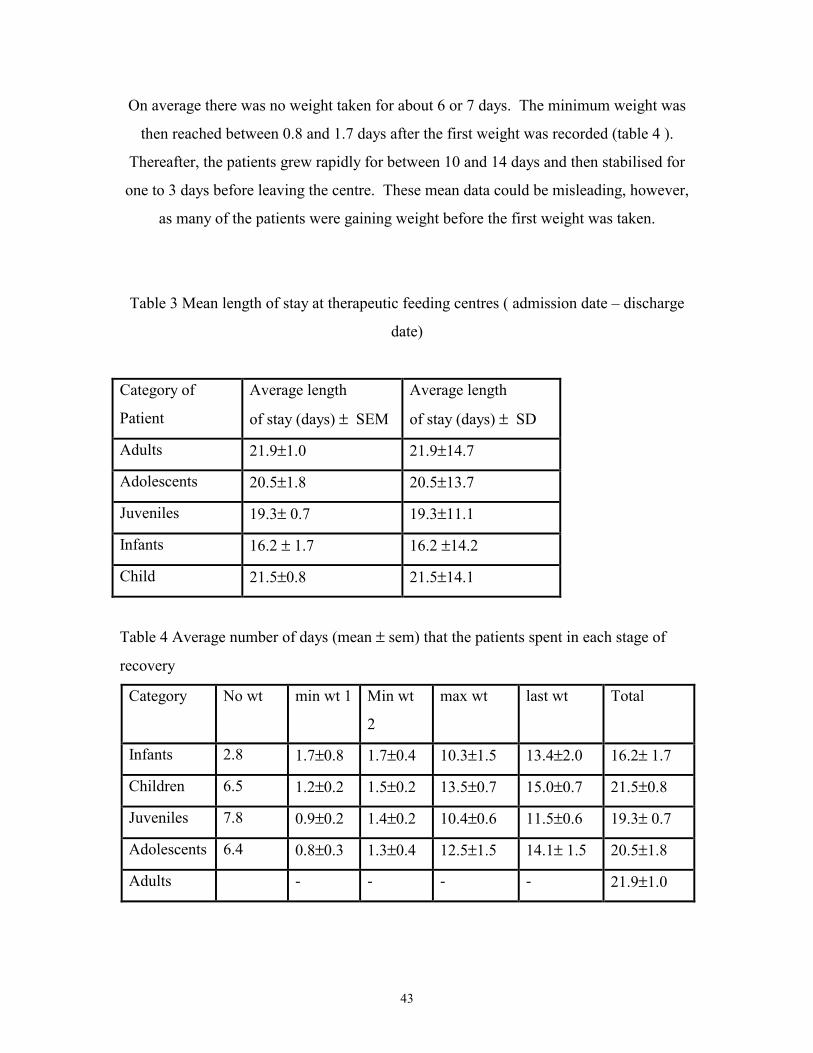
The average length of stay, from the date of admission to discharge, at the centres was
about 3 weeks. The adults on the average stayed longer before discharge, with an average
length of stay of about 21.9 days ±14.7. The mean length of stay at the therapeutic
feeding centres before discharge or transfer to supplementary feeding centres was 21, 20,
19, 16 and 21 days for adults, adolescents, juveniles, infants and children respectively
(table 3).
43
On average there was no weight taken for about 6 or 7 days. The minimum weight was
then reached between 0.8 and 1.7 days after the first weight was recorded (table 4 ).
Thereafter, the patients grew rapidly for between 10 and 14 days and then stabilised for
one to 3 days before leaving the centre. These mean data could be misleading, however,
as many of the patients were gaining weight before the first weight was taken.
Table 3 Mean length of stay at therapeutic feeding centres ( admission date – discharge
date)
Category of
Patient
Average length
of stay (days) ± SEM
Average length
of stay (days) ± SD
Adults 21.9±1.0 21.9±14.7
Adolescents 20.5±1.8 20.5±13.7
Juveniles 19.3± 0.7 19.3±11.1
Infants 16.2 ± 1.7 16.2 ±14.2
Child 21.5±0.8 21.5±14.1
Table 4 Average number of days (mean ± sem) that the patients spent in each stage of
recovery
Category No wt min wt 1 Min wt
2
max wt last wt Total
Infants 2.8 1.7±0.8 1.7±0.4 10.3±1.5 13.4±2.0 16.2± 1.7
Children 6.5 1.2±0.2 1.5±0.2 13.5±0.7 15.0±0.7 21.5±0.8
Juveniles 7.8 0.9±0.2 1.4±0.2 10.4±0.6 11.5±0.6 19.3± 0.7
Adolescents 6.4 0.8±0.3 1.3±0.4 12.5±1.5 14.1± 1.5 20.5±1.8
Adults - - - - 21.9±1.0
44
3.5Nutritional Status on admission
Table 5 shows the weight for height of the various categories of patient on admission, or
at the first weight taken. As patients with oedema are expected to be of a higher weight
than those without the data are presented by oedema category. Unfortunately, many of
the patients have missing oedema data. Nevertheless, it appears as if the children who
were recorded as having oedema were in fact of a lower mean weight than those without
oedema and those without oedema status being recorded. It is also important to
emphasise that many of the patients were gaining weight before the first weight we
recorded – thus, the actual weight for height on admission was probably worse than that
recorded in table 5.
Anthropometry
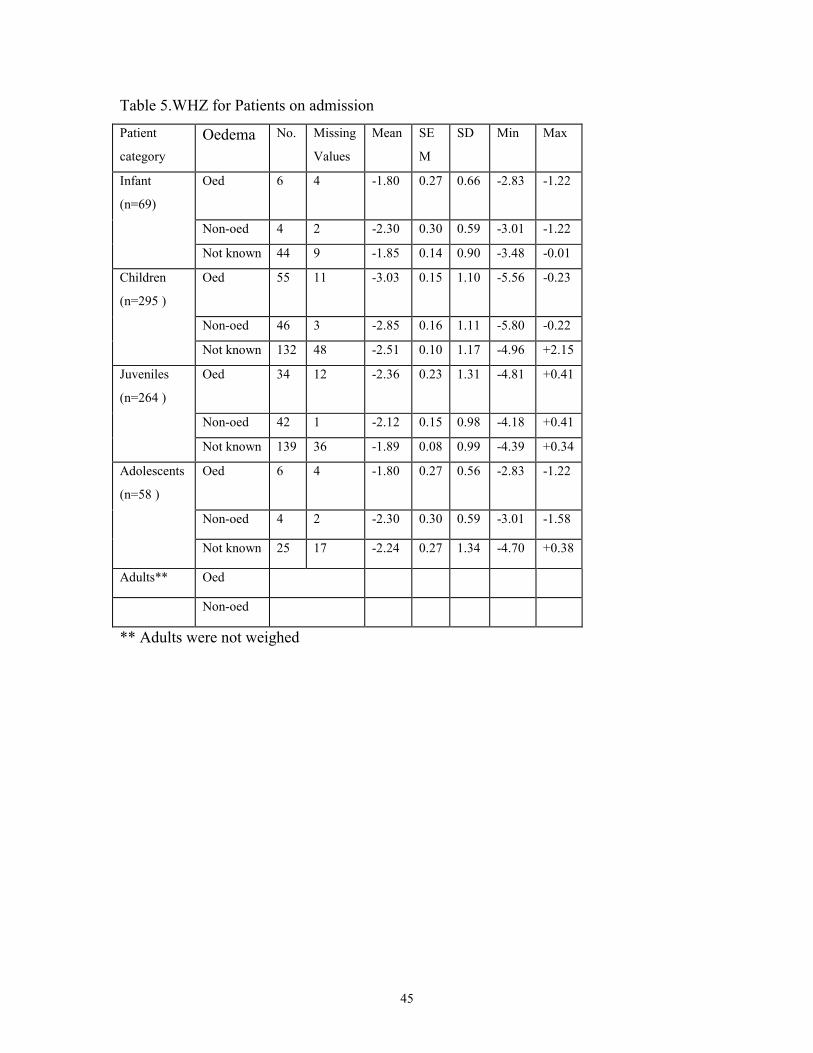
45
Table 5.WHZ for Patients on admission
Patient
categoryOedema No. Missing
Values
Mean SE
M
SD Min Max
Infant
(n=69)
Oed 6 4 -1.80 0.27 0.66 -2.83 -1.22
Non-oed 4 2 -2.30 0.30 0.59 -3.01 -1.22
Not known 44 9 -1.85 0.14 0.90 -3.48 -0.01
Children
(n=295 )
Oed 55 11 -3.03 0.15 1.10 -5.56 -0.23
Non-oed 46 3 -2.85 0.16 1.11 -5.80 -0.22
Not known 132 48 -2.51 0.10 1.17 -4.96 +2.15
Juveniles
(n=264 )
Oed 34 12 -2.36 0.23 1.31 -4.81 +0.41
Non-oed 42 1 -2.12 0.15 0.98 -4.18 +0.41
Not known 139 36 -1.89 0.08 0.99 -4.39 +0.34
Adolescents
(n=58 )
Oed 6 4 -1.80 0.27 0.56 -2.83 -1.22
Non-oed 4 2 -2.30 0.30 0.59 -3.01 -1.58
Not known 25 17 -2.24 0.27 1.34 -4.70 +0.38
Adults** Oed
Non-oed
** Adults were not weighed

46
Table 6 shows the change in Z score during treatment. The data shows that the various
categories of patient were more or less equally malnourished on admission except the
children who were more malnourished. They gained between 0.7 and 1.2 Z-score units
during treatment. Although the children gained more weight than the other groups they
were still more wasted on discharge than infants, juveniles or adolescents.
Table 6. WHZ index at minimum weight, maximum weight and discharge weight
during rehabilitation.
WHZmin WHZmax WHZlst Change
during
Treatment
Infants(n=69) -2.14 -1.42 -1.47 +0.67
Children(n=295 ) -2.87 -1.58 -1.62 +1.25
Juveniles(n=264 ) -2.10 -1.23 -1.23 +0.87
Adolescents(58) -2.23 -1.44 -1.47 +0.78
3.6Recovery Pattern
The mean rate of weight gain for the first seven days after minimum weight for infants,
children, juveniles and adolescents were 14.3, 14.3, 11.1, and 11.4 g/kg body wt/day.
This was slightly more than the rate of weight gain, when assessed over a two week
period. By definition the highest rate of weight gain was between the minimum and
maximum weights. Although this was very high for the infants, and higher for
adolescents, it was not much higher than that obtained by linear regression for children or
juveniles. The rates to discharge, which are the rates of weight gain normally quoted in
studies of malnutrition, are given in the last column of table 5. The children gained
weight at 15.6 g/kg/d. This figure is comparable with the rates obtained from centres
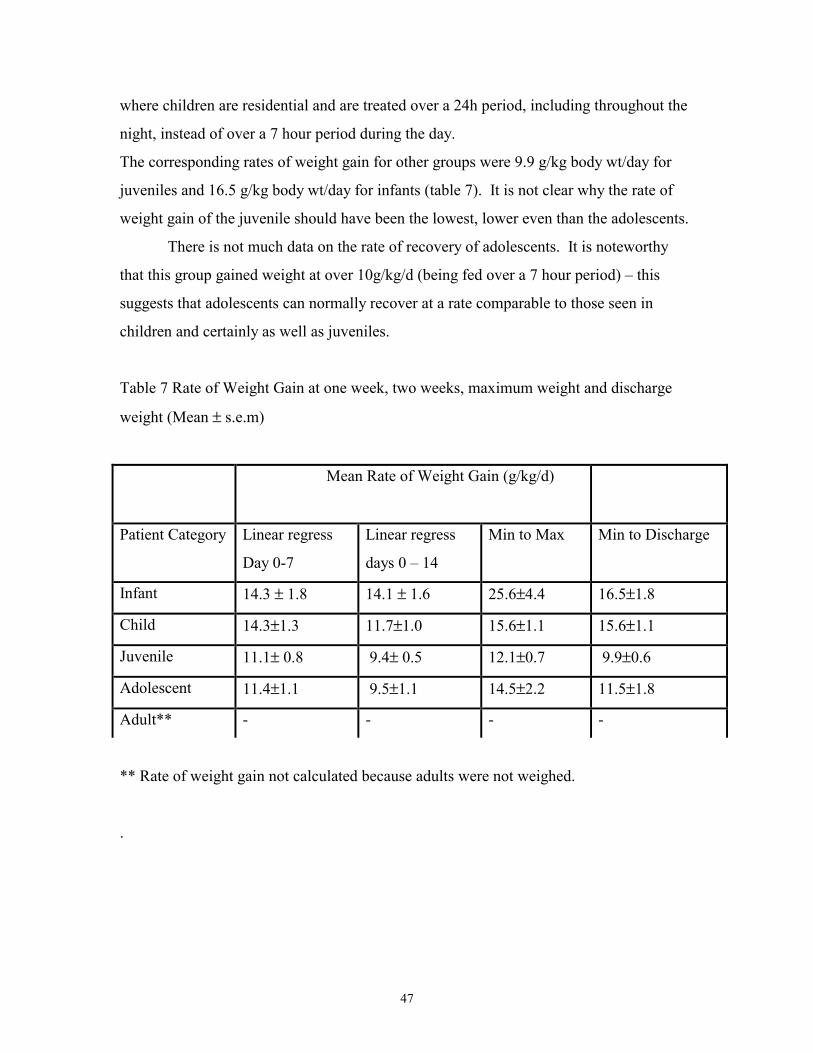
47
where children are residential and are treated over a 24h period, including throughout the
night, instead of over a 7 hour period during the day.
The corresponding rates of weight gain for other groups were 9.9 g/kg body wt/day for
juveniles and 16.5 g/kg body wt/day for infants (table 7). It is not clear why the rate of
weight gain of the juvenile should have been the lowest, lower even than the adolescents.
There is not much data on the rate of recovery of adolescents. It is noteworthy
that this group gained weight at over 10g/kg/d (being fed over a 7 hour period) – this
suggests that adolescents can normally recover at a rate comparable to those seen in
children and certainly as well as juveniles.
Table 7 Rate of Weight Gain at one week, two weeks, maximum weight and discharge
weight (Mean ±=s.e.m)
Mean Rate of Weight Gain (g/kg/d)
Patient Category Linear regress
Day 0-7
Linear regress
days 0 – 14
Min to Max Min to Discharge
Infant 14.3 ± 1.8 14.1 ± 1.6 25.6±4.4 16.5±1.8
Child 14.3±1.3 11.7±1.0 15.6±1.1 15.6±1.1
Juvenile 11.1± 0.8 9.4± 0.5 12.1±0.7 9.9±0.6
Adolescent 11.4±1.1 9.5±1.1 14.5±2.2 11.5±1.8
Adult** - - - -
** Rate of weight gain not calculated because adults were not weighed.
.
48
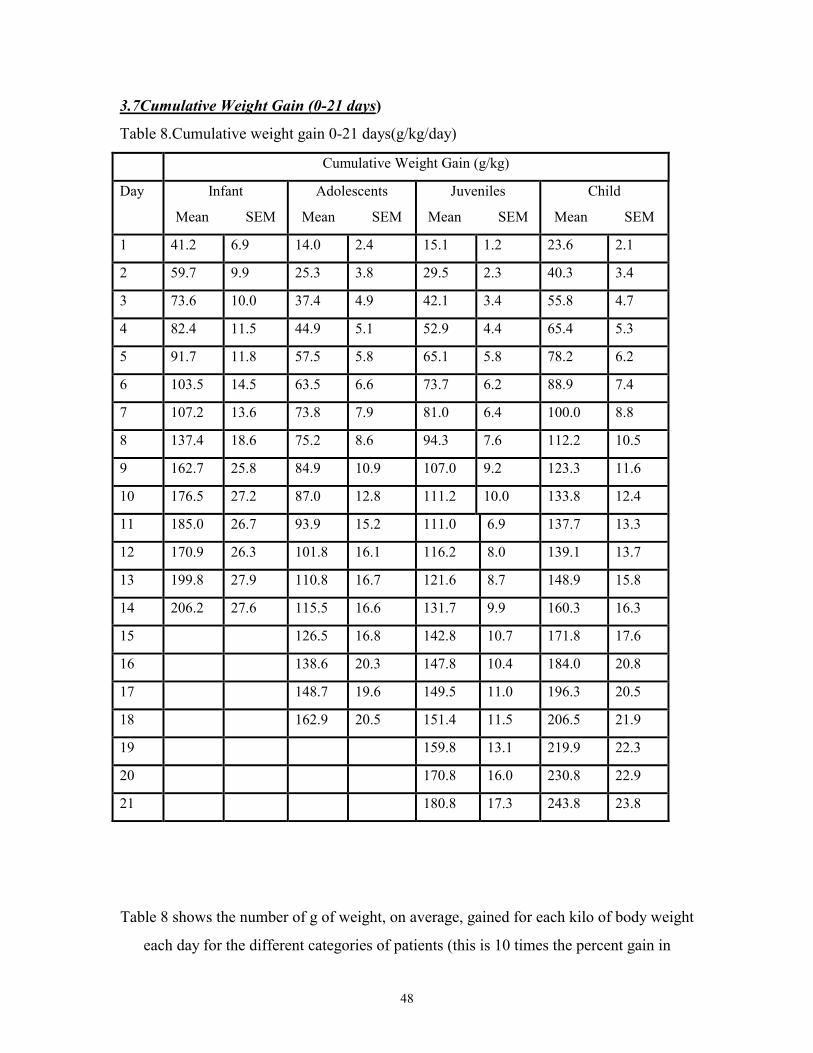
3.7Cumulative Weight Gain (0-21 days)
Table 8.Cumulative weight gain 0-21 days(g/kg/day)
Cumulative Weight Gain (g/kg)
Day Infant
Mean SEM
Adolescents
Mean SEM
Juveniles
Mean SEM
Child
Mean SEM
1 41.2 6.9 14.0 2.4 15.1 1.2 23.6 2.1
2 59.7 9.9 25.3 3.8 29.5 2.3 40.3 3.4
3 73.6 10.0 37.4 4.9 42.1 3.4 55.8 4.7
4 82.4 11.5 44.9 5.1 52.9 4.4 65.4 5.3
5 91.7 11.8 57.5 5.8 65.1 5.8 78.2 6.2
6 103.5 14.5 63.5 6.6 73.7 6.2 88.9 7.4
7 107.2 13.6 73.8 7.9 81.0 6.4 100.0 8.8
8 137.4 18.6 75.2 8.6 94.3 7.6 112.2 10.5
9 162.7 25.8 84.9 10.9 107.0 9.2 123.3 11.6
10 176.5 27.2 87.0 12.8 111.2 10.0 133.8 12.4
11 185.0 26.7 93.9 15.2 111.0 6.9 137.7 13.3
12 170.9 26.3 101.8 16.1 116.2 8.0 139.1 13.7
13 199.8 27.9 110.8 16.7 121.6 8.7 148.9 15.8
14 206.2 27.6 115.5 16.6 131.7 9.9 160.3 16.3
15 126.5 16.8 142.8 10.7 171.8 17.6
16 138.6 20.3 147.8 10.4 184.0 20.8
17 148.7 19.6 149.5 11.0 196.3 20.5
18 162.9 20.5 151.4 11.5 206.5 21.9
19 159.8 13.1 219.9 22.3
20 170.8 16.0 230.8 22.9
21 180.8 17.3 243.8 23.8
Table 8 shows the number of g of weight, on average, gained for each kilo of body weight
each day for the different categories of patients (this is 10 times the percent gain in
49
weight). Thus for example, after 10 days infants had gained 17.7 % body weight, children
13.4 %, juveniles 11.1% and adolescents 8.7% despite the dietary intake period being
restricted to about 7 hours per day.
The cumulative of weight gains one week on admission for infants, children, juveniles
and adolescents were 107.2, 88.9, 73.7, and 63.5 g/kg. By the second week they had
cumulative weight gains of 206.2, 160.3, 131.7 and 115.5 g/kg for infants, children,
juveniles and adolescents respectively. Children and juveniles had cumulative weight
gains of 243.8 and 180.8 g/kg respectively by the end of three weeks. In other words by
the end of three weeks children and juveniles were gaining weights of 11.6, 8.6 g/kg/day
respectively. The rates of weight gain for infants and adolescents at the end of three
weeks were not calculate because of smaller numbers on admission (table 8).
Cumulative Weight Gain g/kg
0
50
100
150
200
250
1 3 5 7 9 11 13 15 17 19 21
Day
Cum
wt g
/kg Infants
Children
Juveniles
Adolescents
Fig 1 Cummulative weight gain of of patients(first 21 days)

50
The weight gain ( g/ kg body weight ) of infants was the highest in the first 21 days. By
the 10th day,
the weight gain/kg body weight was 17.7, 13.4, 11.1, and 8.7 for infants, children,
juveniles and adolescents respectively.(Fig 1)
3.8Clinical signsTables 9 to 20. Shows the clinical signs recorded for patients. There were no data for the
patients who were first admitted to the centre. The data is thus derived mainly from
patients admitted after 5 days of operation.
3.8.1Infection
Most of the patients in the first 4 days had no diarrhoea. 14.6% , 8.2%, 8.3%, 12.8% and
4.2% of infants, children, juveniles, adolescents and adults respectively had diarrhoea
for one day in the first 4 days. Fewer patients had diarrhoea for more than one day in the
first 4 days (table 9).
Similarly, table 10 shows the number of patients experiencing diarrhoea in the first 21
days of treatment was very small. In the first 21 days, majority of patients had no
diarrhoea. 19.2%,12.0%,12.2%,17.0% and 7.8% of infants, children, juveniles,
adolescents and adults respectively had diarrhoea for one day. 4.3%,1.3%,8.9%,4.3% and
3.0% of infants, children, juveniles, adolescents and adults respectively had diarrhoea
from 2-4 days.
Except 2.4% of adults and 0.5 % of juveniles who had diarrhoea for 5 or more days, no
other category of patients had diarrhoea for 5 or more days in the first 21 days( table 7).
Table 11 shows the number of patients that experienced vomiting in the first 4 days and
table 12 over the first 21 days.

51
Over 90% of patients did not vomiting at all, in the first 4 days. However, the highest
proportion of patients who vomited were infants (for one day only). Only 4.1%, 1.8%
and 1.8% of children, juveniles and adults respectively vomited for one day in the first 4
days. No adolescent vomited in the first 4 days (table 11).
For the first 21 days, over 80% of patients of all categories of patients did not vomit. No
adolescent was found to have vomited and 6.3, 7.7, 5.6 and 4.3 % of infants ,children,
juveniles and adults had one day of vomiting. Vomiting from 2 to 4 days occurred among
6.3,4.7, 1.9 and 1.2 % of infants, children, juveniles and adults respectively
It is clear that very few of the patients had diarrhoea or vomiting and that refeeding
diarrhoea does not seem to have been a problem. There was also no outbreak of major
diarrheal disease.
Table 9. Proportion of patients with 0 to 4 episodes of Diarrhoea in the first 4 days
Category
of patient
Missing
Data
No Frequency/Episodes of Diarrhoea in first 4
days
0 1 2 3 or 4
Infants 21 48 83.3 % 14.6 % 2.1 % 0.0 %
children 51 244 89.8 % 8.2 % 1.2 % 0.8 %
Juvenile 46 218 86.7 % 8.3 % 4.1 % 0.9 %
Adolesce
nt
11 47 85.1 % 12.8 % 0.0 % 2.1 %
Adult 64 168 92.7 % 4.2 % 1.2 % 1.8 %
52
Table 10. Proportion of patients with 0 to 5 or more episodes of Diarrhoea in the first 21
days
Category
of patient
Missing
Data
No Diarrhoea in first 21days
0 times 1 day 2 to 4
days
5 or
more
days
Infants 22 47 76.6 % 19.2 % 4.3 % 0.0 %
children 51 234 83.3 % 12.0 % 1.3 % 0.0 %
Juvenile 50 214 78.5 % 12.2 % 8.9 % 0.5 %
Adolesce
nt
11 47 78.7 % 17.0 % 4.3 % 0.0 %
Adult 66 166 86.8 % 7.8 % 3.0 % 2.4 %
53
Table 11. Vomiting in the first 4 days.
Category
of patient
Missing
Data
No Vomiting in first 4 days
0 day 1 day 2 days 3 or 4
days
Infants 20 49 91.8 % 8.2 % 0.0 % 0.0 %
children 52 243 95.1 % 4.1 % 0.8 % 0.0 %
Juvenile 47 217 97.2 % 1.8 % 0.5 % 0.5 %
Adolesce
nt
12 46 100 % 0.0 % 0.0 % 0.0 %
Adult 66 166 98.2 % 1.8 % 0.0 % 0.0 %
Table 12.Vomiting in the first 21 days
Category
of patient
Missing
Data
No of Vomiting in first 21days
0 day 1 day 2 to 4 >= 5
Infants 21 48 87.5 % 6.3 % 6.3 % 0.0 %
children 61 234 87.6 % 7.7 % 4.7 % 0.0 %
Juvenile 51 213 92.5 % 5.6 % 1.9 % 0.0 %
Adolesce
nt
12 46 100 % 0.0 % 0.0 % 0.0 %
Adult 68 164 94.5 % 4.3 % 1.2 % 0.0 %
Table 13. Days with hypothermia during rehabilitation at Therapeutic feeding Centres
54
Category
of patient
Missing
Data
No Days of Hypothermia
0 day 1day 2 days 3-5
Infants 13 56 80.4 12.5 7.1 0.0
children 36 259 70.3 13.5 13.9 2.3
Juvenile 40 224 74.6 11.6 12.5 1.3
Adolesce 7 51 76.5 11.8 9.8 2.0
Adult 22 210 66.7 20.5 10.7 2.1
Although the majority of patients during the course of recovery had no hypothermia, this
is normally a serious clinical sign and with corrrect management no patient should have
hypothermia. It is thus of concern that 18% of infants, 30% of children 25% of juveniles,
24% of adolescents and 33% of adults had at least one episode of hypothermia whilst in
the center. It should be noted that all the temperatures taken were during the day, and
night time temperatures could not be ascertained. Despite this between 20 and 35 % of
the patients had at least one recorded episode of hypothermia. It is notable that none of
the categories of patient escaped hypothermia. Indeed, the infants, who would be thought
of as the most vulnerable had the lowest incidence and the adults who should have been
most resistant in view of their low surface-area to volume ratio, had the highest
proportion of patients with hypothermia. The reasons could be related to the dietary
intakes, the exposed nature of the temporary accommodation and the relative lack of
“body contact” by the adults with each other, unlike the infants who slept and were being
held close to their mothers.
Table 14.Days with fever
Category
of patient
Missing
Data
No Days of Fever
0 times 1(once) 2 to 4 =>5
55
Infants 13 56 94.6 5.4 0.0 0.0
children 36 259 86.1 11.2 2.7 0.0
Juvenile 41 223 93.3 6.7 0.0 0.0
Adolesce
nt
8 50 90.0 8.0 2.0 0.0
Adult 36 196 99.5 0.5 0.0 0.0
Most of the patients on admission had no fever during the course of recovery. Only
5.4%,11.2%,6.7%,8.0% and 0.5% of infants, children, juveniles, adolescents and adults
who had their fever status recorded, had fever for only a day. Only 2.7% of children and
2.0% of adolescents had fever for 2 to 4 days. No patient had fever for 5 or more days.
Table 15. Days with history of dehydration
Category
of patient
Missing
Data
No Days of Dehydration
0 day 1 day 2 to 4
days
5 or
more
days
Infants 23 46 89.1 8.7 0.0 2.2
children 62 233 82.8 9.4 3.9 3.8

56
Juvenile 51 213 93.4 5.6 0.9 0.0
Adolesce
nt
11 47 85.1 4.3 4.3 6.4
Adult 65 167 86.8 4.2 6.0 3.0
Dehydration was diagnosed clinically in 9, 9, 6, 4 and 4 % of Infants, children, juveniles,
adolescents, and adults for only a day during the course of recovery. Dehydration for 2 to
4 days was recorded for 4% of children , 1% of juveniles 4% of adolescents and 6% of
adults. Five or more days of dehydration occurred in 2.2% of infants, 3.8 % of children,
6.4 % of adolescents and 3% of adults(Table 15). The adults seem to have had more
problem with dehydration than the children. It is possible that the staff were less familiar
with the clinical signs of dehydration in adults than children, and confused the signs of
severe wasting with those of dehydration in some cases.
Table 16. Days with Chest infection during rehabilitation
Category
of patient
Missing
Data
No Days of Chest Infection
0 Days 1 Day 2 to 4
Days
=>5
Days
Infants 23 46 47.8 19.6 13.1 19.5
children 53 242 31.0 14.5 27.3 27.2
Juvenile 48 216 39.4 12.5 31.0 17.1
Adolesce
nt
10 48 43.8 16.7 27.1 12.4
Adult 53 179 43.0 14.5 13.4 29.1

57
Over 50% of all categories of patients had chest infections for one or more days (table
16).
Table 17. Number of days anaemic during rehabilitation at TFC
Category Missing
Data
No Days Anaemic
0 Days 1 Day 2 to 4
Days
5 or
more
Days
Infants 50 19 73.7 10.5 10.5 5.3
children 197 98 22.5 19.4 24.5 33.6
Juvenile 189 75 49.3 10.7 20.0 20.0
Adolesce
nt
38 20 40.0 5.0 25.0 30.0
Adult 154 78 33.3 7.7 21.8 37.2
Most patients were clinically anaemic. This could be ascribed to a co-limitation of
nutritional deficiency and malaria. Anaemia was common among patients during the
course of rehabilitation. Over 5% of all categories of patients had anaemia for 5 or more
days. The lowest proportion of anemia cases were among the infant and the highest was
among children (table 17).
Table 18 Oedema status of patients
Category
of patient
Missing
Data
No Grade of Oedema
0 1 + 2 ++ 3+++
Infants 61 8 100 % 0.0 % 0.0 % 0.0 %
children 180 115 42.6 % 34.8 % 22.6 % 0.0 %
Juvenile 175 89 48.3 % 32.6 % 19.1 % 0.0 %
Adolesce
nt
42 16 37.5 % 25.0 % 37.5 % 0.0 %

58
Adult 58 174 4.0 % 24.1 % 62.6 % 9.2 %
A large number of the patients did not have their oedema status recorded. Most of the
patients, however, were oedematous (personal communication, Y Grellety and M
Golden). Of those who had oedema recorded the highest incidence of oedema was among
adults and 24.1% , 62.6% and 9.2% had 1+ , 2++, and 3+++ grades of oedema
respectively. The infants had no oedema. Over 50% of all categories of patients except
the infant had oedema during the course of recovery.(table 18)
Table 19. Length of time(days) for oedema to resolve.
Category
of patient
Missing
Data
No Days Oedema resolved
0 Days 1 Day 2 to 4
Days
5 or
more
Days
Infants 66 3 100.0 % 0.0 % 0.0 % 0.0 %
children 207 88 44.3 % 2.3 % 14.8 % 38.6 %
Juvenile 199 65 43.1 % 1.5 % 32.3 % 76.9 %
Adolesce
nt
46 12 41.7 % 16.7 % 8.3 % 33.3 %
Adult 108 124 1.6 % 9.7 % 18.6 % 70.1 %
Among the adult patients who had oedema, 70% of them had their oedema resolving in 5
or more days. Generally, it took 5 or more days for the oedema of patients for over 30%
of patients in all categories for the oedema to resolve(table 19).
Table 20. Breastfeeding of infants(0-6mons) and Children (7-24mons).
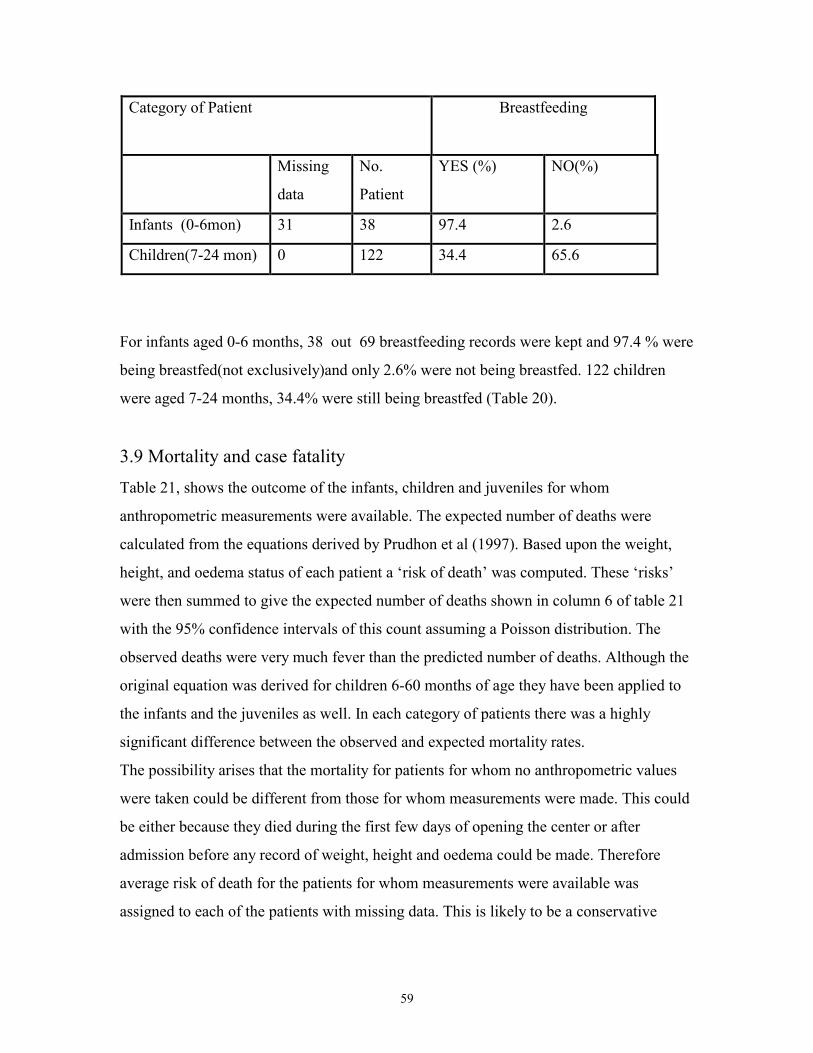
59
Category of Patient Breastfeeding
Missing
data
No.
Patient
YES (%) NO(%)
Infants (0-6mon) 31 38 97.4 2.6
Children(7-24 mon) 0 122 34.4 65.6
For infants aged 0-6 months, 38 out 69 breastfeeding records were kept and 97.4 % were
being breastfed(not exclusively)and only 2.6% were not being breastfed. 122 children
were aged 7-24 months, 34.4% were still being breastfed (Table 20).
3.9 Mortality and case fatalityTable 21, shows the outcome of the infants, children and juveniles for whom
anthropometric measurements were available. The expected number of deaths were
calculated from the equations derived by Prudhon et al (1997). Based upon the weight,
height, and oedema status of each patient a ‘risk of death’ was computed. These ‘risks’
were then summed to give the expected number of deaths shown in column 6 of table 21
with the 95% confidence intervals of this count assuming a Poisson distribution. The
observed deaths were very much fever than the predicted number of deaths. Although the
original equation was derived for children 6-60 months of age they have been applied to
the infants and the juveniles as well. In each category of patients there was a highly
significant difference between the observed and expected mortality rates.
The possibility arises that the mortality for patients for whom no anthropometric values
were taken could be different from those for whom measurements were made. This could
be either because they died during the first few days of opening the center or after
admission before any record of weight, height and oedema could be made. Therefore
average risk of death for the patients for whom measurements were available was
assigned to each of the patients with missing data. This is likely to be a conservative

60
estimate of their Prudhon index because the more severely malnourished patients were
admitted at the beginning when records were not taken.
In table 22, the outcome of all the patients admitted to the centre whether or not they had
anthropometric data recorded is shown together with conservative estimates of the total
deaths expected for infants, children and juveniles. These data confirm that the mortality
rate was much lower than expected and refute the hypothesis that those with unrecorded
anthropometric data experienced a higher mortality than those for whom records were
available.
The table also shows the outcome experienced by adolescents and adults. There is no
index available to compute the expected mortality rate in these groups, and we did not
think it appropriate to apply the equation derived for young children. Nevertheless, of the
58 adolescents admitted, none died and of the 232 adults only 6 died giving a case fatality
rate of 2.5%. this is much lower than that experienced in other famines where large
number of adults have been malnourished(Collins et al 1998).
Of the 918 patients treated only 16 died (case fatality rate 1.7%). Comparison of the
mortality rates suggest that the most vulnerable section of this population was the less
than 6 months old child (CFR 5.7%) followed by the adult population. Most of the adults
did not like taking the therapeutic milk designed for children and protocols specific for
treatment of adults and adolescents have not been developed and implemented in the way
that they have for children.

61
Table 21. Outcome of Treatment,
Category Aband Trans
f
Discharge Observe
d Deaths
Expected
Deaths
95 % CI Observed/
Expected
Case
Fatality
Infants
(n=60)
10 1 45 4 15.3 8.7 –24.6 26.7 6.7 %
Children
(n=237)
37 0 198 2 11 5.8 – 19.0 18.2 0.8 %
Juveniles
(n=219)
19 2 197 1 5.7 2.5 – 12.4 16.7 0.5 %
Total 66 3 506 7 32 23.1 – 45.8 21.8 1.1
Table 22. Outcome of treatment , expected deaths and case fatality rates at therapeutic
feeding centres.
Category Aband Transf Discharge Observed
Deaths
Expected
Deaths
95 % CI Observed/
Expected
Case
Fatality
Infants (n=69) 16 1 48 4 17.6 11.1- 27.8 22.2 5.7
Children
(n=295)
55 0 234 4 13.7 8.1- 22.9 28.6 1.3
Juveniles
(n=264)
36 2 224 2 6.9 3.1-13.7 28.6 0.8
Adolescent(n=
58)
11 0 47 0 ** - - 0.0
Adults
(n=232)
45 1 180 6 ** - - 2.5
Total(n=918) 163 4 735 16 28.1-52.7 10/39 1.7
** No index for adolescents and adults( Prudhon probability of death is for children)

62
4.0 DISCUSSIONThe data from the relief of the siege of Tubmanburg, represents a unique opportunity to
examine the effects treatment of acute starvation of a population. That the siege and
famine were severe is demonstrated by the survey of Nabet done shortly after the relief.
About 19 % of the population had died of starvation – 57% of the children and 12% of
the adults. When the relief came over 30% the population that had not died were severely
malnourished and required immediate medical help to prevent their deaths. The results of
treatment of such a population with modern methods of rehabilitation have not been
reported before. In other areas that have been besieged and then relieved, for example
during the second world war, no data on mortality or rates of recovery have been
recorded, and in some modern sieges, such as that if Sarejevo, there has not been massive
death from starvation or widespread malnutrition.
Unlike other famines, however, there does not seem to have been an epidemic of the
infective diseases that normally accompany mass starvation. Thus, typhus, typhoid and
cholera were not seen during the siege or during the relief effort. A cholera epidemic did
strike a nearby relief center, run by OXFAM, close to the front line of hostilities several
months later. The reason for the lack of epidemic disease is unclear; presumably it is
related to the isolated nature of the town of Tubmanburg , the very restricted population
movement and the lack of initial cases to start an epidemic.
4.1Rate of weight gain.
The rates of weight change during recovery were higher than found else where in the
West African Sub-region using treatment protocols and rehabilitation foods from before
the advent of the WHO 1999 treatment manual. Although, other centers run by ACF
have been using these protocols since 1994, and nearly always achieve a rate of weight
gain of over 10g/kg/d, usually about 15g/kg/d, when there is 24h residential care and
“round the clock” feeding. What is most remarkable about the present data are that the
treatment was restricted to about 7 hours per day. During this time sufficient food was

63
taken by the patients to achieve rates of weight gain similar to those seen in the other
ACF centers.
Thus, infants at the beginning of recovery were gaining 14.3 g/kg/day and this rose to an
average of 16.5 g/kg/day at the time of discharge. There was also an increase rate of
weight gain for children from 14.3 g/kg/day at the beginning of recovery to 15.6 g/kg/day
at discharge.
These results can be compared with the rate of weight gain of children aged less 60
months in Kersey Nutrition Rehabilitation Centre (KNRC) located in Ogbomoso, in
western Nigeria (Ibekwe & Ashworth, 1994). Here the rate of weight gain for marasmic
and marasmic-kwashiorkor cases was 7.0 g/kg/day and 7.2 g/kg/day and 6.0 g/kg/d for
kwashiorkor cases ( p value <0.01). However, standards set by the KNRC are rated
highly in Nigeria as being an exemplary center; it is a Baptist Medical Center and as such
enjoys more medical facilities than any other Nutrition rehabilitation center in Nigeria
(Ibekwe & Ashworth, 1994) – it is therefore expected that the other centers do not even
achieve a rate of weight gain at this level, which is itself less than half that achieved in
Tubmanburg.
Generally, the rate of weight gain for all categories of patients, from the beginning of
recovery to discharge was within the range stated to be readily achievable with the correct
management by WHO, 1999 of 10-15 g/kg/day. During recovery there was also no
patients with ‘failure to thrive’; all the rates of weight gain, for all categories of patient,
(table 3) were far above the cut-off point of failure to thrive during rehabilitation of 5
g/kg/day . This could be used as a measure of the successful case management at the
Tubmanburg TFC’s
4.2 Rate of loss of oedema.
Because of the lack of recording during the initial phase of the emergency, it is difficult to
know the rate of loss of oedema. Nevertheless, it seems that all categories of patients had
lost oedema and by the second day after records were being taken – as the records started,
on average, 5 days after admission, the maximum likely time for loss of oedema is 6 days.
64
The fast rate at which the oedema resolved could be explained by feeding to attain the
energy levels spelt out in the protocol and the mineral and vitamin content of the diets
helped to correct electrolyte imbalance. Golden, 1982, explained the relationship
between energy intake and loss of oedema. The energy intake above which oedema
resolved and below which oedema accumulates was 245-270 kJ/kg/day. In the treatment
the use of the F100 diet and the frequency of feeding to attain the desired energy was
strictly adhered to, within the constraints of the time for treatment. This upper limit of
energy intake was exceeded, on average, by all categories of patient through supervised
feeding. This could have accounted for the fast rate of loss of oedema.
4.3 Mean length of Stay
The mean length of stay at the centres ranged from 16.2 days ( 95% CI; 12.8-19.6) for
infants to 21.5 days (95% CI;19.9-23.1). This also compared with an average length of
stay of 35 days for children treated at the KNRC in Nigeria(Ibekwe & Ashworth, 1994)
also indicate a faster recovery rate of patients. The most expensive component of
treatment of patients is the costs of keeping the patient in residential care. If the diets
used in Tubmanburg were applied generally, and the length of stay was thereby reduced
from 35 days to 21 days, then the cost saving per patient would more than off-set any
additional expenditure on the diets.
It is a major advantage to have the patients discharged as quickly as possible. Not only
can limited facilities then be used to treat more patients, but also a) the patients are not
exposed to the cross-infections of hospital for longer than necessary, and b) the mother
does not have to be away from the rest of her family for an extended period. The
admission on a child to hospital, with the mother, involves considerable social costs to
the family. There are thus very strong arguments from both economic and social points
of view for giving a diet that promotes the most rapid rate of recovery possible.
4.4 Incidence/Treatment of infections.
65
Diarrhoeal diseases were not common among patients. The few cases that had diarrhoea
could be refeeding diarrhoea of new arrivals at feeding centres and generally regarded as
the response of a starving and atrophic intestine to the initial reintroduction of food.
Why there was such a low prevalence of diarrhoea is unclear. It may be related to the fact
that the surviving population that presented had true acute malnutrition, and that chronic
malnutrition was not a common underlying feature of their illness. Because of the
restricted time over which the food had to be given, each individual meal had to be larger
than is normal in the treatment of malnutrition. For this reason refeeding diarrhoea was
anticipated when the protocols were designed. The fact that it did not occur demonstrates
that the size of each individual feed may not be as critical in causing refeeding diarrhoea
as was previously thought.
Vomiting was also uncommon among patients because small volumes of volumes of
isosmotic feed (F100) was given at an average of 4 times over 7 hours and bacterial over
growth was treated with the use of broad-spectrum antibiotics. Golden and Ramdath,1987
have observed that this is normally the case when these procedures are followed
Hypothermia was present among the patients during recovery. Between 20-35% of
patients had at least one recorded episode of hypothermia. This could have been due to
the fact that patients were not fed in the night and the restricted periods of feeding and the
open nature of the accommodation could account for this. Nevertheless, it does not seem
to have been associated with excess mortality. In other studies hypothermia is frequently
seen in the moribund patient who is about to die, and is a common accompaniment of
septic shock, hypoglycaemia, and overwhelming or serious infection, and has serious
prognostic implications. This does not seem to have been the case in Tubmanburg.
Fever rates during recovery was also low. Over 80% of patients in all categories had no
fever during recovery despite the fact that they were in a malaria hyperendemic area.

66
Dehydration was also not a problem among patients. The few cases of dehydration was
effectively treated with ReSoMal.
Chest infections was rather common over 50% had chest infections for one or more days.
The very high rates of weight gain could in part be explained by the low rates of infection
and the effective manner infection was controlled among patients.
Roland et al, 1977 have illustrated quantitatively the role of infection in controlling the
nutritional status of children in a Gambian village. There is a strong relationship between
gastroenteritis(defined as diarrhoea illness) and growth faltering. Diarrhoea was found to
be more strongly related to gain in length than weight. Vomiting which curtails the
dietary intake of nutrients and the additional loss of nutrients from the gut that could
occur through diarrhoea were not problem among the patients. Malaria is also
significantly related to growth faltering and malaria was not a common problem. The
treatment protocols were effectively applied and infection was controlled among the
patients.
4.5 Mortality rate
Out of 918 patients treated only 16 died (CFR, 1.7%). The most vulnerable were the less
than 6 month old infants (CFR, 5.7%) and the adults had a case fatality rate of 2.5%. Both
these categories of patient are normally ignored in relief efforts and protocols. The
infants because they are supposed to be fully breast fed and therefor “protected” from
malnutrition and the adults because they are meant to be able to “fend for themselves”.
And yet it was these groups that have the highest case fatality rates.
The mortality rate among all categories of patients was significantly lower than expected
(tables 21 and 22). Collins et al, 1998, detected case fatality rates of 37% for
oedematous malnutrition and 20% for marasmus or mild oedema when they compared
two diets with different protein contents in a therapeutic feeding centre in Baidoa in

67
Somalia during the 1992 famine. Among oedematous patient the reduction in protein
intake was associated with a three fold decrease in mortality (p<0.05) and accelerated
resolution of oedema (p< 0.05) – this is in accord with the regimen used in Tubmanburg.
In Bangladesh at a children’s Nutrition Unit, Dhaka, Schofield and Ashworth, 1996
reported that case fatality dropped from 20% to 5% over a four year period. The
reduction in mortality was ascribed to modification in case management, routine
prescribing of broad -spectrum antibiotics, transfusion of packed cells for severe
anaemia, withholding iron supplements in the first week of treatment, avoiding
intravenous rehydration when ever possible, cautious refeeding, use of a low sodium diet
and daily monitoring of signs of fluid over-load.
Results from Tubmanburg indicate that with improved case- management case fatality
rates of less than 5% can be attained even in less crisis situations like in Tubmanburg.
The dietary treatment protocols used in Tubmanburg had all these characteristics, and
even without night feeding case fatality rates of 0.8-5.7 was attained among all categories
of patients (table 22). Schofield and Ashworth, 1996; Brewster and Manary 1995, have
all recommended appropriate treatment protocols as a way of reducing case fatality of
severe malnutrition. Schofield and Ashworth, 1996 went further to recommend that these
updated treatment regimes/ protocols should be prescriptive rather than descriptive, and
these were exactly the characteristics of the treatment protocols approved by ACF, Paris
and used in Tubmanburg. ReSoMal, an improved rehydration solution recommended by
WHO,1999 was also used and this could have averted more death and contributed to the
low case fatality.
CONCLUSION
The management of the crisis in Tubmanburg was clearly successful. Despite a small
staff suddenly having to deal with a massive case load when the local staff were
previously untrained, in an insecure situation, during restricted daylight hours, low rates
of mortality and high rates of weight gain were achieved. It is not clear if this was mainly
due to the particular nature of the patients in Tubmanburg. Nevertheless, without
68
application of modern concepts of management, it is likely that the mortality rate would
have been much higher, the rate of recovery lower and the stay in the center prolonged.
What aspects of these very restricted and simplified treatment protocols contributed to the
success must await further studies in other crises.
The present study also demonstrates what can be achieved, in terms of data collection,
even under the most intense pressure and shortage of staff. It also demonstrates the value
of such data collection and the need for detailed analysis and appraisal of the operation
after the even. It is only through such “research” that we will continue to improve our
responses to such tragic and harrowing realities of modern warfare.
69
ReferencesBeaten GH and Ghassemi H. Supplementary feeding programme for youngchildren in developing countries. Am J Clin Nutr 1982; 864-916
Brewster D, Manary M. Treatment of severe malnutrition. Lancet 1995; 345: 453
Briend A, Golden MHN. Treatment of Severe Malnutrition in refugee camps. Eur J ClinNutr 1993; 47: 750-54
Collins S, Myatt M, Golden B. Dietary treatment of Severe Malnutrition in Adults . Am JClin Nutr 1998; 68:193-9
Dempster WS, Sive AA, Rosseau S, Malan H, Heese H. Misplaced iron in kwashiorkor.Eur J Clin Nutr 1995; 49:208-10
Desjeux DF, Briend A, Prudhon C, Grellety Y, Golden MH. Definition and evaluation oftherapeutic food for severely malnourished children in situations of humanitarianemergencies. Bull de l’Academie Nationale de Medecine 1998; 182: 1679-90
Golden MHN, Briend A,Grellety. Report of meeting on supplementary feedingprogrammes with particular reference to refugee populations. Eur J Clin Nutr 1995;49:137-145
Golden MHN, Ramdath D.Free radicals in the pathogenesis of kwashiorkor. Proc NutrSoc1987; 46: 53-68
Golden MHN. Protein deficiency, energy deficiency and the oedema of malnutrition.Lancet 1982;…..1261-65
Golden MHN. Specific deficiencies versus Growth Failure: Type I and Type II Nutrients.J Nutr Env Med 1996; 6: 301-8
Golden, 1998. Oedematous malnutrition. Br Med J 1998; 54: 433-44
Graham GG, Maclean WC Jr, Brown KH, Morales E, Lembcke J, Gastanaduy A. Proteinrequirements of infants and children: growth during recovery from malnutrition.Paediatrics 1996; 97: 499-505
Ibekwe VE, Ashworth A. Management of protein-energy malnutrition in Nigeria: anevalution of the regimen at the Kersey Nutrition Rehabilitation Centre, Nigeria. Trans R.Soc. Trop. Med. Hyg. 1994; 88: 594-595
Isabelle Beauquesne. Action Contre la Faim. Internal reports and statistical analysis ofthe TFCs in Tubmanburg, Sept-Dec 1996, unpublished.
70
Jackson AA, Golden MH. Severe Malnutrition. In The Oxford textbook of medicine, 2nd
eds DJ Weatherall, JGG Ledington & DA Warell, pp. 8.12-8.23. Oxford: OxfordUniversity Press.
Males S. 1996. Refugees: do no forget the basics. World Health statistics Quarterly 1996;49: 221-5
Michaelsen KF, Clausen T. Inadequate supplies of potassium and magnesium in relieffood- Implications and countermeasures. Lancet 1987; .…1421-23
Nabeth P, Michelet M, Gallais G, Claus W. Demographic and nutritional consequencesof civil war in Liberia(letter). Lancet 1997; 349: 59-60
Nabeth P, Michelet M. Demographic and Nutritional Assessment Tubmanburg, BomiCounty, Liberia 1996 (Unpublished)
Outram Q. Cruel wars and safe havens: humanitarian aid in Liberia 1989-1996. Disasters1997; 21: 189-205
Pecoul B, Soutif C, Hounkpevi M, Ducos M. Efficacy of a therapeutic feeding centreevaluated during hospitalisation and a follow-up period, Tahou, Niger, 1987-1988.Annals
of Tropical Paediarics 1992; 12: 47-54
Prudhon C, Briend A, Laurier D, Golden MHN, Mary JY. Comparison of weight -andHeight -based Indices for Assessing the Risk of Death in Severely MalnourishedChildren. Am J Epidemiol 1996; 144: 116-23
Prudhon C, Golden MHN, Briend A, Mary JY. A model to standardise mortality ofseverely malnourished children using nutritional status on admission to therapeuticfeeding centres. Eur J Clin Nutr 1997; 51:771-77
Roland MGN, Cole TJ, Whitehead RG. A quantitaive study in the role of infection indetermining nutritional status in Gambian village children. Br J Nutr 1977, 37: 441-450
Schofield C, Ashworth A. Why have mortality rates of severe malnutrition remained sohigh? Bull World Health Org 1996; 74 : 223-29Sive AA, Dempster WS, Malan H, Rosseau S, Hesse H. Plasma free iron: a possiblecause of oedema in kwashiorkor. Arch Dis Child 1997; 76: 54-56
Toole MJ, Waldman RJ. An analysis of mortality trends among refugee populations inSomalia, Sudan, and Thailand. Bull World Health Org 1988; 66: 237-47
Waterlow JC. Protein Energy Malnutrition. London: Edward Arnold. 1993WHO,1999 . Management of severe malnutrition: a manual for physicians and othersenior health workers
71
Original ProtocolNUTRITIONAL STATUS AND SURVIVAL IN THE SIEGE OF TURMANBURG-
LIBERIA
INVESTIGATORS:
Kareem Daari (MSc Student-International Nutrition)
Supervisor: Professor Michael Golden (Dept. of Medicine and Therapeutics, University
of Aberdeen)
Introduction
72
The major problems faced by people displaced by complex emergencies are insecurity
and malnutrition. Here health workers were confronted with managing large numbers of
severely malnourished people in highly insecure conditions.
Recommendations for the management of severe malnutrition are clearly spelt out
(Golden, 1996; WHO,1999). The extent, to which these recommendations can be carried
out, given the logistic, security and personnel constraints, as well as the initial state of the
patients, determines the outcome of patients presenting to therapeutic feeding centres
with severe malnutrition.
Background
In December 1989, civil war broke out in Liberia: involving 5 main factions: Charles
Taylor’s NPFL, Roosevelt John’s ULIMO-J, Alhaji Kroma’s ULIMO-K, Georges Boley’s
LPC and General Bowen’s AFL.In August 1996, after several years of violent fighting, a
cease-fire was signed between the warring factions in Abuja, Nigeria.
During the transitional period, soldiers (ECOMOG force), were sent by the Economic
Community of West African States (ECOWAS) to monitor (actually enforce) the peace
process and progressively take control of the entire territory pending return to civilian rule
by May 1997.
In September 1996, a town, Tubmanburg (located 50 km North of Monrovia, the capital),
Bomi county, which had been totally besieged for over 4 months by the fighting forces
was relieved by Ecomog forces (Nabeth P et al, 1997). Initially, an assessment was
conducted by a joint UN-NGO team in Tubmanburg. The assessment team found very
large numbers of severely malnourished children, adolescents and adults – with an initial
assessment of over 1000 severely malnourished people in urgent need of care. Three
therapeutic feeding centres were immediately established, two by Action Contre la Faim
and one by Medcines Sans Frontiere.
73
An epidemiological assessment by Dr Pierre Nabeth about 3 weeks after the start of the
relief operation by ACF, between October 4 and October 10, 1996 of Tubmanburg
(population size 22,338 mostly made of displaced refugees), according to Nabeth and
Michelet, 1996, indicate that out of 4160 people who died in the previous 4 months, 1916
were under 5 years. The main cause of death was malnutrition. The severe malnutrition
prevalence was 32.0 % and the proportion admitted in nutrition facilities was 42.1%.
Professor Michael Golden visited Tubmanburg from the 12 – 18th October 1996, and
found out that a reported outbreak of epidemic beriberi by Nabeth was rather epidemic
oedema due to kwashiorkor
The security situation was particularly hazardous. The relief teams could only work in
Tubmanburg from about 10 am until 4 p.m. .The residents of the TFCs could not
therefore be fed at night. Given these circumstances, where very large numbers of
patients had to be managed under conditions of extreme insecurity, it was observed that
there were remarkably few deaths in comparison to patients treated in other parts of
Africa, and the rate and extent of recovery were excellent. It is the objective of this
project to examine the records of these patients in detail and to compare the outcome of
the patients from Tubmanburg with those from other centres in Liberia and West Africa
where much better facilities existed.
The clinical records of over 600 patients treated in ACF’s therapeutic feeding centres
after ECOMOG relieved the siege of Tubmanburg were transported back from Liberia to
Aberdeen by the staff of ACF in Liberia and Paris.
Hypothesis: The mortality rate was significantly lower and the rates of recovery
comparable to other centres, which were able to provide 24h care in a more secure
environment.
Study Design:

74
A retrospective case study of patients who were treated at therapeutic feeding centres at
Tubmanburg using clinical records.
Measurements
The main measures would include age, sex, date of admission and discharge, outcome
(discharged, transferred, died, abandoned etc.), number days of diarrhoea on admission,
number of days of vomiting, body temperature measurements (< =35.5-hypothermia,>=
39-fever), number of days of dehydration, number of days of rapid respiratory rate,
number of days with pallor, days in phase one, days in phase two, care practices (IV
fluids given, Use of NG tube, diets used e.g. F75, F100, porridge, breastfeeding etc.),
oedema, MUAC on admission and discharge, daily weight until discharge and height (on
admission and discharge).
Statistical Analysis
Statistical analysis would be done using RS1 and SPSS for windows to determine the rate
of recovery and the clinical course of patients, and compared to the time frame for the
management of a child with severe malnutrition and recommendations for management of
severe malnutrition (WHO, 1999)
Data Handling and Storage:
Data were collected on Action Internationale Contre la Faim (AICF) treatment cards for
therapeutic feeding centres by health personnel and stored later at the Department of
Medicine and Therapeutics, University of Aberdeen by Professor Michael Golden.
Problems
Due to the very low staff-patient ratio and the exigencies of the emergency there are
incomplete records and missing data, There is no possibility of correcting for these
missing data.
75
Use of Results
Result of this research would be used to improve future management of severely
malnourished people under similar circumstances.
References
Isabelle Beauquesne. Action Contre la Faim. Internal reports and statistical analysis of
the TFCs in Tubmanburg, Sept-Dec 1996, unpublished.
WHO,1999 . Management of severe malnutrition: a manual for physicians and other
senior health workers
Nabeth P, Michelet M. Demographic and Nutritional Assessment Tubmanburg, Bomi
County, Liberia 1996 (Unpublished)
Nabeth P, Michelet M, Gallais G, Claus W. Demographic and nutritional consequences
of civil war in Liberia (letter). Lancet 1997; 349: 59-60

76
Appendix 1Report4 of AKF MeetingComit6 Scienfif que Consultatif de Nutrition
A mineral/vitamin pre-mix to be added to cereal/pulse based diets for supplementary feeding programmesgiven to mild/moderately undernourished populations
Desirable Safe Upper Lower FinalNutrient Density Threshold Mineral
Unit Density Limit Density Pre-mix
Minerals: all values are per 10Okcal
K mmol 4.8 7.2 1.85 4.0mg 190 280 74 160
Na mmol 2.6 5.1 1.15 2.6mg 60 120 26 60
Mg mmol 1.2 4.1 0.4 0.8mg 30 100 10 20
Ca mmol 2.1 3.0 0.7 2mg 84 120 28 80
p mmol 2.2 3.3 0.7 1.5mg 70 100 21 45
Fe PM01 18 18 8.7 11mg 1 1.0 0.5 0.6
Zn PM01 14 16 5.9 11mg 0.9 1.0 0.4 0.7
Cu PM01 L5 5.3 0.44 0.7pg 95 340 28 50
Se nmol 45 190 23 60pg 3.6 15 1.85 5.0
1 nmol 70 265 36 110pg 9.0 34 4.6 15
Mn Pmol 0.3 0Cr nmol 2.0 1MO ranol 5.0 3F Pmol <1 0.3
Vitamins and essential fatty acids: all values are per lOokcal
Water-soluble vitaminsThiamine pg 70 17.000 23 70Riboflavine "g 110 00 43 200Pyridoxine pg 75 1800 40 90Niacin "g 1000 17000 440 1300Vitamin B 2 ng 100 7000 33 200Folic acid pg 25 180 5.4 40Vitamin C mg 4.5 35 0.78 8.0Biotin big 5 v. high =0.2 10Pantothenic acid mg 0.6 v. high =0.7 1.0
Fat-soluble vitamins

77
Vitamin A Pg 60 100 20 80Vitamin D pg 1.0 2.4 0 1.0Vitamin E mg 2.4 >100 =0.2 4.0Vitamin K 99 3.6 high ? 4.0
Essential fatty acidsn-6 (Iinoleic acid) kcal 4.5 15 1.0n-3 (ot-linolenic acid) kcal 0.5 5 0.2
Total lipid kcal 25-55 ? 16
*The essential fatty acids should be provided by the basic ingredients of the food. Where the cereal and pulse do not provide thisamount then an appropriate vegetable should oil should be included in the recipe.The Desirable Nutrient Density is for the supplementary food. The Safe Upper Density Limit and Lower Threshold Density are forthe whole diet - this may be the supplement alone or a mixture of the supplement and unknown amounts of other foods of unknowncomposition: the mineralIvitamin pre-mix is the amount to be added to a cereal/pulse diet to achieve the Desirable Nutrient Density inthe supplementary food taking the composition of the cereal and pulse into consideration.
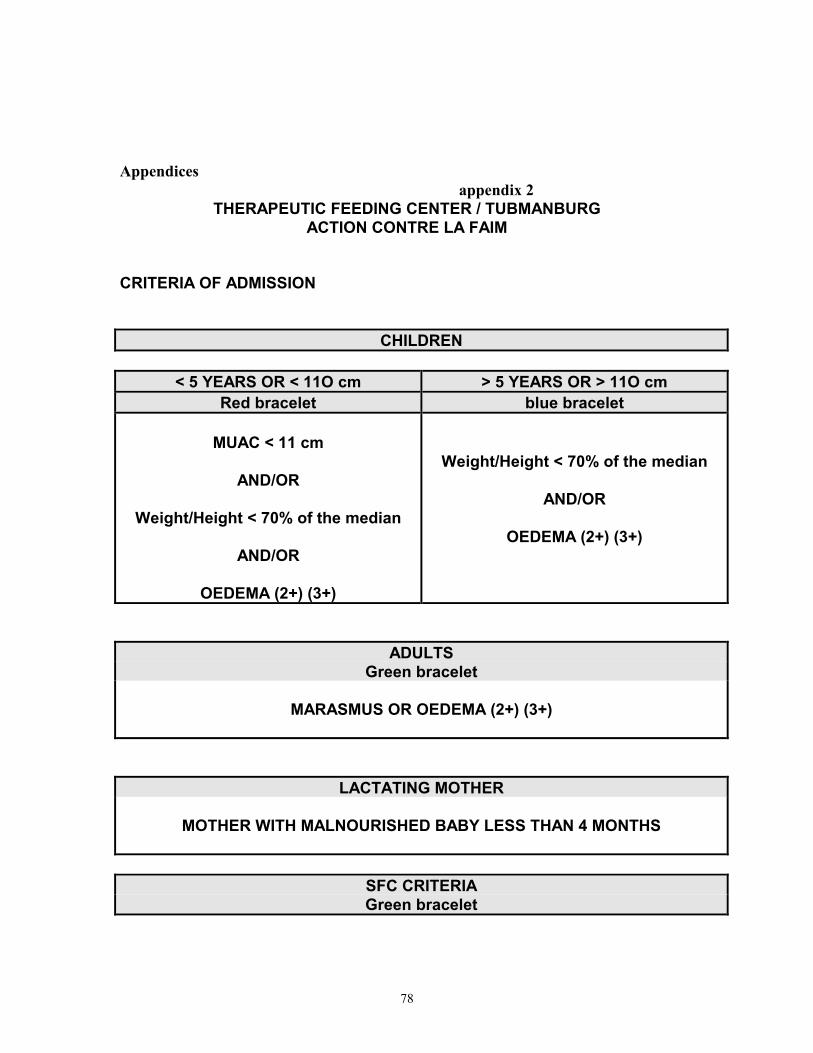
78
Appendices appendix 2
THERAPEUTIC FEEDING CENTER / TUBMANBURGACTION CONTRE LA FAIM
CRITERIA OF ADMISSION
CHILDREN
< 5 YEARS OR < 11O cm > 5 YEARS OR > 11O cmRed bracelet blue bracelet
MUAC < 11 cm
AND/OR
Weight/Height < 70% of the median
AND/OR
OEDEMA (2+) (3+)
Weight/Height < 70% of the median
AND/OR
OEDEMA (2+) (3+)
ADULTSGreen bracelet
MARASMUS OR OEDEMA (2+) (3+)
LACTATING MOTHER
MOTHER WITH MALNOURISHED BABY LESS THAN 4 MONTHS
SFC CRITERIAGreen bracelet

79
brother or sister of severe malnourished child with SFC criteria

80
THERAPEUTIC FEEDING CENTER / TUBMANBURGACTION CONTRE LA FAIM
CRITERIA OF DISCHARGE
1. CURED :A / DISCHARGED TO THE SFC :
CHILDREN< 5 YEARS OR < 11O cm > 5 YEARS OR > 11O cm
MUAC > 11 cmAND
Weight/Height > 80% of the median(after 3 weights)
ANDNO OEDEMA for 15 DAYS
Weight/Height > 80% of the median(after 3 weights)
ANDNO OEDEMA for 15 DAYS
LACTATING MOTHERMOTHER WITH BABY LESS THAN 4 MONTHS
B / DISCHARGED TO THE KITCHEN / HOPE :
ADULTSNO OEDEMA for 15 DAYS
2. DEFAULTER :
A DEFAULTER IS AN ABSENT WHO HAS NOT ATTENDED THE TFC FOR 4CONSECUTUVE DAYS. IF HE COMES BACK AFTER 5 DAYS, HE HAS TO BEREADMITTED AS A NEW ADMISSION, WITH A NEW NUMBER.
3. EXPIRED :
YOU HAVE TO KNOW THE CAUSE OF THE DEATH.
4. TRANSFERED :
THESE WHO ARE TRANSFERRED TO MONROVIA.

81
Appendix 3ACTION CONTRE LA FAIM / 9-27-1996
THERAPEUTIC FEEDING CENTER / TUBMANBURG
PHASE 1< 5 YEARS
red bracelet> 5 YEARS
blue bracelet
THERAPEUTIC MILK = 200 ML THERAPEUTIC MILK = 400 ML
8:30 AM - 10:30 AM12:30 AM - 14:30 PM
8:30 AM - 10:30 AM12:30 AM - 14:30 PM
PHASE 2< 5 YEARS
red bracelet> 5 YEARS
blue bracelet
THERAPEUTIC MILK = 400 ML THERAPEUTIC MILK = 600 ML
8:30 AM - 10:30 AM12:30 AM - 14:30 PM
8:30 AM - 10:30 AM12:30 AM - 14:30 PM
PORRIDGE TH450 PORRIDGE TH450
12:30 AM 12:30 AM
+ BP5 FOR THE NIGHT
ACTION CONTRE LA FAIM / 10-2-1996THERAPEUTIC FEEDING CENTER / TUBMANBURG
ADULTSgreen bracelet

82
PHASE 1 PHASE 2
THERAPEUTIC MILK = 400 ML THERAPEUTIC MILK = 400 ML
8:30 AM - 10:30 AM
12:30 AM - 14:30 PM
8:30 AM - 10:30 AM
12:30 AM - 14:30 PM
PORRIDGE CSB10:30 AM - 14:30 AM
BP5 / NIGHT

83
ACTION CONTRE LA FAIM / 9-27-1996
THERAPEUTIC FEEDING CENTER / TUBMANBURG
LACTATING MOTHER CARETAKER(+ green bracelet)
PORRIDGE CSB
10:30 AM - 14:30 AM
PORRIDGE CSB
10:30 AM - 14:30 AM
BP5 / NIGHT
ACTION CONTRE LA FAIM / 9-27-1996
appendix 4
PROTOCOLS OF TREATMENT TO BE FOLLOWED IN THE TFC
THERAPEUTIC FEEDING CENTRES / TFC

84
AT the ADMISSION
If it is possible : at admission, the first thing is to give something to drinkto the children when they are waiting for the examination by the nurse andthe proper treatment :
- ReSoMal 5 ml/ kg / hourfor children without oedema. or- Water with sugar : 5 ml / kg / hour (100 ml for 5 gr. of sugar)for children with oedema.
Why ? The severely malnourished children very often have hypoglycaemia or aredehydrated. But we have to be careful with children with oedema : the salt in the ReSoMalcan increase his oedema if he has not a history of diarrhoea !
1. By the registration team :
First, select the very sick children (severe dehydration, diarrhoea, vomiting, ) inthe waiting room and take care of them as a priority .
After : * take the weight, height, muac, oedema and calculate % W/H.* compare it to the admission criteria for TFC :
- W/H < 70 % of the median,- and/or < 6 months don’t take the muac, ≥ 6 months < 11 cm,- and/or oedema,- Adults or children less than 4 months.
* admit them or refer them to the SFC: cards, register, identificationbracelet....
* give some information to the mother about the organisation of the TFC.* don’t forget to ask the mother whether it is an old admission (a child who
was healed and who lose weight after because of a bad follow-up after thedischarge).
2. By the medical team :
First, the PA (or Medical Assistant) has :* to make a complete medical exam of the children (see the clinical
guideline),* to ask the mother about the history of the child, specially about
diarrhoea.* to read the TFC chart,
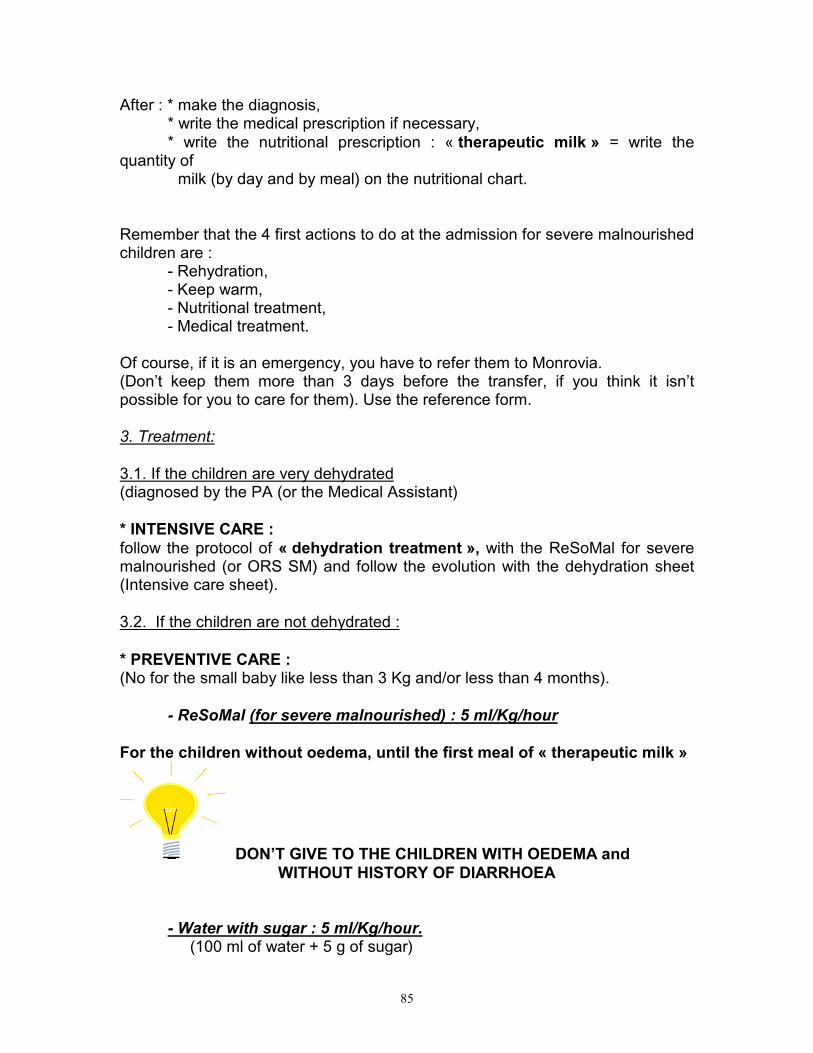
85
After : * make the diagnosis,* write the medical prescription if necessary,* write the nutritional prescription : « therapeutic milk » = write the
quantity of milk (by day and by meal) on the nutritional chart.
Remember that the 4 first actions to do at the admission for severe malnourishedchildren are :
- Rehydration,- Keep warm,- Nutritional treatment,- Medical treatment.
Of course, if it is an emergency, you have to refer them to Monrovia.(Don’t keep them more than 3 days before the transfer, if you think it isn’tpossible for you to care for them). Use the reference form.
3. Treatment:
3.1. If the children are very dehydrated(diagnosed by the PA (or the Medical Assistant)
* INTENSIVE CARE :follow the protocol of « dehydration treatment », with the ReSoMal for severemalnourished (or ORS SM) and follow the evolution with the dehydration sheet(Intensive care sheet).
3.2. If the children are not dehydrated :
* PREVENTIVE CARE :(No for the small baby like less than 3 Kg and/or less than 4 months).
- ReSoMal (for severe malnourished) : 5 ml/Kg/hour
For the children without oedema, until the first meal of « therapeutic milk »
DON’T GIVE TO THE CHILDREN WITH OEDEMA and WITHOUT HISTORY OF DIARRHOEA
- Water with sugar : 5 ml/Kg/hour. (100 ml of water + 5 g of sugar)
86
This is to avoid hypoglycaemia.
For the children with oedema, until the first meal of « therapeutic milk »
When it is the time for the meal and if the children seem to be all right :Start to give them « therapeutic milk » (see the protocol phase 1).
87
Appendix 5THERAPEUTIC FEEDING CENTER / TUBMANBURG
ACTION CONTRE LA FAIM / 9-24-1996.
ADMISSION
SEVERE DEHYDRATION MARASME OEDEMA
ReSoMal(See the protocol)
ReSoMal GLUCOSE
PHASE 1
BABIES < 5 YEARS > 5 YEARS ADULTS
THERAPEUTICMILK + GLUCOSE(See the protocol)
THERAPEUTICMILK
THERAPEUTICMILK
THERAPEUTIC MILK
3O ML / FEEDING4 TIMES / DAY
200 ML / FEEDING4 TIMES / DAY
400 ML / FEEDING4 TIMES / DAY
400 ML / FEEDING4 TIMES / DAY
PHASE 2
BABIES < 5 YEARS > 5 YEARS ADULTS
THERAPEUTICMILK + GLUCOSE(See the protocol)
THERAPEUTICMILK
THERAPEUTICMILK
THERAPEUTIC MILK
Improve thequantity to
400 ML / FEEDING4 TIMES / DAY
600 ML / FEEDING4 TIMES / DAY
400 ML / FEEDING4 TIMES / DAY
60 ML / FEEDING(Try to give theTHERAPEUTIC
MILK)
PORRIDGE =TH450
1 TIME / DAY
PORRIDGE =TH450
1 TIME / DAY
PORRIDGE = CSB2 TIMES / DAY
+ 1 BP5 FOR THE NIGHT
88
LACTATING MOTHERPORRIDGE = 2 TIMES / DAY + ORS (OMS) + BP5
CARE TAKERS (+) Green braceletPORRIDGE = 2 TIMES / DAY
+ 1 BP5 FOR THE NIGHT
LACTATING MOTHERPORRIDGE = 2 TIMES / DAY + ORS (OMS) + BP5
CARE TAKERS (+) Green braceletPORRIDGE = 2 TIMES / DAY

89