Nutritional Metals in Foods by AAS
25
8 Nutritional Metals in Foods by AAS Mary Millikan Sch. of Engineering & Science, FOHES & ISI Victoria University Australia 1. Introduction It is well known that a balanced diet is essential in maintaining good health. Hence, the nutritional value of foods is an important aspect that should be considered especially with respect to metal intake such as iron, calcium, magnesium, potassium, sodium, selenium, manganese, copper, chromium and zinc. Iron being required for the haemoglobin; calcium for relaxing the central nervous system; magnesium to prevent muscle spasms; potassium and sodium for electrolyte balance; selenium has a number of functions including deactivating heavy metals from external exposure; manganese and copper are linked to superoxide dismutase (SOD): chromium stabilizes blood sugar and zinc is important in the healing of wounds. An overview of the literature will be given of applications of Fame AA together with some references to Graphite Furnace AA to the analyses of foods such as: meat the main source of iron; dairy products, the source of calcium and fruit and vegetables for a range of metals. Comparisons will be given of metal content in these products particularly in meat and dairy products. Of the metals listed above, not all of these will be considered in every product: only where they are the metal of highest concentration. The aim of this chapter is to give a general comparison of the metal content in these products, which will not be exhaustive, particularly, with respect to fruit and vegetables but the ones most commonly consumed. The emphasis is on nutrition and to give the general reader and health professional a concise view of the metal content of these food products. From scientific aspect the methodology for Flame AA is relative straight forward, as is the work up for instrument presentation but there are often extra procedures that are required depending on the matrix that are essential for obtaining a valid result. Flame Atomic absorption spectroscopy even though it is a well-established technique that was discovered about fifty years ago is still used extensively today for trace metal analyses in industry, commercial laboratories and universities. 2. History of the discovery of flame atomic absorption spectroscopy The method for the analyses of metals in a wide range of samples from food, agriculture, mining, environmental, pharmaceutical and biochemical industries was made possible by the discovery of a new technique in the early 1950’s by Dr. Alan Walsh. Like many scientists before him, he was not in his laboratory when the idea came to him but in his vegetable garden one Sunday morning in 1952. The idea proved successful and was the basis of the www.intechopen.com
-
Upload
muhammad-ikbal -
Category
Documents
-
view
12 -
download
0
description
Atomic Absorption Spectrocopy
Transcript of Nutritional Metals in Foods by AAS
8
Nutritional Metals in Foods by AAS
Mary Millikan Sch. of Engineering & Science, FOHES & ISI
Victoria University Australia
1. Introduction
It is well known that a balanced diet is essential in maintaining good health. Hence, the nutritional value of foods is an important aspect that should be considered especially with respect to metal intake such as iron, calcium, magnesium, potassium, sodium, selenium, manganese, copper, chromium and zinc. Iron being required for the haemoglobin; calcium for relaxing the central nervous system; magnesium to prevent muscle spasms; potassium and sodium for electrolyte balance; selenium has a number of functions including deactivating heavy metals from external exposure; manganese and copper are linked to superoxide dismutase (SOD): chromium stabilizes blood sugar and zinc is important in the healing of wounds. An overview of the literature will be given of applications of Fame AA together with some references to Graphite Furnace AA to the analyses of foods such as: meat the main source of iron; dairy products, the source of calcium and fruit and vegetables for a range of metals. Comparisons will be given of metal content in these products particularly in meat and dairy products. Of the metals listed above, not all of these will be considered in every product: only where they are the metal of highest concentration. The aim of this chapter is to give a general comparison of the metal content in these products, which will not be exhaustive, particularly, with respect to fruit and vegetables but the ones most commonly consumed. The emphasis is on nutrition and to give the general reader and health professional a concise view of the metal content of these food products. From scientific aspect the methodology for Flame AA is relative straight forward, as is the work up for instrument presentation but there are often extra procedures that are required depending on the matrix that are essential for obtaining a valid result. Flame Atomic absorption spectroscopy even though it is a well-established technique that was discovered about fifty years ago is still used extensively today for trace metal analyses in industry, commercial laboratories and universities.
2. History of the discovery of flame atomic absorption spectroscopy
The method for the analyses of metals in a wide range of samples from food, agriculture, mining, environmental, pharmaceutical and biochemical industries was made possible by the discovery of a new technique in the early 1950’s by Dr. Alan Walsh. Like many scientists before him, he was not in his laboratory when the idea came to him but in his vegetable garden one Sunday morning in 1952. The idea proved successful and was the basis of the
www.intechopen.com
Atomic Absorption Spectroscopy
144
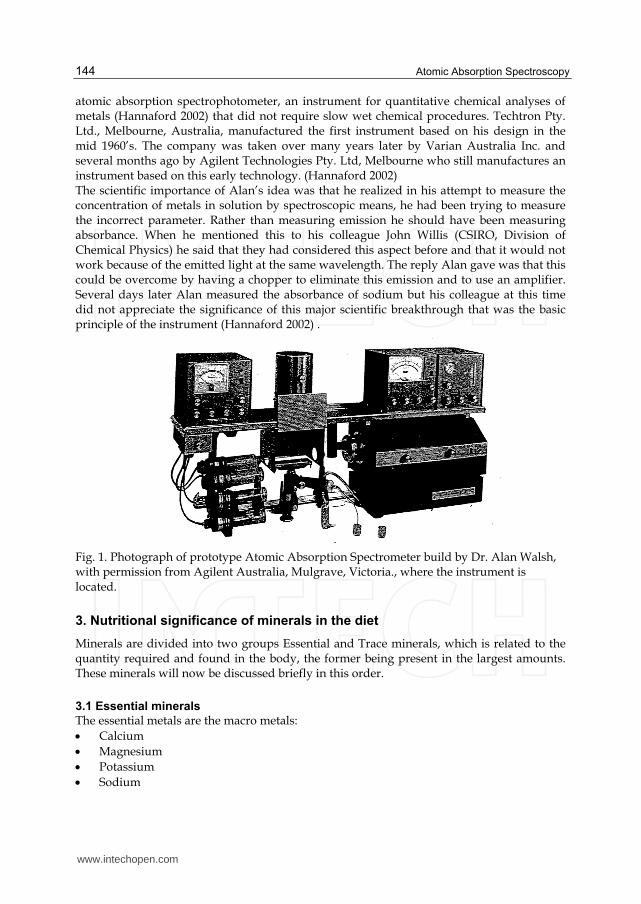
atomic absorption spectrophotometer, an instrument for quantitative chemical analyses of metals (Hannaford 2002) that did not require slow wet chemical procedures. Techtron Pty. Ltd., Melbourne, Australia, manufactured the first instrument based on his design in the mid 1960’s. The company was taken over many years later by Varian Australia Inc. and several months ago by Agilent Technologies Pty. Ltd, Melbourne who still manufactures an instrument based on this early technology. (Hannaford 2002) The scientific importance of Alan’s idea was that he realized in his attempt to measure the concentration of metals in solution by spectroscopic means, he had been trying to measure the incorrect parameter. Rather than measuring emission he should have been measuring absorbance. When he mentioned this to his colleague John Willis (CSIRO, Division of Chemical Physics) he said that they had considered this aspect before and that it would not work because of the emitted light at the same wavelength. The reply Alan gave was that this could be overcome by having a chopper to eliminate this emission and to use an amplifier. Several days later Alan measured the absorbance of sodium but his colleague at this time did not appreciate the significance of this major scientific breakthrough that was the basic principle of the instrument (Hannaford 2002) .
Fig. 1. Photograph of prototype Atomic Absorption Spectrometer build by Dr. Alan Walsh, with permission from Agilent Australia, Mulgrave, Victoria., where the instrument is located.
3. Nutritional significance of minerals in the diet
Minerals are divided into two groups Essential and Trace minerals, which is related to the quantity required and found in the body, the former being present in the largest amounts. These minerals will now be discussed briefly in this order.
3.1 Essential minerals
The essential metals are the macro metals:
Calcium
Magnesium
Potassium
Sodium
www.intechopen.com
Nutritional Metals in Foods by AAS
145
Calcium is responsible for strong bones and teeth and accounts for ninety percent of the
calcium in the body whereas the other one percent is circulating in fluids in order to
ionise calcium. The metal’s function is related to transmitting nerve impulses;
contractions of muscles; blood clotting; activation of some enzyme reactions and secretion
of hormones Magnesium has many roles including supporting the functioning of the
immune system; assists in preventing dental decay by retaining the calcium in tooth
enamel; it has an important role in the synthesis of proteins, fat, nucleic acids; glucose
metabolism as well as membrane transport system of cells. Magnesium also plays a role in
muscle contraction and cell integrity. Potassium and sodium work together in muscle
contraction nerve transmission. Sodium is important in muscle contraction and nerve
transmission Sodium ions are the main regulators of extra cellular fluid and volume
(Whitney and Rofles 2002).
3.2 Trace minerals
These are particularly important for health promotion and prevention of disease. Trace
metals being considered in this work are:
copper,
chromium,
iron,
manganese,
molybdenum
selenium
zinc. The non-metals also in the group are iodine and fluorine that will not be discussed.
Copper has the role of assisting in the formation of haemoglobin, helping to prevent
anemia as well as being involved in several enzymes. Chromium function is related to
stabilising blood sugar levels with respect to insulin required for release of energy from
glucose. Iron is the central metal in the haemoglobin molecule for oxygen transport in the
blood and is portion of myoglobin located in muscles. Manganese is one of the co-factors
in a number of enzymes as is molybdenum. Selenium has several roles such as regulating
the thyroid hormone as well as being part of an enzyme that protects against oxidation
(Whitney and Rofles 2002). Selenium has also been reported as assisting in deactivating
heavy metals.
3.3 RDI of minerals according to age and gender
The Recommended Daily Intake, RDI of metals is related directly to age, and gender. The
requirements for babies,, toddlers,, children , adolescents, and elderly vary with gender and
country due to soil type. These requirements are continually being reviewed in the light of
more research that is undertaken by food regulating bodies such as Food Standards
Australia and New Zealand, FSANZ, United Stated of America, Food and Drug
Administration, FDA, and European Authorities to name three such groups. The work done
by these bodies includes all food groups in addition to vitamins, minerals: cereals, fat,
protein, carbohydrates, sugars and so on, as well as research on different age groups in
particular locations in many countries, to assist in maintaining and improving the health of
the various groups and the population in general.
www.intechopen.com
Atomic Absorption Spectroscopy
146
Major minerals Recommended Daily Intake , RDI
Calcium 1000 mg
Magnesium 350 mg
Potassium 3500 mg
Sodium 2400 mg
Trace minerals
Chromium 120 μg
Copper 2 mg
Iron 15 mg
Manganese 5 mg
Molybdenum 75 μg
Selenium 35 μg
Zinc 15 mg
Table 1. The table above represents RDI values recommended by experts and agencies for a normal adult population. http:// lenntech.com/recommended-daly-intake.htm
3.4 Analyses of foods with respect to safety and toxicity
Fresh foods and others are monitored regularly for safety and to be sure that the level of undesirable metals is below the safe limit or not present at all. Similarly, the dietary surveys test for these as well as the nutritional value of the various food groups.
4. Variation of mineral content according to soil and country
According the age of the rocks that contain the minerals and type of rocks and soil with respect to their geological age, the mineral content will vary considerably, as well as different minerals being found in the respective rocks. There can be similar soil types that occur in countries that are not near each other. For example, gold was found in California and in Australia in the mid 1800’s when the gold rush took place and prospectors came from many countries to make their fortunes. Soil can vary considerably within a particular region, state, territory or through out a particular country with respect to minerals found in the soil. Soils are studied by agriculturalists and farmers, so they can add certain minerals when they are in low levels in order to increase the yield and quality of crops. Even within a particular paddock or field the soil can vary so farmers need to add fertilizers and minerals appropriately in order to obtain a uniform yield of the crop (Dundas and Pawluk 1977). Hence mineral levels for the countries will vary accordingly to the soils and the additives required for maximum crop yield and the fortification of crops, cereals or grains to ensure that the products manufactured would still give sufficient portion of the RDI to maintain the health of the population . RDI allowances of minerals will essentially be very similar in most countries for the various age and gender groups but in some cases extra fortification of foods will be required where there is a low level of an essential or trace mineral.
5. Metals in meat
The principal source of iron in the diet is mainly from meat, particularly, red meat. Other
metals are also important such as calcium, magnesium, sodium and potassium, but are
www.intechopen.com
Nutritional Metals in Foods by AAS
147
generally in lower amounts. Trace metals include: copper, manganese, zinc and
chromium. Metal analyses in meat including beef, pork, poultry and fish will be discussed
with some comments on sample preparation and values of the metals obtained in these
samples
5.1 Selected metals in some meat
A comprehensive study of the analyses of iron, calcium, magnesium, potassium, sodium,
manganese, copper, zinc and manganese in foods including meat was undertaken by
Maurer (Maurer 1977) here he compared three extraction methods using HNO3 or
HCl/HNO3 or dry ashing at 450oC. The main focus of this research was to thoroughly
evaluate each of the three extraction procedures for the metals listed on a wide variety of
food, to determine the daily consumption per person over given time intervals. Recoveries
were also determined for the different extraction methods. Results obtained indicated that
extraction with the combined acids was the most suitable procedure for all metals,
particularly for copper and zinc when compared with dry ashing, which was markedly,
affected by the matrix. Recoveries were high for all metals: in the high nineties except for
zinc that was only 87%. A Perkin-Elmer (model 300) instrument was employed where
calcium and magnesium were analysed with nitrous oxide/acetylene while air/acetylene
was used for the other elements. Siong (Siong, Khor Swan, and Siti Mizura 1989)
compared the analysis of iron in meat and other foods using AA and the phenanthroline
colorimetric method. The two methods compared well for the foods tested and also gave
satisfactory recoveries. Values iron obtained for some meat products are as follows: beef
extract 10.66; canned beef liver rendang 4.20; canned chicken curry 2.82; chicken heart
2.05; corned beef 1.67; duck 0.69; roast4ed duck 0.84; canned mutton curry 3.67 where all
values are expressed as mg Fe/100 g.
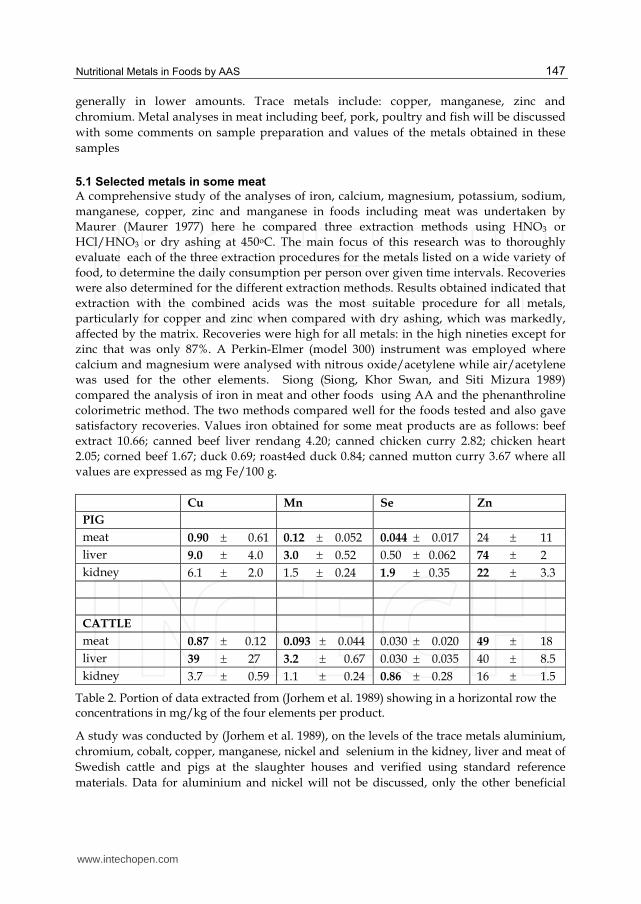
Cu Mn Se Zn
PIG
meat 0.90 0.61 0.12 0.052 0.044 0.017 24 11
liver 9.0 4.0 3.0 0.52 0.50 0.062 74 2
kidney 6.1 2.0 1.5 0.24 1.9 0.35 22 3.3
CATTLE
meat 0.87 0.12 0.093 0.044 0.030 0.020 49 18
liver 39 27 3.2 0.67 0.030 0.035 40 8.5
kidney 3.7 0.59 1.1 0.24 0.86 0.28 16 1.5
Table 2. Portion of data extracted from (Jorhem et al. 1989) showing in a horizontal row the concentrations in mg/kg of the four elements per product.
A study was conducted by (Jorhem et al. 1989), on the levels of the trace metals aluminium,
chromium, cobalt, copper, manganese, nickel and selenium in the kidney, liver and meat of
Swedish cattle and pigs at the slaughter houses and verified using standard reference
materials. Data for aluminium and nickel will not be discussed, only the other beneficial
www.intechopen.com
Atomic Absorption Spectroscopy
148
metals. In general, all the samples were prepared for analysis by dry ashing at 450oC with
some extra procedures required for some metals before ashing. Copper, manganese and zinc
were analysed by Flame AA employing a Vanian AA-6 instrument equipped with a H2 lamp
for background; correction using an air/acetylene flame. The method of standard addition
was used for manganese, hydride/generation AAS for selenium whereas chromium and
cobalt were analysed by graphite furnace AA.
In Table 2, it can be seen in at a glance, the metal content in meat, liver and kidney from pigs
and cattle. From the results shown, it is clear that liver and kidney are good sources of
dietary copper. The manganese levels in this study are low and the authors attribute it the
method of standard additions used in the AA analyses. Reported data shows the best source
of selenium is pig kidney but the results are generally low in Scandinavian due to the soil.
Meat products are an excellent source of zinc, especially liver. Data for chromium is not
shown but the results indicated that these products are a poor source of this metal in the
diet. Cobalt data also is not shown was found to be four times higher in cattle liver than in
pig’s liver being 0.043 0.028. The authors compared their results with the published
literature for the above metals, as well as others, not stated here, for the three parameter in
Table 2 for pigs and cattle and found there was good agreement with other countries that
included Austria, Australia, Finland, FRG, Italy, Norway, Sweden and USA, however, not
all metals studied had data from all of these countries.
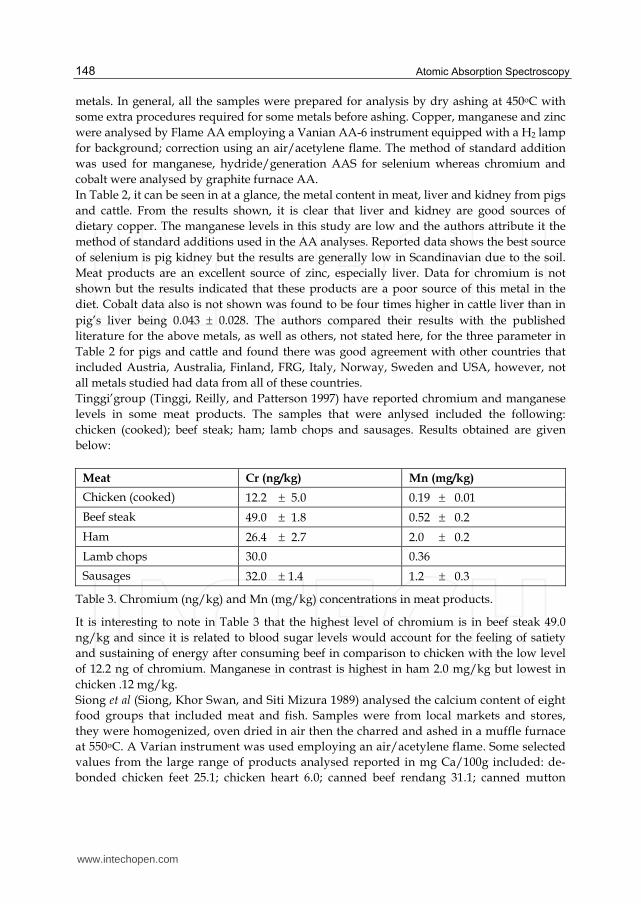
Tinggi’group (Tinggi, Reilly, and Patterson 1997) have reported chromium and manganese
levels in some meat products. The samples that were anlysed included the following:
chicken (cooked); beef steak; ham; lamb chops and sausages. Results obtained are given
below:
Meat Cr (ng/kg) Mn (mg/kg)
Chicken (cooked) 12.2 5.0 0.19 0.01
Beef steak 49.0 1.8 0.52 0.2
Ham 26.4 2.7 2.0 0.2
Lamb chops 30.0 0.36
Sausages 32.0 1.4 1.2 0.3
Table 3. Chromium (ng/kg) and Mn (mg/kg) concentrations in meat products.
It is interesting to note in Table 3 that the highest level of chromium is in beef steak 49.0
ng/kg and since it is related to blood sugar levels would account for the feeling of satiety
and sustaining of energy after consuming beef in comparison to chicken with the low level
of 12.2 ng of chromium. Manganese in contrast is highest in ham 2.0 mg/kg but lowest in
chicken .12 mg/kg.
Siong et al (Siong, Khor Swan, and Siti Mizura 1989) analysed the calcium content of eight
food groups that included meat and fish. Samples were from local markets and stores,
they were homogenized, oven dried in air then the charred and ashed in a muffle furnace
at 550oC. A Varian instrument was used employing an air/acetylene flame. Some selected
values from the large range of products analysed reported in mg Ca/100g included: de-
bonded chicken feet 25.1; chicken heart 6.0; canned beef rendang 31.1; canned mutton
www.intechopen.com
Nutritional Metals in Foods by AAS
149
curry 16.1 and beef extract 40.4. They compared the AA analyses with potassium
permanganate titration where both methods were satisfactory using the paired t-test (p<
.0.05). For only two groups legumes and vegetables there was a significant difference in
the two methods. Analyses of mechanically de-boned poultry from five Dutch processors
was undertaken by (Germs and Stennenberg 1978) employing AA and oxidimetry
procedures. The mean AA calcium content was found to be 2.36 g/kg. Of the two
oxidimetry methods used, the AOAC procedure gave the best agreement with the AA
method where the coefficient of correlation was equal to 0.9996 and the standard error of
regression, 0.05. Nakamura (Nakamura 1973) determined the water-extractable calcium
content of chicken breast during postmortem aging by AA where he addressed the
anionic and cationic interferences. In order to eliminate the anionic interferences, he
added a 1% solution of the di-sodium salt of EDTA to the test solutions. In contrast,
cationic interferences were overcome by adding a known amount of calcium to the test
solutions to being the concentration to 0.1 mM. Results showed that the calcium content
increased during the postmortem aging and reached a maximum after twenty-four hours.
Atomic absorption spectroscopy and a modified AOAC fibre method were used to
determine magnesium and manganese in meat –soy blends. It was found that in regular
ground beef the magnesium and manganese levels were 151 mg/kg and 7.4 mg/kg, 4.9%
soy flour, respectively (Formo, Honold, and MacLean 1974).
Copper and other metals in meat were analysed by (Ybanez, Montoro, and Bueso 1983) using both dry ashing and wet digestion with HNO2 and H2O2 , essentially there was not any significant difference in the two methods of sample preparation. Samples analysed included both cold and cooked ham; mortadella, Frankfurters and liver paste. Recoveries for added metal for copper was found to be 100%. Copper determined in bovine liver standard
was 193 10 μg/g. The limit of detection for copper was determined as 0.17 μg/g. An analysis of copper and zinc in meat and meat analogues was done by Schaefer et al (Schaefer et al. 1979). Sample work up was carried out with nitric/perchloric acid digestion followed by flame AA. The mean zinc content found in meat and meat analogues was 3.36 and 1.07 mg/100g respectively while the copper content was 0.09 and 0.32 mg/100 g in the same product order. It can be seen that there is a contrast between the two metals in meat products: zinc being higher is meat whereas copper is higher in the analogues. Work undertaken by (Dalton and Malanoski 1969) determined copper and lead in meat ad meat products but used dry ashing at 500oC for sample preparation unlike Schaefer’s group who used wet digestion. Copper was found to be in the 1–5 ppm range. Zinc and magnesium were analysed in a range of Philippine foods by AAS. Samples were prepared for analyses by hydrochloric acid extraction of the metals. One of the major advantages of the technique was the short sample preparation time for AA compared to other procedures such as gravimetric and colorimetric methods. A variety of foods were analysed that included meat and poultry (Lustre and Lacebal 1976) Selenium is not an easy metal to analyse and reports in the literature are few. Research by (Hoenig and van Hoeyweghen 1986) determined selenium and arsenic in animal tissues and addressed the spectral interferences that are due to calcium and magnesium phosphates. Their method employed platform furnace atomic absorption spectrometry and deuterium background correction. The interferences just mentioned cannot be corrected using the deuterium arc. To overcome these interferences in animal tissues, they added nickel nitrate to the samples. The quantity added is critical as less than 20 mμg nickel nitrate added to a 10
www.intechopen.com
Atomic Absorption Spectroscopy
150
μl sample does not allow correct development of analyte absorbance signals but more than this causes a loss of sensitivity. It was found that the measurement of peak height was the most suitable approach as integrated absorbance was partly influenced by the matrix. For different animal matrices the slope constants of working curves obtained were very close hence direct calibration was possible. Results were verified by analyses of a number of reference materials. Investigation of the effect of adding selenium to chicken feed on the amount found in
chicken meat and eggs was done by (Turker and Erol 2009). The method used was hydride-
generation atomic absorption spectrometry. Optimisation of conditions for the technique
such as HCl and NaBH4 concentrations; flow rate of carrier gas; analytical parameters and
the effects of digestion procedures on the analyses were all determined. The limits for
detection and quantification were 0.78 and 2.35 mg/l respectively. Validation of the method
was done by means of certified reference materials. Fortification of the chicken feed
increased the levels of selenium in the meat and eggs. Four digestion methods: two dry
ashing and two wet ashing procedures for trace metal analysis of Pb, Cd, Cu and Zn were
evaluated for pork meat and fish (Zachariadis et al. 1995). Results showed that the wet
ashng with HNO3/HCl mixture gave the best results: For pork meat the copper level was
determined to be 0.208 mg/kg and zinc 7.63 mg/kg. The data was collect on a Perkin-Elmer
Model 2380 instrument with a HGA-400 graphite furnace that included a Deuterium lamp
background corrector.
6. Metals in fish
Most of the analyses of metals in fish are related to heavy metals analysis to monitor
pollutants such as zinc, cadmium, mercury and arsenic. Such metals find their way into the
marine life in estuaries and rivers due to effluent from heavy industry accidentally leaking
into the water ways or by faulty filtering systems and practice that do not comply with the
Environmental Protection Agency in that particular country. Most commercial fishing is
undertaken in deep-sea waters where these metals would not be a problem, however, fish
caught in rivers and estuaries that are many kilometers from heavy industry can sometimes
still be affected by metals carried by currents that cause pollution where it is not expected.
Reports of beneficial metals analysed by AA in fish are few. Salmon, for example is a good
source of calcium since in canned products the bones are not usually removed, except in
specialty products. In this discussion emphasis will be given to t nutritional metals and the
other metal pollutants will not be mentioned. In their paper, (Carvalho, Santiago, and Nunes
2005) stated that fish are an important source of lipids, proteins, liposoluble vitamins and
polyunsaturated fatty acids that are important in assisting to reduce hypertension, cancer
risk and coronary heart disease.
6.1 Limited references to some beneficial metals in fish
An analysis of essential and heavy metal levels in edible fish muscle was undertaken by
(Carvalho, Santiago, and Nunes 2005) who employed two different techniques: energy-
disperive X-ray fluorescence (EDXRF) and flame AAS. Samples of nine fish were analysed,
namely, Forkbeard (For), Meagre (Mea), White sea bream (WSB), Axillary sea bream (ASB),
Red sea bream (RSB), Common sea bream (CSB), Rockfish (Roc), Common sole (Cso),
www.intechopen.com
Nutritional Metals in Foods by AAS
151
Anglerfish (Ang) and Octopus (Oct) that came from coastal markets in Portugal. Flame AAS
was used to determine the content of Cu, Cr, Ni, Hg, Pb and Cd employing a Varian
(Australia) Spectr AA20 spectrometer. Sample preparation was achieved by means of
incineration and dissolution in nitric acid. An EDXRF spectrometer was used for the
determination of K, Ca, Fe, Rb, Se and Zn. Of the elements studied, it was fond that calcium
and potassium were the most abundant elements detected in the fish samples. The highest
potassium level detected was found in octopus with an average value of 12,660 μg/g dry
weight and the lowest in Axillary sea bream being 6.170 μg/g. Common sea bream had the
highest calcium content of 788 μg/g whereas White sea bream had the lowest value of 444
μg/g. The highest iron concentration in these fish was observed for Octapus at 109 μg/g
and the lowest for Forkbeard at only 6.4 μg/g. In a Turkish study, nine fish were studied for
their trace metal levels. The fish from the Black Sea were: European anchovy; Whiting; Red
mullet; Bluefish; Atlantic horse mackerel; Flathead mullet and Atlantic bonito. Two species
from the Aegean Sea were Black swordfish and Gilthead sea bream. A Perkin Elmer
AAnalyst 700 AAS instrument equipped with a HGA graphite furnace and deuterium
background correction was used for the analyses of chromium, copper, lead and nickel.
Flame AA with an air/acetylene flame was employed by (Uluozlu et al. 2007) to determine
the copper, iron, manganese and zinc content of fish samples.. Of the fish studied, Bluefish
had the highest copper content of 1.83 ± 0.10 μg/g and the lowest level for European
anchovy ± 0.08 μg/g. For chromium, the highest level was again for European Anchovy at
1.98 ± 0.10 μg/g but the lowest value for Atlantic horse mackerel 0.95 ± 0.07 μg/g; red
mullet has the highest iron level 163 ± 12 μg/g and Bluefish the lowest 698.6 ± 5.3 μg/g;
manganese gave the highest level of .54 ± 0.50 μg/g and the lowest for Bluefish 1.28 ± 0.10
μg/g and lastly zinc had the highest level for Red mullet of 106 ± 9.1 μg/g and the lowest
level for Bluefish at 35.4 ± 3.2 μg/g. Hence, it can be seen that Red mullet had the highest
zinc and iron levels, which were considerably higher than any of the other metals just
mentioned in this analysis.
7. Metals in some dairy products
Traditionally, dairy foods are the main source of calcium in the diet where milk, yogurt and
cheese are the foods commonly consumed. Calcium and also magnesium are the most
important metals for building strong bones and teeth and to prevent rickets and
osteoporosis in older citizens particularly women. Vitamins A and D as well am magnesium
are usually added to over the counter dietary supplements to ensure adequate absorption of
the calcium. In addition, magnesium is also present in milk and dairy products but ii is in
larger quantities in leafy green vegetables in the form of chlorophyll being the central metal.
Although magnesium is present in dairy products it is in considerably lower concentrations
so the following discussion with be focusing mainly on calcium.
7.1 Calcium and some other metals in milk and yogurt
A method for the analysis of calcium and magnesium in dairy products has been reported
by (Brandao, Matos, and Ferreira) employing a high resolution continuum source flame
atomic absorption spectrometer (HF-CS-FAAS) using secondary lines. The advantage of
using these secondary lines is that samples with high concentration of these elements did
www.intechopen.com
Atomic Absorption Spectroscopy
152
not need substantial dilution. Samples of milk powder, cow milk and yogurt were obtained
from local supermarkets in Salvador City Brazil. In order to prepare the samples for analysis
two methods were used: slurry sampling and digestion. Data obtained indicated that there
was not any significant difference in the results for the two procedures. The instrument used
was an Analytik jenna Model ContrAA 300 High Resolution-Continuum Source Flame
Atomic Absorption Spectrometer (GI.E. Berlin, Germany) equipped with a xenon short-arc
lamp XBO 301 with a nominal power of 300 watt. A nitrous oxide/acetylene flame was used
for the for the analysis of calcium and magnesium. For yogurt samples the calcium and
magnesium levels were found to be 1.40 and 0.13 mg/g respectively. Values of calcium and
magnesium in whole milk were 1.23 and 0.12 mg/mL respectively while for skim milk the
concentrations were almost the same. In milk powder, however, the values were higher,
namely, 8.92 and 0.83 mg/g for calcium and magnesium in this order. In contrast for skim
milk the calcium and magnesium concentrations were 1.21 and 0.118 mg/g. A detailed
study by (Miquel et al. 2005) for calcium, iron and zinc in toddler milk-based formula were
861 ±, 27; 12 ± 5; 7 ± 5 mg/L and for soluble fraction in the same product the values obtained
were 704 ± 24; 7 ± 1 and 5 ± 1 mg/L, respectively. The chromium content of acidaphilus milk
culture was reported by (Larsen and Rasmussen 1991) as 0.76 ng/mL: for cream 0.67
ng/mL; low fat cream, 13% fat, 0.77 ng/mL and yogurt 2.2 ng/mL.. A value of 14.3 4.0
mg/kg for chromium and 0.27 0.05 mg/kg for manganese in yogurt was reported by
(Tinggi, Reilly, and Patterson 1997).
7.2 Manganese and chromium levels in milk powders
A procedure for the determination of manganese in dried milk employing a Zeeman furnace
AAS was reported by (Koops and Westerbeek 1993). Samples were prepared for analysis by
boiling them in nitric acid for 15 minutes then adding magnesium and palladium as matrix
modifiers. Manganese levels were determined in 36 dried whole milk powder samples. It
was found that the average manganese concentration of the samples was 0.21 mg/g of total
solids present. Hence, these results showed that it was possible to calculate the manganese
content for reconstituted milk as approximately 25 μg/kg. An analysis of the chromium and
manganese levels in skim milk was determined by (Tinggi, Reilly, and Patterson 1997) who
found they were 6.7 ± 1.5 ng/kg and 0.40 ± 0.20 ng/kg respectively.
7.3 Molybdenum in milk products
Although molybdenum is a essential trace metal, there are few references in the literature of
atomic absorption analyses of molybdenum in foods, this may be because it is not a straight
forward metal to analyse, as matrix modifiers are required. Determination of the
concentration of molybdenum in skimmed milk based drinks and infant food samples was
done by (Regina de Amorim et al.) using a graphite furnace AAS. A considerable amount to
time was spent in evaluating matrix modifiers and temperature programming to optimize
the procedure. Samples were obtained from a local store in Brazil: they were dissolved in
ultra pure water, sonicated then used without further pre-digestion. The analyses were
performed on a Perkin Elmer AAnalyst 300 atomic absorption spectrometer (Norwalk,
CT,USA) fitted with an HGA 800 graphite furnace and AS-72 autosampler using argon
purge gas. Values obtained for the molybdenum levels in the milk products are given
below:
www.intechopen.com
Nutritional Metals in Foods by AAS
153
Milk products Mo level (g/g)
Skimmed milk 0.034 ± 0.01
Whole milk:
Sample (A) 0.37 0.05
Sample (B) 0.22 0.03
Sample (C) 0.27 0.02
Sample (D) 0.30 0.04
Sample (E) 0.40 0.02
Infant formula
Sample (A) 0.43 0.03
Sample (B) 0.36 0.01
Sample (C) 0.37 0.06
Milk based drinks
Sample (A) 1.57 0.28
Sample (B) 0.040 0.006
Sample (c) 0.32 0.01
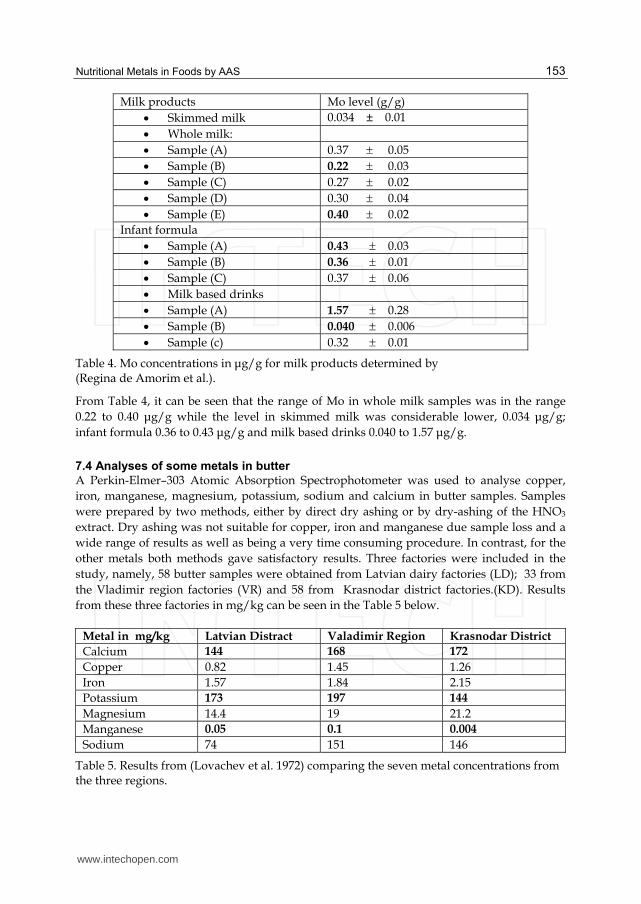
Table 4. Mo concentrations in μg/g for milk products determined by (Regina de Amorim et al.).
From Table 4, it can be seen that the range of Mo in whole milk samples was in the range
0.22 to 0.40 μg/g while the level in skimmed milk was considerable lower, 0.034 μg/g;
infant formula 0.36 to 0.43 μg/g and milk based drinks 0.040 to 1.57 μg/g.
7.4 Analyses of some metals in butter
A Perkin-Elmer–303 Atomic Absorption Spectrophotometer was used to analyse copper,
iron, manganese, magnesium, potassium, sodium and calcium in butter samples. Samples
were prepared by two methods, either by direct dry ashing or by dry-ashing of the HNO3
extract. Dry ashing was not suitable for copper, iron and manganese due sample loss and a
wide range of results as well as being a very time consuming procedure. In contrast, for the
other metals both methods gave satisfactory results. Three factories were included in the
study, namely, 58 butter samples were obtained from Latvian dairy factories (LD); 33 from
the Vladimir region factories (VR) and 58 from Krasnodar district factories.(KD). Results
from these three factories in mg/kg can be seen in the Table 5 below.
Metal in mg/kg Latvian Distract Valadimir Region Krasnodar District
Calcium 144 168 172
Copper 0.82 1.45 1.26
Iron 1.57 1.84 2.15
Potassium 173 197 144
Magnesium 14.4 19 21.2
Manganese 0.05 0.1 0.004
Sodium 74 151 146
Table 5. Results from (Lovachev et al. 1972) comparing the seven metal concentrations from the three regions.
www.intechopen.com
Atomic Absorption Spectroscopy
154
It can be seen from Table 5 that the highest metal concentration was potassium in the Valadimir Regiion, 197 mg/kg followed by 173 mg/kg in the Latvian District. Calcium was the metal with the highest concentration of 172 mg/kg in the Krasnodar District. In the Valadimir Region the calcium level was 168 mg/kg but in the Latvian District it was 144 mg/kg. The metal with the lowest concentration in these three regions was for manganese: 0.05 mg/kg; 0.1 mg/kg and 0.004 mg/kg for Lativan, Valadimir and Krasnodar areas, respectively.
7.5 Chromium levels in cheese
Results are given below for analyses obtained by (Larsen and Rasmussen 1991) using a Zeeman graphite furnace atomic absorption spectrometry to determine chromium, cadmium and lead in some Danish dairy products including cheese. Only data for chromium in cheese samples will be presented here. A Perkin Elmer model 5000 Zeenam atomic absorption instrument with a HA 500 graphite furnace and autosampler AS40 were employed for the analyses. Cheese samples were cut into small cubes then ashed in a bomb with nitric acid for four hours then ashed overnight. Chromium concentrations for six cheese samples that the authors state are only indicative, due to the small sample set, will now be given: Brie 45, 20 ng/mL; Camembert 30, 13 ng/mL; Danbo 45, 8.6 ng/mL; Danbo 45, 19 ng/mL; Havarti 60, 4.6 ng/mL and Maribo 45, 20 ng/mL. The authors state that the results obtained in this work compare well with other countries. Chromium and manganese
levels in cheese were also reported by (Tinggi, Reilly, and Patterson 1997) as 95.0 29.2
ng/kg and 1.1 0.2 mg/kg, respectively.
8. Selected metals in fruit
Some of the metal analyses on fruit products are, in fact, related to metal analyses in fruit
juices and purees that are often related to authenticity and country or region of origin. This
is to detect adulteration with an inferior juice since metal analyses are indicative of the soil
type and hence the location. Authenticity studies including metal analyses are usually in
conjunction with other techniques such as GC/MS as well as AAS. Some examples will be
given on juice and fruit with a limited number of metals. Other studies are related to
contaminants such as tin from canned fruit and juices. Even though this article is directed to
nutritional metals a few examples will be given of tin concentrations in canned fruit
products for interest.
8.1 Examples of metal analyses in fruit juices and purees
Selenium levels in wild fruit juice from the mountainous area in north China, Lantingguo, was reported by (Yongming et al. 1996) using a graphite furnace AAS. Electrothermal atomic absorption spectrometry using a Perkin-Elmer 5000 atomic absorption spectrometer linked to a Model HGA 500 graphite furnace with a selenium HCL was the instrument set up employed for this work. This analysis was complicated by the fact that there were other interfering ions present in the juice, hence matrix modifiers were necessary. It was found that the modifier consisting of 10 μg of platinum and 200 μg of nickel gave the most satisfactory results. As already mentioned the metal content in the juice are related to the different fruit growing regions. Other metals found in these locations that interferes with the Se analyses include: potassium greater that 1000 mg/L followed by calcium, magnesium,
www.intechopen.com
Nutritional Metals in Foods by AAS
155
manganese, iron, phosphorous and zinc in lower amounts 100 – 1000 mg/l. There were also trace amounts of cadmium, copper, lead, nickel, silicon, strontium and selenium. The average values found for eight determinations of three juices from fruit grown in different locations in the above region were: 0.20, 0.23 and 0.10 mg/L selenium. Tin is not a desirable metal but a contaminant and was analysed in a number of juices, purees and fruit by the Comite Europeen de Normalisation (Foodstuffs. Determination of trace elements. Determination of tin by flame and graphite furnace atomic absorption spectrometry (FAAS and GFAAS) after pressure digestion 2009) in a collaborative study.. Some of the products analysed included: carrot puree, tomato puree, pineapple, mixed fruits, powdered peach and tomato. Samples were prepared by pressure-assisted digestion then analysed by flame AAS or graphite furnace AAS. Data obtained for the products analysed were in the range of 43 – 260 mg/kg for AAS and or 2.5 – 269 mg/kg for graphite furnace AAS.
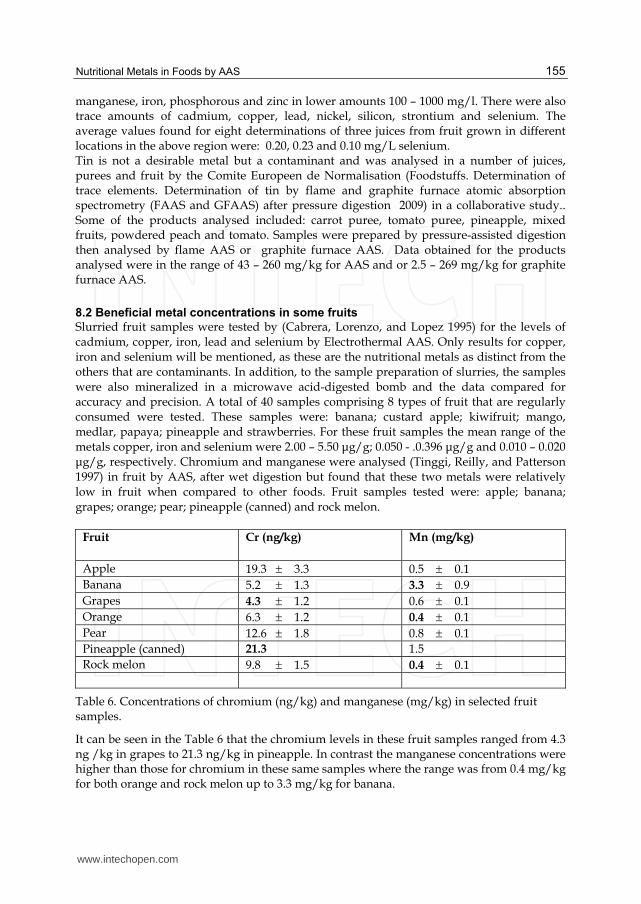
8.2 Beneficial metal concentrations in some fruits
Slurried fruit samples were tested by (Cabrera, Lorenzo, and Lopez 1995) for the levels of cadmium, copper, iron, lead and selenium by Electrothermal AAS. Only results for copper, iron and selenium will be mentioned, as these are the nutritional metals as distinct from the others that are contaminants. In addition, to the sample preparation of slurries, the samples were also mineralized in a microwave acid-digested bomb and the data compared for accuracy and precision. A total of 40 samples comprising 8 types of fruit that are regularly consumed were tested. These samples were: banana; custard apple; kiwifruit; mango, medlar, papaya; pineapple and strawberries. For these fruit samples the mean range of the metals copper, iron and selenium were 2.00 – 5.50 μg/g; 0.050 - .0.396 μg/g and 0.010 – 0.020 μg/g, respectively. Chromium and manganese were analysed (Tinggi, Reilly, and Patterson 1997) in fruit by AAS, after wet digestion but found that these two metals were relatively low in fruit when compared to other foods. Fruit samples tested were: apple; banana; grapes; orange; pear; pineapple (canned) and rock melon.
Fruit Cr (ng/kg) Mn (mg/kg)
Apple 19.3 3.3 0.5 0.1
Banana 5.2 1.3 3.3 0.9
Grapes 4.3 1.2 0.6 0.1
Orange 6.3 1.2 0.4 0.1
Pear 12.6 1.8 0.8 0.1
Pineapple (canned) 21.3 1.5
Rock melon 9.8 1.5 0.4 0.1
Table 6. Concentrations of chromium (ng/kg) and manganese (mg/kg) in selected fruit samples.
It can be seen in the Table 6 that the chromium levels in these fruit samples ranged from 4.3 ng /kg in grapes to 21.3 ng/kg in pineapple. In contrast the manganese concentrations were higher than those for chromium in these same samples where the range was from 0.4 mg/kg for both orange and rock melon up to 3.3 mg/kg for banana.
www.intechopen.com
Atomic Absorption Spectroscopy
156
Fifteen elements were analysed by flame AAS after microwave-assisted digestion of the cultivar citrus reticulate Blanco CV. Ougan fruits. The analyses gave high concentrations of these metals at both of the ripeness stages (Mojsiewicz-Pienkowska and Lukasiak 2003)
8.3 Analyses of tin a contaminant in canned fruit and fruit juices
A report by (Dogan and Haerdi 1980) on the analysis of the tin content in peaches, pears, pineapple, mandarin, peeled tomato and fruit cocktail by a number ot techniques including AAS will now be presented. Sample preparation was achived by using Lumatom, which is a trade organic chemical that contains quaternary ammonium hydroxide suspended in isopropanol. After this sample preparation procedure the.fruit and juice samples were introduced directly into the graphite AAS instrument. The tin concentrations levels were: quartered mandarin 68 ppm; peeled tomato 57 ppm and fruit cocktail 57 ppm. Rigin (Rigin 1979) used flameless AAS to determine the tin levels in canned tomato, apple and orange juice. The results for 5 replicates of each sample after three months storage for canned tomato, apple an orange juice were 12.1, 2.75 and 30.5 μg/ml respectively. After twelve months, however, the values had increased to 76.3, 4.26 and 45.4 μg/ml for the samples in the same order as for three months storage. Wehrer et al (Wehrer, Thiersault, and Laugel 1976) used AAS with wet and dry ashing to determine tin content of canned samples including stewed apples. The concentration of tin in the stewed apples for ten replicates was 52.4 mg/kg after 2N HCl digestion and 57.5 mg/kg after dry ashing that involvd calcinations using magnesium nitrate. Vijan and Chan (Vijan and Chan 1976) determined the tin content of a number of different types of samples including apple, apple/cherry, apple/pineapple and tomato juices. For the first three products the tin level was less than 0.1 μg/ml but for tomato juice it was considerably higher at 90 μg/ml.
9. Metal levels in vegetables
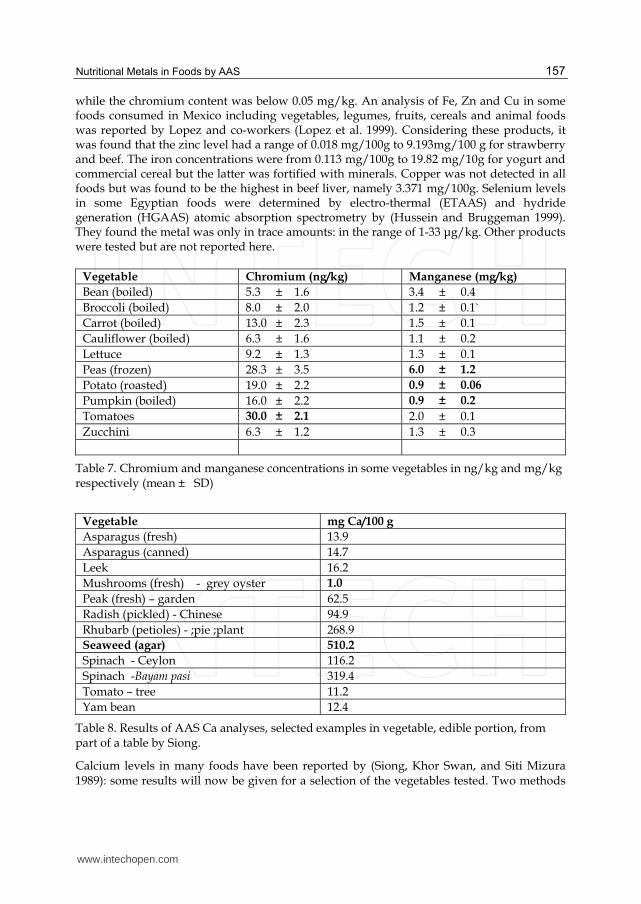
Detailed analyses of chromium and manganese on a wide range of food groups has been undertaken by (Tinggi, Reilly, and Patterson 1997) at this point in time the discussion will be limited to vegetables. The results show that the chromium levels are lower (ng/kg) in the vegetables analysed than in manganese (mg/kg) where the sample sizes ranged from 3 to 5 per vegetable. Vegetables studied included: beans (boiled); broccoli (boiled); carrot (boiled); cauliflower (boiled); lettuce; peas (frozen); potato (roasted); pumpkin (boiled);); tomatoes and zucchini. Portion of the data for these two elements have been extracted from the study under consideration in this section and will be presented below in Table 7. It can be seen from Table 7 that the highest level of chromium is in tomatoes, 30 ng/kg, and the lowest level in boiled bean 5.3 ng/kg. Whereas for manganese the highest level was for frozen peas, 6.0 mg/kg, while the lowest value was for potato and pumpkin that were equal at 0.9 mg/kg. Hence tomato is a good source of chromium, which stabilizes the blood sugar levels and peas are a good source of manganese. A study on the mineral levels in some Slovenian foods that are regularly consumed was undertaken by (Zuliani et al. 2005) After sample workup employing microwave-assisted digestion the samples were analysed by flame and electrothermal atomic absorption spectrophotometer. The minerals content investigated in this study were, Zn, Cu, Cd, Pb and Ni. It was found that the samples tested did not contain any Cd, Pb or Ni contamination. Zinc levels reported for cabbage and tomatoes were less than 50 mg/kg. Copper content, in contrast, was between 2 and 3 mg/kg in the majority of the samples
www.intechopen.com
Nutritional Metals in Foods by AAS
157
while the chromium content was below 0.05 mg/kg. An analysis of Fe, Zn and Cu in some foods consumed in Mexico including vegetables, legumes, fruits, cereals and animal foods was reported by Lopez and co-workers (Lopez et al. 1999). Considering these products, it was found that the zinc level had a range of 0.018 mg/100g to 9.193mg/100 g for strawberry and beef. The iron concentrations were from 0.113 mg/100g to 19.82 mg/10g for yogurt and commercial cereal but the latter was fortified with minerals. Copper was not detected in all foods but was found to be the highest in beef liver, namely 3.371 mg/100g. Selenium levels in some Egyptian foods were determined by electro-thermal (ETAAS) and hydride generation (HGAAS) atomic absorption spectrometry by (Hussein and Bruggeman 1999). They found the metal was only in trace amounts: in the range of 1-33 μg/kg. Other products were tested but are not reported here.
Vegetable Chromium (ng/kg) Manganese (mg/kg)
Bean (boiled) 5.3 ± 1.6 3.4 ± 0.4
Broccoli (boiled) 8.0 ± 2.0 1.2 ± 0.1`
Carrot (boiled) 13.0 ± 2.3 1.5 ± 0.1
Cauliflower (boiled) 6.3 ± 1.6 1.1 ± 0.2
Lettuce 9.2 ± 1.3 1.3 ± 0.1
Peas (frozen) 28.3 ± 3.5 6.0 ± 1.2
Potato (roasted) 19.0 ± 2.2 0.9 ± 0.06
Pumpkin (boiled) 16.0 ± 2.2 0.9 ± 0.2
Tomatoes 30.0 ± 2.1 2.0 ± 0.1
Zucchini 6.3 ± 1.2 1.3 ± 0.3
Table 7. Chromium and manganese concentrations in some vegetables in ng/kg and mg/kg respectively (mean ± SD)
Vegetable mg Ca/100 g
Asparagus (fresh) 13.9
Asparagus (canned) 14.7
Leek 16.2
Mushrooms (fresh) - grey oyster 1.0
Peak (fresh) – garden 62.5
Radish (pickled) - Chinese 94.9
Rhubarb (petioles) - ;pie ;plant 268.9
Seaweed (agar) 510.2
Spinach - Ceylon 116.2
Spinach -Bayam pasi 319.4
Tomato – tree 11.2
Yam bean 12.4
Table 8. Results of AAS Ca analyses, selected examples in vegetable, edible portion, from part of a table by Siong.
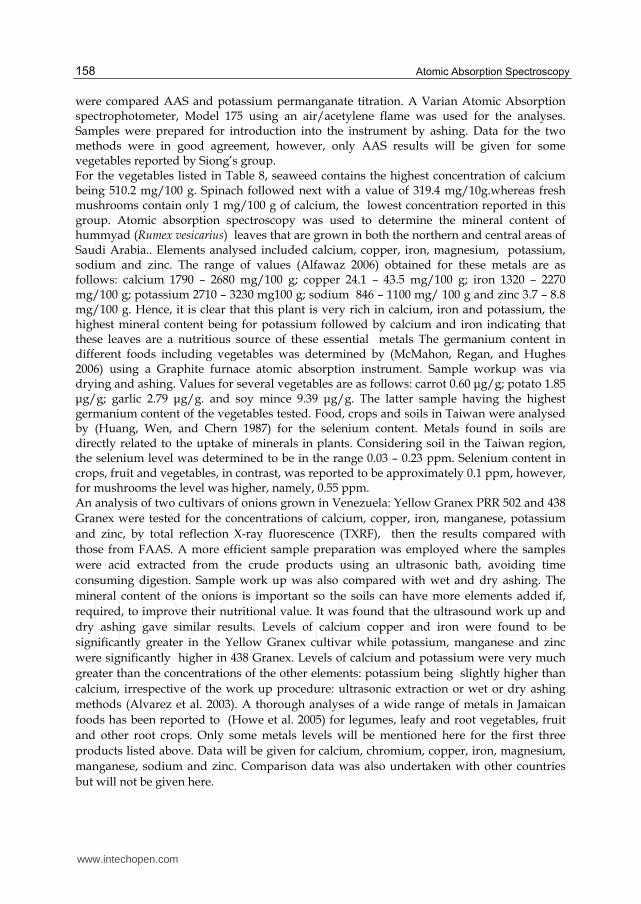
Calcium levels in many foods have been reported by (Siong, Khor Swan, and Siti Mizura 1989): some results will now be given for a selection of the vegetables tested. Two methods
www.intechopen.com
Atomic Absorption Spectroscopy
158
were compared AAS and potassium permanganate titration. A Varian Atomic Absorption spectrophotometer, Model 175 using an air/acetylene flame was used for the analyses. Samples were prepared for introduction into the instrument by ashing. Data for the two methods were in good agreement, however, only AAS results will be given for some vegetables reported by Siong’s group. For the vegetables listed in Table 8, seaweed contains the highest concentration of calcium being 510.2 mg/100 g. Spinach followed next with a value of 319.4 mg/10g.whereas fresh mushrooms contain only 1 mg/100 g of calcium, the lowest concentration reported in this group. Atomic absorption spectroscopy was used to determine the mineral content of hummyad (Rumex vesicarius) leaves that are grown in both the northern and central areas of Saudi Arabia.. Elements analysed included calcium, copper, iron, magnesium, potassium, sodium and zinc. The range of values (Alfawaz 2006) obtained for these metals are as follows: calcium 1790 – 2680 mg/100 g; copper 24.1 – 43.5 mg/100 g; iron 1320 – 2270 mg/100 g; potassium 2710 – 3230 mg100 g; sodium 846 – 1100 mg/ 100 g and zinc 3.7 – 8.8 mg/100 g. Hence, it is clear that this plant is very rich in calcium, iron and potassium, the highest mineral content being for potassium followed by calcium and iron indicating that these leaves are a nutritious source of these essential metals The germanium content in different foods including vegetables was determined by (McMahon, Regan, and Hughes 2006) using a Graphite furnace atomic absorption instrument. Sample workup was via drying and ashing. Values for several vegetables are as follows: carrot 0.60 μg/g; potato 1.85 μg/g; garlic 2.79 μg/g. and soy mince 9.39 μg/g. The latter sample having the highest germanium content of the vegetables tested. Food, crops and soils in Taiwan were analysed by (Huang, Wen, and Chern 1987) for the selenium content. Metals found in soils are directly related to the uptake of minerals in plants. Considering soil in the Taiwan region, the selenium level was determined to be in the range 0.03 – 0.23 ppm. Selenium content in crops, fruit and vegetables, in contrast, was reported to be approximately 0.1 ppm, however, for mushrooms the level was higher, namely, 0.55 ppm. An analysis of two cultivars of onions grown in Venezuela: Yellow Granex PRR 502 and 438
Granex were tested for the concentrations of calcium, copper, iron, manganese, potassium
and zinc, by total reflection X-ray fluorescence (TXRF), then the results compared with
those from FAAS. A more efficient sample preparation was employed where the samples
were acid extracted from the crude products using an ultrasonic bath, avoiding time
consuming digestion. Sample work up was also compared with wet and dry ashing. The
mineral content of the onions is important so the soils can have more elements added if,
required, to improve their nutritional value. It was found that the ultrasound work up and
dry ashing gave similar results. Levels of calcium copper and iron were found to be
significantly greater in the Yellow Granex cultivar while potassium, manganese and zinc
were significantly higher in 438 Granex. Levels of calcium and potassium were very much
greater than the concentrations of the other elements: potassium being slightly higher than
calcium, irrespective of the work up procedure: ultrasonic extraction or wet or dry ashing
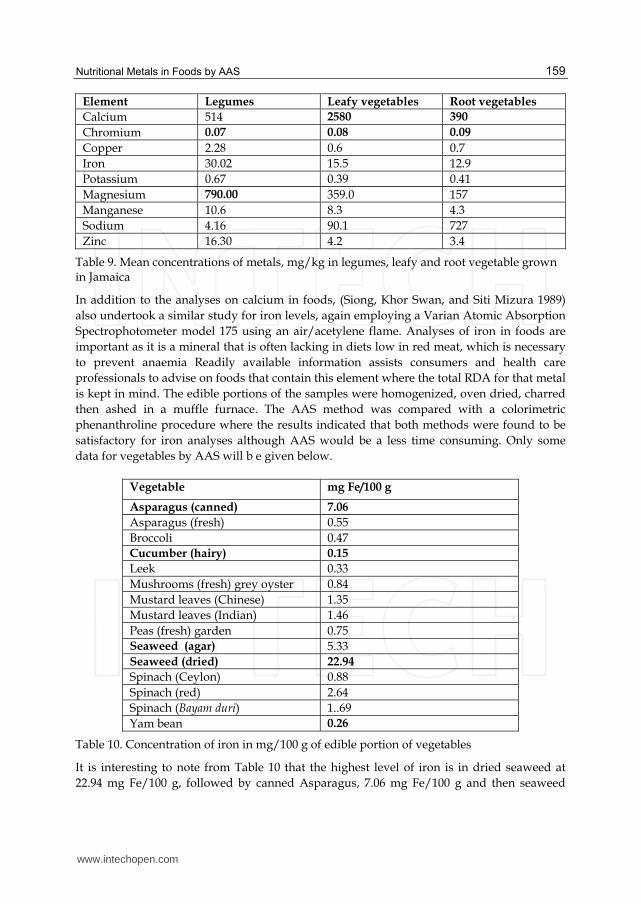
methods (Alvarez et al. 2003). A thorough analyses of a wide range of metals in Jamaican
foods has been reported to (Howe et al. 2005) for legumes, leafy and root vegetables, fruit
and other root crops. Only some metals levels will be mentioned here for the first three
products listed above. Data will be given for calcium, chromium, copper, iron, magnesium,
manganese, sodium and zinc. Comparison data was also undertaken with other countries
but will not be given here.
www.intechopen.com
Nutritional Metals in Foods by AAS
159
Element Legumes Leafy vegetables Root vegetables
Calcium 514 2580 390
Chromium 0.07 0.08 0.09
Copper 2.28 0.6 0.7
Iron 30.02 15.5 12.9
Potassium 0.67 0.39 0.41
Magnesium 790.00 359.0 157
Manganese 10.6 8.3 4.3
Sodium 4.16 90.1 727
Zinc 16.30 4.2 3.4
Table 9. Mean concentrations of metals, mg/kg in legumes, leafy and root vegetable grown in Jamaica
In addition to the analyses on calcium in foods, (Siong, Khor Swan, and Siti Mizura 1989)
also undertook a similar study for iron levels, again employing a Varian Atomic Absorption
Spectrophotometer model 175 using an air/acetylene flame. Analyses of iron in foods are
important as it is a mineral that is often lacking in diets low in red meat, which is necessary
to prevent anaemia Readily available information assists consumers and health care
professionals to advise on foods that contain this element where the total RDA for that metal
is kept in mind. The edible portions of the samples were homogenized, oven dried, charred
then ashed in a muffle furnace. The AAS method was compared with a colorimetric
phenanthroline procedure where the results indicated that both methods were found to be
satisfactory for iron analyses although AAS would be a less time consuming. Only some
data for vegetables by AAS will b e given below.
Vegetable mg Fe/100 g
Asparagus (canned) 7.06
Asparagus (fresh) 0.55
Broccoli 0.47
Cucumber (hairy) 0.15
Leek 0.33
Mushrooms (fresh) grey oyster 0.84
Mustard leaves (Chinese) 1.35
Mustard leaves (Indian) 1.46
Peas (fresh) garden 0.75
Seaweed (agar) 5.33
Seaweed (dried) 22.94
Spinach (Ceylon) 0.88
Spinach (red) 2.64
Spinach (Bayam duri) 1..69
Yam bean 0.26
Table 10. Concentration of iron in mg/100 g of edible portion of vegetables
It is interesting to note from Table 10 that the highest level of iron is in dried seaweed at
22.94 mg Fe/100 g, followed by canned Asparagus, 7.06 mg Fe/100 g and then seaweed
www.intechopen.com
Atomic Absorption Spectroscopy
160
(agar), 5.33 mg Fe/100 g. In contrast the lowest iron content was found in hairy cucumber
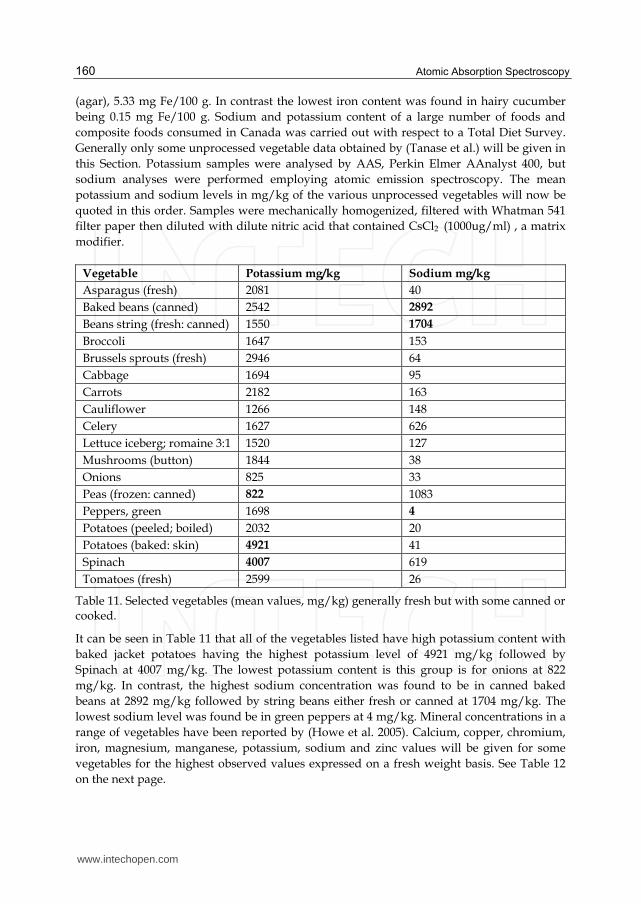
being 0.15 mg Fe/100 g. Sodium and potassium content of a large number of foods and
composite foods consumed in Canada was carried out with respect to a Total Diet Survey.
Generally only some unprocessed vegetable data obtained by (Tanase et al.) will be given in
this Section. Potassium samples were analysed by AAS, Perkin Elmer AAnalyst 400, but
sodium analyses were performed employing atomic emission spectroscopy. The mean
potassium and sodium levels in mg/kg of the various unprocessed vegetables will now be
quoted in this order. Samples were mechanically homogenized, filtered with Whatman 541
filter paper then diluted with dilute nitric acid that contained CsCl2 (1000ug/ml) , a matrix
modifier.
Vegetable Potassium mg/kg Sodium mg/kg
Asparagus (fresh) 2081 40
Baked beans (canned) 2542 2892
Beans string (fresh: canned) 1550 1704
Broccoli 1647 153
Brussels sprouts (fresh) 2946 64
Cabbage 1694 95
Carrots 2182 163
Cauliflower 1266 148
Celery 1627 626
Lettuce iceberg; romaine 3:1 1520 127
Mushrooms (button) 1844 38
Onions 825 33
Peas (frozen: canned) 822 1083
Peppers, green 1698 4
Potatoes (peeled; boiled) 2032 20
Potatoes (baked: skin) 4921 41
Spinach 4007 619
Tomatoes (fresh) 2599 26
Table 11. Selected vegetables (mean values, mg/kg) generally fresh but with some canned or cooked.
It can be seen in Table 11 that all of the vegetables listed have high potassium content with
baked jacket potatoes having the highest potassium level of 4921 mg/kg followed by
Spinach at 4007 mg/kg. The lowest potassium content is this group is for onions at 822
mg/kg. In contrast, the highest sodium concentration was found to be in canned baked
beans at 2892 mg/kg followed by string beans either fresh or canned at 1704 mg/kg. The
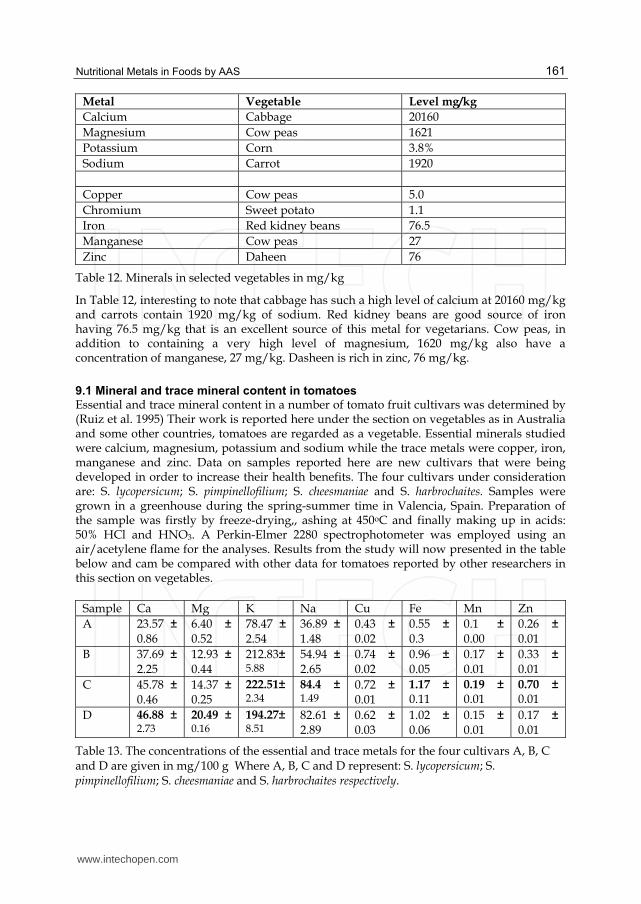
lowest sodium level was found be in green peppers at 4 mg/kg. Mineral concentrations in a
range of vegetables have been reported by (Howe et al. 2005). Calcium, copper, chromium,
iron, magnesium, manganese, potassium, sodium and zinc values will be given for some
vegetables for the highest observed values expressed on a fresh weight basis. See Table 12
on the next page.
www.intechopen.com
Nutritional Metals in Foods by AAS
161
Metal Vegetable Level mg/kg
Calcium Cabbage 20160
Magnesium Cow peas 1621
Potassium Corn 3.8%
Sodium Carrot 1920
Copper Cow peas 5.0
Chromium Sweet potato 1.1
Iron Red kidney beans 76.5
Manganese Cow peas 27
Zinc Daheen 76
Table 12. Minerals in selected vegetables in mg/kg
In Table 12, interesting to note that cabbage has such a high level of calcium at 20160 mg/kg and carrots contain 1920 mg/kg of sodium. Red kidney beans are good source of iron having 76.5 mg/kg that is an excellent source of this metal for vegetarians. Cow peas, in addition to containing a very high level of magnesium, 1620 mg/kg also have a concentration of manganese, 27 mg/kg. Dasheen is rich in zinc, 76 mg/kg.
9.1 Mineral and trace mineral content in tomatoes Essential and trace mineral content in a number of tomato fruit cultivars was determined by (Ruiz et al. 1995) Their work is reported here under the section on vegetables as in Australia and some other countries, tomatoes are regarded as a vegetable. Essential minerals studied were calcium, magnesium, potassium and sodium while the trace metals were copper, iron, manganese and zinc. Data on samples reported here are new cultivars that were being developed in order to increase their health benefits. The four cultivars under consideration are: S. lycopersicum; S. pimpinellofilium; S. cheesmaniae and S. harbrochaites. Samples were grown in a greenhouse during the spring-summer time in Valencia, Spain. Preparation of the sample was firstly by freeze-drying,, ashing at 450oC and finally making up in acids: 50% HCl and HNO3. A Perkin-Elmer 2280 spectrophotometer was employed using an air/acetylene flame for the analyses. Results from the study will now presented in the table below and cam be compared with other data for tomatoes reported by other researchers in this section on vegetables.
Sample Ca Mg K Na Cu Fe Mn Zn
A 23.57 ± 0.86
6.40 ± 0.52
78.47 ±
2.54 36.89 ±
1.48 0.43 ± 0.02
0.55 ± 0.3
0.1 ± 0.00
0.26 ± 0.01
B 37.69 ± 2.25
12.93 ± 0.44
212.83± 5.88
54.94 ±
2.65 0.74 ± 0.02
0.96 ± 0.05
0.17 ± 0.01
0.33 ± 0.01
C 45.78 ± 0.46
14.37 ± 0.25
222.51±2.34
84.4 ±1.49
0.72 ± 0.01
1.17 ±0.11
0.19 ± 0.01
0.70 ± 0.01
D 46.88 ± 2.73
20.49 ± 0.16
194.27± 8.51
82.61 ± 2.89
0.62 ± 0.03
1.02 ± 0.06
0.15 ± 0.01
0.17 ± 0.01
Table 13. The concentrations of the essential and trace metals for the four cultivars A, B, C and D are given in mg/100 g Where A, B, C and D represent: S. lycopersicum; S. pimpinellofilium; S. cheesmaniae and S. harbrochaites respectively.
www.intechopen.com
Atomic Absorption Spectroscopy
162
In Table13, it can be seen that cultivar C has the highest K level at 222.51 mg/100g; as well as highest Na, Fe, Mn and Zn levels: 84.4 mg/ 100g; 1.17 mg/100g , 0.19 mg.100g and 0.70 mg.100g, respectively. Cultivars B and D following closely behind C with Ca levels of 212.83 mg/100g and D 194.27 mg/100 g.. Cultivar D has the highest Ca and Mg concentrations at 46.88 mg/100g and 20.49 mg/100 g respectively.
10. Mineral content in some herbs and spices
Much of the literature on herbs and spices is related to contamination of heavy metals and analyses are undertaken to ensure that they are safe to consume and have not been grown in polluted areas, such as near motorways where there is the pollution from lead in old style cars. Possibly, they have been grown in soil near mining sites where there is pollution from heavy metals. Crops can be grown near polluted waterways where they are down stream from heavy industry factories so heavy metals seep into the soil and/or contaminate the ground water. In this section metals that are of health benefits will be emphasised with only a brief mention of those that are considered to be pollutants. Metals such as iron and calcium and others import in maintaining good health. Studies have also been reported on the metal content of Chinese herbs that have specific health benefits for certain disease states.
10.1 Minerals related to kidney function
Selected metals in Chinese medicinal herbs that are used in order to improve kidney function has been reported by (Kolasani, Xu, and Millikan 2011) Dried, unprocessed herbal samples were purchased from local importers of Chinese herbs in Melbourne. These are herbs that the Chinese medical practitioners would prescribe to their patients. Samples came from different parts of the plant: such as leaves, whole plant, stem, twig, bark or roots. Seven metals were tested by atomic absorption spectroscopy that included: calcium, iron, magnesium, manganese, sodium, potassium and zinc. A Varian spectra-400 Atomic Absorption Spectrophotometer (Varian Inc. Mulgrave, Australia) an air/acetylene flame was employed for the metal analyses. Samples were ground then digested in concentrated nitric. The range of metals found in these samples were as follows: Ca (130 – 560940 μg/g); Fe (20 – 8020 μg/g); Mg (90-5520 μg/g); Mn ( 20-140 μg/g); K (270-90260 μg/g); Na (30-4500 μg/g) and Zn (10–1010 μg/g); Na (30-4500 μg/g). Results indicated that calcium and potassium levels were the highest elements detected in all sample compared to the other metals. It was also found that the calcium concentration was greatest in fossils, then in plants whereas iron, potassium, manganese and zinc levels were highest in plants. Roots contained the highest magnesium concentration while flowers contained the highest sodium values.
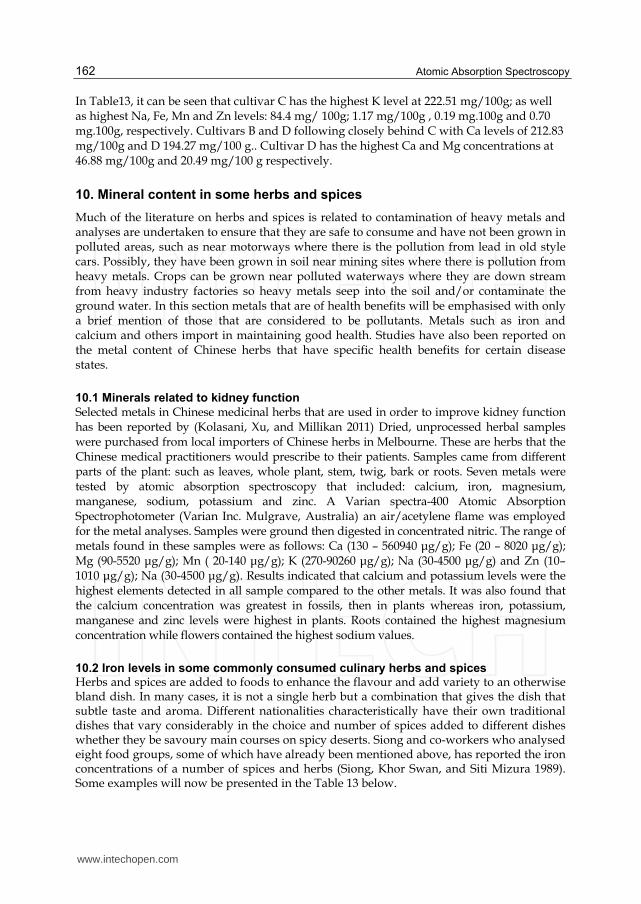
10.2 Iron levels in some commonly consumed culinary herbs and spices Herbs and spices are added to foods to enhance the flavour and add variety to an otherwise bland dish. In many cases, it is not a single herb but a combination that gives the dish that subtle taste and aroma. Different nationalities characteristically have their own traditional dishes that vary considerably in the choice and number of spices added to different dishes whether they be savoury main courses on spicy deserts. Siong and co-workers who analysed eight food groups, some of which have already been mentioned above, has reported the iron concentrations of a number of spices and herbs (Siong, Khor Swan, and Siti Mizura 1989). Some examples will now be presented in the Table 13 below.
www.intechopen.com
Nutritional Metals in Foods by AAS
163
Spice or herb mg Fe/100 g
Chilli, small 0.68
Nutmeg, fresh 0.22
Persimmon, dried 0.99
Chives, Chinese 0.62
Coriander, leaves 3.86
Garlic, bulbs 0.48
Garlic, plants 0.31
Parsley 9.90
Table 13. Iron concentration in mg Fe/100 g of a selection of spices and herbs
It can be seen in Table 13 that parsley is an excellent source of iron, 9.90 mg Fe/100 g, that is particularly important for those who eat little red meat or are vegetarians. Iron deficiency is a common problem particularly for women. Coriander leave being the next highest level of iron at 3.86 mg Fe/100 g. It is interesting to note that the iron in garlic bulbs is 0.48 mg Fe/100 g that is greater than in the plants at 0.31 mg Fe/100 g. Of this group nutmeg has the lowest iron level at 0.22 mg Fe/100 g.
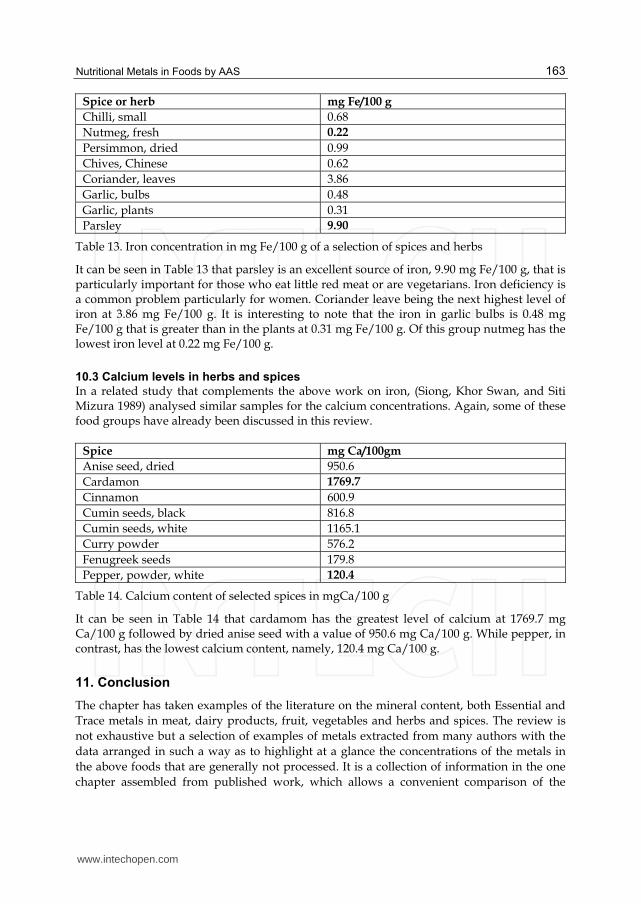
10.3 Calcium levels in herbs and spices
In a related study that complements the above work on iron, (Siong, Khor Swan, and Siti Mizura 1989) analysed similar samples for the calcium concentrations. Again, some of these food groups have already been discussed in this review.
Spice mg Ca/100gm
Anise seed, dried 950.6
Cardamon 1769.7
Cinnamon 600.9
Cumin seeds, black 816.8
Cumin seeds, white 1165.1
Curry powder 576.2
Fenugreek seeds 179.8
Pepper, powder, white 120.4
Table 14. Calcium content of selected spices in mgCa/100 g
It can be seen in Table 14 that cardamom has the greatest level of calcium at 1769.7 mg Ca/100 g followed by dried anise seed with a value of 950.6 mg Ca/100 g. While pepper, in contrast, has the lowest calcium content, namely, 120.4 mg Ca/100 g.
11. Conclusion
The chapter has taken examples of the literature on the mineral content, both Essential and
Trace metals in meat, dairy products, fruit, vegetables and herbs and spices. The review is
not exhaustive but a selection of examples of metals extracted from many authors with the
data arranged in such a way as to highlight at a glance the concentrations of the metals in
the above foods that are generally not processed. It is a collection of information in the one
chapter assembled from published work, which allows a convenient comparison of the
www.intechopen.com
Atomic Absorption Spectroscopy
164
concentration of certain metals in the products discussed. Such information is of value to
health care professionals, researchers and food manufacturers in preparing nutritious
products. Levels of metals in some product may also be unexpected and hence informative
and may lead on to further analyses and research.
12. References
Alfawaz, M. A. 2006. Chemical composition of hummayd (Rumex vesicarius) grown in Saudi Arabia. Journal of Food Composition and Analysis: 19 (6-7, Biodiversity and nutrition: a common path) 552-555 19 (6-7, Biodiversity and nutrition: a common path):552-555.
Alvarez, J., L. M. Marco, J. Arroyo, E. D. Greaves, and R. Rivas. 2003. Determination of calcium, potassium, manganese, iron, copper and zinc levels in representative samples of two onion cultivars using total reflection X-ray fluorescence and ultrasound extraction procedure. Spectrochimica Acta Part B-Atomic Spectroscopy 58 (12):2183-2189.
Brandao, G. C., G. D. Matos, and S. L. C. Ferreira. Slurry sampling and high-resolution continuum source flame atomic absorption spectrometry using secondary lines for the determination of Ca and Mg in dairy products. Microchemical Journal: 98 (2) 231-233 98 (2):231-233.
Cabrera, C., M. L. Lorenzo, and M. C. Lopez. 1995. Electrothermal atomic absorption spectrometric determination of cadmium, copper, iron, lead, and selenium in fruit slurry: analytical application to nutritional and toxicological quality control. Journal of AOAC International: 78 (4) 1061-1067 78 (4):1061-1067.
Carvalho, M. L., S. Santiago, and M. L. Nunes. 2005. Assessment of the essential element and heavy metal content of edible fish muscle. Analytical and Bioanalytical Chemistry: 382 (2, The European Conference on Analytical Chemistry XIII):426-432.
Dalton, E. F., and A. J. Malanoski. 1969. Atomic absorption analysis of copper and lead in meat and meat products. Journal of the Association of Official Analytical Chemists: 52 (5):1035-38.
Dogan, S., and W. Haerdi. 1980. Determination of total tin in environmental biological and water samples by atomic absorption spectrometry with graphite furnace. International Journal of Environmental Analytical Chemistry: 8 (4) 249-257 8 (4):249-257.
Dundas, M.J, and S Pawluk. 1977. Heavy metals in cultivated soils and in cereal crops in Alberta. Canadian Journal of Soil Science 7:329-339.
Foodstuffs. Determination of trace elements. Determination of tin by flame and graphite furnace atomic absorption spectrometry (FAAS and GFAAS) after pressure digestion. 2009. European Standard: EN 15764, 16pp.:16pp.
Formo, M. W., G. R. Honold, and D. B. MacLean. 1974. Determination of soy products in meat-soy blends. Journal of the Association of Official Analytical Chemists: 57 (4) 841-846 57 (4):841-846.
Germs, A. C., and H. Stennenberg. 1978. Estimating calcium in mechanically deboned poultry meat by oxidimetry and atomic absorption spectrophotometry. Food Chemistry: 3 (3):213-219.
Hannaford, P. 2002. Alan Walsh 1916-1998. Historical Records of Australia Science 13 (2):179-206.
Hoenig, M., and P. van Hoeyweghen. 1986. Determination of selenium and arsenic in animal tissues with platform furnace atomic absorption spectrometry and deuterium
www.intechopen.com
Nutritional Metals in Foods by AAS
165
background correction. International Journal of Environmental Analytical Chemistry: 24 (3):193-202.
Howe, A., L. Fung, G. Lalor, R. Rattray, and M. Vutchkov. 2005. Elemental composition of Jamaican foods 1: A survey of five food crop categories. Environmental Geochemistry and Health 27 (1):19-30.
Huang, W. I., H. M. Wen, and J. C. Chern. 1987. [Selenium content of soils, crops and foods in Taiwan area.]. Journal of the Chinese Agricultural Chemical Society: 25 (2):150-158.
Hussein, L., and J. Bruggeman. 1999. Selenium analysis of selected Egyptian foods and estimated daily intakes among a population group. Food Chemistry 65 (4):527-532.
Jorhem, L., B. Sundstroem, C. Astrand, and G. Haegglund. 1989. The levels of zinc, copper, manganese, selenium, chromium, nickel, cobalt, and aluminium in the meat, liver and kidney of Swedish pigs and cattle. Zeitschrift fuer Lebensmittel-Untersuchung und -Forschung: 188 (1):39-44.
Kolasani, A, H Xu, and Millikan. 2011. Evaluation of mineral content of Chinese medicinal herb used to improve kidney funtion with chemometrics. Food Chemistry 127 (4):1467-1471.
Koops, J., and D. Westerbeek. 1993. Manganese in Dutch milk powder. Determination by Zeeman-corrected stabilized-temperature platform-furnace atomic-absorption spectroscopy. Netherlands Milk and Dairy Journal: 47 (1) 1-13 47 (1):1-13.
Larsen, E. H., and L. Rasmussen. 1991. Chromium, lead and cadmium in Danish milk products and cheese determined by Zeeman graphite furnace atomic absorption spectrometry after direct injection or pressurized ashing. Zeitschrift fuer Lebensmittel-Untersuchung und -Forschung: 192 (2) 136-141 192 (2):136-141.
Lopez, P., M. Castaneda, G. Lopez, E. Munoz, and J. L. Rosado. 1999. Iron, zinc and copper content of foods commonly consumed in Mexico. Archivos Latinoamericanos De Nutricion 49 (3):287-294.
Lovachev, L. N., I. F. Rodionova, E. V. Andreeva, and L. N. Fedorova. 1972. [Determination of copper and other elements in butter.]. Voprosy Pitaniya: 35 (1) 68-71 35 (1):68-71.
Lustre, A. O., and C. H. Lacebal. 1976. Zinc and magnesium in Philippine foods. I. Development of a method. Philippine Journal of Nutrition: 29 (1/2):25-32.
Maurer, J. 1977. [Extraction method for the simultaneous determination of sodium, potassium, calcium, magnesium, iron, copper, zinc and manganese in organic material using atomic absorption spectrophotometry.]. Zeitschrift fuer Lebensmittel-Untersuchung und -Forschung 165 (1):1-4.
McMahon, M., F. Regan, and H. Hughes. 2006. The determination of total germanium in real food samples including Chinese herbal remedies using graphite furnace atomic absorption spectroscopy. Food Chemistry: 97 (3) 411-417 97 (3):411-417.
Miquel, E., A. Alegria, R. Barbera, and R. Farre. 2005. Speciation analysis of calcium, iron, and zinc in casein phosphopeptide fractions from toddler milk-based formula by anion exchange and reversed-phase high-performance liquid chromatography-mass spectrometry/flame atomic-absorption spectroscopy. Analytical and Bioanalytical Chemistry: 381 (5) 1082-1088 381 (5):1082-1088.
Mojsiewicz-Pienkowska, K., and J. Lukasiak. 2003. Analytical fractionation of silicon compounds in foodstuffs. Food Control: 14 (3) 153-162 14 (3):153-162.
Nakamura, R. 1973. Estimation of water-extractable Ca in chicken breast muscle by atomic absorption. Analytical Biochemistry: 53 (2):531-537.
Regina de Amorim, F., M. Batista Franco, C. C. Nascentes, and J. Bento Borba da Silva. Direct determination of molybdenum in milk and infant food samples using slurry
www.intechopen.com
Atomic Absorption Spectroscopy
166
sampling and graphite furnace atomic absorption spectrometry. Food Analytical Methods: 4 (1) 41-48 4 (1):41-48.
Rigin, V. I. 1979. [Atomic absorption spectrometric determination of Sn in water and biological materials using electrolytic separation and atomization in gas phase.]. Zhurnal Analiticheskoi Khimii: 34 (8) 1569-1573 34 (8):1569-1573.
Ruiz, C., A. Alegria, R. Barbera, R. Farre, and M. J. Lagarda. 1995. Direct determination of calcium, magnesium, sodium, potassium and iron in infant formulas by atomic spectroscopy. Comparison with dry and wet digestions methods. Nahrung: 39 (5/6):497-504.
Schaefer, M. J., M. B. Kohrs, M. Howser, and S. Snider. 1979. The copper and zinc content of meat and meat analogs.
Siong, T. E., Choo Khor Swan, and Shahid Siti Mizura. 1989. Determination of calcium in foods by the atomic absorption spectrophotometric and titrimetric methods. Pertanika: 12 (3):303-311. 1989. Determination of iron in foods by the atomic absorption spectrophotometric and colorimetric methods. Pertanika: 12 (3):313-322.
Tanase, C. M., P. Griffin, K. G. Koski, M. J. Cooper, and K. A. Cockell. Sodium and potassium in composite food samples from the Canadian Total Diet Study. Journal of Food Composition and Analysis 24 (2):237-243.
Tinggi, U., C. Reilly, and C. Patterson. 1997. Determination of manganese and chromium in foods by atomic absorption spectrometry after wet digestion. Food Chemistry: 60 (1) 123-128 60 (1):123-128.
Turker, A. R., and E. Erol. 2009. Optimization of selenium determination in chicken's meat and eggs by the hydride-generation atomic absorption spectrometry method. International Journal of Food Sciences and Nutrition: 60 (1) 40-50 60 (1):40-50.
Uluozlu, O. D., M. Tuzen, D. Mendil, and M. Soylak. 2007. Trace metal content in nine species of fish from the Black and Aegean Seas, Turkey. Food Chemistry: 104 (2):835-840.
Vijan, P. N., and C. Y. Chan. 1976. Determination of tin by gas phase atomization and atomic absorption spectrometry. Analytical Chemistry: 48 (12) 1788-1792 48 (12):1788-1792.
Wehrer, C., J. Thiersault, and P. Laugel. 1976. [Determination of tin in canned fruits and vegetables by atomic absorption spectrometry.]. Industries Alimentaires et Agricoles: 93 (12) 1439-1446 93 (12):1439-1446.
Whitney, E.N, and S.R Rofles, eds. 2002. Understanding Nutrition. 9 ed: Thomas Learning, Inc.
Ybanez, N., R. Montoro, and A. Bueso. 1983. [Determination of cadmium, lead and copper in cooked meat products by flame atomic absorption spectroscopy.]. Revista de Agroquimica y Tecnologia de Alimentos: 23 (4):510-520.
Yongming, Liu, Gong Benling, Li Zhuanhe, Xu Yuli, and Lin Tiezheng. 1996. Direct determination of selenium in a wild fruit juice by electrothermal atomic absorption spectrometry. Talanta: 43 (7) 985-989 43 (7):985-989.
Zachariadis, G. A., J. A. Stratis, L. Kaniou, and G. Kalligas. 1995. Critical comparison of wet and dry digestion procedures for trace metal analysis of meat and fish tissues. Mikrochimica Acta: 119 (3/4):191-198.
Zuliani, T., B. L. Kralj, V. Stibilj, and R. Milacic. 2005. Minerals and trace elements in food commonly consumed in Slovenia. Italian Journal of Food Science 17 (2):155-166.
www.intechopen.com
Atomic Absorption SpectroscopyEdited by Dr. Muhammad Akhyar Farrukh
ISBN 978-953-307-817-5Hard cover, 258 pagesPublisher InTechPublished online 20, January, 2012Published in print edition January, 2012
InTech EuropeUniversity Campus STeP Ri Slavka Krautzeka 83/A 51000 Rijeka, Croatia Phone: +385 (51) 770 447 Fax: +385 (51) 686 166www.intechopen.com
InTech ChinaUnit 405, Office Block, Hotel Equatorial Shanghai No.65, Yan An Road (West), Shanghai, 200040, China
Phone: +86-21-62489820 Fax: +86-21-62489821
Atomic Absorption Spectroscopy is an analytical technique used for the qualitative and quantitativedetermination of the elements present in different samples like food, nanomaterials, biomaterials, forensics,and industrial wastes. The main aim of this book is to cover all major topics which are required to equipscholars with the recent advancement in this field. The book is divided into 12 chapters with an emphasis onspecific topics. The first two chapters introduce the reader to the subject, it's history, basic principles,instrumentation and sample preparation. Chapter 3 deals with the elemental profiling, functions, biochemistryand potential toxicity of metals, along with comparative techniques. Chapter 4 discusses the importance ofsample preparation techniques with the focus on microextraction techniques. Keeping in view the importanceof nanomaterials and refractory materials, chapters 5 and 6 highlight the ways to characterize these materialsby using AAS. The interference effects between elements are explained in chapter 7. The characterizations ofmetals in food and biological samples have been given in chapters 8-11. Chapter 12 examines carbon captureand mineral storage with the analysis of metal contents.
How to referenceIn order to correctly reference this scholarly work, feel free to copy and paste the following:
Mary Millikan (2012). Nutritional Metals in Foods by AAS, Atomic Absorption Spectroscopy, Dr. MuhammadAkhyar Farrukh (Ed.), ISBN: 978-953-307-817-5, InTech, Available from:http://www.intechopen.com/books/atomic-absorption-spectroscopy/nutritional-metals-in-foods-by-aas