
Nutrition Therapy in citrus - University of Florida
52
NUTRITION THERAPY IN CITRUS Tripti Vashisth Assistant Professor (Horticultural Sciences)
Transcript of Nutrition Therapy in citrus - University of Florida

NUTRITION THERAPY IN CITRUS
Tripti Vashisth
Assistant Professor (Horticultural Sciences)
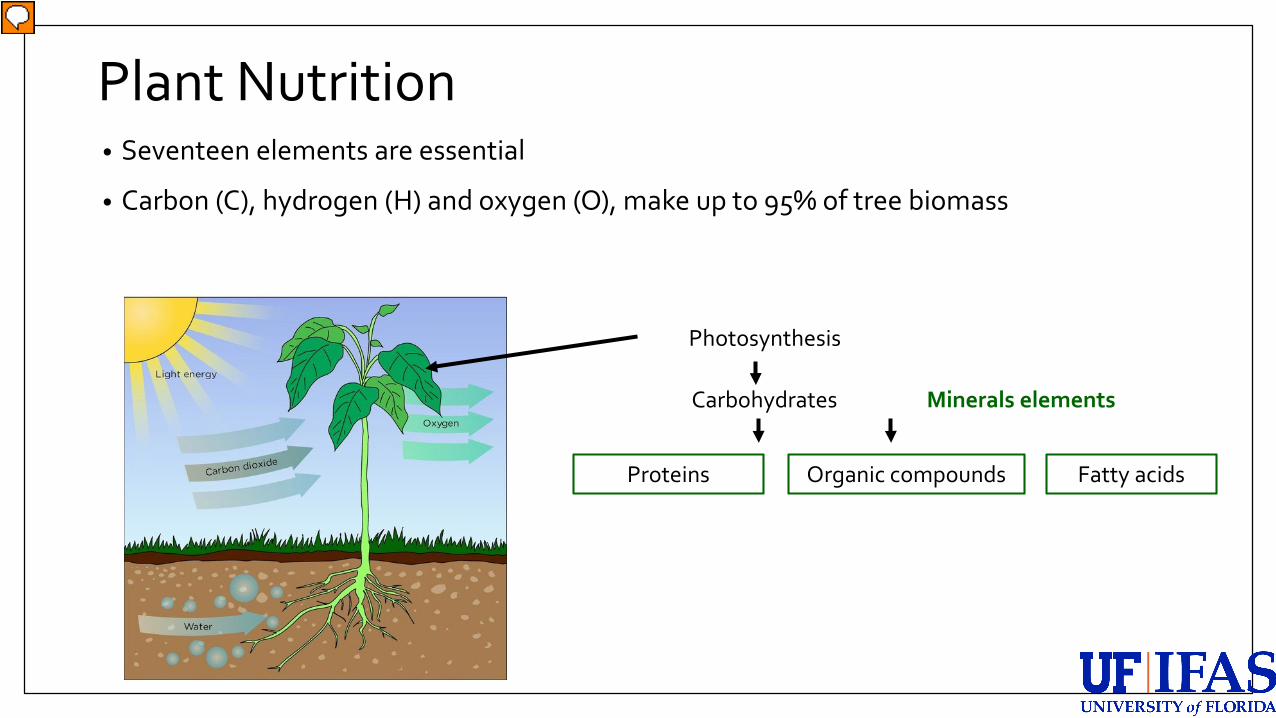
Plant Nutrition• Seventeen elements are essential
• Carbon (C), hydrogen (H) and oxygen (O), make up to 95% of tree biomass
Photosynthesis
Carbohydrates
Proteins Fatty acidsOrganic compounds
Minerals elements
Presenter
Presentation Notes
for the growth and functioning of plant
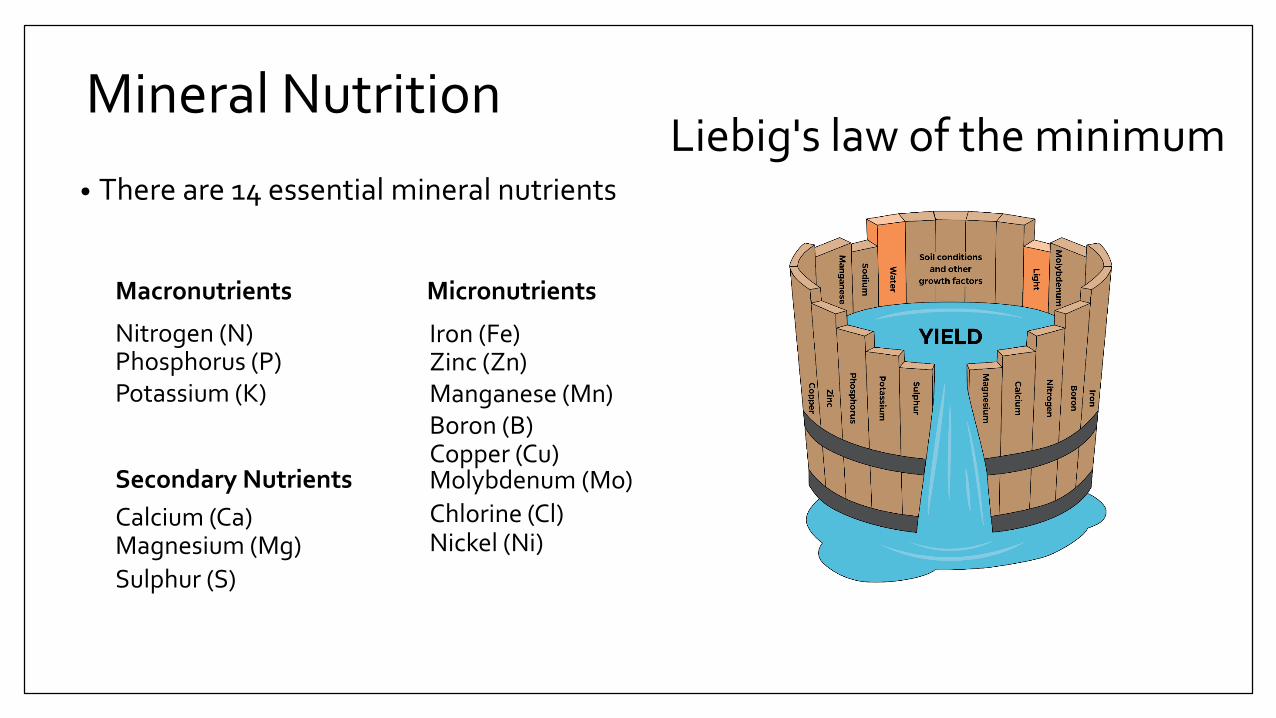
• There are 14 essential mineral nutrients
Macronutrients Micronutrients
Nitrogen (N)Phosphorus (P)Potassium (K)
Calcium (Ca)Magnesium (Mg)Sulphur (S)
Iron (Fe)Zinc (Zn)Manganese (Mn)Boron (B)Copper (Cu)Molybdenum (Mo)Chlorine (Cl)Nickel (Ni)
Liebig's law of the minimumMineral Nutrition
Secondary Nutrients
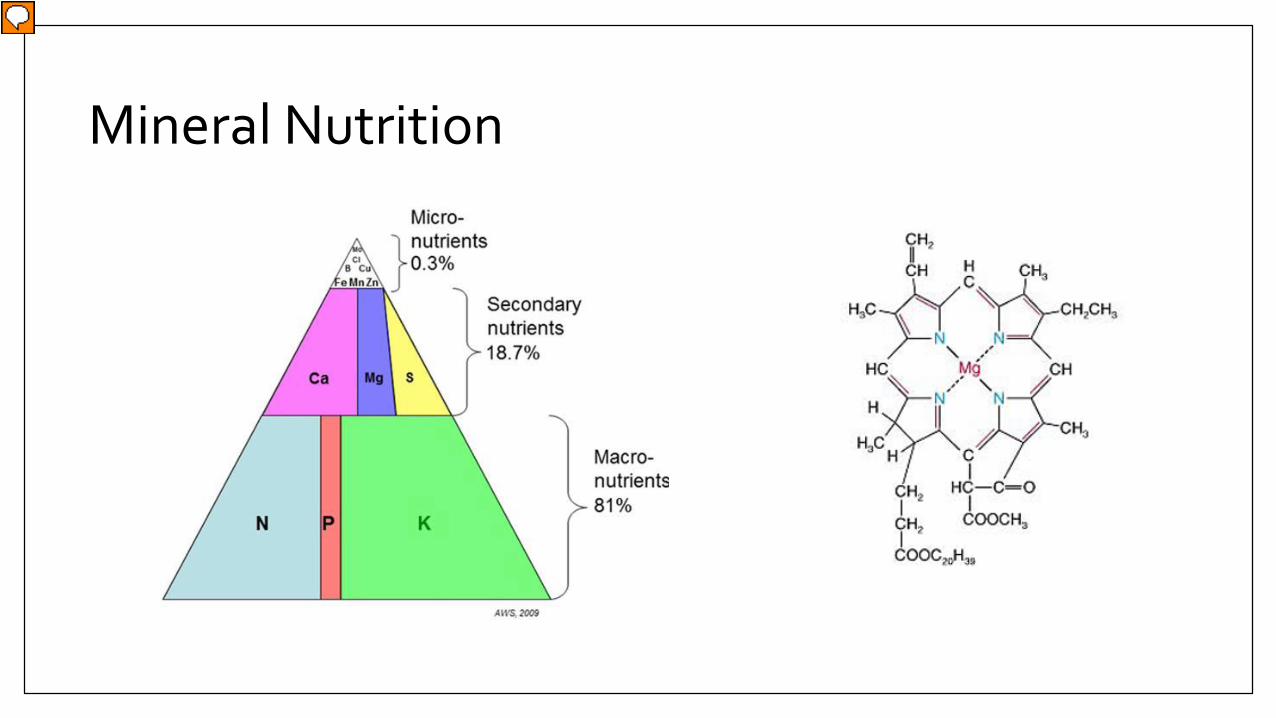
Mineral Nutrition
Presenter
Presentation Notes
Reduced root system requires continuous supply of nutrient

Good Nutrition Management is Critical
Apple Bitter PitPhysiological DisorderDirectly related to CalciumAffected by Nitrogen, Potassium, and Boron

Good Nutrition Management is Complex
Relationship between fruit yields and N rates during 1993–1998 of >20-year-old ‘Hamlin’ orange trees on ‘Cleopatra mandarin’ rootstock planted in a Tavares fine sand. Alva et al. (2006). Relationship between SSC/TA ratio and N rates and
sources (A) and leaf N concentration (B), 1997– 2000 (SSC = soluble solid concentration and TA = titratable acid). Adapted from He et al. (2003)
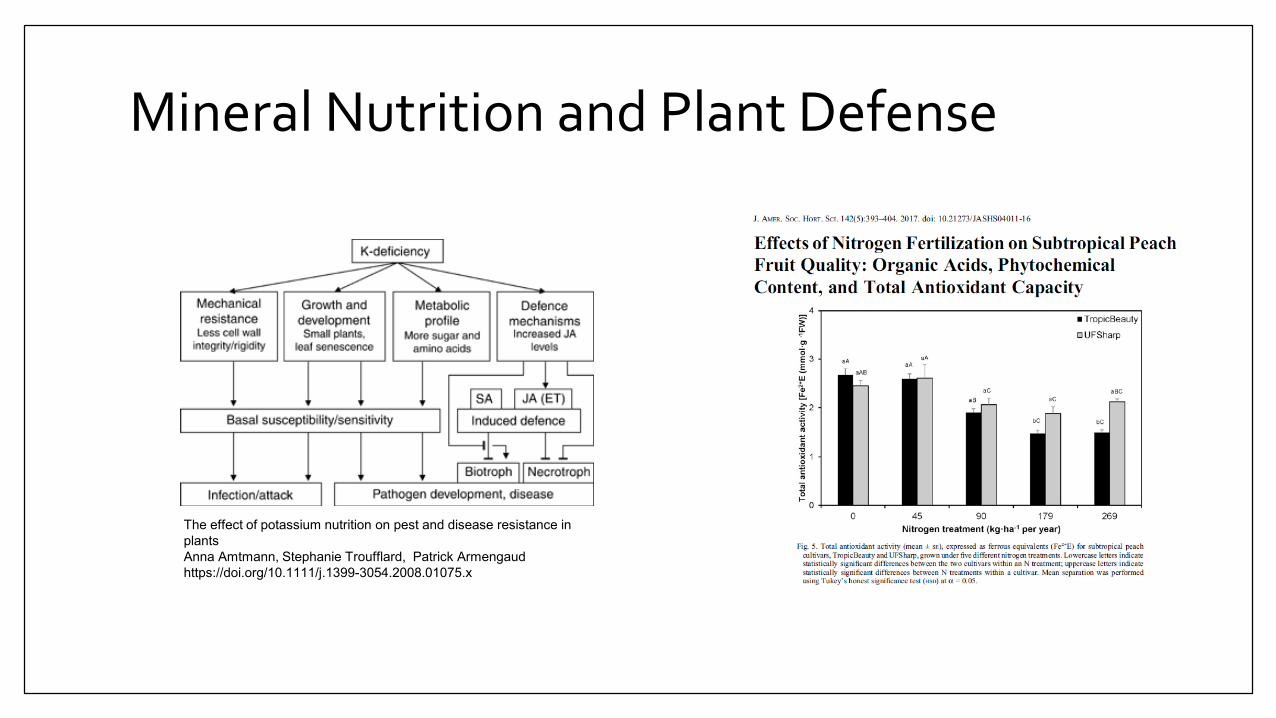
Mineral Nutrition and Plant Defense
The effect of potassium nutrition on pest and disease resistance in plantsAnna Amtmann, Stephanie Troufflard, Patrick Armengaudhttps://doi.org/10.1111/j.1399-3054.2008.01075.x


HLB and Nutrition• HLB-affected leaves show blotchy mottle/chlorosis, often
show nutrient deficiencies
• Confused with nutrient deficiency and vice versa
Boron Zinc Potassium
Pen Test

Transmits bacteria
Root loss Water
+minerals uptake reduces
Phloem pluggingAsian citrus psyllid
feeds on leaf
Carbohydrates
To roots
To fruits, flower
Tree growth arrests and declineCLas thrives in
phloem
Carbohydrates
To roots
To fruits, flower
X
X
Model for HLB
Fruit quality lowers and fruit drop

HLB and Nutrition• Growers started nutritional therapy to address nutrient
deficiency symptoms
• Foliar spraysProc. Fla. State Hort. Soc. 125:61–64. 2012.
Fruit Production in a Southwest Florida Citrus Grove Using the Boyd Nutrient/SAR Foliar Spray

HLB and Nutrition
• The results were not consistent resulting in confusion
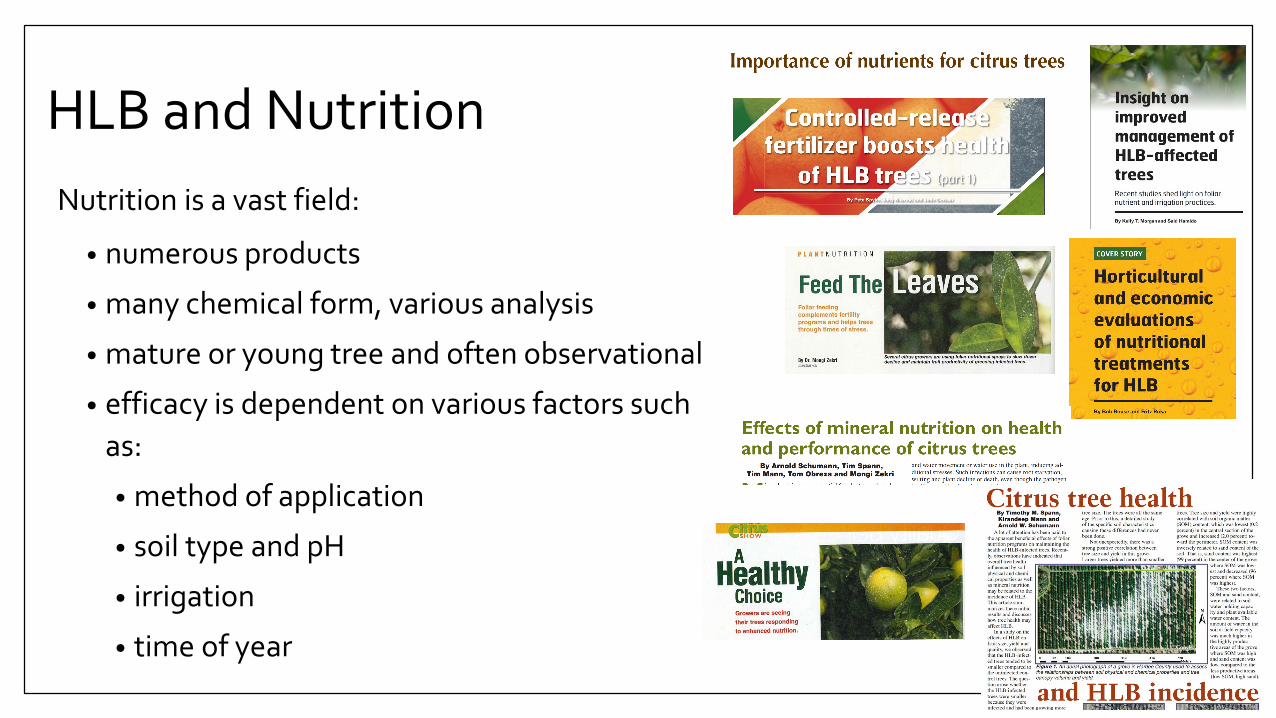
HLB and NutritionNutrition is a vast field:
• numerous products
• many chemical form, various analysis
• mature or young tree and often observational
• efficacy is dependent on various factors such as:
• method of application
• soil type and pH
• irrigation
• time of year

Citrus Grower Survey• June 2017
• Eight growers, spread throughout the state were surveyed-Growers who have claimed to be making profit
Every grower agreed that their grove management programs are more intensive
and better now then pre-HLB especially nutrition management.
Growers who had better nutrition management program pre-HLB and early on
adopted good psyllid control did not see as much decline as some other growers.
There is no fixed recipe for a management, programs are often site specific,
requires good observation and analyses and then responding to tree needs.

So what is happening?• Constant supply of nutrients is critical
• Focus on soil-applied nutrition
• HLB-affected plant have small root system, limiting nutrient uptake
• Reports suggest higher rate of nutrients is beneficial for HLB-affected trees
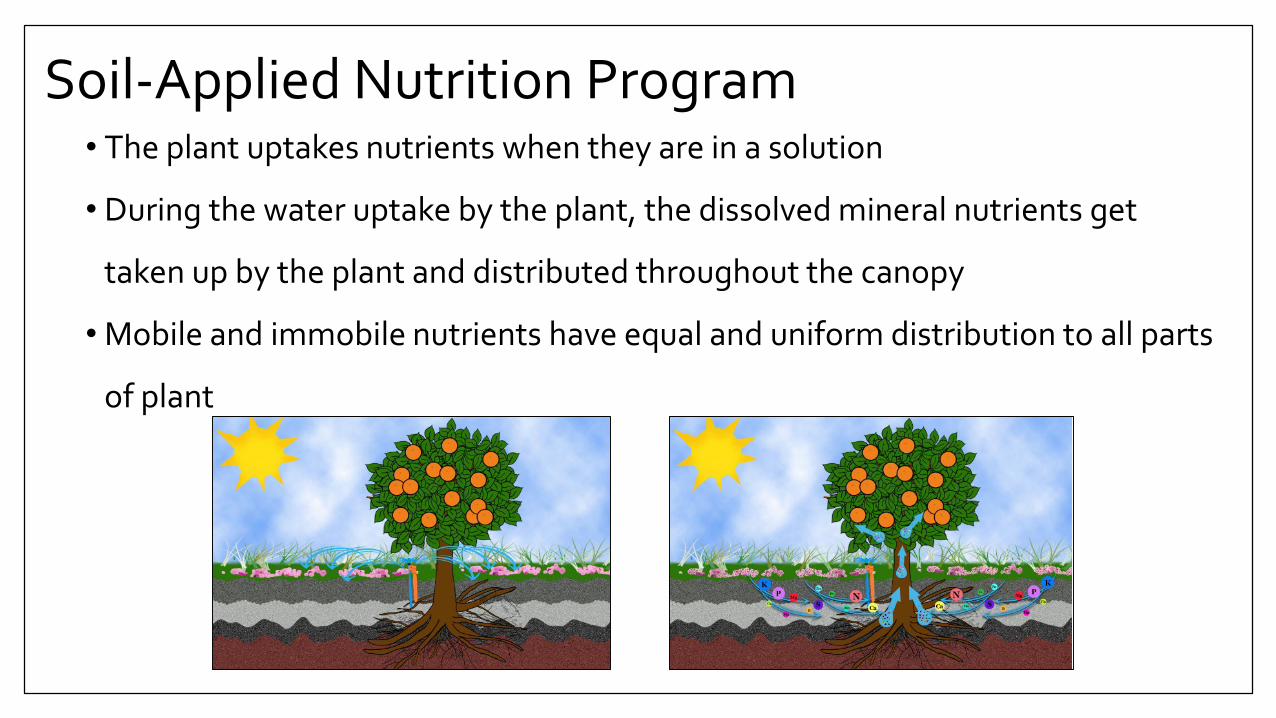
• The plant uptakes nutrients when they are in a solution
• During the water uptake by the plant, the dissolved mineral nutrients get
taken up by the plant and distributed throughout the canopy
• Mobile and immobile nutrients have equal and uniform distribution to all parts
of plant
Soil-Applied Nutrition Program

• Thick leaf cuticle limits the nutrient uptake
• Significant amount of foliar spray washes
away in soil:
• Pre HLB, trees had massive feeder root systems; therefore, could
easily take up washed up nutrients
• HLB-affected trees have few feeder roots therefore, may not be
effective in nutrient uptake
• With foliar sprays immobile nutrients can get locked in leaves
Foliar Nutrition Program

Current Research • Overdose-higher than recommended rate• Some concerns as the experimental design
was not robust• Nonetheless, there are increasing number of
evidence that HLB-affected trees benefits from higher rate of micronutrients
Study 1

Current Research• Micronutrient Field Trial
• Two locations: Fort Meade and Arcadia
• Valencia/Swingle; 10 to 15 year
• Completely Randomized Block Design
• Trial was initiated in February 2016 and will
end with 2019 harvest
• All the fertilizer treatments are applied 3
times a year by hand in the wetted zone
Study 2
Vashisth et al., Manuscript in preparation

Treatments1. Conventional granular fertilizer +
foliar
2. Conventional granular fertilizer + Tiger Micronutrient Mix
3. CRF + foliar
4. CRF + Tiger Micronutrient Mix
5. CRF + Tiger Micronutrient Mix + Tiger Mn elevated by 20%
6. CRF + Tiger Micronutrient Mix + Tiger Zn elevated by 20%
7. CRF + Tiger Micronutrient Mix + Tiger Fe elevated by 20%
8. CRF + Tiger Micronutrient Mix + Tiger B elevated by 20%
9. CRF + Tiger Micronutrient Mix + Tiger Mn and B elevated by 20%
10. CRF + Tiger Micronutrient Mix + Tiger Mn and B elevated by 50%
Study 2
Vashisth et al., Manuscript in preparation

Yield- 2019 (Boxes per acre)
444489 510 484 497
460 441470
551490
0
100
200
300
400
500
600
1 2 3 4 5 6 7 8 9 10
Boxe
s pe
r acr
e
Treatment #
Fort Meade
321
391442
497455 454 478
438385
483
0
100
200
300
400
500
600
1 2 3 4 5 6 7 8 9 10Bo
xes
per a
cre
Treatment #
Arcadia
bab
ab abab ab
abab a
ab
b
ab
aba ab
a a
ab
ab
a
Study 2
Vashisth et al., Manuscript in preparation

9081095 1088
12631136 1118
1310 1259
10481233
0
200
400
600
800
1000
1200
1400
1600
1800
1 2 3 4 5 6 7 8 9 10
Boxe
s pe
r acr
eTreatment #
Arcadia
893
1063 1047 1076 1039 1027913
9811130
1034
0
200
400
600
800
1000
1200
1400
1 2 3 4 5 6 7 8 9 10
Boxe
s pe
r acr
e
Treatment #
Fort Meade
3 Year Cumulative Yield (Boxes per acre)
b
ab ab abab ab
abab
a
ab
b
abab
a
aba
a
ab
ab
a
Study 2
Vashisth et al., Manuscript in preparation

Ranking based on cumulative yield of 3 yearsArcadia Site Fort Meade Site
Treatment # Treatment Total 3 Yr Yield
(boxes per acre) Treatment # Treatment Total 3 Yr Yield (boxes per acre)
7 CRF+Tiger MM + Fe 20% 1310 9 CRF+Tiger MM + Mn+B 20% 1130
4 CRF+Tiger MM 1263 4 CRF+Tiger MM 1076
8 CRF+Tiger MM +B 20% 1259 2 Conventional+ Tiger MM 1063
10 CRF+Tiger MM + Mn+ B 50% 1233 3 CRF+ foliar 1047
5 CRF+Tiger MM + Mn 20% 1136 5 CRF+Tiger MM + Mn 20% 1039
6 CRF+Tiger MM + Zn 20% 1118 10 CRF+Tiger MM + Mn+ B 50% 1034
2 Conventional+ Tiger MM 1095 6 CRF+Tiger MM + Zn 20% 1027
3 CRF+ foliar 1088 8 CRF+Tiger MM +B 20% 981
9 CRF+Tiger MM + Mn+B 20% 1048 7 CRF+Tiger MM + Fe 20% 913
1 Control 908 1 Control 893
Study 2
Vashisth et al., Manuscript in preparation
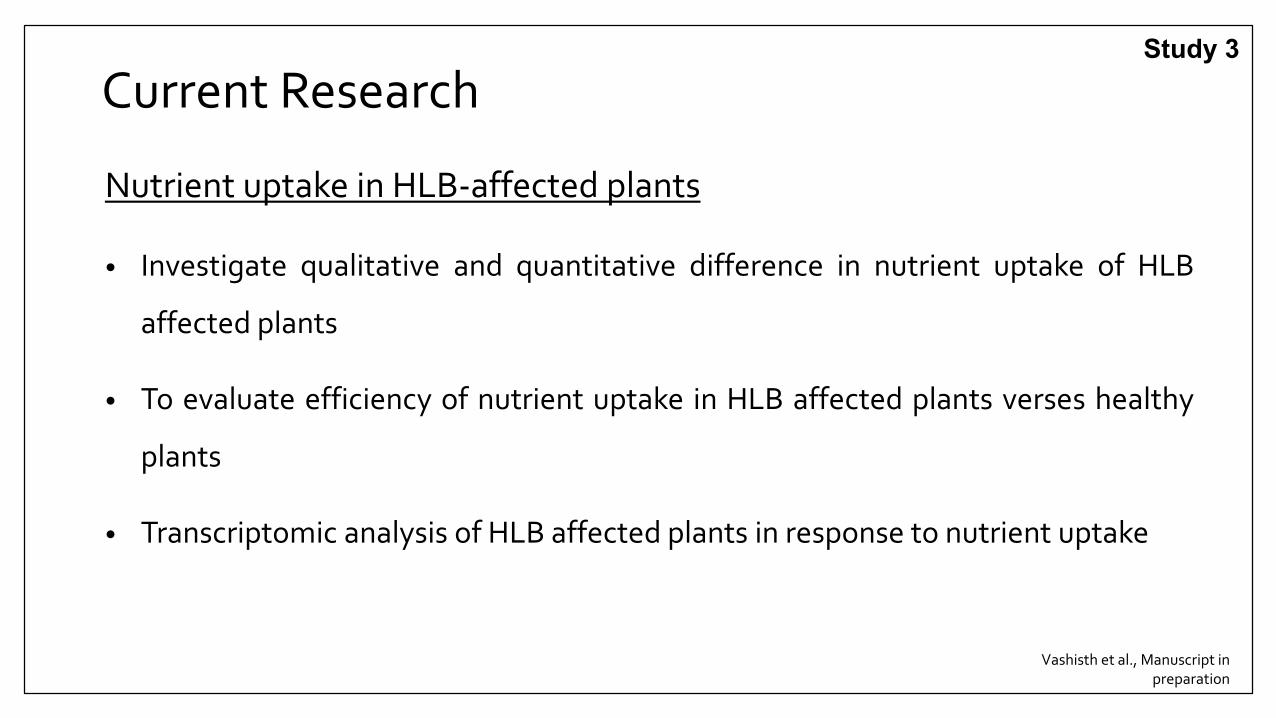
Current Research
Nutrient uptake in HLB-affected plants
• Investigate qualitative and quantitative difference in nutrient uptake of HLB
affected plants
• To evaluate efficiency of nutrient uptake in HLB affected plants verses healthy
plants
• Transcriptomic analysis of HLB affected plants in response to nutrient uptake
Vashisth et al., Manuscript in preparation
Study 3

Experimental Setup
• Same age ‘Midsweet’ grafted on Kuharske
rootstock: Healthy (HLY) and HLB-affected
• Plants were deprived from fertilizer for 6
months before experiment
• Hydroponic system with Hoagland solution
added at the beginning
• Two month study, sampling every 7 days
Vashisth et al., Manuscript in preparation
Study 3

Results
0
10
20
30
HLB HLY
Fres
h w
eigh
t (g)
roots shoots
leaves
*
HLB-affected plants were significantly low in root and shoot
biomass
*
*
0
0.2
0.4
0.6
0.8
Healthy HLB
Root
to S
hoot
Rat
io
*
Vashisth et al., Manuscript in preparation
Study 3

Chlorophyll content
0
10
20
30
40
50
12/8/2016 12/18/2016 12/28/2016 1/7/2017 1/17/2017 1/27/2017
Chl
orop
hyll
cont
ent
HLB Fertilized Helathy FertilizedHLB non-Fertilized Healthy non- Fertilized
(P < 0.05)
HLB plants were able to increase chlorophyll content as infertilized healthy plants.
Study 3

Leaf Nutrients Level- HLB affected plant metabolize nutrient at higher rate
0
50
100
150
Iron
(ppm
)
0
0.2
0.4
0.6M
agne
sium
(%)
0
0.2
0.4
0.6
Sulfu
r (%
)
0
1
2
3
4
Pota
ssiu
m (%
)
0
20
40
60
Man
gane
se (p
pm)
0
20
40
Zin
c (p
pm)
*
**
*
** *
*
Vashisth et al., Manuscript in preparation
Study 3
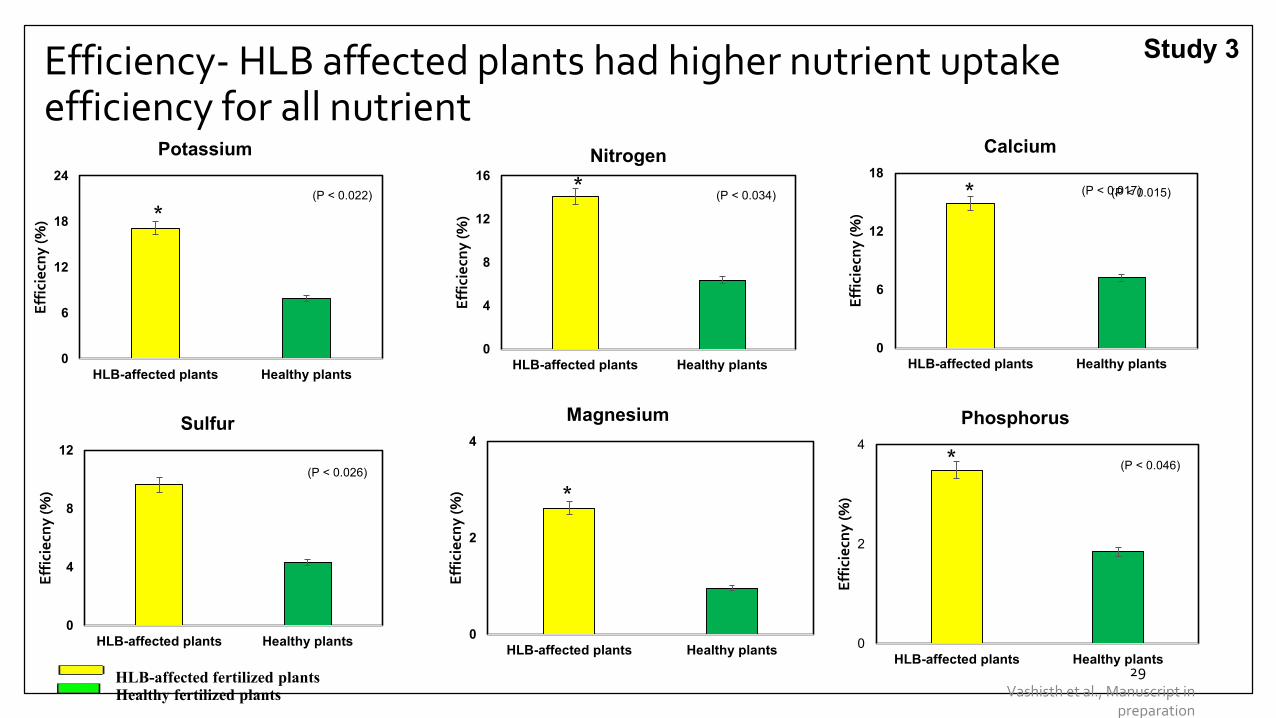
Efficiency- HLB affected plants had higher nutrient uptake efficiency for all nutrient
29
0
6
12
18
24
HLB-affected plants Healthy plants
Effic
iecn
y (%
)
Potassium
0
6
12
18
HLB-affected plants Healthy plants
Effic
iecn
y (%
)
Calcium
0
4
8
12
HLB-affected plants Healthy plants
Effic
iecn
y (%
)
Sulfur
0
4
8
12
16
HLB-affected plants Healthy plants
Effic
iecn
y (%
)
Nitrogen
HLB-affected fertilized plantsHealthy fertilized plants
(P < 0.034)(P < 0.022) (P < 0.015)
(P < 0.026)
*
* *
0
2
4
HLB-affected plants Healthy plants
Effic
iecn
y (%
)
Magnesium
0
2
4
HLB-affected plants Healthy plants
Effic
iecn
y (%
)
Phosphorus
(P < 0.046)
(P < 0.017)
*
*
Vashisth et al., Manuscript in preparation
Study 3

Transcriptomic AnalysisRNAseq for global gene expression study
Day 0, 7, and 14
Number of Differentially Expressed Genes
Day 0 HLB vs HLY 9
Day 7 HLB vs HLY 21
Day 14 HLB vs HLY 3246
Vashisth et al., Manuscript in preparation
Study 3
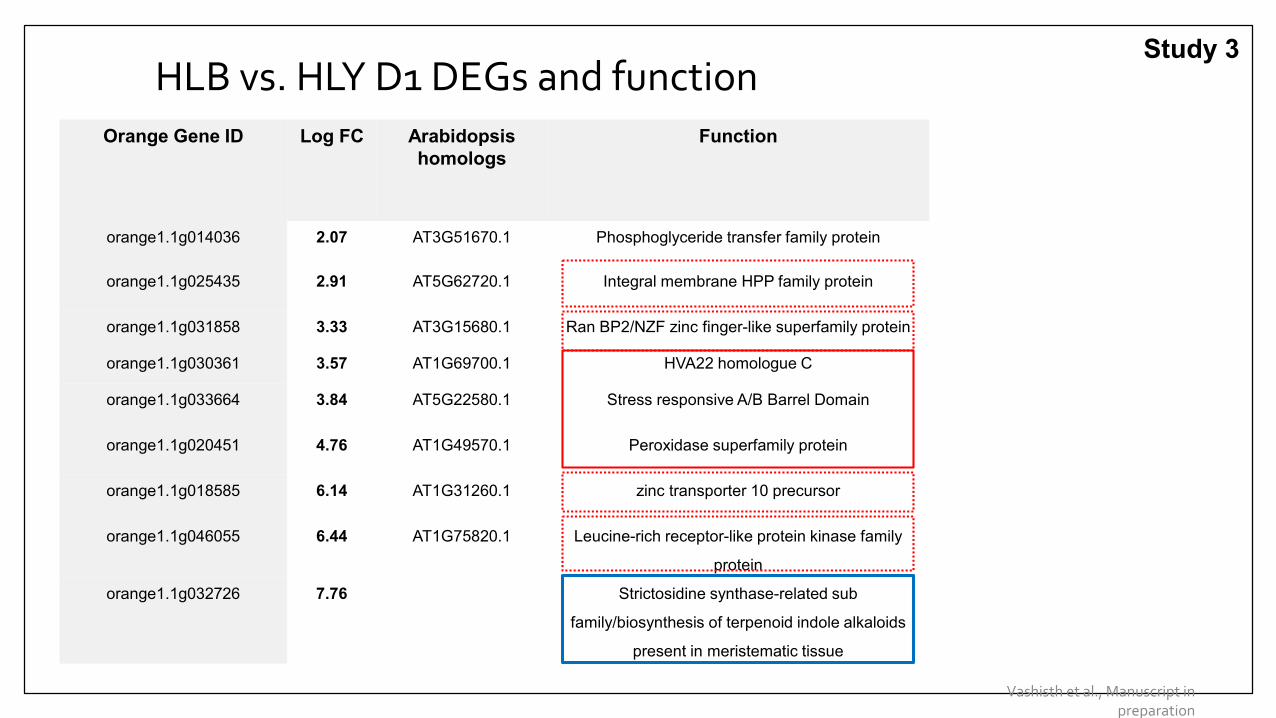
HLB vs. HLY D1 DEGs and functionOrange Gene ID Log FC Arabidopsis
homologsFunction
orange1.1g014036 2.07 AT3G51670.1 Phosphoglyceride transfer family protein
orange1.1g025435 2.91 AT5G62720.1 Integral membrane HPP family protein
orange1.1g031858 3.33 AT3G15680.1 Ran BP2/NZF zinc finger-like superfamily protein
orange1.1g030361 3.57 AT1G69700.1 HVA22 homologue C
orange1.1g033664 3.84 AT5G22580.1 Stress responsive A/B Barrel Domain
orange1.1g020451 4.76 AT1G49570.1 Peroxidase superfamily protein
orange1.1g018585 6.14 AT1G31260.1 zinc transporter 10 precursor
orange1.1g046055 6.44 AT1G75820.1 Leucine-rich receptor-like protein kinase family
protein
orange1.1g032726 7.76 Strictosidine synthase-related sub
family/biosynthesis of terpenoid indole alkaloids
present in meristematic tissue
Vashisth et al., Manuscript in preparation
Study 3
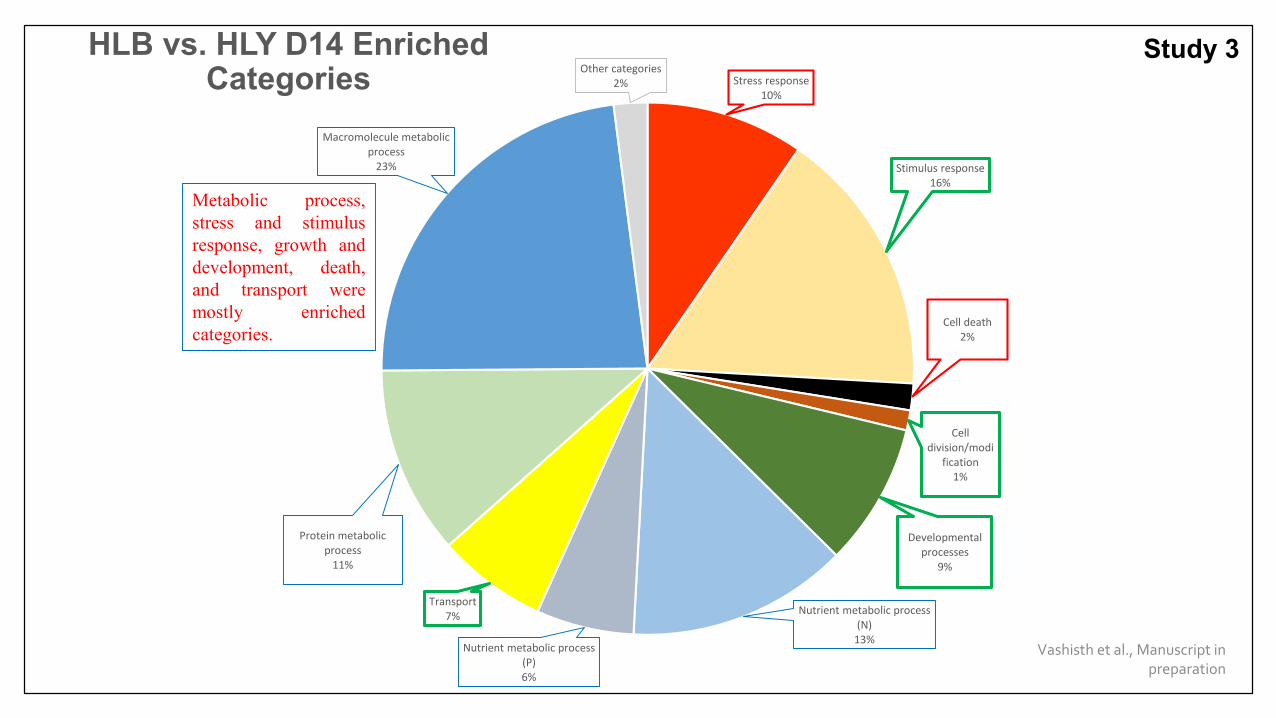
HLB vs. HLY D14 Enriched Categories Stress response
10%
Stimulus response16%
Cell death2%
Cell division/modi
fication1%
Developmental processes
9%
Nutrient metabolic process (N)
13%Nutrient metabolic process
(P)6%
Transport7%
Protein metabolic process
11%
Macromolecule metabolic process
23%
Other categories2%
Metabolic process,stress and stimulusresponse, growth anddevelopment, death,and transport weremostly enrichedcategories.
Vashisth et al., Manuscript in preparation
Study 3

Biological Process HLB vs HLY Day 14
Vashisth et al., Manuscript in preparation
Study 3

Soil pH• Macronutrients (N, K,
S, Ca and Mg) highly available between soil pH 6.5 and 8
• Micronutrients (Mn, Zn B, and Fe) most available below soil pH 6.5
• Best soil pH range for most crops is 6 to 6.5
Study 4

Why soil acidification?
In Florida,
Optimum pH range: 5.5 to 6.5
Soil pH> 6.5
Irrigation water: Bicarbonates >100 ppm and pH> 7.5
No soil acidification in commercial citrus groves pre-HLB
HLB-symptoms intensify under high soil pH
Root density is related to bicarbonate stress thus reducing yield at high pH
High pH stress
Osmotic stress
Ion toxicity
Nutrient unavailability
Production of reactive oxygen
species (ROS)
Cell death
Stress due to high pH on citrus
(Hanumantharao et al., 2016)
Study 4
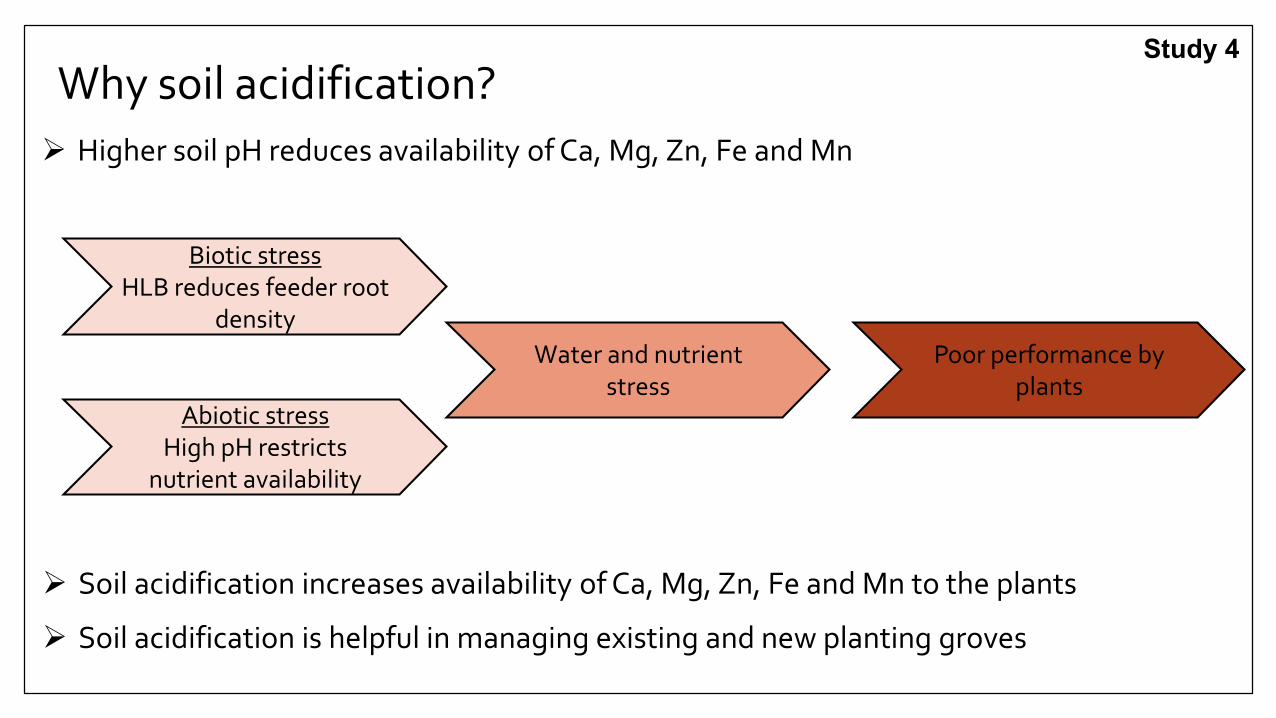
Why soil acidification? Higher soil pH reduces availability of Ca, Mg, Zn, Fe and Mn
Soil acidification increases availability of Ca, Mg, Zn, Fe and Mn to the plants
Soil acidification is helpful in managing existing and new planting groves
Biotic stressHLB reduces feeder root
density
Abiotic stressHigh pH restricts
nutrient availability
Water and nutrient stress
Poor performance by plants
Study 4
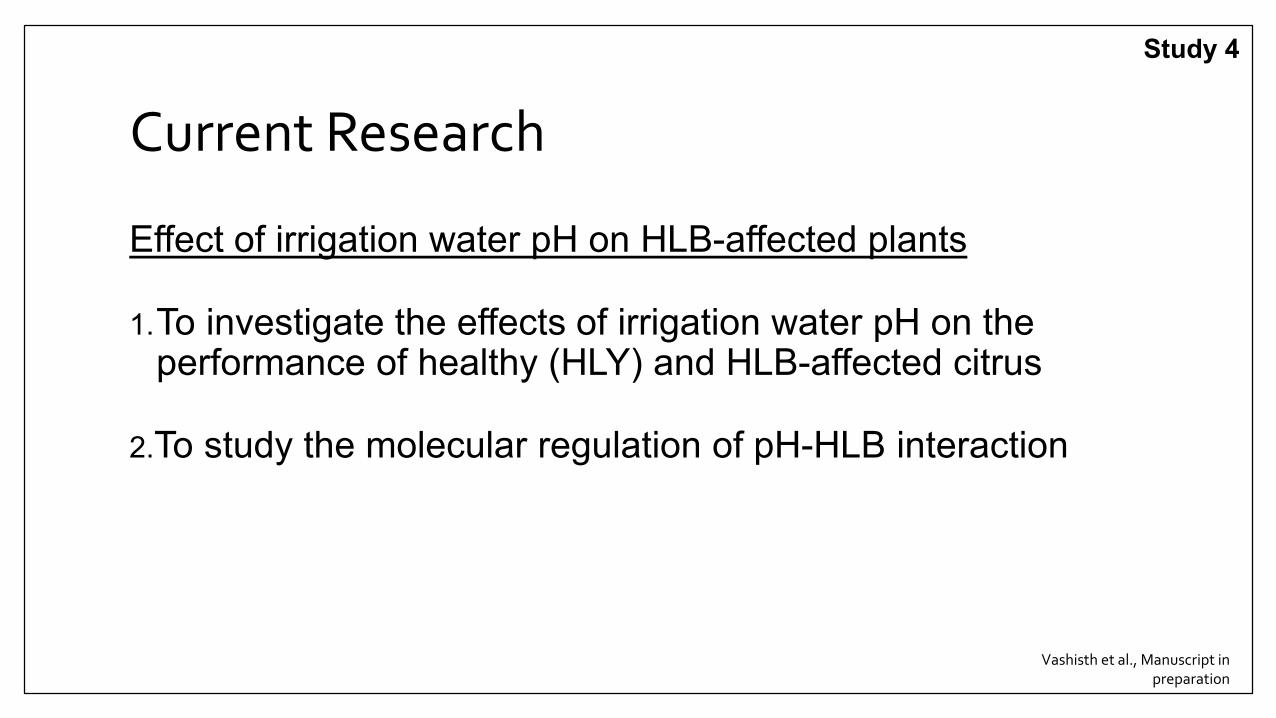
Current Research
Effect of irrigation water pH on HLB-affected plants
1.To investigate the effects of irrigation water pH on the performance of healthy (HLY) and HLB-affected citrus
2.To study the molecular regulation of pH-HLB interaction
Study 4
Vashisth et al., Manuscript in preparation

Experimental Details
• Experimental design: CRD (n=8), Factors:
pH : 5.8, 7.0 and 8.0
pH 5.8 pH 8.0
pH 7.0
Disease: HLY and HLB
• Planting material: ‘Midsweet’ on Kuharske
Study 4
Presenter
Presentation Notes
Change photographs of HLY and HLB from Faisal

Experimental details
Acclimatized and nutrient deprived for 2 weeks
Irrigated with phosphate buffer every 3 days
Fertilized at Day 0
Grown in autoclaved Candler fine sand (pH 7.2)
Final data collection: 60 days
Study 4
Vashisth et al., Manuscript in preparation

0 0
12.5
0
12.5
37.5
0
10
20
30
40
5.8 7.0 8.0
Dea
th (%
)
ResultsHLB-affected plants under pH 8.0 treatment had the highest death rate
Study 4
Vashisth et al., Manuscript in preparation
Presenter
Presentation Notes
Expt was initially planned for a duration of 4 months, however due to the rapid death rate, expt had to stop in 60 days
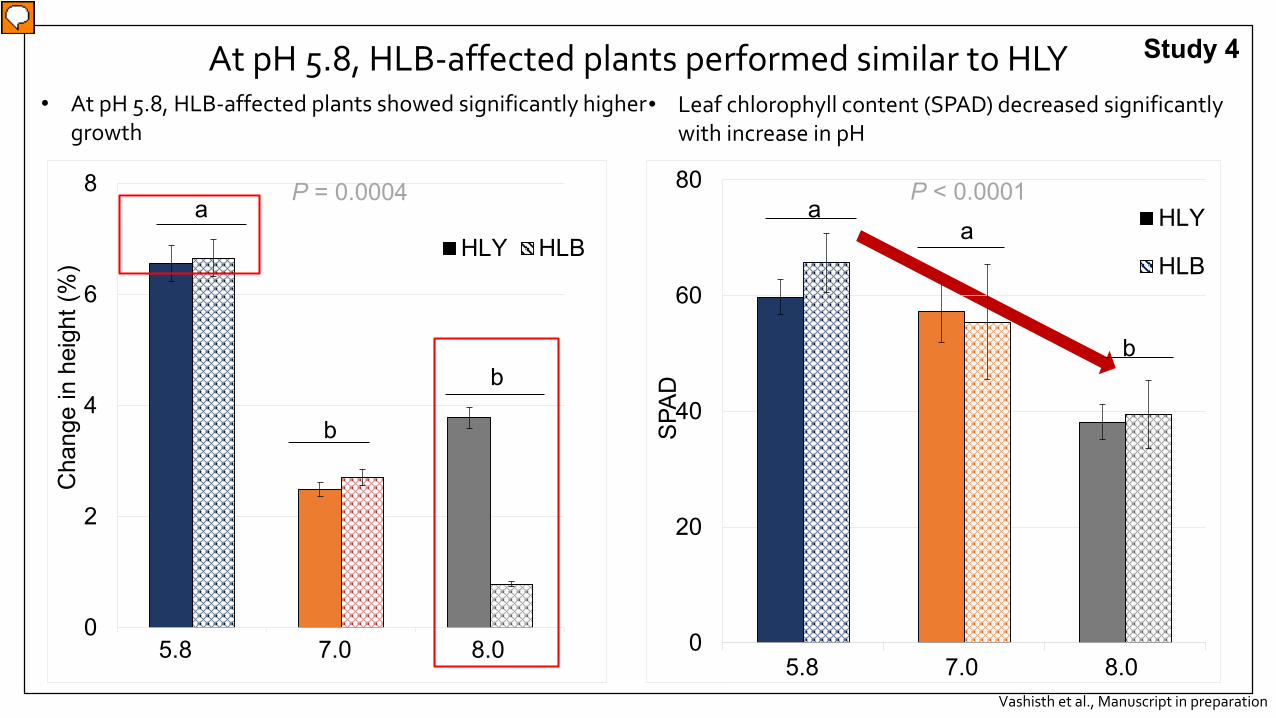
• At pH 5.8, HLB-affected plants showed significantly higher growth
0
2
4
6
8
5.8 7 8
Cha
nge
in h
eigh
t (%
)
HLY HLB
b
a
b
At pH 5.8, HLB-affected plants performed similar to HLY• Leaf chlorophyll content (SPAD) decreased significantly
with increase in pH
5.8 7.0 8.0
P = 0.0004
0
20
40
60
80
5.8 7 8SP
AD
HLY
HLB
5.8 7.0 8.0
aa
b
P < 0.0001
Study 4
Vashisth et al., Manuscript in preparation
Presenter
Presentation Notes
Marginal increase in height and SPAD was observed at pH 5.8-HLB than HLY

pH 8.0 HLB treatment resulted in heavy leaf drop• Irrigation water pH had significant effect on reducing
leaf number
0
10
20
30
40
Day 0 Day 60
Leaf
num
ber
5.8 HLY 5.8 HLB 7.0 HLY7.0 HLB 8.0 HLY 8.0 HLB
}}
}
P < 0.0001
a
b
c
R² = 0.93y = 19.352x + 4.6805
y = 36.91x - 19.65R² = 0.99
0
20
40
60
80
100
5.8 7.0 8.0
Leaf
dro
p ra
te (%
)HLY HLB Linear (HLY) Linear (HLB)
• Effect of pH on leaf drop rate is linear in HLB
Study 4
Vashisth et al., Manuscript in preparation
Presenter
Presentation Notes
Do mention that number of leaves were almost the same to begin with.

Leaf biomass decreased with increase in pH
a
b
c
0
2
4
6
8
5.8 7.0 8.0
Leaf
dry
wei
ght (
g)
P < 0.0001
Study 4
Vashisth et al., Manuscript in preparation
Presenter
Presentation Notes
pH 5.8-HLB plants although have higher number of leaves did not have higher leaf biomass than pH 5.8-HLY plants suggesting more new leaf growths under pH 5.8-HLB conditions

Shoot system at Day60
pH: 5.8 7.0 8.0
HLY:
HLB:
Study 4
Vashisth et al., Manuscript in preparation

Root biomass decreased with HLB, regardless of the pH
a
b
0
10
20
30
40
HLY HLB
Roo
t dry
wei
ght (
g)
P = 0.001
Study 4
Vashisth et al., Manuscript in preparation
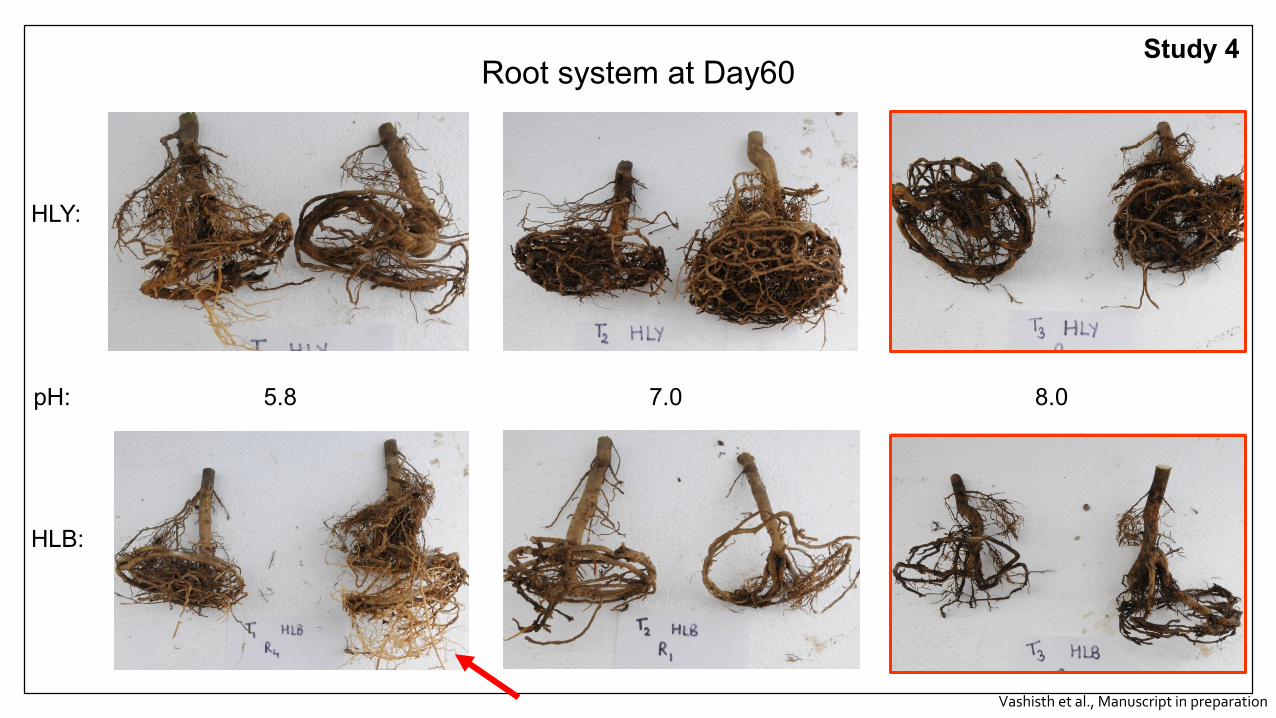
Root system at Day60
HLY:
pH: 5.8 7.0 8.0
HLB:
Study 4
Vashisth et al., Manuscript in preparation
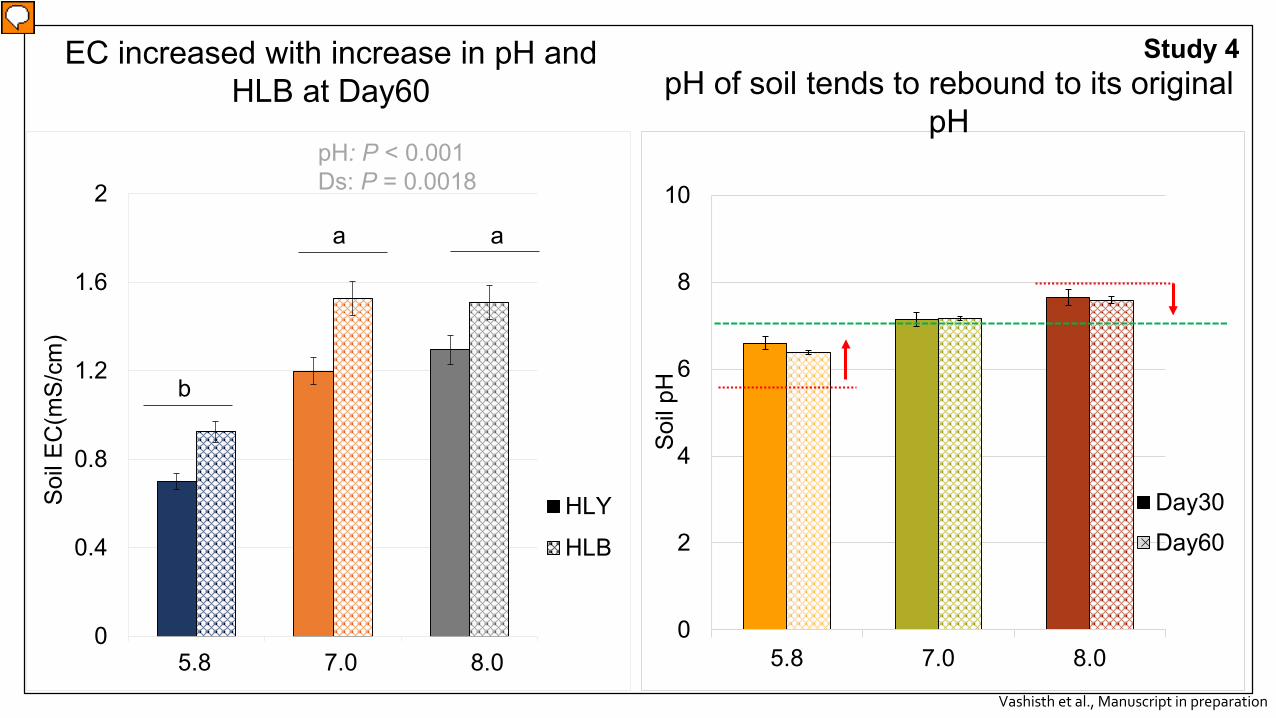
EC increased with increase in pH and HLB at Day60
0
0.4
0.8
1.2
1.6
2
5.8 7 8
Soil
EC(m
S/cm
)
HLY
HLB
pH: P < 0.001Ds: P = 0.0018
5.8 7.0 8.0
a
b
a
0
2
4
6
8
10
5.8 7.0 8.0So
il pH
Day30Day60
pH of soil tends to rebound to its original pH
Study 4
Vashisth et al., Manuscript in preparation
Presenter
Presentation Notes
Mention the red lines are the applied pH and green is the original pH

520274
694
0
0
200
400
600
800
1000
1200
1400
pH 5.8 (HLY vs HLB) pH 8.0 (HLY vs HLB)
Num
ber o
f gen
es (#
)Up
Down
Greater numbers of genes were differentially regulated at pH 5.8 with HLB while fewer at pH 8.0
Study 4
Vashisth et al., Manuscript in preparation

response to red light
lipoprotein biosynthetic process
lipoprotein metabolic process
hydrogen peroxide metabolic process
post-embryonic root development
reactive oxygen species metabolic process
hormone metabolic process
regulation of hormone levels
secondary metabolite biosynthetic process
shoot system morphogenesis regulation of meristem
development
terpenoid metabolic processresponse to bacterium
isoprenoid metabolic process
immune response
meristem development
secondary metabolic process
photosynthesis
response to oxidative stress
developmental maturation
oxidation-reduction process
root system development
pH 5.8-HLB vs HLY: Enriched GO categories for upregulated genes• ROS detoxifying processes • Growth of root and shoot • Photosynthesis• Hormonal regulations • Secondary metabolic process
Root and shoot development
Secondary metabolite biosynthesis
ROS detoxifying processes
Hormonal regulations
Response to stresses
Study 4
Vashisth et al., Manuscript in preparation

oxylipin biosynthetic process
oxylipin metabolic process
glycine metabolic process
defense response to bacterium, incompatible
interaction
cellular lipid catabolic process
lipid oxidation
lipid modification
response to woundingpolyol metabolic process
serine family amino acid metabolic process
immune system process
immune response
single-organism catabolic process
aging
cellular polysaccharide metabolic process
defense response
Jasmonic acid related pathways
Defense or immune responses
Senescence
Aminoacid metabolic process
pH 5.8-HLB vs HLY: Enriched GO categories for down-regulated genes• Jasmonic acid related pathways • Defense and immune responses • Protein metabolic processes• Senescence
Study 4
Vashisth et al., Manuscript in preparation

lignin metabolic process
protein acylation
programmed cell death
response to light intensity
cell death
regulation of defense response
response to bacterium
secondary metabolic process
mRNA processing
protein ubiquitination
mRNA metabolic process
immune system process
root developmentroot system development
regulation of growth
immune response
response to abscisic acid
response to stress
cell division
Cell deathGrowth and development
Defense or immune responses
pH 8.0-HLB vs HLY: Enriched GO categories for upregulated genes• Cell death • Defense and immune responses • Growth and development
Study 4
Vashisth et al., Manuscript in preparation
Presenter
Presentation Notes
Ubiquitin is best known for its function in targeting proteins for degradation by the proteasome. Protein acylation is the post-translational modification of proteins via the attachment of functional groups through acyl linkages. Protein acylation has been observed as a mechanism controlling biological signaling.[

Take Home Message
• HLB-affected trees do benefit from good nutrition program• Micronutrients are critical for HLB-affected plants, needed at slightly
elevated levels• Due to small root system in HLB-affected trees, nutrient uptake is
limited• HLB-affected trees are more efficient in nutrient uptake
• Fertilizer program should be site specific• Soil pH affects growth of HLB-affected trees• Effect of soil-pH on HLB-affected trees is not limited to nutrient
uptake