Nutrition survey establishing the extent of malnutrition ... Survey 13 Jan... · 0 Nutrition survey...
80
0 Nutrition survey establishing the extent of malnutrition and validating the high malnutrition rates in in children aged 6 to 59 months and- pregnant and lactating women in the World Vision operating areas of Northern Sindh. Research to identify the immediate and underlying causes. Date: Research conducted October 2011, Report internally drafted January 11 2012.
-
Upload
truongcong -
Category
Documents
-
view
219 -
download
2
Transcript of Nutrition survey establishing the extent of malnutrition ... Survey 13 Jan... · 0 Nutrition survey...

0
Nutrition survey establishing the extent of malnutrition and
validating the high malnutrition rates in in children aged 6 to 59
months and- pregnant and lactating women in the World Vision
operating areas of Northern Sindh. Research to identify the
immediate and underlying causes.
Date: Research conducted October 2011, Report internally drafted January 11 2012.

1
Acronyms
ARI acute respiratory illness
BCC behavior change communications
BHU basic health unit – first level facility in communities – one per union council
CIDA Canadian International Development Assistance
CMAM community- based management of acute malnutrition
DCO District Commissioners Office
GAM global acute malnutrition ( SAM + MAM cases/ rates)
HFA height for age – measures stunting
HH (s) Household (s)
IEC information exchange communications
Kecheri mixture of Dahl and rice
MAM moderate acute malnutrition
MUAC mid upper arm circumference
NADRA National Database and Registration Authority
NIC National identity card
OFDA Office of Foreign Development Assistance
PC 1 Government project document
PK Rs Pakistan Rupees (exchange rate : 1 USD: 90.2 Pk Rs in December)
PLW Pregnant and lactating women
RCC Reinforced concrete construction
SAM severe acute malnutrition
TB tuberculosis
UC union council
UNICEF United Nations International Children’s Emergency Fund
WASH water and sanitation and hygiene
WFH Weight for height- measures wasting
WRA women of reproductive age
WV World Vision
Z score standard deviation from healthy mean.
2
Executive Summary
The study aimed to identify the extent of malnutrition in the World Vision (WV) nutrition intervention sites
and catchment areas. WV staff conducted a greater coverage screening in 13 union Councils (UCs) of two
districts Sukkur and Khairpur, on the basis of it’s Community Management of acute Malnutrition (CMAM)
program operating areas.
The result of screening 23,505 children aged 6-59 months using mid – upper arm circumference (MUAC) measurement showed in annex 1.
9% severe acute malnutrition (SAM) (<11.5cm),
20% moderate acute malnutrition (MAM) (12.5 cm to 11.5 cm).
Out of 4,206 pregnant and lactating women (PLW) screened staff identified
29% as suffering moderate acute malnutrition (MAM).
Staff conducted a small sample survey of 274 households to validate the results of the initial screening and to
explore the underlying causes of the malnutrition. As the physical houses and yards contained joint families the
survey ended up measuring 762 children in the age group, double what was expected in regard to children in
the age bracket for that number of single households.
Some data was discarded as outliers at the individual measurement analysis stage (and across the HH survey in
appended tables) which explains why in the body of the report the total number of children measured varies
from analysis of one set of measurements to another. At the end of the report the team has cross verified this
approach by discarding any household’s data at the start and keeping a consistent number of children as the
base across the analysis. Some small variation occurred but not enough to discount the general findings and
analysis using either data cleaning approach.
Among 620 children aged 6-59 months assessed in the sample survey for height for age
only 18% of the children were seen as greater than minus two standard deviations (>-2Zscore) below
the anticipated measurements.
This leaves 82% with some degree of stunting and among those
429 children ( 69%/620) were measured at greater than three standard deviations below the
anticipated measurements (under -3 Z scores) indicating severe stunting.
The findings were similar for boys as they were for girls in the disaggregated data
To confirm these alarming figures staff analyzed the SAM cases at the intervention sites height for age and
came up with not dissimilar figures regarding stunting amongst the SAM cases.
Out of 712 children measured for weight for height (wasting)
180 (25%) showed severe malnutrition (<-3SD), two and a half times above what is considered the
critical level of (10%)
A further16% (111) were under -2SD measures for weight for heath indicating moderate acute
malnutrition.
Rates for girls and boys were the same for severe wasting however moderate wasting was higher (66%
compared to 44%) for girls than in the boy’s sample.

3
Out of 762 children measured for acute malnutrition using MUAC tape,
69 ( 9% ) were recorded with severe acute malnutrition and
122 (16 % ) were recorded with moderate acute malnutrition.
This is the same SAM rate as in the greater screening but less MAM cases than recorded in the greater
screening.
Social Determinants underlying Malnutrition
Most of the population belongs to low income groups, mainly laborers working on daily wedges, a third live
in one room only, and most of the houses have (76%) an unpaved floor. Given that more children were found
in the age group in each compound this means that large extended families are living in cramped quarters. The
majority of the households have at least one buffalo or goat, and electricity. The source of fuel is fire wood
and kerosene oil 36% cases each and 24% use other fuel including tyres, papers and dried date leaves.
Household income was averaged at 9000 Rs per month per household however this resource to appears to
have stretched to a large or extended household population.
Most of HHs have access to bore water at their house (77%), the rest have access to other sources such as
unprotected wells or public tube wells while 54% never treated water and 33 % always treat water to make it
safe for drinking purposes. The Safety of water was not physically measured in the study. Among the HH
surveyed only 27% use the flush toilet system while 29% are practicing open defecation.. The important
positive practices included hand washing after using toilet and before meal is 96% and 94% respectively,
however 57% of the respondents reported using water with soap. This needs to be verified as the questions
may have been somewhat leading, however it may also link to the fact that ARI rather than diarrhea is the
more prevalent health concern recorded at BHUs. The bore water may also be clean but this should be tested
– for bacterial and chemical contaminants.
The food intake was measured in frequency and for the type of food during last 24 hours, 26% and 28%
women of reproductive age (WRA) eat three and four times a day respectively, and 10% less than twice a day.
The quality of food is poor across all the daytime meals, mainly tea with Roti or bakery items, followed by
(nearly 50% of the respondents who takes tea with roti or bakery items) a single meal with rice and pulses and
vegetable with roti.
The frequency food given to children was 21% only 1-3 times, with highest frequency was 18% (7times), and
38% at least six times . The main food given to child was either breast milk or other milk, followed by tea with
roti or bakery, once a day similar no of children have rice only and vegetables with roti. The major of diet of
children in the age group appeared to be limited to bread and milk as well as tea.
Breast feeding was common but colostrum was given to 77% of the children, and 38 % mothers gve exclusive
breast feeding less than six months while 15% never and 27% and 19% mothers give only breast milk to
children 6 months to one year and over one year. This is confirmed by figures for age of child for introducing
complementary food, which is 42% less than 6months and is mostly fresh milk, only 22% introduce food for
children age 6 months to one year. In addition to milk honey water is given to 39% children age less than 6
months and 36% have no knowledge about complementary food. Only 16% of mothers prepare food
separately for children and 35% never prepare food especially for child.
To assess malnutrition among WRA, 225 women interviewed had experience of at least one pregnancy, 37%
had 4-6 times, and 20% 7-9 and 7% had 10 or more pregnancies. The risk of malnutrition and pregnancy and
birth related risk increases with the number of pregnancies, in total 5% had miscarriage, while 2% had

4
experienced stillbirth, analyzing the individual outcome of pregnancy eight women have experience of at least
one miscarriage and seven had two, and four WRA had three miscarriages. Similarly eight women had one
stillborn child and four had two stillborn children. WRA reported weakness with headache (11%), worm’s
infestation (16%) and hospitalization (18%).
Morbidity among children aged 6-59 months, had similar pattern reported in the health facilities during same
period, Cough and difficult breathing (ARI) was at top (n=60), followed by diarrhea (n=34) and fever (23%).
Mothers (25%) reported worm’s infestation among children over last six months while 41% were not aware of
worm infestation. Among children survey 68% had all vaccination, 8% had no vaccination and 23% mothers
were unaware of the vaccination.
Recommendations
Initiate integrated program to focus on
Advocacy for approval of already drafted Sindh PC1 for Nutrition CMAM
Support Development of a multi-sector umbrella PC1 for an integrated program addressing
the underlying causes of malnutrition – WASH, Health including diet awareness, Livelihoods,
Food security ( access and variety), Food (micronutrients) and school health and nutrition
Building government capacity to recognize malnutrition (including growth monitoring), refer
and treat
Introduction and training of multipurpose staff at health facility in nutrition screening every
child seeking health care at the facility through integrated Management of childhood illness
Inclusion and analysis of nutrition status as part of routine case management at facility level
Further investigate HH practices regarding WASH, dilution of fluids (ie cows milk) for
children’s diet
Including Men for awareness and support to pregnant and lactating women and women of
reproductive age and children for adequate diet as well as birth spacing, antenatal and post
natal care health seeking, safe delivery and general child wellbeing.
Effective exclusive breastfeeding 0-6 months
Complimentary feeding and proper diet for children aged 6months to two years of age
Hygiene awareness and practices
Improved young girls and women of reproductive age nutrition
Enhanced community participation in malnutrition detection and care and prevention.
Especially with regard to mothers, caregivers and decision makers ability to understand
monitor and the health of their children.
Targeted food distributions/ subsidies and liveliehood improvement program for vulnerable
families where economics and food access are the underlying causes of malnutrition. Consider
for families with pregnant and lactating mothers
Promoting linkages to social welfare support mechanisms for extremely vulnerable families
Addressing factors affecting maternal health and contributing to childhood malnutrition i.e.
high fertility rates, high levels of anemia, high incidences of miscarriages and still births and
maternal morbidity.
Explore Design and support strategies in empowering families to address social determinants
of poor health outcomes such as low socio-economic status, illiteracy and food insecurity
prevention and management of childhood illnesses, ARI, Diarrhea, malaria and vaccine
preventable diseases micronutrient intervention (Vit A, iron, folic acid, iodine) to reduce the
complications leading to mortality or increased malnutrition.

5
For accurately measuring stunting in children into the future considerable efforts should be
made to ensure children’s births are registered within a week and one month of delivery. This
should be a clear recommendation for any partner working on nutrition into the future.
Research rates of diarrhea/ population and in comparison to other areas in Pakistan as well as
further investigating the drinking water purity and treatment practices
Research and advocacy regarding food security access issues
Operational /Implementation level
Health facility at the community
Facility based outreach team and/or community based weighing of children ages 0-3years ,
interpretation of growth curve and counseling for mothers to identify causes of poor growth and
support her in remedial actions and referral to nearest health facility
Outreach visits/follow-up of specific cases referred to hospitals
Support and promote early birth registration
IMCI to include nutrition screening and treatment.
Health Hygiene and diet awarenesss BCC and IEC materials – shown and counseled at facilities and in
oput reach
Use screening at facilities for promoting inclusion of vulnerable children’s families in social welfare and
targeted assistance packages
Form male support groups for mothers and child well-being
Introduce newly wed and couples counseling regarding mother and child well being
Ensure EPI coverage.
Community /household level
Focus BCC on early and exclusive breast feeding 0-6months and continuity of breast feeding till 24
months
Addressing the underlying causes to reduce risk of anemia in pregnant women
Further research on exploring promoters/positive practices in nutrition for women and children
Improving general awareness of a healthy diet and eating practices
Improve local access to a varied diet. – promote kitchen gardens and cottage diversified income
sources including promoting women’s economic opportunities and value chain
Explore deworming and micronutrient programs
Improve food and personal hygiene practices
Investigate and improve water quality
Introduce savings schemes

6
1. BACKGROUND
Sindh is the most southern and the third largest province of Pakistan with an area of 140 915 km. The capital
of Sindh is Karachi. The province is divided into 23 districts composed of 122 tehsils subdivided into 1,096
union councils. According to the Federal Bureau of Statistics 2010 estimates, Sindh population approximates
40 220 547 inhabitants and that is mostly urban. The Main cities are Hyderabad, Larkana, Thatta, Nawabshah,
Mirpurkhas, Tando Adam, Tando Allahyar, Shikarpur and Sukkur. Seventy percent of the population speak
Sindhi, but Urdu and Rajasthani (in some areas) are also common
Khairpur and Sukkar are two among three districts where World Vision Pakistan started humanitarian
emergency activities after the 2010 floods and remained to building on relief with early recovery activities. As
these districts were previously identified as low human development index rated, World Vision intentionally
targeted these affected districts with an idea to build up to development projects in the most undeveloped
areas.
Khairpur District is located in northern Sindh and is bound on the north by Shikarpur and Sukkur, on the east
by India, on the south by Sanghar and Nawabshah and on the west by Larkana and Naushahro Feroz.
According to the 1998 census of Pakistan, the district had a population of 1,546,587 of which 23.23% was
urban. The average annual growth rate of the population is 2.71%. Khairpur is noted for its bountiful harvest
of dates. However, the soil is suitable for many cash crops including cotton and wheat. The dry, hot climate
makes the fruit very sweet, supple and juicy. It is very hot and sunny during the summer and cold in winter.
The main institutions of higher education in Khairpur district are Shah Abdul Latif university, Mehran
engineering college, women college, Mumtaz College and Superior Science College.
Sukkur district is divided into 4 administrative strata (tehsils), namely; Sukkur City, Rohri, Saleh Pat and Pano
Aqil. According to the official census of 1998, Sukkur city had 908,370 inhabitants and a population density of
175.9 persons per square kilometre. With a 2.88% annual growth the Sukkur population has surpassed 1
million. According to the 2010 estimations of Pakistan, at least 59.50% of the population of Sukkur district was urban, making it the third-most urbanized district in Sindh.
In the two districts, World Vision is in the process of establishing an integrated programming model based on
its experience across the globe. One of the key sectors for this model is health & nutrition. World Vision has
started emergency response in health & nutrition back in September, 2010 with support from DEC for ten
mobile clinics and ten nutrition sites. In February 2011, WV with OFDA funding support continued increasing
the number of sites to thirteen Community based Management of Acute Malnutrition (CMAM) sites and a
Stabilization Center (SC). Currently, UNICEF and WFP have supported WV to increase CMAM sites from
thirteen up to twenty with continued support for the stabilization center.
1.1 Scope of the problem:
Last year, after flood 2010, UNICEF with MOH conducted nutrition survey “Flood Affected Nutrition Survey
(FANS) in Oct-Nov, 2010. In Sindh, flood affected areas in North and South Sindh were included. According
to this nutrition survey, in some flood affected areas of Sindh, Global Acute Malnutrition (GAM)rates were
22.9% and 21.2% in Northern and Southern Sindh respectively. Severe Acute Malnutrition (SAM) of 6.1% and
2.9% in Northern and Southern Sindh was recorded respectively. These GAM rates exceed the emergency
threshold of 15%, thus confirming existence of a critical emergency nutrition situation in Sindh province,
according to WHO categorization. In November 2011, UNICEF in consultation with MoH published the
National Nutrition survey (NNS 2010). The Aga Khan University carried out the survey across Pakistan with a

7
sample of 30,000 households. As per reports from this survey, around 60% of Pakistan’s total population is
facing food insecurity. The results of the survey, termed by health experts as “alarming”, indicate a significant
decline in the nutritional status of the people of the country over the past decade. The report stated that iron
deficiency (anemia) and vitamin A deficiency remains widespread in the country; however, iodine deficiency
rate had reduced during the last decade. Other important nutritional indicators measured by the survey
included maternal anemia at 49%, night blindness 16%, child stunting level 43%, while wasting among children
(child’s weight-for-height measured less than -2 standard deviations from the mean) was found to be 13%.
Other startling figures from the survey revealed that 12.5 percent of women were malnourished, with the
figure jumping to 16.1 percent for lactating mothers; 6.5 percent of school children aged six to 12 years were
found to have palpable or visible goiter, with the percentage rising to 21.2 in the case of mothers; while 22.9
percent of school children and 36.5 percent of mothers were found to be severely iodine-deficient.
1.1.Rationale for survey:
In Khairpur and Sukkar, WV established CMAM nutrition sites in both flooded and the adjacent non-flooded
areas in the two districts. During the implementation of this CMAM project, World Vision was able to quickly
find patients to meet the numbers projected according to the FANS rates. The number of malnourished
patients being seen was much higher than expected and it was anticipated that the funded project would
service a higher target than that was set based on FANS 2010 findings. The targets planned and the progress
made till October 15, 2011 were as under:
Tab 1.1 CMAM Program Coverage
WV CMAM Program coverage in Khairpur & Sukkur for population of 296492
Expected SAM
targets based on
FANS 2010 (6%)
SAM Targets achieved
(Please, note 25-30% of
the population still to
cover)
MAM
targets
expected-
(15%)
MAM
targets
Achieved
PLW with
Moderate Acute
Malnutrition (8%)
MAM PLWs
registered with
the program
2668 2368 6671 5158 3084 2037
The purpose of showing this comparison is to indicate that the project targets achieved in October were
nearly equal to what was projected based on FANS 2010 but with only 70% - 75% of the population coverage
Thus, in order, to establish the actual extent of malnutrition in the World Vision operational areas and set
higher targets for comprehensive coverage, the program technical team planned a greater coverage screening.
This included screening of all children age 06-59 months and pregnant and lactating women in the catchment
population. More than 50% of the population was covered for screening through door to door blanket survey
of children in the age group. World vision trained community health workers screened 6 months – 59 months
age children using Mid upper arm circumference (MUAC) tape. The trained staff accessed 23,764 households
(housing 163,932 individuals) in the thirteen nutrition sites of both districts over a period of two weeks days.
The outreach staff screened 23,505 children aged 06-59 months using MUAC tape which resulted in
identified 9% severe acute malnutrition (SAM) cases and 20 % moderate acute malnutrition MAM, based on
the SAM and MAM criteria of <11.5cm and <12.5 cm to 11.5 cm respectively for middle upper arm
circumference measurement. For Pregnant and lactating women (PLW), staff screened 4206 PLW revealing a
29% MAM rate based on MAM criteria for PLWs of <21 cm upper arm circumference measurement.

8
Malnutrition status
All
n = 23,505
Global Acute Malnutrition (< 125 mm) (6855) 29%
Moderate Acute Malnutrition (≥115 mm and <125 mm) (4729) 20%
Severe Acute Malnutrition (<115 mm) () (2026) 9%
These quite high and alarming figures based on MUAC , suggested the need for a detailed survey to validate
these results as well as to identify the underlying and immediate causes of malnutrition.
After establishing the extent of malnutrition in PLWs and children aged 6-59 months in the area, WV decided
to have long term programming to address the underlying causes for which it was necessary to research the
contributing factors to this critical level of malnutrition in the concerned districts. . In this connection, the
technical team designed a research study.
2. METHODOLOGY:
Initially, staff completed the greater coverage survey in all 13 Union Councils of Sukkur and Khaipur where WV
was implementing the CMAM projects. The areas included were both flooded and adjacent non-flooded areas, and
both urban and rural areas. Some of these areas had harbored IDPs during the 2010 Flood.
Tab 2.1 Geographical areas
District Tehsil UC Flooded in
2010
Flooded
in 2011 Neighboring
flooded areas in
2011
Rural Urban
Khairpur Kingri A. R Unar Yes Yes Yes Rural no
Khairpur CD Jelani NO No No no Urban
Kot digi Deh sohu No Yes No Rural no
Kingri Drib Mehar Shah No No Yes Rural no
Khairpur Faizabad No No No no Urban
Kotdigi Fatehpur Yes Yes Yes Rural no
Kingri Hadal Shah Yes Yes Yes Rural no
Khairpur Khairpur No no no no Urban
Kairpur Khirpur Mirs No no no no Urban
Kot Digi Kot Diji No no no Rural no
Kotdigi Layari No no no Rural no
digi Pir Jo Goth Yes no Yes Rural no
Kingri Sardar ji Bhati Yes Yes Yes Rural no
Sukkur Panu Aqil Dadloi No Yes No Rural no
Panu Aqil Hingora Yes no Yes Rural no
Panu Aqil Nooraja Yes no Yes Rural no
Panu Aqil Panu Aakil No no No Rural no
Panu Aqil Sanghi No no No Rural no

9
In the survey, There is no demarcation made between flood and non-flood affected areas and between rural and
urban other than in the table above. This analysis can be done separately on the greater coverage screening
results to ascertain whether there is variance between the different areas and levels of malnutrition. The initial
need was to develop a general understanding of malnutrition in the WV intervention areas. In the greater
coverage survey staff attempted to access all the households including both single and combined families in the
thirteen union councils, based on the expanded program of immunization (EPI) data retrieved from the basic
health units (BHUs).
This population data appears in annex I and was, as expected, different from that received from the DCO office
based on the 1998 census. Staff left some of the HHs un-accessed because of security concerns , however it is
estimated that staff accessed more than 90% of the HHs in the intervention area screening all of the children
present at the time of the visit, and reported as aged 06-59 months. Staff carried out the greater coverage
screening with MUAC and the team established the initial findings for SAM, MAM and MAM PLW..
The great coverage survey combined with the extended research makes the study design both cross sectional and
action research in nature. For the detailed survey, for validation and to determine the underlying causes of
malnutrition, a smaller sample was taken from the house hold list of the greater coverage survey. The sampling
was done randomly.
Initially the research designer proposed a sample of 412 HHs to be interviewed based on a total population of
17,365 HHs in the targeted villages proposed for the assessment, However this was revised to the minimum
possible interviews of 274 household. The research designer decreased the sample size (from 412 to 274)
considering the limited time and budget for conducting the survey. Given that a nutrition report from UNICEF
had been available at the time of WV survey this allowed the lowering of the sample size to the minimum possible
range. In consultation with the project lead, the reduction in sampling to the lower range included strictly linking
with households with pregnant and lactating women and children of the given ages in them. The initial collection of
data for all 274 HHs targeted only one child from each household and missing the rest, even if in the same age
bracket. During computing the results for certain variables directly related to children’s nutrition status, staff felt
the need for revisiting and recollection of data for the HHs. The re-collection mainly helped in gathering missing
MUAC data and related aspects for all the sample survey aged children where there was more than one child in
the age bracket in the household. Staff made the analysis in the report using pivot tables in Excel.
Similarly, the data was cleaned with removing HHs with all children with implausible values of MUAC or removing
one or more children with incorrect MUAC from the HHs. The sector lead determined removal of HHs or the
children from within HHs using the standards available from WHO.
In this regard, the number of HHs in the database reduced. The report shares analysis with data cleaned in two
ways. In the body of the report at each analysis the analyzers removed outlying figures and conducted analysis for
the measurement based on the cleaned sample size. This is why the sample size on number of children varies from
one analysis to the next in the body of the report. The most problematic data measurement was age ( due to lax
birth registration and non-celebration of birthdays/ anniversaries) which therefore had a smaller sample size of
number of children for any analysis involving that measurement. For ensuring this approach had not jeopardized
the analysis the team recreated the data set and analysis tables taking the approach to delete the entire HH data
where there was any single outlying data. This reduced the data set to 235 HHs left with 606 children (from 762
in 274 HHs).The tables representing this approach for data cleaning are annexed to the report.
It is important to mentioned that the reduction in sample size with cleaning data using either approach was made
carefully without having the results been adversely affected. This can be confirmed in the comparison of the two

10
sets of analysis tables. Efforts have been put to confirm validity of the data and results after removal / reduction of
the sample size, for certain technical as well as social parameters used in the survey.
It has been observed that pregnant and lactating women and children less than five are more prone to
malnutrition and its impact and therefore the survey remained focused on malnutrition susceptibility in women
of reproductive age and in children of the age group 6 to 59 months. . Survey team visited each household.
Each house hold in the sample were included both single headed house hold in single family and combine
family structure. Children under 06 months were part of the survey as their mothers were interviewed for
initiation of breast feeding, exclusive and complementary feeding patterns and for practices of top up milk as
well as for illness in this age group. However staff did not collect weight for height, height for age in this age
group is treated under the infant and young child feeding UNICEF standards and appropriate measures.
2.1 Overall Objective of the Research:
The overall objective of this research was to establish the extent and severity of acute and chronic
malnutrition in the flood and non-flood affected areas of Sukkar and Khairpur, and to gain and understanding
of the underlying causes and contributing factors.
Specific objectives include the following:
1. To validate the prevalence of acute malnutrition in children aged 6-59 months and Pregnant and
lactating mothers, To determine the prevalence of chronic malnutrition rates in the two districts
2. To identify the immediate causes of malnutrition
3. SURVEY RESULTS:
3.1 Extent of Malnutrition In children the three most commonly used anthropometric indices to assess
their growth status are weight-for-height, height-for-age and weight-for-age. These anthropometric indices can
be interpreted as follows:
3.1.1Stunting:
Low height-for-age: Stunted growth reflects a process of failure to reach linear growth potential as a result
of suboptimal health and/or nutritional conditions. On a population basis, high levels of stunting are associated
with poor socioeconomic conditions and increased risk of frequent and early exposure to adverse conditions
such as illness and/or inappropriate feeding practices. The worldwide variation of the prevalence of low height-
for-age is considerable, ranging from 5% to 65% among the less developed countries. In many such settings,
prevalence starts to rise at the age of about three months; the process of stunting slows down at around
three years of age, after which mean heights run parallel to the reference. Therefore, the age of the child
modifies the interpretation of the findings: for children in the age group below 2-3 years, low height-for-age
probably reflects a continuing process of “failing to grow” or “stunting”; for older children, it reflects a state of
“having failed to grow” or “being stunted”. Thus, to develop the extent of chronic malnutrition 758 children
in a randomly selected survey sample of 274 households were measured for height and age. The results
were calculated through height for age z-score. 1
Out of 758 children’s data, data analysts discounted that of 138 children due to age errors or outlier figures.
Thus, out of the total remaining 620 children of the age group 06-59 months measured for height and age, 429
children were under -3 Z- Score which is 69% of the 620 children.
1 WHO growth monitoring standards

11
TABLE 3.1: PREVALENCE OF STUNTING BASED ON HEIGHT-FOR-AGE Z-SCORES AND BY SEX (N=395)
Tab 3.1 Gender Base Prevalence of Stunting by Height- for -Age Z score (n=395)
All
n = 620
Boys
n = 332
Girls
n = 288
>-2Z Score (111)18% (50)15% (61) 21%
Prevalence of stunting
(<-2 z-score)
(509) 82%
(282) 85%
(227) 79%
Prevalence of moderate stunting
(<-2 z-score and >=-3 z-score)
(80) 13%
(38) 11%
(42) 15%
Prevalence of severe stunting
(<-3 z-score)
(429) 69%
(244) 73% (185) 64%
Staff considered that caregivers often gave rounded and estimated ages based on memory and linkage to
seasons and or moon and as such may be quite inaccurate in months and in some cases may even confuse
their children’s birth order and give years of difference especially if data was given by regularly absent fathers
or carers other than the mother This kind of estimation can lead to errors in age with subsequent anomalies
between height and age. This would however only explain an increased -3 Z score if carers overestimated age
more often than they underestimated. The trained staff took the height measurements using local calendars of
events.
WV also looked into the findings with height for age in World Vision areas for nutrition intervention, from the
pool of SAM children’s data, registered in each OTP/SFP site. Of the total 459 children with SAM in the
centres, 298 (65%) were chronically malnourished. The HFA calculation in these children is given below:
Tab 3.2. CMAM Coverage in WV interventions sites
Height for Age among SAM children in WVCMAM Intervention Sites
Sukhur/Khairpur
SAM children registered All
n = 459/ 100%
Boys
n = 181
39.4%
Girls
n = 278
60.6%
>-2 z-score 104 (22%) 39 (22%) 65 (23%)
Prevalence of stunting
( -2 z-score)
355 (77%) 142 (31%) 213(77%)
Prevalence of moderate stunting
(<-2 z-score and >=-3 z-score)
57 (12%) 15 (8%) 42 (15%)
Prevalence of severe stunting
(<-3 z-score)
298/65% of
SAM children
127/ 70% of
SAM Boys
171/61.5% of
SAM girls
The same information appears below with a little more detail from the clinics.
Tab 3.3. SAM among Children registered at WV intervention sites- Sukkur & Khairpur
Height for Age among SAM children in WV Nutrition Sites Sukkar/Khairpur including breakdown of 0,
>0< +2 SD, >+2<+3SD
Range of Z Scoring <-3 <-2 0 <2 <3 Total
Male Children (6-59 127 15 33 4 2 181

12
months)
Female Children (6-59
months) 171 42 53 6 6 278
total 298 (65%) 57 (12%) 86 (19%) 10 (2%) 8 (2%) 459
For accurately measuring stunting in children into the future considerable efforts should be made to ensure
children’s births are registered within a week and one month of delivery. This process currently involves the
issuance of a birth certificate by a health facility the taking of the birth certificate to the UC administration by a
parent with NIC and processing of birth registration with the town council. The certificate issued by the UC
allows the parent to further travel to a NADRA registration office where the child’s birth is registered on the
computerized data base and a B form is issued. Future surveys where birth registration has rigorously and
quickly occurred can use B forms and linkage to the Nadra database to accurately gauge stunting. This should
be a clear recommendation for any partner working on nutrition into the future.
3.1.2 Wasting:
Low weight-for-height: Wasting or thinness indicates in most cases a recent and severe process of weight loss,
which is often associated with acute starvation and/or severe disease. However, wasting may also be the result
of a chronic unfavorable condition. Provided there is no severe food shortage, the prevalence of wasting is
usually below 5%, even in poor countries. The Indian subcontinent, where higher prevalence are found, is an
important exception. A prevalence exceeding 5% is alarming given a parallel increase in mortality that soon
becomes apparent (2). On the severity index, prevalence between 10-14% are regarded as serious, and above
or equal 15% as critical. Typically, the prevalence of low weight-for-height shows a peak in the second year of
life.2
Out of 712 children aged 06-59 months measured weight for height, 180 (25%) found scored under healthy
growth by three standard deviations (-3 SD) which is severe malnutrition and 15% above what is considered
to be critical levels, and 111 (16%) were under healthy growth by two standard deviations (-2SD) but above -
3SD. Data analysts discarded 27 entries children entries due to enumeration errors.
Tab 3.4. Gender Wise Prevalence of Wasting (Weight-
for-height- z-scores)
All Boys Girls
n = 712 n = 362 n =
350
Prevalence of Global acute
malnutrition
(<-2 z-score)
(291)
41%
(137)
38%
(154)
44%
Prevalence of moderate acute
malnutrition
(<-2 z-score and >=-3 z-score)
(111)
16%
(45)
12%
(66)
19%
Prevalence of severe acute
malnutrition
(<-3 z-score)
(180)
25%
(92)
25%
(88)
25%
2 WHO growth monitoring standards

13
3.1.3.Acute Malnutrition: (MUAC)
Out of the 762 children in the expanded research, who were measured for WFH and HFA, also screened
through MUAC, staff recorded 69 with SAM and 122 with MAM which represents 9% SAM and 16 % MAM
respectively.
Tab 3.5 Acute Malnutrition rates through MUAC (n=762)
All Boys Girls
n = 762 n = 386 n = 368
Global Acute Malnutrition (191) 25%
(92) 24% (99) 27%
(<125 mm)
Moderate Acute
Malnutrition (122) 16% (62) 16% (60) 16%
(≥115 mm and <125 mm)
Severe Acute Malnutrition (69) 9% (30) 8% (39) 11%
(<115 mm)
3.2 Household socioeconomic Indicators
Malnutrition is closely linked with socio economic status of the family or a household. Thus to link the high
malnutrition rates with their socioeconomic status, 274 house hold were randomly selected from among a
household population of 23, 764.
The Socioeconomic indicators explored in each household included an assessment of the type of house,
material used for its construction its ownership,
3.2.1 Ownership of the house:
Ownership of the houses is a direct measure of economic status of that house hold. In the selected sample,
house ownership was further justified with number of rooms in each house hold. The survey finding was as
under:
0ut of 274 HH 218 have asked about number of rooms in their house, 56 are missing.
Tab 3.6 Living Space
Number and % homes with X rooms
# Rooms Owned Rented Living without rent Total
1 Room 58 (83%) 2 (3%) 10 (14%) 70 (100%)
2 Rooms 67 (89%) 5 (7%) 3 (4%) 75 (100%)
3 Rooms 33 (87%) 4 (11%) 1 (3%) 38 (100%)
4 Rooms 17 (89%) 1 (5%) 1 (5%) 19 (100%)
5 and more
rooms 15 (94%) 0 (0%) 1 (6%) 16 (100%)
Total 190 (87%) 12 (6%) 16 (7%)
218
(100%)

14
When staff asked the respondents about their residential status, close to a third of the HHs were in single
rooms. Of these HHs a third owned it and two thirds were rent free but in a tenant landlord relationship with
regard to house but with single room. Only 8% of the respondents had 5 rooms or more. Respondents who
only had one room but they were living without rent were (10) 14%. They were living in houses made by the
landlord and for whom they were doing farming. . There were only 13% OF respondents living in rented or
loaned premises. Large families living in one room is indicative of poverty. Using one room for living purposes
can lead to the easy spread of many communicable diseases such as TB, respiratory infections and skin
illnesses.
3.2.2. Number of rooms used for sleeping:
In Northern Sindh, it has been noticed that there are many rooms apparently available but these rooms with
three walls, with open windows, without doors etc, and they do not maintain privacy. Thus, to get an exact
idea of number of rooms with properly built for sleeping questions were drafted as number of rooms used for
sleeping. The survey findings for this question were:
Tab 3.7
218 HHs 1room 2 rooms 3 rooms 4 rooms 5 rooms
Number of
rooms in HH
33% 34% 17% 9% 7%
Again, this indicates that a great majority are prone to communicable diseases.
3.2.3 Building material use for the house:
Then for type of house and its building material, the questionnaire asked the type of material used for walls,
and roof and floor of the building. For analysis of the questions:
walls built with bricks, cement and lime were termed as paved,
un-plastered walls of bricks and walls built with durable wooden or wooden sheets were termed semi
paved.
Walls made of ordinary thin plywood, thatch and sticks, galvanized tin sheets, other materials such as
cloth sheets, disposed off tent materials etc. were classified as unpaved walls.
Similarly, staff collected details for type of material used to build roofs and analyzed responses received as:
Roof made of thatch and galvanized tin sheets were considered unpaved
roof sheets, concrete and wood roofs were called semi paved and
concrete sheet roofs, RCC and other such as wood crafted, iron beams used etc. were called paved
roofs.
For floors, this classification was based on:
cement lime, tiles and marbles as paved, wood and concrete as semi paved and
sand/mud or un leveled filling with sand as unpaved houses.
The questionnaire was not designed for land ownership of the house, however during the interviews;
respondents revealed that some households had the piece of land for residence, with no or nil property for
farming. There were also respondents with no land who constructed a house on the property of a landlord
with whom they were paid farmers.

15
Houses type details were as under:
Tab 3.8. Type of material use for house construction
Material used for building the house
Paved Semi Paved Unpaved
Wall of the house 20% 39% 41%
Roof of the house 10% 59% 31%
Floor of the house 13% 11% 76%
The data reflects that a big majority of the respondents are in unpaved houses. 76% respondents have rooms
with unpaved floor which is exposing them to dust related illnesses such as skin diseases, worms and
respiratory infections.
3.3 Type of fuel used for cooking by each house hold:
The survey questionnaire also included for type of fuel these communities used for cooking.
Tab 3.3 Type of Feul used for cooking
Fire wood Gas/ Gas
Cylinders 2 rooms
Kerosene oil Animal dung Other Fuel
Type of fuel used
for cooking
36% 3% 36% 2% 24%
The population under study was assessed for fuel they routinely used at homes for cooking and other related
purposes. The fuel source was mostly fire wood and kerosene oil. Very small proportion of the sample was
using gas cylinders and animal dung. There were some other resources such as tyres, paper waste, dry dates
leaves etc which was making 24% of the remaining fuel source. Thus for population using 36% of the fuel
source as Kerosene oil had to purchase it from the market which is another blow on their house hold income.
Burning tyres and plastic waste also introduces damaging smoke particles and toxins that may affect long and
short term health especially to those cooking or if used within a non-ventilated confined space.
3.4 Economic Status
3.4.1 Household income:
The team asked each house hold for the source of income and level of income they were generating. The
income source and level varied and were concluded on averages. Thus, average monthly income per house
hold was found to be around 9000 Pk Rs/month. The main sources of income generation was labour on daily
wedges, small business such selling children toys, collecting dates and selling them in market, cotton and wheat
harvesting as laborers etc. In some of the households visited, the respondents told that that they are getting
rupees 2000/- for wheat harvesting per hundreds of acre, rupees 300/- per 40 kgs of cotton picking, and for
dates collection during dates season they were getting more than 20,000 rupees. This way, they were making

16
some money over the year but when we correlated this income with each household size then this money is
enough to meet the average daily survival household needs without making any savings for priorities such as
health care and supporting regular education access.
3.4.2. Household Assets
The team collected Information regarding assets from the sample households. The questionnaire design had
an assets list ranging from the availability of cattles to computers. For the purpose of analysis, details of assets
in each house hold was difficult due to wide range of asset list, its type and their un equal distribution among
the communities. Thus, to get a closer picture, assets details were generalized by taking average of each
assets communities having at the time of survey
Fig 3.4.1 Household Assets
Fig .3.4.1 Household Assests
The findings were as under:
Cattles such cow, buffalos and sheep are major livestock in these communities followed by electric fans and
mobile phones. Only four computers in a sample population of 274 households is a strong indication of both
poverty and illiteracy. It is important to note that refrigeration is not common even given the high summer
heat and this may effect left over food quality/ hygiene even if protected from flies. Since, these people are
deficient in common need items so things of luxury are a dream for them. The assets details were asked to
indicate their level of poverty and its impact on their social, physical and psychological life. The above graph
also indicates the assets distribution was unequal. For example in 231 houses, there were 642 cattle but in the
remaining 43 houses there was not a single cow. Similarly, details for other assets with reference to the
household are mentioned above.
Cat
tle
s,…
Ho
rses
an
d…
Bic
ycle
Mo
torc
ycle
s
Car
s/Ta
xi…
Oth
er V
ehic
les
Tele
visi
on
VC
R/V
CP
/DV
D
Lan
d L
ine
…
Mo
bile
ph
on
es
Sofa
set
s
Sew
ing…
Was
hin
g…
Mic
row
ave…
Re
frig
erat
or
Gey
sers
Elec
tric
fan
s
Air
…
Co
mp
ute
r
231 56 85 71 3 8 95 14 3 176 14 82 68 0
21 3 210
4 4
642 77 88 75 4 13 102 15 3 234 18 87 70
0
22 3 533
4 4
Assests Detail
Count Sum

17
3.5. Water, Sanitation & Hygiene Practices
Availability of clean drinking water, sanitation and good hygiene practices have direct impact on the health of
the people. Positive practices and safe access to the three of them contribute to good health and nutrition.
3.5.1 Source of drinking water for households:
When the respondents were asked for their source of drinking water, 77% of them mentioned access to bore
water in the courtyard of their house, and below 10% of the respondents were using other sources such as
public/piped water, tube well protected/unprotected dug wells, natural water reservoirs, irrigational channels
etc. The bore water was considered safe from physical contamination however, the same water was not
tested for its chemical quality. Given that flood levels may have affected the depth at which safe
uncontaminated water can be obtained the safety of bore water needs to be tested as well as for chemical
contaminants such as fluoride and arsenic.
Fig 3.5.1 Sources of Drinking Water
Bore water is the source of drinking water for most of the respondents. Primary health care data also
presents a case of higher rates of ARI as compared to diarrhea however further analysis needs to be done to
ascertain whether rates of diarrhea are lower in comparison to population size and other areas of Pakistan.
3.5.2 Measures to make drinking water safe:
Though, most of the respondent declared bore water suitable for drinking purposes but community was asked
for their opinion on treatment of water.
Tab 3.5.1 Frequency of Water Treatment
Always often sometimes never
Treatment of water for
making it safe to drink
33% 1% 12% 54%
0%10%20%30%40%50%60%70%80%
77%
6% 5% 5% 1% 1% 0% 0% 1% 1% 1% 1% 1%
Water sources
18
Around 33% of respondents were treating water via boiling, adding chlorine and by keeping it in sun but the
majority of them never tried any method for making water safer for drinking purposes.
3.5.3. Water for cooking and other purposes:
The team asked the respondents about the water they used for cooking and other household purposes. The
survey results showed that nearly the same numbers as above are using the same water source for cooking
and other household purposes. Though, most of these sources are within the compound of houses, on
average it takes 2-13 minutes for women to fetch water. Women are solely responsible for fetching water and
for storing it. The survey findings were as under:
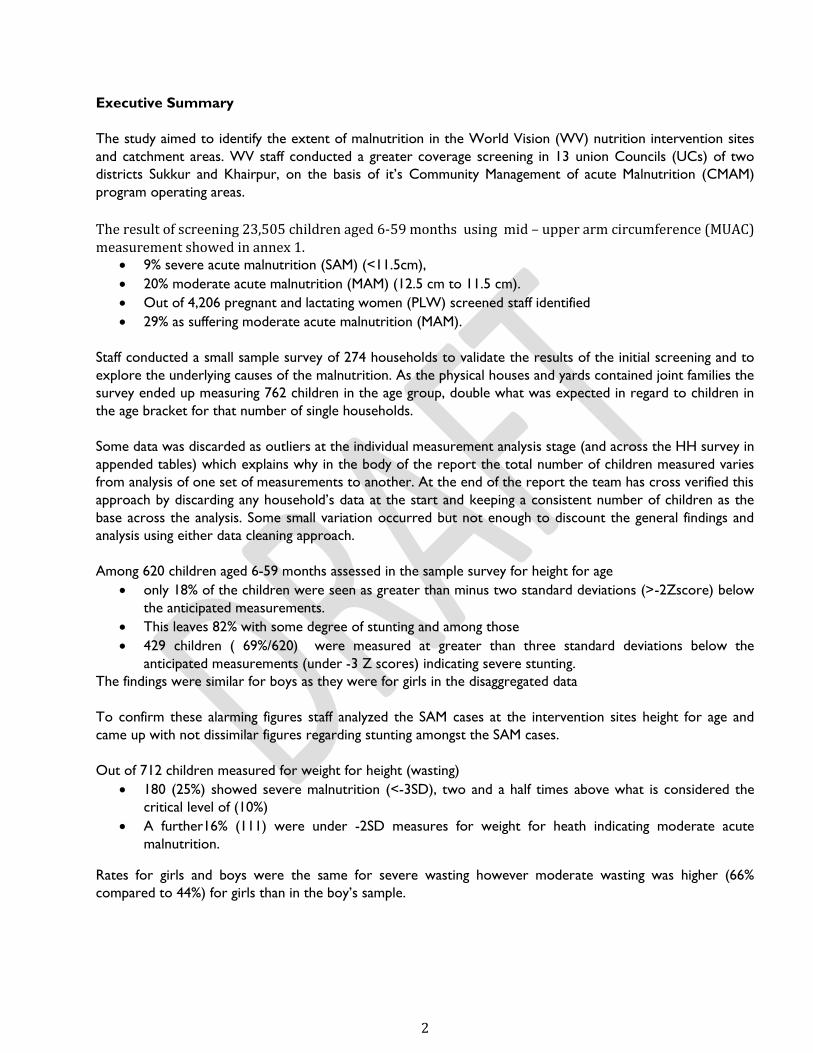
Fig 3.5.2 Sources of HH water3.5.4 Hygiene Practices:
A proper functioning toilet system is a good socioeconomic indicator on one hand and can be an indicator of
better hygiene practices. In this connection, when respondents were asked which toilet facility they are using,
the responses were as under:
Fig 3.5.3 Types of latrines
Only 27% have a flush toilet system. Twenty- nine percent of respondents defecate outside in the fields. This
indicates that the community is either not affording to build latrines or considering a latrine system a low
priority.
It is important to note the 61 % of the respondents were using shared toilet systems. One facility for two to
three families living together:
27%
6% 11%
20%
29%
6% 1%
0%5%
10%15%20%25%30%35%
PourFlash
pipedsewersystem
SepticTank
Pit Litrine Elsewhere
NoFacility
Other
Litrine Practices

19
Fig 3.5.4 Shared Toilets
Inquiries on proper hygiene practices were also included hand washing practices. The survey results are as
under:
Tab 3.5.2 Hand Washing Practices
Hand Washing Yes No Missing
answer
Wash hands with water after using toilet 82% 4% 14%
Wash hands with water before meals 76% 5% 19%
Wash hands with water and soap 57% 12% 31%
More than 80% of the total respondents reported washing hands with soap. During the visit, it was noticed
that they kept soap in a pot for routine use purposes. The same soap they were using for handing washing,
washings clothes and other house hold utensils. 76% of total respondents wash hands before meals and 57%
wash hands with soap. The question may have been leading and this should be revalidated before drawing any
conclusions.3.6 Food Intake Patterns
3.6.1Food intake frequency in Women of Reproductive Age:
In order to justify a correlation between poor dietary intake and malnutrition, total 274 women of
reproductive age that is between 15-45 years old were interviewed for their daily food consumption patterns
and frequency. Pregnant and lactating women were also part of this interview. Frequency of routine meals
from morning till late night was asked from these women. Out of total 274 women targeted for the interview,
data was incomplete for 18 women which is considered missing in the report. Although comparatively a bigger
number of respondents falls under three times (72 women, 26%) and four times (76 women, 28%) meals
frequency category followed by a small group having food five times (28 women, 10%) a day. 8% of the
respondents are takings meals less than two times and less than 10% are taking meals more than six times a
day. This frequency in food intake was further compared with type of food they were consuming on a daily
basis.
Yes 61%
No 39%
Share Toilet Facility with Other HH

20
Fig 3.6.1 Daily Food Intake
3.6.2 Daily food composition:
Whether he food these reproductive age women are taking during a day is nutritious or not is another area
of concern. To investigate this, the questionnaire designed included the name of common food people take in
these areas. From 274 women interviewed for this question, it was revealed that the majority of their routine
food is comprised of tea, tea with bakery, tea with roti, rice, vegetables and rice and milk. Yes, some also
mentioned rice with pulses in their routine food. Food types and timings of intake were defined here as
before breakfast, breakfast, brunch or before lunch, lunch, super or before dinner and dinner. The survey
results were:
Fig 3.6.2 a Fig 3.6.2 b
137 women of reproductive age had never taken anything before breakfast. Some women had tea with bakery
or only tea at this time. In breakfast, out of the total respondents interviewed, 78 take nothing in breakfast
whereas, the rest take tea with bread, tea with bakery, vegetable, rice and lassi is less nutritious and deficient
in proteins.
Fig 3.6.2 c
8 14
72 76
50
28
8
18
3% 5%
26% 28%
18% 10%
3% 7%
One Times Two Times Three Times Four Times Five Times Six Times Seven Times Missing
Daily food intake pattenrs amongs WRA
Egg
Juic
e/Fr
uit
Milk
No
t Ta
ken
Ric
e
Tea
Tea
wit
h B
ake
ry,…
Tea
Wit
h R
oti
Ve
geta
ble
s
Yugu
rt/L
assi
(bla
nk)
1 1 6
137
2
57 60
5 1 4
Before breakfast-WRA
Bu
tter
Egg
Juic
e/Fr
uit
Milk
No
t Ta
ken
Pu
lses
+Ru
ti
Ric
e
Ro
ti
Tea
Tea
wit
h…
Tea
wit
h R
oti
Ve
geta
bal
es
Yugu
rt/L
assi
(bla
nk)
6 6 1 1
78
2 2 9
22
62
21 35 29
Morining Adults
Total

21
Fig 3.6.2 d
When questions were asked from women of reproductive age group for any habit of taken food before lunch,
214 said they don’t take brunch. Likewise breakfast, food taken before lunch and during lunch was comprised
mainly of pulses and vegetables. More than 60 % of the respondents were taking pulses and vegetables. Though
pulses are rich in proteins they contain fewer proteins and less iron compared to meat which contains
multiple proteins and red meat is a rich source of iron.
Fig 3.6.2 e Type of Food in the Afternoon
2 1 1 8 1 2 9
214
1 2 12 3 9 9
Brunch Adults
4 8
54
18 9 2 28
8 2
141
Lunch Adults

22
Fig 3.6.2 f Type of Food-Dinner
In the afternoon) , the only food is tea however, the majority are not taking anything. At dinner, again rice and
pulses is the major food and as mentioned earlier this food is rich in carbohydrates and proteins. Low and
nutritionally inadequate diet appears to be a contributing reason for wasting in the majority of the population.
Fig 3.6.2 g Type of Food after Dinner
At supper, out of the total 274 women of reproductive age, only 82 women were taking milk and the rest
nothing. Women of reproductive age need highly nutritious food, food rich in proteins and carbohydrates.
Their food requirement increases further during pregnancy and during lactation.
0
50
100
150
200
Afternoon food
020406080
Dinner Adults
Milk Milk+ Tea Not Taken Tea (blank)
82 1
188
3
After Dinner Adults
Total

23
The overall daily food intake patterns are such that, some women are taking nothing before breakfast but they
do breakfast and some prefer to take lunch and nothing as brunch, nothing in super and taking food in dinner
but there are women who take all the meals of the day and there are women who prefer very few meals .
3.6.3 Food intake frequency in children of age group 06-59 months
The same group of 274 women was asked about the diet they are presenting to their children at home. Focus
of study for children diet was age group between 06-59 months. The frequency of meals taken or given to
these children by their mothers was different from their own diet. This response was highlighting the cultural
approach of men first and children next for meals with women in the last queue.
Fig 3.6.3 Frequency of Food Intake
3.6.3, a Children daily diet composition:
Contrary to the dietary composition of women of reproductive age, the major diet for children was breast
milk followed by fresh milk available at home. Tea, tea and bread (roti), rice, egg plus bread making a small
portion of these children diet.
Fig 3.6.3.2 a, b, c& d
9
17
32
48
38 38
48 44
3% 6%
12% 18%
14% 14% 18% 16%
One Times Two Times Three Times Four Times Five Times Six Times Seven Times Missing
Children (6-59 months) 24 Hour Diet frequency
11
62
1
40
2
97
1 18
38 1 3
Before Morning Child

24
The majority of the children who are eating in meals are breastfed but it is important to mention here that
breast feeding duration in the community is not more than two years. This also indicates that the majority of
the older children in the community are not taking adequate diet. The breakfast of only around 50 children is
comprised of breast milk, other milk like formula milk, cow milk and a small number of children (21) are taking
rice only. This indicates that their food is largely deficient in proteins and carbohydrates and vitamins and
minerals other than those found in the breast milk
39 1 3 5
26
107
3 19 3 1 8 47
1 10 1
Morning Child
11 49
2 12 2 34
151
1 2 1 9
Brunch Child 06-59 months
Bis
cuit
s
Bis
cuit
s+R
oti
Bre
ast
Feed
ing
Ce
rela
c
Fru
its
Kh
ich
ri
milk
Milk
+B
iscu
its
No
t Ta
ken
po
rrid
ge
Ric
e
Ric
e+M
ilk
Ric
e+P
ulo
ses
Ric
e+So
ji
Ric
e+V
eget
abl…
Ric
e+Yo
uga
rt
Ro
ti
Ro
ti+
Pu
lse
s
Ro
ti+
You
gart
Ve
geta
ble
+Ro
ti
(bla
nk)
3 2
48
4 1 12 20
2
84
2 21
4 5 2 7 3 8 3 2
41
Lunch Child 06-59 months

25
Fig 3.6.3.2 e & f
Most of the children under two years are breastfed however, there are children who get some other food
such as biscuits, top up milk, and a variety of other less nutritious food. less nutritiouss food comprised mainly
of cookies, rice and biscuits,. Many are taking less food or taking less nutritious food. The Same is the case at
dinner where most of the children are on either breast milk, cow milk, or rice and vegetables. Some of the
respondents also mentioned rice with churned milk, bread with mangoes as a portion of their dinner
Fig 3.6.3.2 g
After dinner breast milk was the only type of food for 46 children and milk (cow milk/formula milk) for 43
children and this indicated that the rest were mostly taking nothing.
It is recommended that children of a young age should eat more frequently. It is therefore quite alarming to
see numbers of children i.e. 21% of those 274 surveyed eating only 1-3 times a day. Contrary to the dietary
6 15 3 50
1 7 26
156
1 2 6 1
Afternoon B
aby
Foo
d
Bre
ast…
Ce
rela
c
Ch
icke
n
Ch
ike
n R
ice
Fish
,Daa
l,Po
…
Ke
chri
Milk
Milk
Su
ji…
No
t Ta
ken
Ric
e
Ric
e P
uls
es
Ric
e+Fi
sh
Ric
e+Fr
uit
Ric
e+M
ilk
Ric
e+Su
gar
Ric
e+V
eget
a…
RO
TI
Ro
ti+
Man
go
Ro
ti+
Milk
Ve
geta
ble
s
Ve
geta
ble
s+…
Yugu
rt
(bla
nk)
1
39
2 1 2 1 5
32
1
76
40
19 1 5
27
1 3 3 1 4 1 8 1
Dinner
BreastFeeding
Cerelac Halwa Juice Milk NotTaken
Roti Tea (blank)
46 7 1 2
43
171
3 1
After Dinner Child
Total

26
composition of women of reproductive age, the major diet for children was breast milk 31%, followed by fresh
milk 21% available at home. Tea 3%, tea and bakery 8%, rice 6%, vegetable and roti 6& is also making a small
portion of these children’s diet.
When checked against all meals there were around 50% children aged 6-59 months who only had meals
consisting of fresh milk and tea, tea with bakery, rice, bread, rice, bakery, which is of limited nutritional value
on its own. Similarly although exclusive breastfeeding ends at 6 months there were 52% children in this age
group surviving mostly on milk or breast milk, which suggests protracted exclusive breastfeeding which does
not meet the needs of children and places a strain on mothers. Though it is understandable if there is a
scarcity of food and or breast feeding is being understood to provide contraceptive powers if exclusive.
Exclusive breast is a natural contraception but only if it is exclusive. In the communities we interviewed for
breastfeeding, it was revealed that breastfeeding patterns are not appropriate and not regular thus exposing
lactating mothers for further pregnancies.
3.7 Breast feeding practices:Breastmilk is the natural first food for babies, provides all the energy and
nutrients that the infant needs for the first months of life, and it continues to provide up to half or more of a child’s nutritional needs during the second half of the first year, and up to one-third during the second year of life. Breast milk promotes sensory and cognitive development, and protects the infant against infectious and chronic diseases.
Mothers were asked if they ever breast fed their children, 96% said yes and 4% said no and the reasons for not
ever breastfeeding their children were mentioned as mother was sick, or the child was sick. There were some
cultural reasons and some mothers didn’t mention why they didn’t breastfeed.
3.7.a Colostrum or thick milk given at birth:
Colostrum is the first milk which has tremendous nutritional value and enhancing immunity against infections
in children. But it also is helpful in speeding up uterine contractions after delivery and is thus a natural bleeding
control mechanism. This initial contact also helps the psychological satisfaction of the mother and bonding
between mother and child.
When mothers were interviewed regarding colostrum feeding at birth, 77% mothers said yes, 12% said no and
the remaining 11% were unaware of colostrum. Of the women, who did not breast fed their children with
colostrum, the reasons mentioned were: mother was sick, child was unable to suck, colostrum is harmful to
the child and cultural obligations etc.
Tab 3.7.1
Yes No Do not Know
Thick Milk (colostrum) given to child immediately
after birth
77% 12% 11%
3.7.b Exclusive breast feeding:
Exclusive breastfeeding in children up to age six months reduces infant mortality due to common childhood
illnesses such as diarrhea or pneumonia, and helps for a quicker recovery during illness. Exclusive breast
feeding also is helpful for mothers to protect them from illnesses such as ovarian cancers, breast cancer and
increase family resources.

27
Tab 3.7.2
Less than
six months
6-12
months
12 months or
more
Never did
exclusively BF
Age until mothers breast feed
their children exclusively
38% 27% 19% 15%
Similarly, for their length of time giving exclusive breast feeding, women respondents came up with different
answers as majority (38%) said less than six months followed by six to twelve months which is 27%. 15% said
they never exclusively breast fed their children. The respondents who were not breast feeding their child
exclusively up to six months of age gave the reasons as mother’s sickness, child illness, breast milk is harmful
and cultural issues.
As mentioned earlier, good infant and young child feeding practices contributes to reduced infant morbidity &
mortality .The survey results are indicative of poor breast feeding practices, protracted cow milk diet and
ultimate leading to more illnesses and deaths of children less than five years.
3.7.c Complementary feeding practices:
The transition from exclusive breastfeeding to family foods – referred to as complementary feeding – typically
covers the period from 6–24 months of age. This is a critical period of growth during which nutrient
deficiencies and illnesses contribute globally to higher rates of under nutrition among children under five years
of age. In this part of Sindh, complementary feeding practices and food used by children were not encouraging
for proper nutrition of the child
Fig 3.7.1 Complementary Feeding Practices
The above graph indicates that there is no proper selection of food to be used as complementary food for
children after age of six months. There are three possible reasons behind this. I) Mothers are not considering
complementary food as an essential substitute for child health considering it a least priority ii) Mother do not
have information regarding complementary feeding practices iii) scarcity of food and de-prioritization of
children’s food needs

28
3.7.d Top up milk practices other than breast feeding
Fig 3.7.2
It is a routine practice that mothers in these communities always feeding their babies under six months with
other top up milk. And the top up milk includes infant formula milk, fresh milk (goat/cow milk), powdered milk
and tetra pack milk. Response to this question was quite surprising as most of the mothers (76%) were giving
fresh milk as substitute of breast milk. Children under six months are usually not tolerant of cow’s milk. It was
not asked from the respondents whether they did dilute the cow’s milk, and if they did whether it was for
easier digestion or other reasons. If the milk was undiluted it may be a contributing factor to higher
malnutrition rates. If diluted with unclean water then the resultant illness may be a contributing factor to
higher malnutrition rates.
Tab 3.7.3 Top up milk
Infant formula Fresh milk Powdered milk Tetra pack
Type of top up milk
given to the child
9% 76% 4% 11%
Fig 3.7.3
26% 22%
0% 1% 2% 1%
15%
2% 4%
26%
Complementary feeding practices
Infant Formula Poweder Milk Fresh Milk Tetra Pack
9% 4%
76%
11%
Breast milk substitutes /Top up milk

29
3.7.e Introduction of Top up Milk- Age of child:
This question ascertains when top up milk or breast milk substitutes were introduced. The results were
alarming as many ( 42%) of the mothers introduced top up milk under six months of age, when the child
needs to be exclusively breastfed.
Tab 3.7.4 Age when top up milk introduced
0-6 month 6-12 months More than
13months
Do not know
Age of child when top
up milk was introduced
42% 22% 2% 34%
3.7.f. Age of the child when other foods and liquids were introduced
The survey respondents were also asked for age of their child when they introduced liquids such as tea, juices
and soup. 39% started other liquids when their children were below age six months and some started after
seven months. Some of the respondents said they do not remember or do know when they started. The same
groups of respondent were asked for semi solid food for their children. 36% had started semisolid food when
their children were under six months. 30% of the respondent did not respond with the exact time when their
children started semi solid food.
The mothers were also asked who advised them when to start complementary food for their children.
Around 60% responded that either mothers or mother-in laws suggested them to start the food. However,
14% of the respondents used their own experience for starting liquids and semi-solid food for their children.
0-6Months
7-12Months
13 ormore
Do notKnow
39% 33%
0%
36%
Liquids Introduced
0-6Months
7-12Months
13 ormore
Do notKnow
36% 33%
1%
30%
Solid food introduction

30
When mothers were asked, if they prepared complementary food of their children separately or in
combination with other family food, the responses received were:
always sometimes When time
permits
never N/A
Complementary food
prepared separately
16% 30% 12% 35% 7%
3. RERPODUCTIVE HEALTH ISSUES
As many nutrition-deficiency illnesses starts during pregnancy and early childhood, women are the key to
preventing future malnourished generations. Different nutritional challenges such as low birth weight, stunted
growth and micro-nutrient deficiencies among children began during pregnancy and neonatal periods. Thus, to
improve nutritional status of the children, actions should start through mothers. Men need to be aware of the
need for and supportive of providing pregnant and lactating women and women of reproductive age and
children adequate diet as well as birth spacing, antenatal and post natal care health seeking, safe delivery,
For assessing the link between malnutrition and reproductive health, women of reproductive age groups were
interviewed. One women of reproductive age group in each household were interviewed for survey study and
for anthropometric measurement. These women were asked for number of pregnancies, miscarriages, live
births, still births, current pregnancy and currently alive children.
4.1Number of pregnancies
In 274 randomly selected HHs, 225 were women who had been pregnant up at least once till the time of
interview. Out of these 225 women respondents, 36% of the women have gone through one to three
pregnancies. 37% became pregnant for four to six times. 20% women respondents became pregnant more
than seven times. And 7% said they got pregnant for more than 7 times.
Mother 40%
Mother in Law 20%
Relative 3%
Neighbour 5%
Own experience
14%
Doctor 5%
LHW 8%
TV/Radio 0%
Other 2%
Not applicable (baby is being breast feed)
3%
Advise for Complementary food

31
Fig 4.1
These pregnancy events ended with miscarriages, live births, still births. Therefore, all the women
respondents were asked for outcome of the pregnancy. 85% of the pregnancies ended in live births, 5%
miscarriages, 2 % still births and 8% were current pregnancies.
Tab 4.1 Pregnancy outcomes by # women
Women’s experience of different pregnancy outcomes
frequency of
pregnancy
outcome Miscarriages Still Birth Live Birth
Currently
Pregnant
1 8 8 9 15
2 7 4 18
3 4 21
4 2 6
5 & more 2 30
Total 23 12 84 15
Tab 4.1a Pregnancy outcome (all)
# of different pregnancy outcomes reported from 273 pregnancies
Miscarriages Still Birth Live Birth Currently Pregnant
Total (273) 52 16 190 15
%age ( 100) 19% 6% 70% 5%
i) Fig 4.2 Pregnancy Outcome
4.2 Disease breakdown among women of reproductive age group:
Morbidities or illness history taken from women in 274 households reflected single or multiple complaints for
illnesses mentioned in the pie chart below. These are very common complaints, rural usually women have
Around 21% of women respondents were complaining of weakness they were feeling. Feeling of weakness is
one among the major signs of under nutrition. It is a chief complaint for iron deficiency anemia. And when
1-3 preg 4-6 preg 7-9 preg Preg 10 0rmore
36% 37%
20%
7%
Number of pregnancies

32
weakness associated with headache (11% of respondents) then it becomes hall mark of malnutrition. Other
major illnesses found were fever (11%), cough (9%) and flu (7%). Diarrhea was only 3%. This pie chart below is
indicating that majority have problems associated with under nutrition. Communicable disease are existing but
nominal compared to other illnesses.
Fig 4.3 Morbidity among WRA
4.2 .1 Worms Infestation:
Worms infestation is very common in rural women which causes malnutrition including micro nutrient
deficiencies. Women were asked for diagnosis of worms and any de-worming medicines taken in the last one
year. Sixteen %of the women responded yes they had worms where as 42% were unaware as to whether they
had worm infestations. On the other hand, 21% women said yes they had taken medicines for worm
infestations and 44 % said they had not taken or did not know if they had taken medicines.
Tab 4.2
Worms Infestation Yes No Not
remember
Worm infestation diagnosis in last one year 16% 42% 42%
De-worming medicines taken in last one year 21% 36% 44%
4.2.2 History of hospitalization
Tab 4.3
History of hospitalization Yes No Not
remember
Any history of hospitalization in last one year 18% 43% 39%
Flu 7%
Fever 11%
cough 9%
difficulty in breathing
3% Diarrhea/dysentry
3% Vomiting
6% Abdominal pain
6%
constipation 4%
Skin Rash/Boils 2%
Difficulty at michturation
2%
Hypertension 6%
Headaches 11%
Weakness 21%
Other 0%
none 9%
morbidity pattern among women of reproductive age group

33
18% of the women respondents had a recent history of hospitalization
The number of pregnancies with proportionality high still birth and miscarriages rates, weakness and head
ache complaints and history of hospitalization indicate that the women in these communities are spending
resources for seeking good health ( not clear if the health seeking is timely) but with poor outcomes.
Malnutrition is responsible for illnesses and illness can worsen malnutrition thus making a vicious cycle that
prevents good health.
4.3. Morbidity patterns among Children 6-59 months of Age For understanding regarding the health
problems in children, the interview questionnaire was developed to explore common medical illnesses
patterns in children under five. Morbidity patterns in children under five years were analyzed by asking women
respondents about the illness history of their children. The questions were asked in laymans colloquial
language. Respondents were asked to tell us symptoms and not necessarily the exact illness or name of illness.
Based on this, 23% of the respondents said that their children fever and 15% said flu. This was a reflection on
the community’s understanding of illnesses and there may be several underlying causes of flu symptoms or
fever. The number of children who had a history of illness at the time of visit and over the two weeks prior
to the visit was as follows
At the time of visit, 54 children had a history of cough for the last two weeks, 34 children had cough with
difficulty breathing and 26 had cough only. There were 34 children with history of diarrhea at the time of visit
and over the last two weeks before visit. BHU data in the same areas consistently shows ARI at
proportionately higher rates then diarrhea throughout the calendar year, though the reported high prevalence
can also be related to the season.
4.3.1Worms infestation in children:
Worms infestation is very common in rural children due to bad hygienic conditions and this produces
nutritional deficiencies and anemia. Women respondent in the survey sample were asked for worm
infestation of their children. The questions designed to get some verbal details on current worm infestation,
over the last six month and history of taking medicines. The results were such that, 25% had worms over the
Flu 15%
Fever 23%
Dysentry 5%
Vomiting 4%
Constipation 4%
Skin rash/ boils 6%
Difficult micturation
2%
Abdominal pain 11%
Other 0%
None 30%
Morbidity patterns among children

34
last six months and 41% said they didn’t know about worms infestation whereas 28% reported giving
medicines for worms infestation and again 41% said they didn’t know if they had taken medicines. For current
worms infestation, 20% said yes their children had the problem whereas 41 said they did not know. For clear
and confirmatory diagnosis of worm infestation, one requires stool and blood sample investigation but this was
not done in this study. Verbal inquiries were made and based on that data collected was analyzed.
Tab 5.3.1 Worm Infestation in children
Worm infestation status and treatment # women
(170)
Women’s responses about their
children
Yes No Do not know
Worms infestation diagnosed in last six months 63 16 21 26
Taking medicines for worm infestation 61 17 19 25
Currently having worms infestation 46 9 18 19
Fig 4.3.1 &2
4.3.2.Vaccination Coverage:
Vaccination history was taken for vitamin V, BCG, Oral Polio vaccine, DTP, Penta Vaccine, Hep B, and
measles. Respondents were not asked for presence of vaccination cards. For easy understanding by the
respondents the question about BCG vaccination was asked like vaccination which keeps a small scar on
shoulder, polio as drops, Penta3 in thigh and the ninth month vaccines. Collectively for all vaccinations, the
average was 68% yes respondents and 8% no along with 23% of the respondents who were unaware of the
vaccination history.
Yes No Do not know
Vaccination of the child 68% 8% 23%
3 Single vaccine for DPT, Hep B and Hib
Yes No Dnt Know
25%
34% 41%
Worm Infestation Diagnosed
28% 31%
41%
20%
39% 41%
Medicines taken for worms infestation and current history with worms infestation

35
5. Recommendations:
5.1 Policy & Program level
Initiate integrated program to focus on
Advocacy for approval of already drafted Sindh PC1 for Nutrition CMAM
Support Development of a multi-sector umbrella PC1 for an integrated program addressing
the underlying causes of malnutrition – WASH, Health including diet awareness, Livelihoods,
Food security ( access and variety), Food (micronutrients) and school health and nutrition
government capacity to recognize malnutrition (including growth monitoring), refer and treat
Introduction and training of multipurpose staff at health facility in nutrition screening every
child seeking health care at the facility through integrated Management of childhood illness
Inclusion and analysis of nutrition status as part of routine case management at facility level
Further investigate HH practices regarding WASH, dilution of fluids (ie cows milk) for
children’s diet
Including Men for awareness and support to pregnant and lactating women and women of
reproductive age and children for adequate diet as well as birth spacing, antenatal and post
natal care health seeking, safe delivery and general child wellbeing.
Effective exclusive breastfeeding 0-6 months
Complimentary feeding and proper diet for children aged 6months to two years of age
Hygiene awareness and practices
Improved young girls and women of reproductive age nutrition
Enhanced community participation in malnutrition detection and care and prevention.
Especially with regard to mothers, caregivers and decision makers ability to understand
monitor and the health of their children.
Targeted food distributions/ subsidies and liveliehood improvement program for vulnerable
families where economics and food access are the underlying causes of malnutrition. Consider
for families with pregnant and lactating mothers
Promoting linkages to social welfare support mechanisms for extremely vulnerable families
Addressing factors affecting maternal health and contributing to childhood malnutrition i.e.
high fertility rates, high levels of anemia, high incidences of miscarriages and still births and
maternal morbidity.
Explore Design and support strategies in empowering families to address social determinants
of poor health outcomes such as low socio-economic status, illiteracy and food insecurity
prevention and management of childhood illnesses, ARI, Diarrhea, malaria and vaccine
preventable diseases micronutrient intervention (Vit A, iron, folic acid, iodine) to reduce the
complications leading to mortality or increased malnutrition.
For accurately measuring stunting in children into the future considerable efforts should be
made to ensure children’s births are registered within a week and one month of delivery. This
should be a clear recommendation for any partner working on nutrition into the future.
Research rates of diarrhea/ population and in comparison to other areas in Pakistan as well as
further investigating the drinking water purity and treatment practices
Research and advocacy regarding food security access issues
Operational /Implementation level
Health facility at the community
36
Facility based outreach team and/or community based weighing of children ages 0-3years ,
interpretation of growth curve and counseling for mothers to identify causes of poor growth and
support her in remedial actions and referral to nearest health facility
Outreach visits/follow-up of specific cases referred to hospitals
Support and promote early birth registration
IMCI to include nutrition screening and treatment.
Health Hygiene and diet awarenesss BCC and IEC materials – shown and counseled at facilities and in
oput reach
Use screening at facilities for promoting inclusion of vulnerable children’s families in social welfare and
targeted assistance packages
Form male support groups for mothers and child well-being
Introduce newly wed and couples counseling regarding mother and child well being
Community /household level
Focus BCC on early and exclusive breast feeding 0-6months and continuity of breast feeding till 24
months
Addressing the underlying causes to reduce risk of anemia in pregnant women
Further research on exploring promoters/positive practices in nutrition for women and children
Improving general awareness of a healthy diet and eating practices
Improve local access to a varied diet. – promote kitchen gardens and cottage diversified income
sources including promoting women’s economic opportunities and value chain
Explore deworming and micronutrient programs
Improve food and personal hygiene practices
Investigate and improve water quality
Introduce savings schemes

0
Annex 1 Population Data from EPI sources at BHUs and greater coverage screening
Khairpur
s:no
Village UC Total population
House hold
Normal screenin
g SAM MAM
Total Screenin
g
SAM %
MAM %
GAM %
PLW Normal
Screening MAM
Total Screenin
g PLW PLW%
1 Babur kandhro
Drib Mehar shah 680 85 83 5 28 116 4.3 24 28.4 15 4 19 21
2
Wazeer khan chandio
Drib Mehar shah 790 97 73 13 30 116 11.2 26 37.1 9 8 17 47
3 Lal bux kandhro
Drib Mehar shah 1650 235 279 35 67 381 9.2 18 26.8 52 36 88 41
4 Mangn goth Drib Mehar shah 455 65 42 10 28 80 12.5 35 47.5 8 2 10 20
5 Lal din goth Drib Mehar shah 552 80 81 9 27 117 7.7 23 30.8 0 0 0 #DIV/0!
6 Mehar ujan Drib Mehar shah 350 50 36 5 15 56 8.9 27 35.7 0 0 0 #DIV/0!
7 Wadi mandhi
Drib Mehar shah 490 70 55 9 14 78 11.5 18 29.5 0 0 0 #DIV/0!
8 Arib ujan Drib Mehar shah 250 35 27 5 20 52 9.6 38 48.1 0 0 0 #DIV/0!
9 Jan mohd Drib Mehar shah 105 15 19 0 3 22 0.0 14 13.6 0 0 0 #DIV/0!
10 Paki khoye Drib Mehar shah 525 75 67 6 21 94 6.4 22 28.7 30 8 38 21
11 Gawar narajo
Drib Mehar shah 175 25 29 2 4 35 5.7 11 17.1 0 0 0 #DIV/0!
12 Ashal narajo Drib Mehar shah 154 22 23 0 5 28 0.0 18 17.9 0 7 7 100
13 Kamaro Drib Mehar 112 16 28 5 9 42 11.9 21 33.3 5 1 6 17

1
s:no
Village UC Total population
House hold
Normal screenin
g SAM MAM
Total Screenin
g
SAM %
MAM %
GAM %
PLW Normal
Screening MAM
Total Screenin
g PLW PLW%
ujan shah
14 Mahmood Narajo
Drib Mehar shah 140 20 34 2 10 46 4.3 22 26.1 7 4 11 36
15
Ghoth Hafaz Alah bux ujan
Drib Mehar shah 105 15 25 3 8 36 8.3 22 30.6 0 0 0 #DIV/0!
16 Wahid bux manghar
Drib Mehar shah 450 60 93 7 29 129 5.4 22 27.9 14 7 21 33
17 Arbab chana
Drib Mehar shah 500 66 47 10 25 82 12.2 30 42.7 9 9 18 50
18 Kabeer narajo
Drib Mehar shah 490 70 63 6 11 80 7.5 14 21.3 7 6 13 46
19 Gh goth Drib Mehar shah 950 136 205 20 63 288 6.9 22 28.8 2 0 2 0
20 Jam Goth Hadal Shah 150 21 29 2 8 39 5.1 21 25.6 0 0 0 #DIV/0!
21 Ashraf Pahor Hadal Shah 150 22 34 3 8 45 6.7 18 24.4 8 2 10 20
22 Khadim Ujjan Hadal Shah 50 7 11 1 3 15 6.7 20 26.7 5 3 8 38
23 M.Bux Ujjan Hadal Shah 100 13 24 5 7 36 13.9 19 33.3 10 5 15 33
24 Soomar Kalhoro Hadal Shah 60 9 17 0 3 20 0.0 15 15.0 15 2 17 12
25 M.Panah Shumro Hadal Shah 80 10 16 3 11 30 10.0 37 46.7 0 2 2 100
26 KT.Mir Muhammad Hadal Shah 850 40 133 12 54 199 6.0 27 33.2 45 24 69 35
27 M.Yousif Ujjan Hadal Shah 77 25 16 5 10 31 16.1 32 48.4 2 2 4 50
28 Abdul Khan Hadal Shah 325 24 29 3 10 42 7.1 24 31.0 5 2 7 29

2
s:no
Village UC Total population
House hold
Normal screenin
g SAM MAM
Total Screenin
g
SAM %
MAM %
GAM %
PLW Normal
Screening MAM
Total Screenin
g PLW PLW%
29 Haji jam goth 2 Hadal Shah 250 35 25 1 14 40 2.5 35 37.5 0 6 6 100
30 Kabul Narejo Hadal Shah 245 35 44 2 10 56 3.6 18 21.4 5 4 9 44
31 Rukan Shaikh Hadal Shah 370 50 41 7 26 74 9.5 35 44.6 8 15 23 65
32 Haji jam got Hadal Shah 150 21 25 2 5 32 6.3 16 21.9 1 3 4 75
33 Hayat Khan Ujan Hadal Shah 900 40 39 3 15 57 5.3 26 31.6 10 6 16 38
34 G.Ali Shah Hadal Shah 400 60 56 4 20 80 5.0 25 30.0 35 5 40 13
35 Waliyo shakh Hadal Shah 600 80 61 9 36 106 8.5 34 42.5 14 3 17 18
36 Fatahullah Goth Hadal Shah 200 25 48 1 4 53 1.9 8 9.4 8 2 10 20
37 Jeeand joinjo Hadal Shah 600 80 98 3 25 126 2.4 20 22.2 18 5 23 22
38 Gul Hassan Mangrenjo Hadal Shah 1200 250 90 14 31 135 10.4 23 33.3 9 2 11 18
39 Qadam Machi Hadal Shah 400 25 77 6 18 101 5.9 18 23.8 14 8 22 36
40 Barade khan jatoi Hadal Shah 300 15 107 22 26 155 14.2 17 31.0 5 1 6 17
41 Sanjan goth Hadal Shah 300 25 49 1 4 54 1.9 7 9.3 26 0 26 0
42 Jabar Shaikh Hadal Shah 1500 200 63 4 12 79 5.1 15 20.3 0 0 0 #DIV/0!
43 Moor jabar shaikh Hadal Shah 1500 250 10 0 1 11 0.0 9 9.1 46 0 46 0
44 Fazall faqer Hadal Shah 300 35 98 2 5 105 1.9 5 6.7 0 0 0 #DIV/0!
45 Jabar Shaikh Hadal Shah 1500 200 241 4 15 260 1.5 6 7.3 0 0 0 #DIV/0!
46 Fazall faqer Hadal Shah 500 25 28 1 2 31 3.2 6 9.7 11 4 15 27
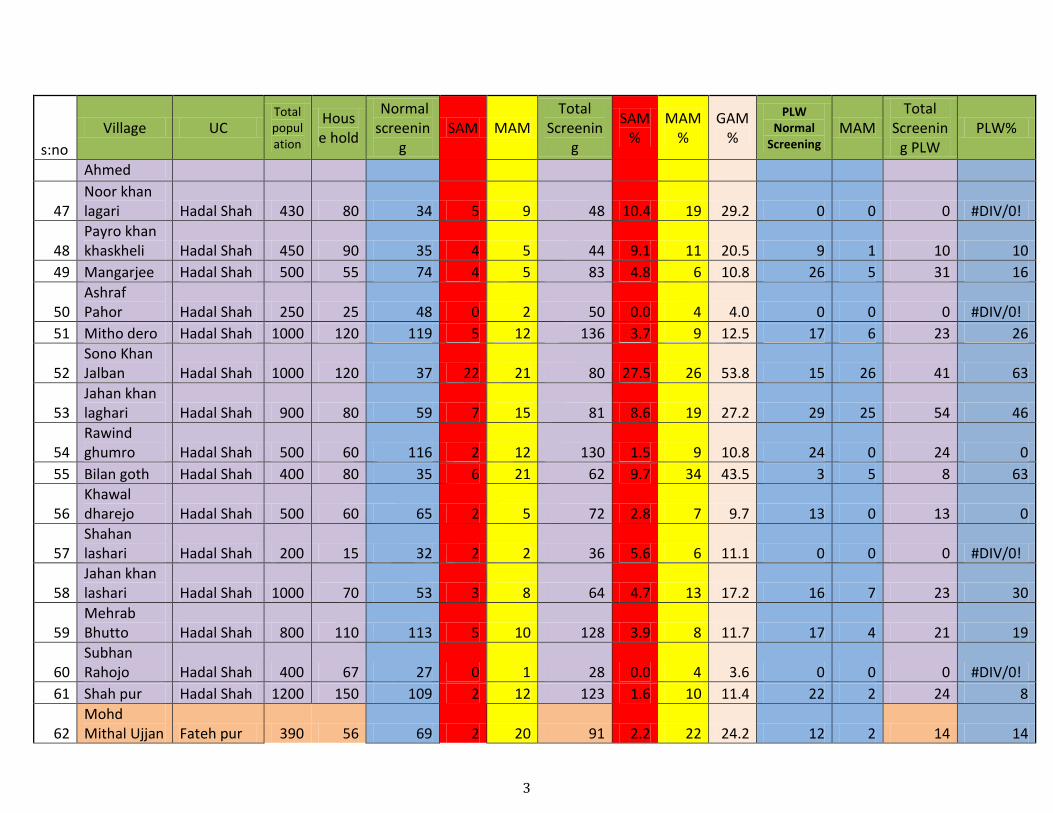
3
s:no
Village UC Total population
House hold
Normal screenin
g SAM MAM
Total Screenin
g
SAM %
MAM %
GAM %
PLW Normal
Screening MAM
Total Screenin
g PLW PLW%
Ahmed
47 Noor khan lagari Hadal Shah 430 80 34 5 9 48 10.4 19 29.2 0 0 0 #DIV/0!
48 Payro khan khaskheli Hadal Shah 450 90 35 4 5 44 9.1 11 20.5 9 1 10 10
49 Mangarjee Hadal Shah 500 55 74 4 5 83 4.8 6 10.8 26 5 31 16
50 Ashraf Pahor Hadal Shah 250 25 48 0 2 50 0.0 4 4.0 0 0 0 #DIV/0!
51 Mitho dero Hadal Shah 1000 120 119 5 12 136 3.7 9 12.5 17 6 23 26
52 Sono Khan Jalban Hadal Shah 1000 120 37 22 21 80 27.5 26 53.8 15 26 41 63
53 Jahan khan laghari Hadal Shah 900 80 59 7 15 81 8.6 19 27.2 29 25 54 46
54 Rawind ghumro Hadal Shah 500 60 116 2 12 130 1.5 9 10.8 24 0 24 0
55 Bilan goth Hadal Shah 400 80 35 6 21 62 9.7 34 43.5 3 5 8 63
56 Khawal dharejo Hadal Shah 500 60 65 2 5 72 2.8 7 9.7 13 0 13 0
57 Shahan lashari Hadal Shah 200 15 32 2 2 36 5.6 6 11.1 0 0 0 #DIV/0!
58 Jahan khan lashari Hadal Shah 1000 70 53 3 8 64 4.7 13 17.2 16 7 23 30
59 Mehrab Bhutto Hadal Shah 800 110 113 5 10 128 3.9 8 11.7 17 4 21 19
60 Subhan Rahojo Hadal Shah 400 67 27 0 1 28 0.0 4 3.6 0 0 0 #DIV/0!
61 Shah pur Hadal Shah 1200 150 109 2 12 123 1.6 10 11.4 22 2 24 8
62 Mohd Mithal Ujjan Fateh pur 390 56 69 2 20 91 2.2 22 24.2 12 2 14 14

4
s:no
Village UC Total population
House hold
Normal screenin
g SAM MAM
Total Screenin
g
SAM %
MAM %
GAM %
PLW Normal
Screening MAM
Total Screenin
g PLW PLW%
63 Chodao Fateh pur 1500 215 148 24 56 228 10.5 25 35.1 13 3 16 19
64 Gh Hussain gopang Fateh pur 800 114 65 12 38 115 10.4 33 43.5 6 1 7 14
65 Sono gopang Fateh pur 1300 186 83 8 27 118 6.8 23 29.7 9 2 11 18
66 Buksho soomro Fateh pur 800 115 88 12 54 154 7.8 35 42.9 15 7 22 32
67 Ismaial Tawri Fateh pur 210 30 26 10 14 50 20.0 28 48.0 1 2 3 67
68 sanwal waro tawri Fateh pur 426 60 53 7 21 81 8.6 26 34.6 12 3 15 20
69 Giyo shabni Fateh pur 385 55 45 18 13 76 23.7 17 40.8 5 3 8 38
70 Fathy pur Fateh pur 500 70 86 1 13 100 1.0 13 14.0 19 3 22 14
71 Abdul ghafar Fateh pur 400 60 69 5 22 96 5.2 23 28.1 9 2 11 18
72 Jamal uddin khaskhaly Fateh pur 200 28 28 1 14 43 2.3 33 34.9 5 4 9 44
73
M Ibhraheem soomro Fateh pur 1120 160 89 9 51 149 6.0 34 40.3 12 8 20 40
74 Mehoo mehar Fateh pur 250 35 46 5 18 69 7.2 26 33.3 20 7 27 26
75 Mahar Goth Fateh pur 100 10 23 6 8 37 16.2 22 37.8 8 7 15 47
76 Qadir Bux Fateh pur 380 50 46 9 16 71 12.7 23 35.2 6 9 15 60
77 Gh mohd mahar Fateh pur 530 55 93 11 33 137 8.0 24 32.1 20 6 26 23
78 Mirjat Kotidji 160 20 40 7 9 56 12.5 16 28.6 0 0 0 #DIV/0!
79 Farz.M.Bugti Kotidji 130 15 13 2 3 18 11.1 17 27.8 5 1 6 17

5
s:no
Village UC Total population
House hold
Normal screenin
g SAM MAM
Total Screenin
g
SAM %
MAM %
GAM %
PLW Normal
Screening MAM
Total Screenin
g PLW PLW%
80 Payar Ali Kotidji 60 6 9 0 5 14 0.0 36 35.7 1 6 7 86
81 Esa khan Abro Kotidji 100 10 12 2 6 20 10.0 30 40.0 0 0 0 #DIV/0!
82 Imdaad Ali Kotidji 80 8 12 2 1 15 13.3 7 20.0 8 3 11 27
83 M.Ishaq Bugti Kotidji 120 10 13 2 7 22 9.1 32 40.9 16 6 22 27
84 Toro shah Kotidji 70 18 44 8 11 63 12.7 17 30.2 9 3 12 25
85 Tando shah Kotidji 60 12 27 1 1 29 3.4 3 6.9 0 0 0 #DIV/0!
86 Rind Hajano Kotidji 1000 140 101 12 34 147 8.2 23 31.3 40 21 61 34
87 Channa Theba Kotidji 680 100 92 16 28 136 11.8 21 32.4 17 0 17 0
88 Khardo Kotidji 780 780 208 22 51 281 7.8 18 26.0 20 8 28 29
89 Kot Muhalla Kotidji 220 20 10 4 6 20 20.0 30 50.0 6 1 7 14
90 Muhalla Channa Kotidji 350 40 45 4 11 60 6.7 18 25.0 0 0 0 #DIV/0!
91 Magsi Kotidji 180 15 12 1 9 22 4.5 41 45.5 5 1 6 17
92 Molidad Bugti Kotidji 300 35 35 3 11 49 6.1 22 28.6 2 1 3 33
93 Qazi Abbas Kotidji 500 70 60 4 29 93 4.3 31 35.5 6 1 7 14
94 khaskheli Kotidji 100 10 18 6 4 28 21.4 14 35.7 0 0 0 #DIV/0!
95 S.Dital shah Kotidji 650 100 91 10 43 144 6.9 30 36.8 6 5 11 45
96 Muhalla Bani Kotidji 620 120 65 13 24 102 12.7 24 36.3 3 0 3 0
97 Ali Bux Kotidji 490 70 84 22 24 130 16.9 18 35.4 0 0 0 #DIV/0!
98 Kot kila Kotidji 640 100 60 15 14 89 16.9 16 32.6 0 0 0 #DIV/0!
99 Abu Zaidi Kotidji 490 70 64 5 13 82 6.1 16 22.0 4 1 5 20
100 Hussan Bux Kotidji 110 15 19 0 5 24 0.0 21 20.8 0 0 0 #DIV/0!

6
s:no
Village UC Total population
House hold
Normal screenin
g SAM MAM
Total Screenin
g
SAM %
MAM %
GAM %
PLW Normal
Screening MAM
Total Screenin
g PLW PLW%
101 Chando Kotidji 70 10 15 0 2 17 0.0 12 11.8 2 0 2 0
102 Lashri Goth Kotidji 182 24 34 0 2 36 0.0 6 5.6 6 3 9 33
103 Gopang Kotidji 740 120 58 6 14 78 7.7 18 25.6 18 11 29 38
104 Abbasi goth Kotidji 380 35 49 3 8 60 5.0 13 18.3 7 2 9 22
105 Bahar Pulphto Kotidji 700 95 91 23 34 148 15.5 23 38.5 8 9 17 53
106 Sommro Kotidji 315 45 62 8 13 83 9.6 16 25.3 3 1 4 25
107 Angram khan Kotidji 210 30 56 6 8 70 8.6 11 20.0 20 8 28 29
108 Gul hassan Kotidji 250 30 73 13 19 105 12.4 18 30.5 15 3 18 17
109 Usman Goth Kotidji 380 50 28 13 19 60 21.7 32 53.3 5 0 5 0
110 Choro Goth Kotidji 480 65 65 9 22 96 9.4 23 32.3 6 1 7 14
111 Agan kesar Kotidji 220 30 40 5 10 55 9.1 18 27.3 2 0 2 0
112 Goth kesul Kotidji 150 15 27 5 8 40 12.5 20 32.5 1 0 1 0
113 Murad goth Kotidji 700 90 95 14 36 145 9.7 25 34.5 13 1 14 7
114 pariyo muhla Kotidji 120 15 20 2 4 26 7.7 15 23.1 0 1 1 100
115 Somro muhla Kotidji 200 25 38 1 10 49 2.0 20 22.4 0 0 0 #DIV/0!
116 M.Puhlphto Kotidji 220 25 33 1 1 35 2.9 3 5.7 0 0 0 #DIV/0!
117 Tando shah Kotidji 210 30 40 1 8 49 2.0 16 18.4 17 4 21 19
118 Hazar khan Kotidji 490 70 47 6 19 72 8.3 26 34.7 3 2 5 40
119 Chetan Kotidji 500 71 27 11 22 60 18.3 37 55.0 5 9 14 64
120 Tantro shah Kotidji 500 72 97 8 20 125 6.4 16 22.4 16 9 25 36
121 Mir. Imdaad Kotidji 1700 250 137 0 24 161 0.0 15 14.9 19 8 27 30
122 karum baig Kotidji 350 50 39 5 23 67 7.5 34 41.8 18 4 22 18
123 pir dilbar Kotidji 1085 155 1 26 51 78 33.3 65 98.7 17 7 24 29

7
s:no
Village UC Total population
House hold
Normal screenin
g SAM MAM
Total Screenin
g
SAM %
MAM %
GAM %
PLW Normal
Screening MAM
Total Screenin
g PLW PLW%
124 Julbani Kotidji 410 58 80 15 19 114 13.2 17 29.8 0 0 0 #DIV/0!
125 Mir.Mithal Kotidji 50 6 8 4 5 17 23.5 29 52.9 5 1 6 17
126 kot banglo Kotidji 1700 250 94 0 23 117 0.0 20 19.7 10 9 19 47
127 vilage kariro Kotidji 780 130 129 17 42 188 9.0 22 31.4 12 8 20 40
128 New mehrano Kotidji 380 50 31 9 14 54 16.7 26 42.6 12 3 15 20
129 Mir Gulan Kotidji 280 40 71 9 15 95 9.5 16 25.3 2 2 4 50
130 Seed pur Sadar gi bhatti 210 30 25 8 11 44 18.2 25 43.2 1 1 2 50
131 Chak shaikh Sadar gi bhatti 1050 150 95 20 52 167 12.0 31 43.1 21 8 29 28
132 Wastra Sadar gi bhatti 2100 300 199 12 59 270 4.4 22 26.3 21 2 23 9
133 Bodli Maser Sadar gi bhatti 120 15 20 1 5 26 3.8 19 23.1 9 2 11 18
134 Ghuniya Sadar gi bhatti 600 85 86 11 29 126 8.7 23 31.7 12 9 21 43
135 Matani shaikh
Sadar gi bhatti 200 25 22 3 15 40 7.5 38 45.0 13 7 20 35
136 Nagar ujan Sadar gi bhatti 800 114 115 3 14 132 2.3 11 12.9 26 6 32 19
137 Payro ujan Sadar gi bhatti 400 57 20 7 9 36 19.4 25 44.4 3 9 12 75
138 Malan narajo
Sadar gi bhatti 600 86 105 9 30 144 6.3 21 27.1 9 19 28 68
139 Jumo ujjan Sadar gi bhatti 100 15 12 1 9 22 4.5 41 45.5 2 0 2 0
140 Ramzan junijo
Sadar gi bhatti 70 10 12 1 3 16 6.3 19 25.0 3 1 4 25

8
s:no
Village UC Total population
House hold
Normal screenin
g SAM MAM
Total Screenin
g
SAM %
MAM %
GAM %
PLW Normal
Screening MAM
Total Screenin
g PLW PLW%
141 Relani ujjan Sadar gi bhatti 150 20 15 8 9 32 25.0 28 53.1 7 2 9 22
142 Dhani parto Sadar gi bhatti 100 15 16 1 7 24 4.2 29 33.3 5 2 7 29
143 Mor khan kalhoro
Sadar gi bhatti 70 10 10 1 4 15 6.7 27 33.3 1 1 2 50
144 Ali bux ujjan Sadar gi bhatti 50 7 7 2 6 15 13.3 40 53.3 2 5 7 71
145 Mehar Ali ujjan
Sadar gi bhatti 200 28 20 8 10 38 21.1 26 47.4 2 7 9 78
146 Budhal Kalhoro
Sadar gi bhatti 20 3 4 0 1 5 0.0 20 20.0 2 0 2 0
147 Hussain kalhoro
Sadar gi bhatti 60 8 5 0 1 6 0.0 17 16.7 13 2 15 13
148 Nangreja Sadar gi bhatti 110 16 11 5 10 26 19.2 38 57.7 5 1 6 17
149 M Aalim kalhoro
Sadar gi bhatti 100 14 9 0 1 10 0.0 10 10.0 3 2 5 40
150 Sadardin lakho
Sadar gi bhatti 68 8 25 2 8 35 5.7 23 28.6 0 0 0 #DIV/0!
151 shah muhammad
Sadar gi bhatti 126 18 21 5 20 46 10.9 43 54.3 0 0 0 #DIV/0!
152 Arbab khaloro
Sadar gi bhatti 250 30 47 1 9 57 1.8 16 17.5 4 2 6 33
153 Jorejo Sadar gi bhatti 120 30 62 3 13 78 3.8 17 20.5 19 0 19 0
154 M.Matal Sadar gi bhatti 80 10 14 0 6 20 0.0 30 30.0 2 1 3 33
155 Peer jeewan Sadar gi 770 110 113 10 36 159 6.3 23 28.9 20 13 33 39

9
s:no
Village UC Total population
House hold
Normal screenin
g SAM MAM
Total Screenin
g
SAM %
MAM %
GAM %
PLW Normal
Screening MAM
Total Screenin
g PLW PLW%
bhatti
156 Karamdin Sadar gi bhatti 120 17 71 8 26 105 7.6 25 32.4 2 4 6 67
157 Jhan khan Sadar gi bhatti 140 20 20 4 9 33 12.1 27 39.4 20 0 20 0
158 sadar ji Sadar gi bhatti 160 110 148 19 55 222 8.6 25 33.3 19 7 26 27
159 Abid Colony Jeelani 1800 250 224 42 10 276 15.2 4 18.8 46 2 48 4
160 Ali raza shah Jeelani 1100 160 95 21 2 118 17.8 2 19.5 38 2 40 5
161 Jeelani mohullah Jeelani 2000 300 47 10 3 60 16.7 5 21.7 22 2 24 8
162 New village Jeelani 1500 200 76 6 0 82 7.3 0 7.3 7 2 9 22
163 Saida Goth Jeelani 1200 170 97 20 3 120 16.7 3 19.2 18 2 20 10
164 Staff Quarter Jeelani 770 110 40 3 0 43 7.0 0 7.0 4 4 0
165 Chana muhalla Jeelani 1250 250 59 4 6 69 5.8 9 14.5 11 8 19 42
166 Shaheedabad Jeelani 1500 250 43 2 2 47 4.3 4 8.5 3 3 0
167 Kachi Abadi Faizabad Jeelani 1050 150 83 71 46 200 35.5 23 58.5 15 25 40 63
168 Saleemabad Jeelani 315 45 30 23 13 66 34.8 20 54.5 5 0 5 0
169 Faizabad Colony Jeelani 350 50 36 21 12 69 30.4 17 47.8 3 0 3 0
170 KhoKhar Goth Jeelani 460 65 63 26 20 109 23.9 18 42.2 29 20 49 41
171 Gahri Pul (Buttro) Jeelani 3000 500 186 28 11 225 12.4 5 17.3 23 3 26 12

10
s:no
Village UC Total population
House hold
Normal screenin
g SAM MAM
Total Screenin
g
SAM %
MAM %
GAM %
PLW Normal
Screening MAM
Total Screenin
g PLW PLW%
172 Haji Daem layari 126 18 37 1 5 43 2.3 12 14.0 4 0 4 0
173 Badal mangi layari 280 30 63 2 26 91 2.2 29 30.8 9 7 16 44
174 Malook Lanjwani layari 800 100 49 8 22 79 10.1 28 38.0 9 3 12 25
175 Gondal layari 525 70 68 9 20 97 9.3 21 29.9 3 0 3 0
176 lanchni layari 390 55 38 17 18 73 23.3 25 47.9 2 1 3 33
177 Datar dino layari 406 58 44 4 12 60 6.7 20 26.7 17 2 19 11
178 Abra goth layari 56 8 11 0 3 14 0.0 21 21.4 0 0 0 #DIV/0!
179 Arain goth layari 91 13 12 1 0 13 7.7 0 7.7 0 0 0 #DIV/0!
180 Shadad buro layari 357 50 42 1 10 53 1.9 19 20.8 9 7 16 44
181 Sommar boriro layari 420 70 74 7 18 99 7.1 18 25.3 13 4 17 24
182 Rabun rajper layari 1200 150 129 14 39 182 7.7 21 29.1 6 0 6 0
183 Sher khan layari 1300 150 72 23 29 124 18.5 23 41.9 23 4 27 15
184 Khanan buriro layari 5600 800 281 75 109 465 16.1 23 39.6 42 29 71 41
185 M.Khan katohar layari 800 100 86 7 27 120 5.8 23 28.3 13 7 20 35
186 Dilawar katohar layari 100 20 4 0 1 5 0.0 20 20.0 2 1 3 33
187 Bahawal katohar layari 200 35 12 9 7 28 32.1 25 57.1 4 10 14 71
188
G.Raza Merbahar goth layari 250 40 19 9 11 39 23.1 28 51.3 5 3 8 38
189 Hazoor bux layari 400 60 39 8 13 60 13.3 22 35.0 5 10 15 67

11
s:no
Village UC Total population
House hold
Normal screenin
g SAM MAM
Total Screenin
g
SAM %
MAM %
GAM %
PLW Normal
Screening MAM
Total Screenin
g PLW PLW%
190 Hussainabad layari 2000 230 172 9 52 233 3.9 22 26.2 27 6 33 18
191 Jumo Maher layari 55 9 5 1 1 7 14.3 14 28.6 4 0 4 0
192 G.Raza Katwar goth layari 200 20 10 2 3 15 13.3 20 33.3 0 0 0 #DIV/0!
193 Haji Ghulam Mohammad layari 70 6 9 9 0.0 0 0.0 1 0 1 0
194 kajlo katohar layari 290 30 41 18 24 83 21.7 29 50.6 10 3 13 23
195 Matilo mirbhar layari 200 30 29 1 9 39 2.6 23 25.6 9 0 9 0
196 Sirai Imam dino layari 70 10 7 1 4 12 8.3 33 41.7 3 1 4 25
197 Jogi layari 490 70 56 10 28 94 10.6 30 40.4 12 9 21 43
198 jani burori layari 435 60 55 4 21 80 5.0 26 31.3 0 0 0 #DIV/0!
199 Khanpur Qurashi layari 228 38 15 0 1 16 0.0 6 6.3 2 2 4 50
200 Daim Goth layari 445 70 67 9 28 104 8.7 27 35.6 7 18 25 72
201 layari layari 1500 250 119 11 27 157 7.0 17 24.2 0 0 0 #DIV/0!
Grand Total Khaipur 1069
66 1557
1 11623 1553 3365 16541 9.4 20 29.7 1922 818 2740 30
Sukkur
56966 8193 5105 473 1364 6964 7.0 20 27 1080 386 1466 26
Khaipur + Sukkur
163932 23764 16728 2026 4729 23505 9 20 29.0 3002 1204 4206 29

12
Sukkur Detail EPI population stats and screening results
S.No
Village Name UC Hous
e Hold
Total Populati
on
Normal
MAM
SAM
total children screeni
ng
SAM % MAM % GAM % norm
al PLW
PLW Mam
Total Screeni
ng
PLW%
1 Bhamboo Goth Nooraja 250 1300 40 32 8 80 10 40 50 21 19 40 48
2 Chungha Goth Nooraja 200 2100 61 17 10 88 11 19 31 16 3 19 16
3 Kot Sadique Shah Nooraja 35 250 19 15 2 36 6 42 47 5 4 9 44
4 Goth Chakar Mako Nooraja 20 175 20 7 2 29 7 24 31 0 1 1 100
5 Kot Mahesar Nooraja 5 39 26 20 2 48 4 42 46 2 0 2 0
6 Goth Qabil Nooraja 23 210 33 10 7 50 14 20 34 4 12 16 75
7 Goth Peeral Nooraja 65 500 48 21 18 87 21 24 45 4 8 12 67
8 Gohram Goth Nooraja 30 400 24 4 2 30 7 13 20 10 0 10 0
9 Mehesar Goth Nooraja 30 500 39 17 2 58 3 29 33 0 0 0 #DIV/0
!
10 Misri Mir Bahar Nooraja 22 200 90 12 7 109 6 11 17 4 5 9 56
11 Goth Khan Shah Nooraja 48 480 55 6 1 62 2 10 11 5 0 5 0
12 Village Qaim Bhutto Nooraja 8 120 2 2 0 0 0 2 0 2 0
13 Goth Sachal Dino Nooraja 30 300 12 0 0 12 0 0 0 6 2 8 25
14 Satar M.Samejo Nooraja 20 170 4 3 2 9 22 33 56 3 0 3 0
15 Sachal Dino Kalhoro Nooraja 30 300 12 12 0 0 0 6 2 8 25
16 Noraja Goth Nooraja 20 120 36 1 0 37 0 3 3 0 0 0 #DIV/0
!
17 Bhandki{sachedino goth} Nooraja 20 170 30 8 4 42 10 19 29 0 0 0
#DIV/0!
18 Gulo Mahar Nooraja 10 80 9 0 0 9 0 0 0 4 1 5 20
19 Arbab Khan Nooraja 20 140 15 6 3 24 13 25 38 4 2 6 33
20 Dildar Goth Nooraja 100 1000 75 10 5 90 6 11 17 6 3 9 33
21 Khuda Dino Sangi 15 150 17 2 1 20 5 10 15 5 0 5 0
22 Rajiri Sangi 80 800 32 10 9 73 12 14 26 6 2 8 25

13
S.No
Village Name UC Hous
e Hold
Total Populati
on
Normal
MAM
SAM
total children screeni
ng
SAM % MAM % GAM % norm
al PLW
PLW Mam
Total Screeni
ng
PLW%
23 Sultan khan Goth Sangi 70 450 35 5 3 43 7 12 19 10 4 14 29
24 Abdul Hakim Mirani Sangi 40 300 21 2 1 24 4 8 13 0 0 0
25 Waloo Goth Sangi 57 370 61 6 3 70 4 9 13 9 1 10 10
26 Syed Mohalla Sangi 34 84 6 2 0 8 0 25 25 6 0 6 0
27 Pandhi Sangi 25 143 30 1 0 31 0 3 3 3 2 5 40
28 Dost Ali Sangi 40 500 60 12 9 81 11 15 26 12 2 14 14
29 Muhib Ali Sangi 10 50 7 1 0 8 0 13 13 3 1 4 25
30 Qazi Mohalla Sangi 30 300 19 2 1 22 5 9 14 0 0 0 #DIV/0
!
31 Thareachani Sangi 450 2500 105 13 5 123 4 11 15 13 0 13 0
32 Qasim Pur Sangi 30 300 62 8 3 73 4 11 15 6 0 6 0
33 G.Rasool Mahar Sangi 28 250 41 11 3 55 5 20 25 5 1 6 17
34 Sewraa Sangi 81 567 40 2 2 44 5 5 9 4 0 4 0
35 Imam Bux Sangi 10 75 26 3 0 29 0 10 10 6 2 8 25
36 Ali Bux Katto Sangi 300 1500 10 6 4 20 20 30 50 4 4 8 50
37 Mochi Goth,Miran Pur Sangi 22 150 93 8 3 104 3 8 11 25 1 26 4
38 Sohro Sangi 300 900 53 12 4 69 6 17 23 19 3 22 14
39 Qadir Bux Kalhoro Sangi 100 700 47 2 0 49 0 4 4 10 1 11 9
40 Rana Habib Farm Sangi 12 84 26 1 1 28 4 4 7 7 1 8 13
41 Goth Punhoo Sangi 20 115 40 2 0 42 0 5 5 6 1 7 14
42 Javed Shah Goth Sangi 7 25 6 0 1 7 14 0 14 0 0 0 #DIV/0
!
43 Chachar (Near Rana Habib Goth) Sangi 8 60 5 1 0 6 0 17 17 0 0 0
#DIV/0!
44 Gazi Khan Sangi 35 212 72 5 2 79 3 6 9 18 8 26 31
45 Abdul Raheem Jagirani Sangi 75 600 44 12 7 63 11 19 30 11 3 14 21

14
S.No
Village Name UC Hous
e Hold
Total Populati
on
Normal
MAM
SAM
total children screeni
ng
SAM % MAM % GAM % norm
al PLW
PLW Mam
Total Screeni
ng
PLW%
46 David Farm Sangi 15 100 15 3 3 21 14 14 29 8 1 9 11
47 Col.Fateh Khan Sangi 30 600 23 12 1 36 3 33 36 3 0 3 0
48 Mola Bux Jatoi Sangi 90 350 18 3 1 22 5 14 18 17 2 19 11
49 Miran Pur Sangi 50 1200 78 13 1 92 1 14 15 24 4 28 14
50 Goth Sangi Sangi 35 600 15 2 1 18 6 11 17 20 2 22 9
51 Ghulam Rasool Shanbabni Sangi 8 80 13 3 3 19 16 16 32 2 7 9 78
52 Goth Umar Buriro Sangi 150 1050 66 29 9 104 9 28 37 18 10 28 36
53 Goth Suleman Kalhoro Sangi 70 400 68 24 14 106 13 23 36 24 17 41 41
54 Bozdar farm Sangi 5 35 10 0 1 11 9 0 9 0 1 1 100
55 Goth Abdul Shakoor Sangi 20 140 30 3 1 34 3 9 12 5 0 5 0
56 Goth Amir Bux Bhayo Sangi 16 112 17 5 0 22 0 23 23 2 4 6 67
57 Goth Regulator Sangi 10 70 11 2 0 13 0 15 15 1 1 2 50
58 Goth Waryam Buriro Sangi 25 180 37 24 5 66 8 36 44 18 6 24 25
59 Village Nirch Sangi 200 1800 139 71 24 234 10 30 41 21 3 24 13
60 Goth Kajlo/Piyaro Khan Sangi 4 25 11 2 2 15 13 13 27 0 0 0
#DIV/0!
61 Goth Ali Nawaz Samejo Sangi 4 30 6 1 2 9 22 11 33 4 1 5 20
62 Goth Gul Muhammad Sangi 30 200 35 19 5 59 8 32 41 10 5 15 33
63 Goth Ahsan Chachar Sangi 8 56 17 1 0 18 0 6 6 4 0 4 0
64 Muhammad Sangi 6 38 5 2 1 8 13 25 38 0 0 0 #DIV/0
!

15
S.No
Village Name UC Hous
e Hold
Total Populati
on
Normal
MAM
SAM
total children screeni
ng
SAM % MAM % GAM % norm
al PLW
PLW Mam
Total Screeni
ng
PLW%
Soomar Shanbani
65 Goth Hussain Bux Shanbabni Sangi 12 60 2 4 2 8 25 50 75 0 0 0
#DIV/0!
66 Goth Sajjan Sangi 4 40 1 5 1 7 14 71 86 2 0 2 0
67 Goth Iqbal Shanbani Sangi 10 170 23 5 1 29 3 17 21 5 1 6 17
68 Goth Ali Mohammad Sangi 10 100 18 4 1 23 4 17 22 5 0 5 0
69 Shaikh Mohalla Sangi 30 250 20 7 3 30 10 23 33 5 0 5 0
70 Goth Muhammad Hayat Sangi 7 120 24 1 3 28 11 4 14 3 0 3 0
71 Goth Soroho Kalhoro Sangi 5 50 10 2 3 15 20 13 33 2 1 3 33
72 Goth Taj Mohammad Sangi 14 100 10 7 3 20 15 35 50 0 0 0
#DIV/0!
73 Goth Datar Dino Sangi 11 110 26 10 3 39 8 26 33 0 0 0 #DIV/0
!
74 Goth Godho Khan Sangi 42 300 24 12 4 40 10 30 40 0 0 0 #DIV/0
!
75 Mir Muhammad Samejo Sangi 5 40 0 0 0 0
#DIV/0!
#DIV/0!
#DIV/0! 3 7 10 70
76 Goth Ghawar Khan Sangi 5 30 3 4 0 7 0 57 57 2 1 3 33.3
77 Goth Ramzan Shanbani Sangi 15 105 42 12 7 61 11 20 31 5 7 12 58
78 Goth Noor Khan Jatoi Sangi 10 70 14 5 2 21 10 24 33 1 2 3 67
79 Goth Muhammad Panjal Sangi 40 270 30 19 3 52 6 37 42 16 8 24 33
80 Goth Bachal Sangi 19 150 12 2 1 15 7 13 20 2 2 4 50
81 Goth Aaro Sangi 70 450 61 13 2 76 3 17 20 4 2 6 33

16
S.No
Village Name UC Hous
e Hold
Total Populati
on
Normal
MAM
SAM
total children screeni
ng
SAM % MAM % GAM % norm
al PLW
PLW Mam
Total Screeni
ng
PLW%
82 Mushtaque Farm/Tanveer Farm Sangi 30 240 34 16 9 59 15 27 42 12 3 15 20
83 Goth Hupo Sangi 30 260 20 17 4 41 10 41 51 2 2 4 50
84 Goth Nazar Soomro Sangi 6 60 22 1 1 24 4 4 8 3 0 3 0
85 Allah Rakhiyo Chachar Sangi 13 160 28 6 1 35 3 17 20 6 0 6 0
86 Ilyas Farm Sangi 8 56 7 4 0 11 0 36 36 2 1 3 33
87 Ayoob Farm Sangi 4 20 4 2 0 6 0 33 33 0 0 0 #DIV/0
!
88 Khursheed Farm Sangi 4 28 3 3 2 8 25 38 63 0 0 0 #DIV/0
!
89 Genral Bashir Sangi 5 40 12 3 0 15 0 20 20 1 3 4 75
90 Noor Din Bhayo Sangi 10 70 10 1 2 13 15 8 23 3 3 6 50
91 Khuda Bux Sangi 40 280 22 4 0 26 0 15 15 4 3 7 43
92 Jam Goth Sangi 15 170 38 12 4 54 7 22 30 0 0 0 #DIV/0
!
93 Haji Noor Din Sangi 12 94 28 6 2 36 6 17 22 0 0 0 #DIV/0
!
94 Bhai Khan Sangi 7 60 11 5 4 20 20 25 45 0 0 0 #DIV/0
!
95 Dur Muhammad Sangi 25 220 32 17 8 57 14 30 44 19 3 22 14
96 Andal Shah Goth Sangi 35 290 19 19 7 45 16 42 58 36 30 66 45
97 Village Jogi
Soomra Panhwari 22 170 22 8 5 35 14 23 37 5 1 6 17
98 Village Chohar
Soomra Panhwari 28 200 19 6 1 26 4 23 27 8 4 12 33
99 Ishaque Indhar
Soomra Panhwari 76 532 43 7 3 53 6 13 19 8 5 13 38
100 Goth Haji M.Qasim
Soomra Panhwari 75 525 39 12 3 54 6 22 28 6 4 10 40

17
S.No
Village Name UC Hous
e Hold
Total Populati
on
Normal
MAM
SAM
total children screeni
ng
SAM % MAM % GAM % norm
al PLW
PLW Mam
Total Screeni
ng
PLW%
101 Village Soomra
Soomra Panhwari 300 2000 89 26 7 122 6 21 27 24 2 26 8
102 Village Panhwari
Soomra Panhwari 200 1500 115 17 2 134 1 13 14 8 2 10 20
103 Village Bulo Mahar
Soomra Panhwari 40 240 18 11 6 35 17 31 49 5 10 15 67
104 Village Dodo Mahar
Soomra Panhwari 30 200 22 11 3 36 8 31 39 9 4 13 31
105 Village Faqeer Malik
Soomra Panhwari 12 55 7 1 2 10 20 10 30 2 2 4 50
106 Goth Qadir Bux
Soomra Panhwari 18 126 34 9 3 46 7 20 26 5 5 10 50
107 Goth Abdullah Shah
Soomra Panhwari 60 360 42 14 3 59 5 24 29 11 1 12 8
108 Ali Hasan Korai Dadloo 16 160 72 3 9 84 11 4 14 10 2 12 17
109 Izat Khan Korai Dadloo 100 1000 48 10 3 61 5 16 21 6 1 7 14
110 Sajan Sehtoo Dadloo 50 300 53 8 1 62 2 13 15 10 0 10 0
111 Maqbool Shaikh Dadloo 26 105 7 5 1 13 8 38 46 3 0 3 0
112 Khero Sangi Dadloo 110 650 38 15 12 65 18 23 42 16 10 26 38
113 Janan Khan Dadloo 68 480 56 2 3 61 5 3 8 13 5 18 28
114 Rustam Korai Dadloo 40 380 106 18 5 129 4 14 18 8 5 13 38
115 Sharef Korai Dadloo 18 210 40 13 0 53 0 25 25 5 2 7 29
116 Khuda Bux Selro Dadloo 40 300 75 4 1 80 1 5 6 4 0 4 0
117 Sawan Shikari Dadloo 18 150 22 4 2 28 7 14 21 2 2 4 50
118 Pir Bux Malik Dadloo 20 200 28 4 0 32 0 13 13 12 1 13 8
119 Nibhaw Malik Dadloo 17 160 47 3 3 53 6 6 11 6 0 6 0
120 Aachar Shaikh Dadloo 15 150 8 8 1 17 6 47 53 0 1 1 100
121 Koro Khan Korai Dadloo 270 2000 47 18 2 67 3 27 30 3 0 3 0

18
S.No
Village Name UC Hous
e Hold
Total Populati
on
Normal
MAM
SAM
total children screeni
ng
SAM % MAM % GAM % norm
al PLW
PLW Mam
Total Screeni
ng
PLW%
122 Usman Korai Dadloo 100 150 22 5 1 28 4 18 21 6 2 8 25
123 Lemo Buloo Dadloo 10 100 14 4 3 21 14 19 33 1 0 1 0
124 Moli Dino Dadloo 500 1500 56 21 7 84 8 25 33 23 0 23 0
125 Dodloi Dadloo 120 960 51 4 1 56 2 7 9 12 1 13 8
126 Makro Malik Dadloo 16 128 19 1 1 21 5 5 10 4 0 4 0
127 Ali Bux Dharejo Dadloo 20 111 19 7 0 26 0 27 27 7 0 7 0
128 Nawab Korai Dadloo 125 260 38 12 1 51 2 24 25 10 0 10 0
129 Imam Bux Dadloo 86 420 37 4 2 43 5 9 14 12 0 12 0
130 Buxo seelro Dadloo 250 1750 44 4 1 49 2 8 10 10 1 11 9
131 Nawab Billlani Dadloo 18 132 19 6 2 27 7 22 30 5 2 7 29
132 Budhoo Khan Dadloo 12 200 26 13 0 39 0 33 33 8 2 10 20
133 Soomra Korai Dadloo 15 250 26 21 2 49 4 43 47 19 10 29 34
134 Bero Buloo Dadloo 15 200 20 19 5 44 11 43 55 0 0 0 #DIV/0
!
135 Sahib Khan Korai Dadloo 250 1500 137 54 7 198 4 27 31 19 12 31 39
136 Khairo Bullo Dadloo 125 1200 74 15 3 92 3 16 20 5 1 6 17
137 Koro Khan Korai Dadloo 65 750 42 30 3 75 4 40 44 12 1 13 8
138 Goth Milo Malik Dadloo 15 200 14 6 3 23 13 26 39 8 5 13 38
139 Jani Mir Bahar Dadloo 25 250 25 7 2 34 6 21 26 18 3 21 14
140 Moto Mir Bahar Dadloo 20 140 31 7 1 39 3 18 21 16 1 17 6
141 Daim Goth Dadloo 9 59 15 3 1 19 5 16 21 0 0 0 #DIV/0
!
142 Goth Mahar Mir Bahar Dadloo 7 45 6 1 1 8 13 13 25 0 0 0
#DIV/0!
143 Goth Jadoo Indhar Dadloo 7 50 14 0 1 15 7 0 7 0 0 0 #DIV/0
!
144 Goth Chanaisar Chachar Dadloo 8 30 12 1 0 13 0 8 8 0 0 0
#DIV/0!
145 Mir muhammad dayo Dadloo 50 250 17 7 6 30 20 23 43 6 6 12 50

19
S.No
Village Name UC Hous
e Hold
Total Populati
on
Normal
MAM
SAM
total children screeni
ng
SAM % MAM % GAM % norm
al PLW
PLW Mam
Total Screeni
ng
PLW%
146 Massoo Sanghi Dadloo 60 450 49 25 15 89 17 28 45 6 2 8 25
147 Wali Dino Dadloo 87 420 97 12 13 122 11 10 20 15 0 15 0
148 Jaro mirbahar Dadloo 80 640 51 8 1 60 2 13 15 15 2 17 12
149 Haji goth Dadloo 100 500 33 35 7 75 9 47 56 5 18 23 78
150 gulab Mir bahar Dadloo 25 200 31 11 2 44 5 25 30 18 1 19 5
151 Noor muhammad Dadloo 36 300 32 5 0 37 0 14 14 6 0 6 0
152 Suleman Kalhoro Dadloo 30 200 35 10 0 45 0 22 22 3 0 3 0
153 Sahib Khan Korai Dadloo 44 200 70 4 6 80 8 5 13 8 5 13 38
Grand Total 819
3 56966 5105 136
4 473 6964 7 20 26 1080 386 1466 26

0
Annex 11 Data set 235 HHs and 606 children
Data Analysis based on Approach of cleaning data to 235 HHs and 606 children
Before data validation HFA
All n = 620
Boys n = 332
Girls n = 288
>-2Z Score 111(18%) 50(15%) 61 (21%)
Prevalence of stunting (<-2 z-score) less than two standard
(509) 82%
(282) 85%
(227) 79%
Prevalence of moderate stunting (<-2 z-score and >=-3 z-score)
(80) 13%
(38) 11%
(42) 15%
Prevalence of severe stunting (<-3 z-score)
(429) 69% of all
children in random sample
(244) 73% of all
children in random sample
(185) 64% of all children in random sample
After data validation HFA
All n = 606
Boys n = 316
Girls n = 290
>-2Z Score 111 (18)%
52 (16 %) 69 (24%)
Prevalence of stunting (<=-2 z-score) less than or equal to -2 SD
495 (81%)
264(84%)
231( 80%)
Prevalence of moderate stunting
86 (14%)
45 (14%) 41 (14%)
Prevalence of severe stunting (<-3 z-score)
409 (67%) of all
children in random sample
219 (69%) of all
children in random sample
(190) 66% of all children in random sample

1
Before WFH All Boys Girls
n = 712 n = 362 n = 350
Prevalence of Global acute malnutrition (<-2 z-score)
(291) 41%
(137) 38%
(154) 44%
Prevalence of moderate acute malnutrition (<-2 z-score and >=-3 z-score)
(111) 16%
(45) 12%
(66) 18%
Prevalence of severe acute malnutrition (<-3 z-score)
(180) 25%
(92) 25%
(88) 25%
After WFH All Boys Girls
n = 606 n = 316 n = 290
Prevalence of Global acute malnutrition (<-2 z-score)
275 (45%)
139 (44%) 136 (47%)
Prevalence of moderate acute malnutrition (<-2 z-score and >=-3 z-score)
102 (17%) 42 (13%) 60 (21%)
Prevalence of severe acute malnutrition (<-3 z-score)
173 (29%) 97 (31%) 76 (26%)

2
Before data validation MUAC (n=762)
All Boys Girls
n = 762 n = 386 n = 368
Global Acute Malnutrition (191) 25%
(92) 24% (99) 27%
(<125 mm)
Moderate Acute Malnutrition (122) 16% (62) 16% (60) 16%
(≥115 mm and <125 mm)
Severe Acute Malnutrition (69) 9% (30) 8% (39) 11%
(<115 mm)
After data validation MUAC (n=606)
Acute Malnutrition rates according to MUAC (n=606)
All Boys Girls
n = 606 n = 315 n = 291
Global Acute Malnutrition (<125 mm)
141 (23%)
69 (22%)
72 (25%)
Moderate Acute Malnutrition (≥115 mm and <125 mm)
91 (15%)
46 (15%)
45(15%)
Severe Acute Malnutrition (<115 mm)
50 (8%)
23 (7%)
27 (9%)

3
Rooms before data validation
Number and %/homes with X rooms
X Owned Rented Living without rent Total
1 Room 58 (83%) 2 (3%) 10 (14%) 70 (100%)
2 Rooms 67 (89%) 5 (7%) 3 (4%) 75 (100%)
3 Rooms 33 (87%) 4 (11%) 1 (3%) 38 (100%)
4 Rooms 17 (89%) 1 (5%) 1 (5%) 19 (100%)
5 and more rooms 15 (94%) 0 (0%) 1 (6%) 16 (100%)
Total 190 (87%) 12 (6%) 16 (7%) 218 (100%)
Number and %/homes with X rooms
X Owned Rented Living without rent Total
1 Room 46 (85%) 2 (4%) 6 (11%) 54(100%)
2 Rooms 62 (80%) 4 (6%) 3 (4%) 69 (100%)
3 Rooms 30 (88%) 4 (12%) 0 34 (100%)
4 Rooms 17 (89%) 1 (5%) 1 (5%) 19 (100%)
5 and more rooms 9 (90%) 0 1 (10%) 10 (100%)
Total 164 (88%) 11 (7%) 11 (7%) 186 (100%)
218 HHs 1room 2 rooms 3 rooms 4 rooms 5
rooms
Number of rooms
in HH
33% 34% 17% 9% 7%
190 HHs 1room 2 rooms 3 rooms 4 rooms 5 rooms
Number of
rooms in HH
29% 37% 18% 10% 5%
Paved Semi Paved Unpaved
Walls 19% 35% 47%
Roof 17% 52% 30%
Floor 11% 12% 78%

4
Fire wood Gas/ Gas Cylinders
2 rooms
Kerosene oil Animal dung Other Fuel
Type of fuel used for
cooking
36% 3% 36% 2% 24%
613 were answered Fire wood Gas/ Gas Cylinders
2 rooms
Kerosene oil Animal dung Other Fuel
Type of fuel used for
cooking
206 (90%) 16 (7%) -- 8(3%) --
Assets Detail
212 52 74 62 3 8
85 12 1 154 12 73 58
0
18 3 186
3 3
603 71 77 66 4 13
92 13 1 209 16 77 60
0
19 3 398
3 3
Assets
HH Numer

5
After Data Validation
After Data Validation
Treatment of Water
Always 66 34%
Often 3 2%
Some times 26 13%
Never 98 51%
74%
7% 6% 5% 1% 1% 0% 0% 0% 1% 1% 1% 2% 1% 0%
10%20%30%40%50%60%70%80%
Drinking Water
Series1

6
After data validation
After data validation
0%
10%
20%
30%
40%
50%
60%
70%
Pip
ed W
ater
To Y
ard
Pu
blic
Tap
e
Tub
e w
ell
bo
re h
ole
Pro
tect
ed D
rug
we
ll
Un
pro
tect
ed D
ug
Wel
l
Spri
ng
Rai
n W
ater
Bo
ttle
Wat
er
Tan
k D
rum
Tan
ker
Dru
m
Surf
ace
of
lake
Irri
gati
on
Ch
ann
el
Oth
re S
ou
rces
64%
15% 7% 6% 4% 1% 1% 0% 0% 0% 0% 0% 2% 0%
HH water sources
Series1
0%
10%
20%
30% 25%
6% 10%
22%
30%
5%
1%
Litrine Practices
Series1

7
58%
42%
Chart Title
Share Toilet Yes Share Toilet No
0%
5%
10%
15%
20%
25%
30%
35%
35%
2%
32%
2%
24%
5%
Hand washing practices
Series1

8
0%
5%
10%
15%
20%
25%
30%
1 Times 2 Times 3 Times 4 Times 5 Times 6 Times 7 Times
4% 4%
24%
27%
20%
11%
2%
Food Consumption WRA
Series1
0
20
40
60
Bab
y Fo
od
Bre
ast
Feed
gin
Ce
rela
c
Ch
icke
n
Ch
ike
n R
ice
Fish
,Daa
l,Po
t…
Ke
chri
Milk
Milk
Su
ji…
No
t Ta
ken
Ric
e
Ric
e P
uls
es
Ric
e+Fi
sh
Ric
e+Fr
uit
Ric
e+M
ilk
Ric
e+Su
gar
Ric
e+V
eget
able
RO
TI
Ro
ti+
Man
go
Ro
ti+
Milk
Ve
geta
ble
s
Ve
geta
ble
s+R
…
(bla
nk)
1
33
2 1 2 1 3
30
1
58
37
16
1 4
24
1 3 3 1 4 1 7
Before Morning WRA

9
0
10
20
30
40
50
60B
aby
Foo
d
Bre
ast
Feed
gin
Ce
rela
c
Ch
icke
n
Ch
ike
n R
ice
Fish
,Daa
l,Po
tato
Ke
chri
Milk
Milk
Su
ji P
orr
idge
No
t Ta
ken
Ric
e
Ric
e P
uls
es
Ric
e+Fi
sh
Ric
e+Fr
uit
Ric
e+M
ilk
Ric
e+Su
gar
Ric
e+V
eget
able
RO
TI
Ro
ti+
Man
go
Ro
ti+
Milk
Ve
geta
ble
s
Ve
geta
ble
s+R
oti
(bla
nk)
1
33
2 1 2 1 3
30
1
58
37
16
1 4
24
1 3 3 1 4 1 7
Morning WRA
0
10
20
30
40
50
60
Bab
y Fo
od
Bre
ast
Feed
gin
Ce
rela
c
Ch
icke
n
Ch
ike
n R
ice
Fish
,Daa
l,Po
tato
Ke
chri
Milk
Milk
Su
ji P
orr
idge
No
t Ta
ken
Ric
e
Ric
e P
uls
es
Ric
e+Fi
sh
Ric
e+Fr
uit
Ric
e+M
ilk
Ric
e+Su
gar
Ric
e+V
eget
able
RO
TI
Ro
ti+
Man
go
Ro
ti+
Milk
Ve
geta
ble
s
Ve
geta
ble
s+R
oti
(bla
nk)
1
33
2 1 2 1 3
30
1
58
37
16
1 4
24
1 3 3 1 4 1 7
Brunch WRA

10
0
10
20
30
40
50
60B
aby
Foo
d
Bre
ast
Feed
gin
Ce
rela
c
Ch
icke
n
Ch
ike
n R
ice
Fish
,Daa
l,Po
tato
Ke
chri
Milk
Milk
Su
ji P
orr
idge
No
t Ta
ken
Ric
e
Ric
e P
uls
es
Ric
e+Fi
sh
Ric
e+Fr
uit
Ric
e+M
ilk
Ric
e+Su
gar
Ric
e+V
eget
able
RO
TI
Ro
ti+
Man
go
Ro
ti+
Milk
Ve
geta
ble
s
Ve
geta
ble
s+R
oti
(bla
nk)
1
33
2 1 2 1 3
30
1
58
37
16
1 4
24
1 3 3 1 4 1 7
Lunch WRA
0
10
20
30
40
50
60
Bab
y Fo
od
Bre
ast
Feed
gin
Ce
rela
c
Ch
icke
n
Ch
ike
n R
ice
Fish
,Daa
l,Po
tato
Ke
chri
Milk
Milk
Su
ji P
orr
idge
No
t Ta
ken
Ric
e
Ric
e P
uls
es
Ric
e+Fi
sh
Ric
e+Fr
uit
Ric
e+M
ilk
Ric
e+Su
gar
Ric
e+V
eget
able
RO
TI
Ro
ti+
Man
go
Ro
ti+
Milk
Ve
geta
ble
s
Ve
geta
ble
s+R
oti
(bla
nk)
1
33
2 1 2 1 3
30
1
58
37
16
1 4
24
1 3 3 1 4 1 7
After noon WRA

11
0
10
20
30
40
50
60B
aby
Foo
d
Bre
ast
Feed
gin
Ce
rela
c
Ch
icke
n
Ch
ike
n R
ice
Fish
,Daa
l,Po
tato
Ke
chri
Milk
Milk
Su
ji P
orr
idge
No
t Ta
ken
Ric
e
Ric
e P
uls
es
Ric
e+Fi
sh
Ric
e+Fr
uit
Ric
e+M
ilk
Ric
e+Su
gar
Ric
e+V
eget
able
RO
TI
Ro
ti+
Man
go
Ro
ti+
Milk
Ve
geta
ble
s
Ve
geta
ble
s+R
oti
(bla
nk)
1
33
2 1 2 1 3
30
1
58
37
16
1 4
24
1 3 3 1 4 1 7
After noon WRA
0
10
20
30
40
50
60
Bab
y Fo
od
Bre
ast
Feed
gin
Ce
rela
c
Ch
icke
n
Ch
ike
n R
ice
Fish
,Daa
l,Po
tato
Ke
chri
Milk
Milk
Su
ji P
orr
idge
No
t Ta
ken
Ric
e
Ric
e P
uls
es
Ric
e+Fi
sh
Ric
e+Fr
uit
Ric
e+M
ilk
Ric
e+Su
gar
Ric
e+V
eget
able
RO
TI
Ro
ti+
Man
go
Ro
ti+
Milk
Ve
geta
ble
s
Ve
geta
ble
s+R
oti
(bla
nk)
1
33
2 1 2 1 3
30
1
58
37
16
1 4
24
1 3 3 1 4 1 7
After Dinner WRA

12
0
10
20
30
40
50
60B
aby
Foo
d
Bre
ast
Feed
gin
Ce
rela
c
Ch
icke
n
Ch
ike
n R
ice
Fish
,Daa
l,Po
tato
Ke
chri
Milk
Milk
Su
ji P
orr
idge
No
t Ta
ken
Ric
e
Ric
e P
uls
es
Ric
e+Fi
sh
Ric
e+Fr
uit
Ric
e+M
ilk
Ric
e+Su
gar
Ric
e+V
eget
able
RO
TI
Ro
ti+
Man
go
Ro
ti+
Milk
Ve
geta
ble
s
Ve
geta
ble
s+R
oti
(bla
nk)
1
33
2 1 2 1 3
30
1
58
37
16
1 4
24
1 3 3 1 4 1 7
Before Morning Child
Total
0
10
20
30
40
50
60
Bab
y Fo
od
Bre
ast
Feed
gin
Ce
rela
c
Ch
icke
n
Ch
ike
n R
ice
Fish
,Daa
l,Po
tato
Ke
chri
Milk
Milk
Su
ji P
orr
idge
No
t Ta
ken
Ric
e
Ric
e P
uls
es
Ric
e+Fi
sh
Ric
e+Fr
uit
Ric
e+M
ilk
Ric
e+Su
gar
Ric
e+V
eget
able
RO
TI
Ro
ti+
Man
go
Ro
ti+
Milk
Ve
geta
ble
s
Ve
geta
ble
s+R
oti
(bla
nk)
1
33
2 1 2 1 3
30
1
58
37
16
1 4
24
1 3 3 1 4 1 7
Morning Child
Total

13
0
10
20
30
40
50
60B
aby
Foo
d
Bre
ast
Feed
gin
Ce
rela
c
Ch
icke
n
Ch
ike
n R
ice
Fish
,Daa
l,Po
tato
Ke
chri
Milk
Milk
Su
ji P
orr
idge
No
t Ta
ken
Ric
e
Ric
e P
uls
es
Ric
e+Fi
sh
Ric
e+Fr
uit
Ric
e+M
ilk
Ric
e+Su
gar
Ric
e+V
eget
able
RO
TI
Ro
ti+
Man
go
Ro
ti+
Milk
Ve
geta
ble
s
Ve
geta
ble
s+R
oti
(bla
nk)
1
33
2 1 2 1 3
30
1
58
37
16
1 4
24
1 3 3 1 4 1 7
Brunch Child
0
10
20
30
40
50
60
Bab
y Fo
od
Bre
ast
Feed
gin
Ce
rela
c
Ch
icke
n
Ch
ike
n R
ice
Fish
,Daa
l,Po
tato
Ke
chri
Milk
Milk
Su
ji P
orr
idge
No
t Ta
ken
Ric
e
Ric
e P
uls
es
Ric
e+Fi
sh
Ric
e+Fr
uit
Ric
e+M
ilk
Ric
e+Su
gar
Ric
e+V
eget
able
RO
TI
Ro
ti+
Man
go
Ro
ti+
Milk
Ve
geta
ble
s
Ve
geta
ble
s+R
oti
(bla
nk)
1
33
2 1 2 1 3
30
1
58
37
16
1 4
24
1 3 3 1 4 1 7
Lunch Child
Total

14
0
10
20
30
40
50
60B
aby
Foo
d
Bre
ast
Feed
gin
Ce
rela
c
Ch
icke
n
Ch
ike
n R
ice
Fish
,Daa
l,Po
tato
Ke
chri
Milk
Milk
Su
ji P
orr
idge
No
t Ta
ken
Ric
e
Ric
e P
uls
es
Ric
e+Fi
sh
Ric
e+Fr
uit
Ric
e+M
ilk
Ric
e+Su
gar
Ric
e+V
eget
able
RO
TI
Ro
ti+
Man
go
Ro
ti+
Milk
Ve
geta
ble
s
Ve
geta
ble
s+R
oti
(bla
nk)
1
33
2 1 2 1 3
30
1
58
37
16
1 4
24
1 3 3 1 4 1 7
After Noon Child
0102030405060
Bab
y Fo
od
Bre
ast
Feed
gin
Ce
rela
c
Ch
icke
n
Ch
ike
n R
ice
Fish
,Daa
l,Po
tato
Ke
chri
Milk
Milk
Su
ji P
orr
idge
No
t Ta
ken
Ric
e
Ric
e P
uls
es
Ric
e+Fi
sh
Ric
e+Fr
uit
Ric
e+M
ilk
Ric
e+Su
gar
Ric
e+V
eget
able
RO
TI
Ro
ti+
Man
go
Ro
ti+
Milk
Ve
geta
ble
s
Ve
geta
ble
s+R
oti
(bla
nk)
1
33
2 1 2 1 3
30
1
58
37
16
1 4
24
1 3 3 1 4 1 7
Dinner Child
020406080
100120140160
BreastFeeding
Cerelac Juice Milk Not Taken Roti Tea (blank)
37
6 2
37
148
3 1
After Dinner Child

15
Yes No Do not Know
Thick Milk (colostrum) given to child immediately
after birth
79% 12% 9%
Less than six
months
6-12
months
12 months or
more
Never did
exclusively BF
Age until mothers breast feed
their children exclusively
43% 28% 15% 15%
Infant formula Fresh milk Powdered milk Tetra pack
Type of top up milk
given to the child
9% 75% 5% 10%
0%
5%
10%
15%
20%
25%
30%
Honey PlainWater
Tea Packet Formula BreastMilk
GoatMilk
Other DntKnow
25% 25%
1% 2% 2%
17%
3% 4%
22%
Suplementry feeding
Series1

16
0-6 month 6-12 months More than
13months
Do not know
Age of child when top
up milk was introduced
44% 23% 2% 31%
0%
10%
20%
30%
40%
50%
60%
70%
80%
Infant formula Poweder Milk Fresh Tetra Pack
9% 5%
76%
10%
Type of Milk
0%
5%
10%
15%
20%
25%
30%
35%
40%
45%
0-6 Months 7_12 Months 20-13 Months Dnt Know
44%
23%
2%
31%
Topup Milk
Series1

17
0-6
month
6-12 months More than
13months
Only BF Do not
Know
Age of child when other liquids
(juices, tea etc.) were introduced
34% 25% 0% 15% 27%
Age of child when other semi
solid foods were introduced
39% 33% 1% -- 27%
0%
5%
10%
15%
20%
25%
30%
35%
0_6 Months 6_12Months 13 or more Only breastfeeding
Dnt Know
34%
25%
0%
15%
27%
Liquids
0%
5%
10%
15%
20%
25%
30%
35%
40%
0_6 Months 6_12 Months 13 or more Dnt Know
39%
33%
1%
27%
Solid Food

18
always sometimes When time
permits
never N/A
Complementary food
prepared separately
15% 31% 12% 35% 8%
Mother 39%
Mother in Law 20%
Relative 3%
Neighbour 5%
own Experience 14%
Doctor 5%
CHW 9%
Other 1%
Not Applicable Breast feeding
4%
Food Advised
0%
5%
10%
15%
20%
25%
30%
35%
40%
1_3 Pregnencies 4_6 Pregnencies 7_9 Pregnancies 10_12 Pregnencies
34%
39%
20%
8%
Number of Pregnencies

19
In 274 Sample
Miscarriages Still Birth Live Birth Currently Pregnant
Total 52 16 322 15
%age 13% 4% 80% 4%
In 235 Sample
Women’s experience of different pregnancy outcomes
frequency of pregnancy outcome Miscarriages Still Birth Live Birth
Currently Pregnant
1 7 8 8 14
2 7 4 14
3 4 20
4 2 5
5 & more 2 28
Total 22 12 75 14
# of different pregnancy outcomes reported from 235 Women
Miscarriages Still Birth Live Birth Currently Pregnant
Total (273) 43 16 295 15
%age ( 100) 12% 4% 80% 4%
0%
10%
20%
30%
40%
50%
60%
70%
80%
Miscarriages Still Birth Live Birth Currently Prenant
12%
4%
80%
4%
Pregnancies Outcome

20
Worms Infestation Yes No Not remember
Worm infestation diagnosis in last one year 16% 46% 38%
De-worming medicines taken in last one year 20% 40% 40%
History of hospitalization Yes No Not remember
Any history of hospitalization in last one year 19% 48% 32%
Flu 6% Fever
12% Cough 8%
Difficulty in Breathing
2% Diarrheoa
3% Vomating
6% Abdomin Pain
6% Constipition 5%
Skin Rash 2%
Michturation 2%
Hypertention 5%
Headeches 13%
Weakness 22%
Others 0%
None 8%
Difficulties during pregnancies
Flu 19%
Fewer 30%
Dysentry 8%
vomating 6%
Constipation 7%
Skin rash 9%
Micturation 4%
Abdominal pain 15%
Others 2%
Diseses patren in Children

21
Worm infestation status and
treatment
# women
respondents
(144)
Women’s responses about their children
Yes No Do not
know
Worms infestation diagnosed in
last six months
54 12 22 20
Taking medicines for worm
infestation
50 12 18 20
Currently having worms
infestation
40 6 18 16
Medicine used for worm infestation
Currently worm infestation in children
0%
5%
10%
15%
20%
25%
30%
35%
40%
45%
Infestation Children No Infestation Dnt Know
22%
41%
37%
Worm Infestation Child
0%
5%
10%
15%
20%
25%
30%
35%
40%
Coworming No Coworming Dnt Know
24%
36%
40% Medicine used
Series1

22
Yes No Do not know
Vaccination Card of Child 68% 31% 1%
0%
5%
10%
15%
20%
25%
30%
35%
40%
45%
Currently worming Currently No worming Dnt Know
15%
45% 40%
Currently Worm Infestation