1 Polyphenol and Caffeine Concentrations Found in Lipton® White Tea with Blueberry and

Nutrition Security and Sustainable Value Chains
Mirjam Kneepkens Christina Nyhus Dhillon
Bärbel Weiligmann
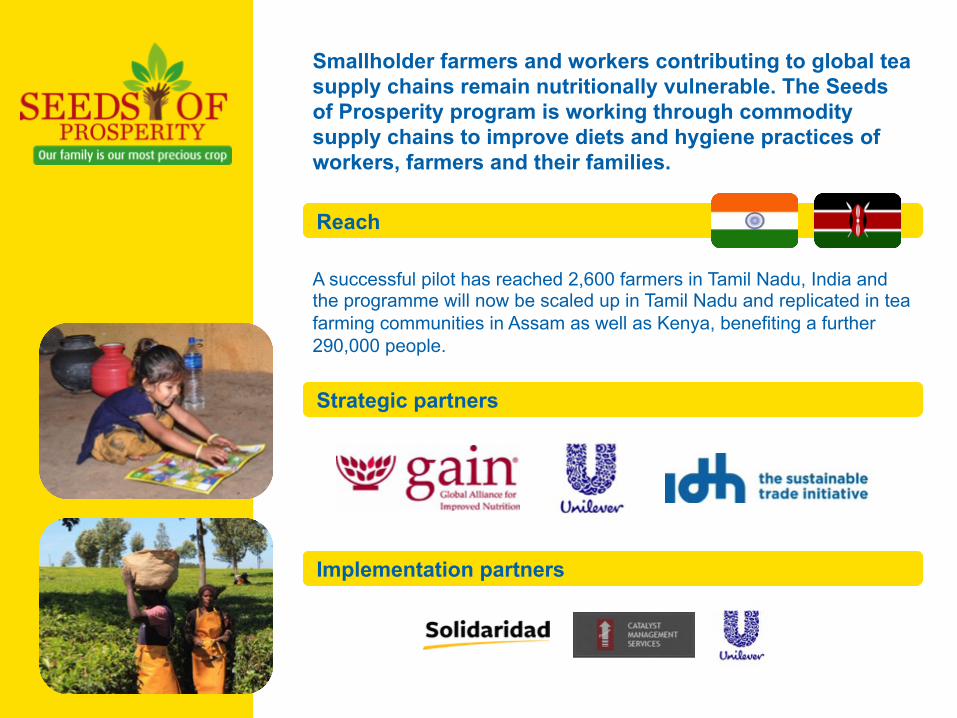
Smallholder farmers and workers contributing to global tea supply chains remain nutritionally vulnerable. The Seeds of Prosperity program is working through commodity supply chains to improve diets and hygiene practices of workers, farmers and their families.
Reach
Strategic partners
A successful pilot has reached 2,600 farmers in Tamil Nadu, India and the programme will now be scaled up in Tamil Nadu and replicated in tea farming communities in Assam as well as Kenya, benefiting a further 290,000 people.
Implementation partners
- 3 -
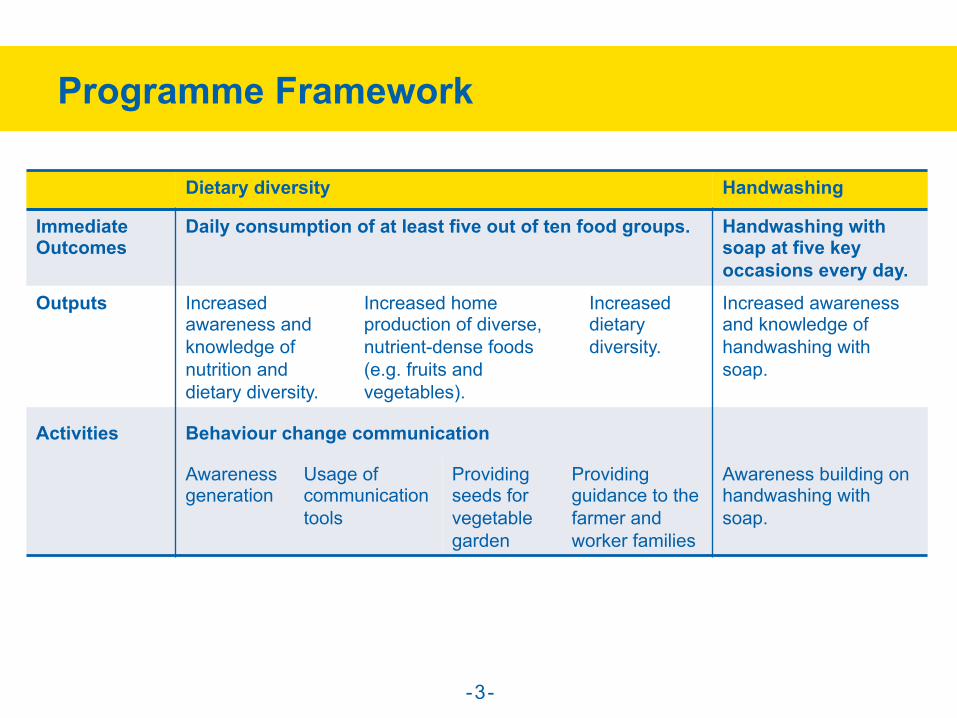
Programme Framework
Dietary diversity Handwashing
Immediate Outcomes
Daily consumption of at least five out of ten food groups. Handwashing with soap at five key occasions every day.
Outputs Increased awareness and knowledge of nutrition and dietary diversity.
Increased home production of diverse, nutrient-dense foods (e.g. fruits and vegetables).
Increased dietary diversity.
Increased awareness and knowledge of handwashing with soap.
Activities Behaviour change communication
Awareness generation
Usage of communication tools
Providing seeds for vegetable garden
Providing guidance to the farmer and worker families
Awareness building on handwashing with soap.

- 4 -
Pilot Study Results - Tamil Nadu
26% 33%
67% 57%
0%
20%
40%
60%
80%
100%
Treatment Comparison
All Baseline Endline
+41% +24%
+17% Percentage of women meeting the MDD-W
2,600 The Minimum Dietary Diversity for Women (MDD-W), defined as a dietary diversity score of at least five out of ten food groups, is used as a proxy indicator to reflect the micronutrient adequacy of women’s diets.
indicates that the program is likely to positively affect their decision to stay with the tea estate or factory.
increase in the number of households which grew vegetables in home-gardens.
of tea growers washing their hands before lunch daily, compared to 51% of growers in the comparison group.
Treatment Comparison
Baseline – Dec 2015 309 309
Endline – Apr 2016 206 208
Drop-out rate 33% 33%
farmers and workers reached
Companies can report to SDG Indicator 2 and 6 (Dietary Diversity and Handwashing).
98%
41%
78%
- 5 -
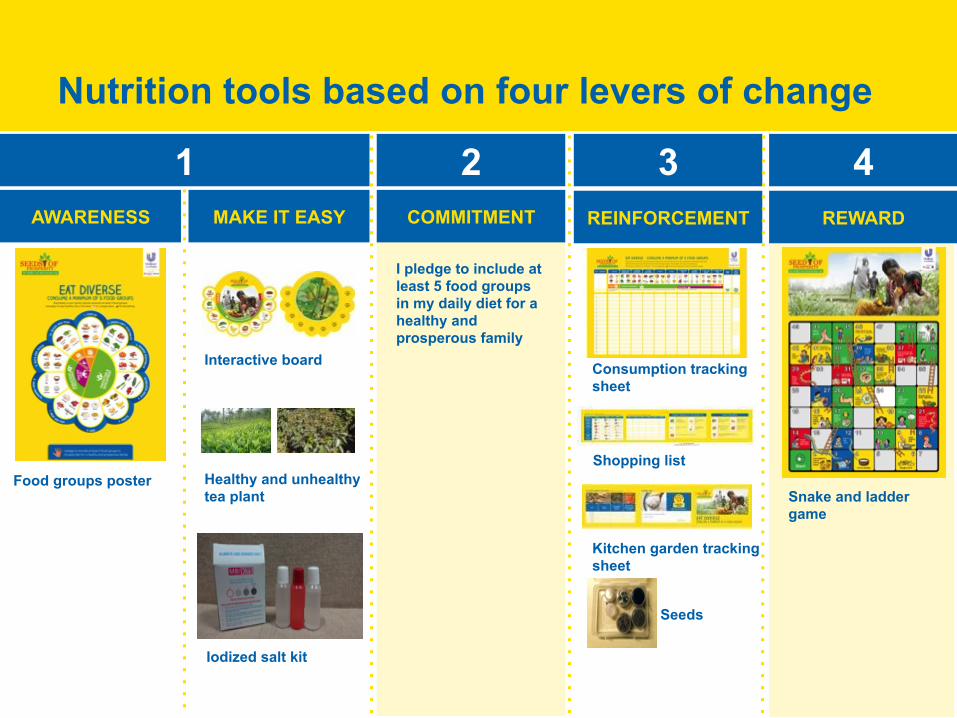
AWARENESS MAKE IT EASY COMMITMENT REINFORCEMENT REWARD
1 2 3 4
Food groups poster
Interactive board
I pledge to include at least 5 food groups in my daily diet for a healthy and prosperous family
Consumption tracking sheet
Snake and ladder game
Healthy and unhealthy tea plant
Shopping list
Kitchen garden tracking sheet
Nutrition tools based on four levers of change
Iodized salt kit
Seeds

- 6 -
Benefits on all levels are interlinked
Improved dietary quality
Loyalty and trust
Satisfaction
More energy to work
Brand reputation Beyond certification
Happy consumers
Less absenteeism
Improved knowledge
and awareness of nutrition
and hygiene
Report on Sustainable Development Goals
Tea sector is front runner in nutrition
Farmers & workers
Supplier
Unilever
Tea sector
Perceived productivity
- 7 -
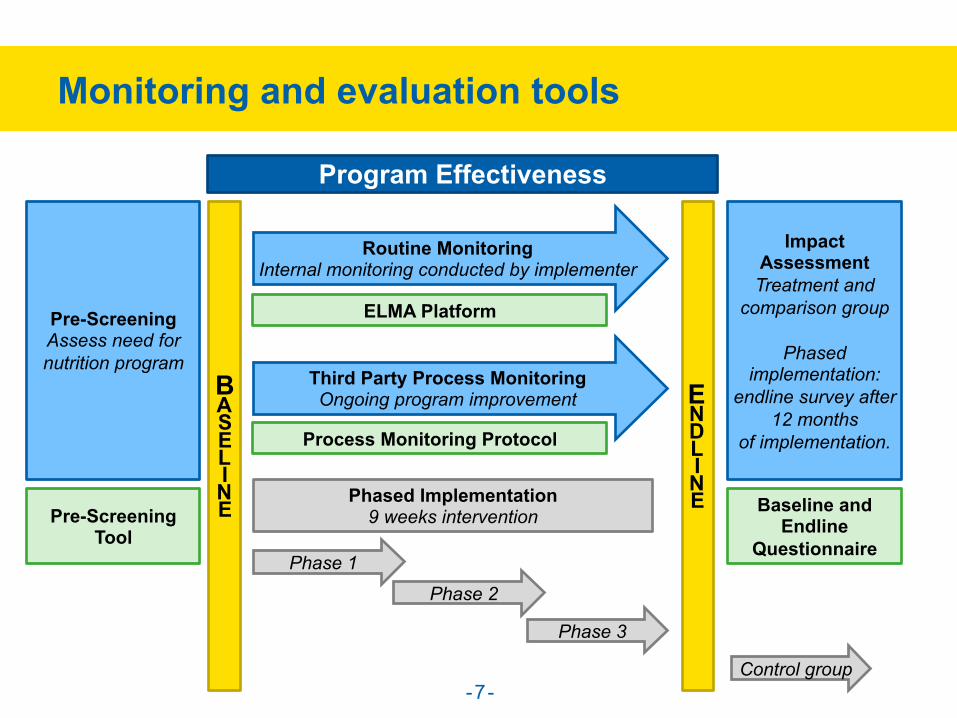
BASELINE
ENDLINE
Third Party Process Monitoring Ongoing program improvement
Program Effectiveness
Routine Monitoring Internal monitoring conducted by implementer
Monitoring and evaluation tools
Impact Assessment Treatment and
comparison group
Phased implementation:
endline survey after 12 months
of implementation.
Pre-Screening Assess need for nutrition program
Phase 2
Phase 3
Control group
Phase 1
Phased Implementation 9 weeks intervention
ELMA Platform
Process Monitoring Protocol
Baseline and Endline
Questionnaire Pre-Screening
Tool

- 8 -
Vision for the future
Vision for the future
Interest from the tea sector Interest from other sectors
• Improve upon this model with more sound evidence around not only the impact but the indicators along the pathway to impact and their role in any outcome seen
• Strengthen and standardize program implementation for relevance across contexts and value chains.
• Examine more points along the outcomes from knowledge generation to behavior change and over a longer period of time.
• Scale up to other value chains and other tea origins.
Cocoa Ghana and Ivory Coast Horticulture Kenya
Palm oil Indonesia Coffee India
India Kenya
- 9 -
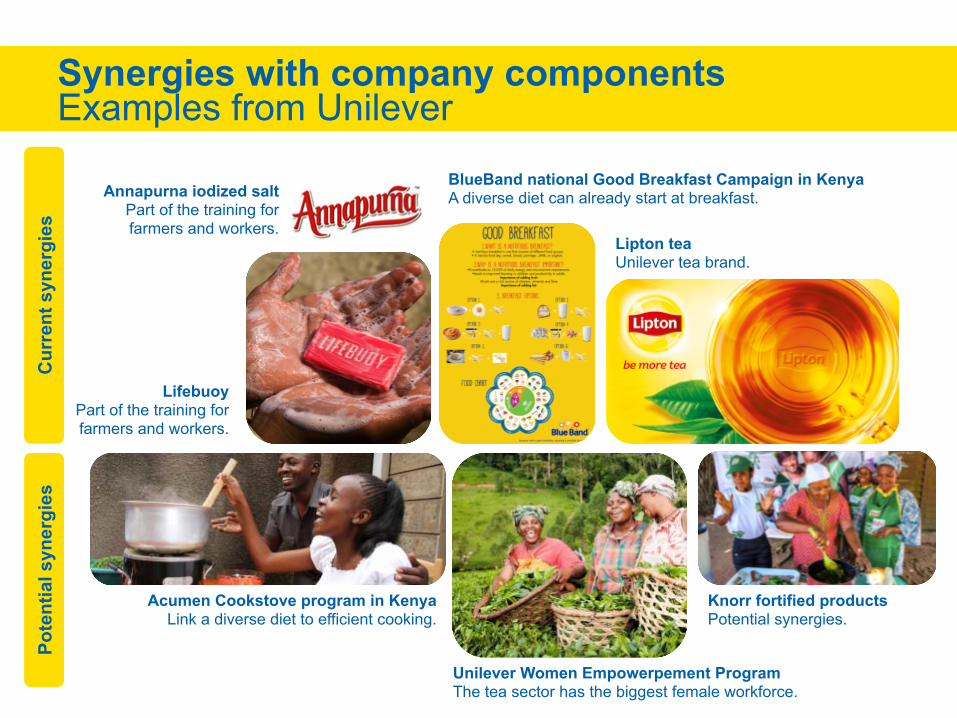
Synergies with company components Examples from Unilever
Annapurna iodized salt Part of the training for farmers and workers.
BlueBand national Good Breakfast Campaign in Kenya A diverse diet can already start at breakfast.
Lifebuoy Part of the training for farmers and workers.
Acumen Cookstove program in Kenya Link a diverse diet to efficient cooking.
Unilever Women Empowerpement Program The tea sector has the biggest female workforce.
Knorr fortified products Potential synergies.
Cur
rent
syn
ergi
es
Pote
ntia
l syn
ergi
es
Lipton tea Unilever tea brand.

- 10 -
Film

GAIN Mirjam Kneepkens, Msc Junior Associate Cash Crop Value Chains [email protected] +31 6 25 37 82 78 Dr. Bärbel Weiligmann Special Advisor for Global Value Chains [email protected] +31 6 42 25 96 24 Christina Nyhus Dhillon, PhD, MPH Consultant, International Nutrition Programs & Research [email protected] +41 768 22 36 21
IDH Judith Fraats Program Manager Tea [email protected] +31 6 14 39 34 13 Unilever Buks Akinseye Global Partnerships & Advocacy Manager, Livelihoods [email protected] +31 6 29 93 98 02

Annex
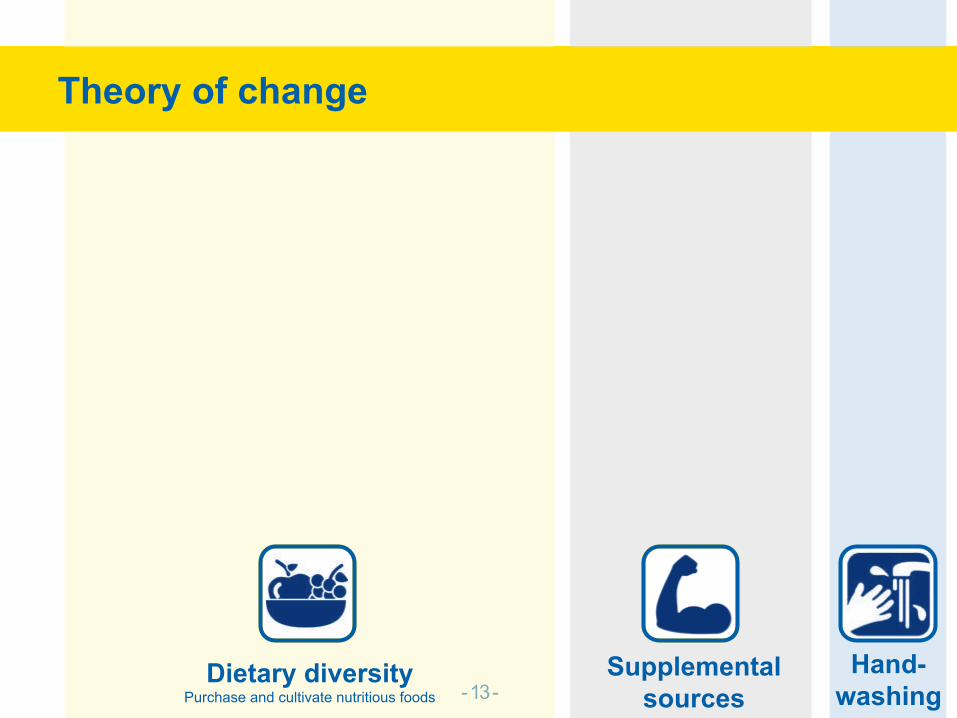
- 13 - Dietary diversity
Purchase and cultivate nutritious foods Supplemental
sources Hand-
washing
Theory of change

- 14 -
Increased dietary diversity and intake of more nutrient dense foods
Increased purchase / acquisition of diverse nutritious foods
Improved dietary quality and nutrient intake adequacy sustained among farming households.
Increased awareness and knowledge of nutrition and dietary diversity
Trial and use of BCC materials
Participate in BCC on dietary diversity (education and materials)
Receive materials to support and reinforce BCC for dietary diversity
Increased home production of diverse, nutrient-dense foods (e.g. fruits and vegetables)
Increased awareness and knowledge of nutrition and dietary diversity
Motivation to grow own fruits and vegetables
Participate in BCC on home gardening
Receive tracking materials and seeds for vegetables or fruit
Increased utilization fortified foods
Increased knowledge of importance of key nutrients
Motivation to utilize fortified foods
Participate in BCC for use of fortified foods
Receive or have access to adequate amounts fortified foods
Increase intake of key nutrients from fortified sources
Increased frequency of handwashing
Increased awareness and knowledge of handwashing
Participate in BCC on handwashing
Improved hygiene and decreased cross-contamination.
Decreased morbidity
Out
puts
Im
med
iate
out
com
es
Increased worker satisfaction
Improved nutritional status and reduction of health costs
Decreased absenteeism and increased productivity
Inte
rmed
iate
ou
tcom
es
Impa
ct
Production or procurement of fortified food to specifications
Outreach trainers trained and knowledgeable of BCC
Act
iviti
es Development of
locally appropriate BCC materials (based on Lifebuoy)
Design and implement BCC campaign activities
Promote home gardening (access to seeds, BCC)
Promote purchase of a diverse diet (shopping list)
Establish fortification process with estate-owned mills
Identify suppliers and facilitate procurement process for fortified staples
Design and implement BCC campaign activities
Dietary diversity Purchase and cultivate nutritious foods
Supplemental sources
Hand- washing

- 15 -
Increased dietary diversity The Minimum Dietary Diversity for Women, defined as at least five of the ten food groups, is used as a proxy indicator to reflect likelihood of micronutrient adequacy of diets of women of reproductive age (15-49 years).
Indicators
Improved Handwashing Handwashing with soap helps maintain health and prevent spread of diseases. Measured as….
Indicator SDG target 2 Indicator SDG target 6
Farmers and workers receive a weekly training for 9 weeks. The first five weeks focus on nutrition and the last four weeks focus on hygiene.

- 16 -
Pledge to handwashing at key occasions
Repeated practice of the behavior
Positive strokes for practicing the
behaviour
(MAKE IT EASY) Why is handwashing
important?
Translated to Dietary Diversity
AWARENESS REINFORCEMENT COMMITMENT REWARD
Make farmers pledge to eat 5 food groups a
day
Make farmers repeat this every day!
(Provide incentives)
Give rewards / incentives to keep
farmers to feel emotional bond to the
behavior
(MAKE IT EASY) Raise awareness why
good nutrition is important
AWARENESS REINFORCEMENT COMMITMENT REWARD
Lifebuoy approach
Translating a Successful Approach to Nutrition
Agricultural supply chain
MASTER TRAINERS
FIELD OFFICERS
FARMERS
SUPPLIER
MASTER TRAINERS
WORKERS
SUPPLIER

- 17 -
Value of the program for tea workers and farmers
Program satisfaction 98% of participants felt the program was extremely valuable to them Loyalty to tea estates / factories 98% indicating that the program was likely to affect their decision to continue with the same tea estate or factory Overall, the program was positively received Estate workers, the most vulnerable group, benefited more than growers or land owners.
- 18 -
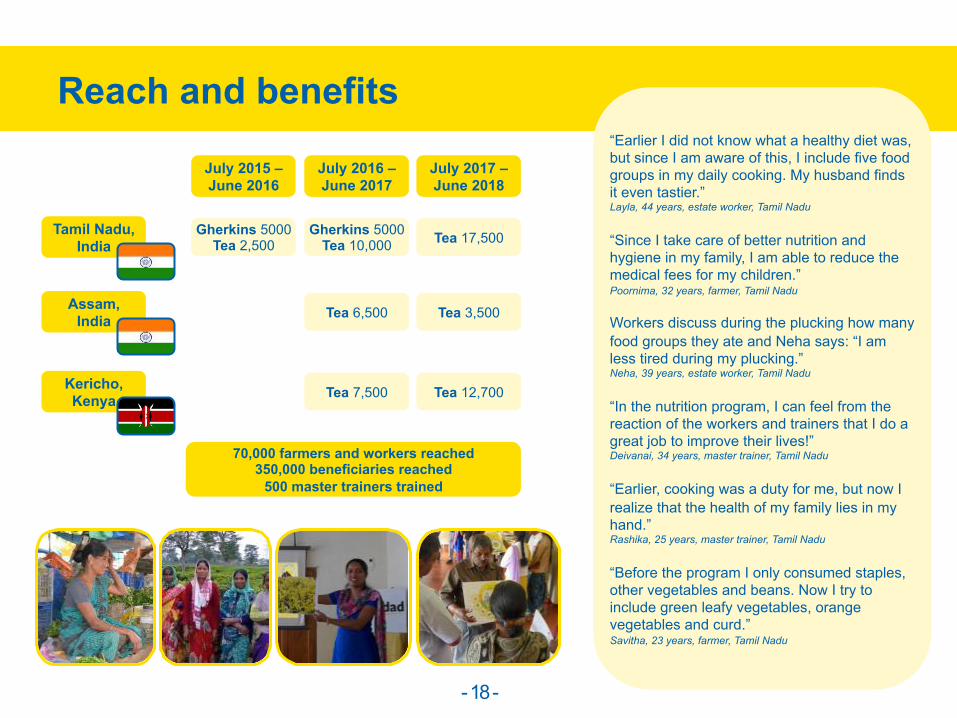
Reach and benefits
July 2016 – June 2017
July 2017 – June 2018
Gherkins 5000 Tea 10,000 Tea 17,500
70,000 farmers and workers reached 350,000 beneficiaries reached
500 master trainers trained
July 2015 – June 2016
“Earlier I did not know what a healthy diet was, but since I am aware of this, I include five food groups in my daily cooking. My husband finds it even tastier.” Layla, 44 years, estate worker, Tamil Nadu “Since I take care of better nutrition and hygiene in my family, I am able to reduce the medical fees for my children.” Poornima, 32 years, farmer, Tamil Nadu Workers discuss during the plucking how many food groups they ate and Neha says: “I am less tired during my plucking.” Neha, 39 years, estate worker, Tamil Nadu “In the nutrition program, I can feel from the reaction of the workers and trainers that I do a great job to improve their lives!” Deivanai, 34 years, master trainer, Tamil Nadu “Earlier, cooking was a duty for me, but now I realize that the health of my family lies in my hand.” Rashika, 25 years, master trainer, Tamil Nadu “Before the program I only consumed staples, other vegetables and beans. Now I try to include green leafy vegetables, orange vegetables and curd.” Savitha, 23 years, farmer, Tamil Nadu
Gherkins 5000 Tea 2,500
Tamil Nadu, India
Tea 6,500 Tea 3,500 Assam, India
Tea 7,500 Tea 12,700 Kericho, Kenya

- 19 -
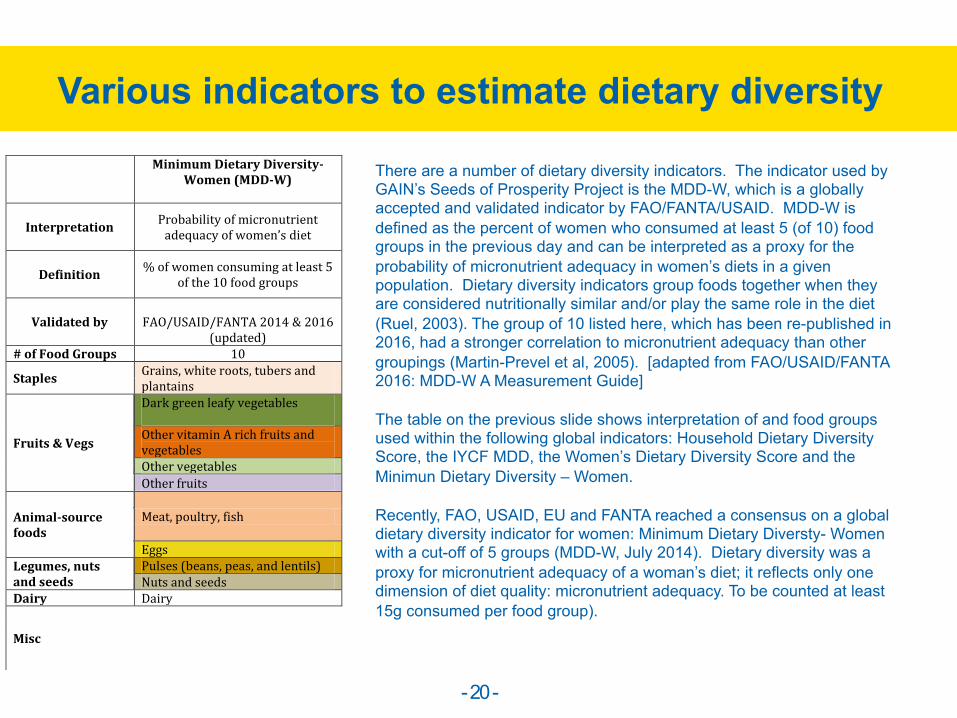
Various indicators to estimate dietary diversity
HouseholdDietaryDiversityScore(HDDS)
InfantandYoungChildFeeding-MinimumDietaryDiversity(IYCF
MDD)
Women’sDietaryDiversityScore(WDDS)
MinimumDietaryDiversity-Women(MDD-W)
InterpretationEconomicaccessto
kilocaloriespercapitainahhd
AdequacyofmicronutrientdensityofIYCdiets
Probabilityofmicronutrientadequacyofwomen’sdiet
Probabilityofmicronutrientadequacyofwomen’sdiet
Definitionthenumberofdifferentfood
groups
%ofchildrenconsumingatleast4ofthe7foodgroups
Score:averagenumberoffoodgroupsconsumedbywomen
%ofwomenconsumingatleast5ofthe10foodgroups
Validatedby USAID/FANTA2006FAO2011 WHO2008 FAO2011
FAO/USAID/FANTA2014&2016
(updated)#ofFoodGroups 12 7 9 10
Staples Cereals Grains,roots,tubers Starchystaples Grains,whiteroots,tubersandplantainsWhiteRoots,tubers
Fruits&VegsVegetables VitaminArichfruitsandvegetables
DarkGreenleafyvegetables Darkgreenleafyvegetables
OthervitaminArichfruitsandvegetables
OthervitaminArichfruitsandvegetables
Fruits Otherfruitsandvegetables OthervegetablesOtherfruitsandvegetables Otherfruits
Animal-sourcefoods
Meat Fleshfoods(meat,fish,poultryandorganmeat)
OrganmeatMeat,poultry,fishMeatandFishFish&otherseafood
Eggs Eggs Eggs EggsLegumes,nutsandseeds Legumes,nutsandseeds Legumesandnuts Legumes,nutsandseeds Pulses(beans,peas,andlentils)
NutsandseedsDairy Milkandmilkproducts Dairyproducts Milkandmilkproducts Dairy
Misc
OilsandfatsSweetsSpices,condimentsandbeverages
- 20 -
Various indicators to estimate dietary diversity
HouseholdDietaryDiversityScore(HDDS)
InfantandYoungChildFeeding-MinimumDietaryDiversity(IYCF
MDD)
Women’sDietaryDiversityScore(WDDS)
MinimumDietaryDiversity-Women(MDD-W)
InterpretationEconomicaccessto
kilocaloriespercapitainahhd
AdequacyofmicronutrientdensityofIYCdiets
Probabilityofmicronutrientadequacyofwomen’sdiet
Probabilityofmicronutrientadequacyofwomen’sdiet
Definitionthenumberofdifferentfood
groups
%ofchildrenconsumingatleast4ofthe7foodgroups
Score:averagenumberoffoodgroupsconsumedbywomen
%ofwomenconsumingatleast5ofthe10foodgroups
Validatedby USAID/FANTA2006FAO2011 WHO2008 FAO2011
FAO/USAID/FANTA2014&2016
(updated)#ofFoodGroups 12 7 9 10
Staples Cereals Grains,roots,tubers Starchystaples Grains,whiteroots,tubersandplantainsWhiteRoots,tubers
Fruits&VegsVegetables VitaminArichfruitsandvegetables
DarkGreenleafyvegetables Darkgreenleafyvegetables
OthervitaminArichfruitsandvegetables
OthervitaminArichfruitsandvegetables
Fruits Otherfruitsandvegetables OthervegetablesOtherfruitsandvegetables Otherfruits
Animal-sourcefoods
Meat Fleshfoods(meat,fish,poultryandorganmeat)
OrganmeatMeat,poultry,fishMeatandFishFish&otherseafood
Eggs Eggs Eggs EggsLegumes,nutsandseeds Legumes,nutsandseeds Legumesandnuts Legumes,nutsandseeds Pulses(beans,peas,andlentils)
NutsandseedsDairy Milkandmilkproducts Dairyproducts Milkandmilkproducts Dairy
Misc
OilsandfatsSweetsSpices,condimentsandbeverages
There are a number of dietary diversity indicators. The indicator used by GAIN’s Seeds of Prosperity Project is the MDD-W, which is a globally accepted and validated indicator by FAO/FANTA/USAID. MDD-W is defined as the percent of women who consumed at least 5 (of 10) food groups in the previous day and can be interpreted as a proxy for the probability of micronutrient adequacy in women’s diets in a given population. Dietary diversity indicators group foods together when they are considered nutritionally similar and/or play the same role in the diet (Ruel, 2003). The group of 10 listed here, which has been re-published in 2016, had a stronger correlation to micronutrient adequacy than other groupings (Martin-Prevel et al, 2005). [adapted from FAO/USAID/FANTA 2016: MDD-W A Measurement Guide] The table on the previous slide shows interpretation of and food groups used within the following global indicators: Household Dietary Diversity Score, the IYCF MDD, the Women’s Dietary Diversity Score and the Minimun Dietary Diversity – Women. Recently, FAO, USAID, EU and FANTA reached a consensus on a global dietary diversity indicator for women: Minimum Dietary Diversty- Women with a cut-off of 5 groups (MDD-W, July 2014). Dietary diversity was a proxy for micronutrient adequacy of a woman’s diet; it reflects only one dimension of diet quality: micronutrient adequacy. To be counted at least 15g consumed per food group).