NUTRITION OF CHILDREN AND WOMEN - Sri Lanka · Nutrition of Children and Women 157 ... about...
28
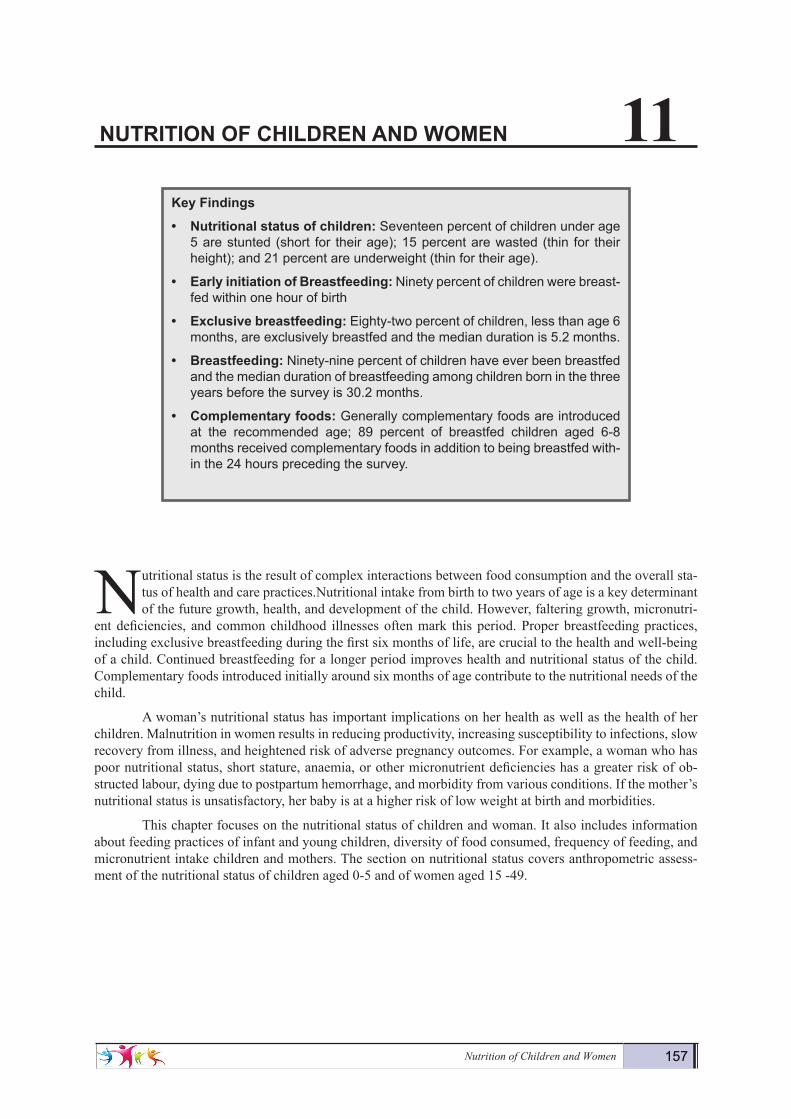
Nutrition of Children and Women 157 NUTRITION OF CHILDREN AND WOMEN 11 N utritional status is the result of complex interactions between food consumption and the overall sta- tus of health and care practices.Nutritional intake from birth to two years of age is a key determinant of the future growth, health, and development of the child. However, faltering growth, micronutri- ent deficiencies, and common childhood illnesses often mark this period. Proper breastfeeding practices, including exclusive breastfeeding during the first six months of life, are crucial to the health and well-being of a child. Continued breastfeeding for a longer period improves health and nutritional status of the child. Complementary foods introduced initially around six months of age contribute to the nutritional needs of the child. A woman’s nutritional status has important implications on her health as well as the health of her children. Malnutrition in women results in reducing productivity, increasing susceptibility to infections, slow recovery from illness, and heightened risk of adverse pregnancy outcomes. For example, a woman who has poor nutritional status, short stature, anaemia, or other micronutrient deficiencies has a greater risk of ob- structed labour, dying due to postpartum hemorrhage, and morbidity from various conditions. If the mother’s nutritional status is unsatisfactory, her baby is at a higher risk of low weight at birth and morbidities. This chapter focuses on the nutritional status of children and woman. It also includes information about feeding practices of infant and young children, diversity of food consumed, frequency of feeding, and micronutrient intake children and mothers. The section on nutritional status covers anthropometric assess- ment of the nutritional status of children aged 0-5 and of women aged 15 -49. Key Findings • Nutritional status of children: Seventeen percent of children under age 5 are stunted (short for their age); 15 percent are wasted (thin for their height); and 21 percent are underweight (thin for their age). • Early initiation of Breastfeeding: Ninety percent of children were breast- fed within one hour of birth • Exclusive breastfeeding: Eighty-two percent of children, less than age 6 months, are exclusively breastfed and the median duration is 5.2 months. • Breastfeeding: Ninety-nine percent of children have ever been breastfed and the median duration of breastfeeding among children born in the three years before the survey is 30.2 months. • Complementary foods: Generally complementary foods are introduced at the recommended age; 89 percent of breastfed children aged 6-8 months received complementary foods in addition to being breastfed with- in the 24 hours preceding the survey.
Transcript of NUTRITION OF CHILDREN AND WOMEN - Sri Lanka · Nutrition of Children and Women 157 ... about...
Nutrition of Children and Women 157
NUTRITION OF CHILDREN AND WOMEN 11
Nutritional status is the result of complex interactions between food consumption and the overall sta-tus of health and care practices.Nutritional intake from birth to two years of age is a key determinant of the future growth, health, and development of the child. However, faltering growth, micronutri-
ent deficiencies, and common childhood illnesses often mark this period. Proper breastfeeding practices, including exclusive breastfeeding during the first six months of life, are crucial to the health and well-being of a child. Continued breastfeeding for a longer period improves health and nutritional status of the child. Complementary foods introduced initially around six months of age contribute to the nutritional needs of the child.
A woman’s nutritional status has important implications on her health as well as the health of her children. Malnutrition in women results in reducing productivity, increasing susceptibility to infections, slow recovery from illness, and heightened risk of adverse pregnancy outcomes. For example, a woman who has poor nutritional status, short stature, anaemia, or other micronutrient deficiencies has a greater risk of ob-structed labour, dying due to postpartum hemorrhage, and morbidity from various conditions. If the mother’s nutritional status is unsatisfactory, her baby is at a higher risk of low weight at birth and morbidities.
This chapter focuses on the nutritional status of children and woman. It also includes information about feeding practices of infant and young children, diversity of food consumed, frequency of feeding, and micronutrient intake children and mothers. The section on nutritional status covers anthropometric assess-ment of the nutritional status of children aged 0-5 and of women aged 15 -49.
Key Findings
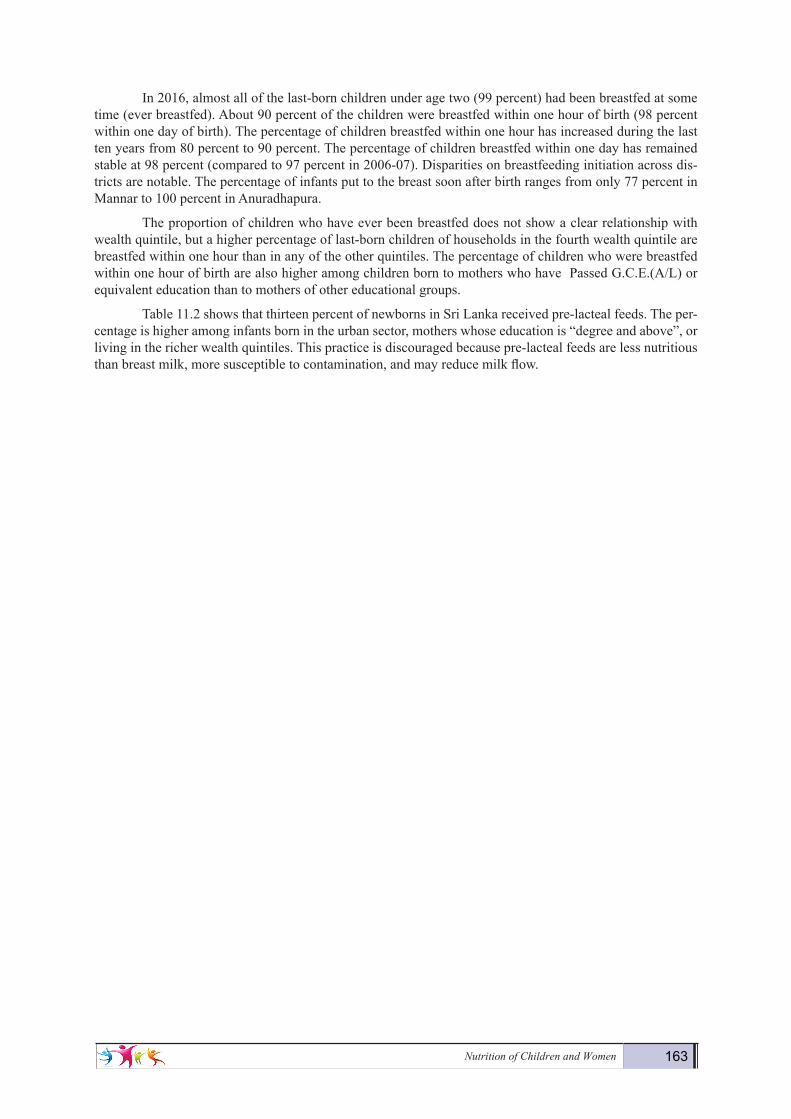
• Nutritionalstatusofchildren: Seventeen percent of children under age 5 are stunted (short for their age); 15 percent are wasted (thin for their height); and 21 percent are underweight (thin for their age).
• EarlyinitiationofBreastfeeding:Ninety percent of children were breast-fed within one hour of birth
• Exclusivebreastfeeding: Eighty-two percent of children, less than age 6 months, are exclusively breastfed and the median duration is 5.2 months.
• Breastfeeding: Ninety-nine percent of children have ever been breastfed and the median duration of breastfeeding among children born in the three years before the survey is 30.2 months.
• Complementaryfoods: Generally complementary foods are introduced at the recommended age; 89 percent of breastfed children aged 6-8 months received complementary foods in addition to being breastfed with-in the 24 hours preceding the survey.
158 Demographic and Health Survey - 2016, Sri Lanka
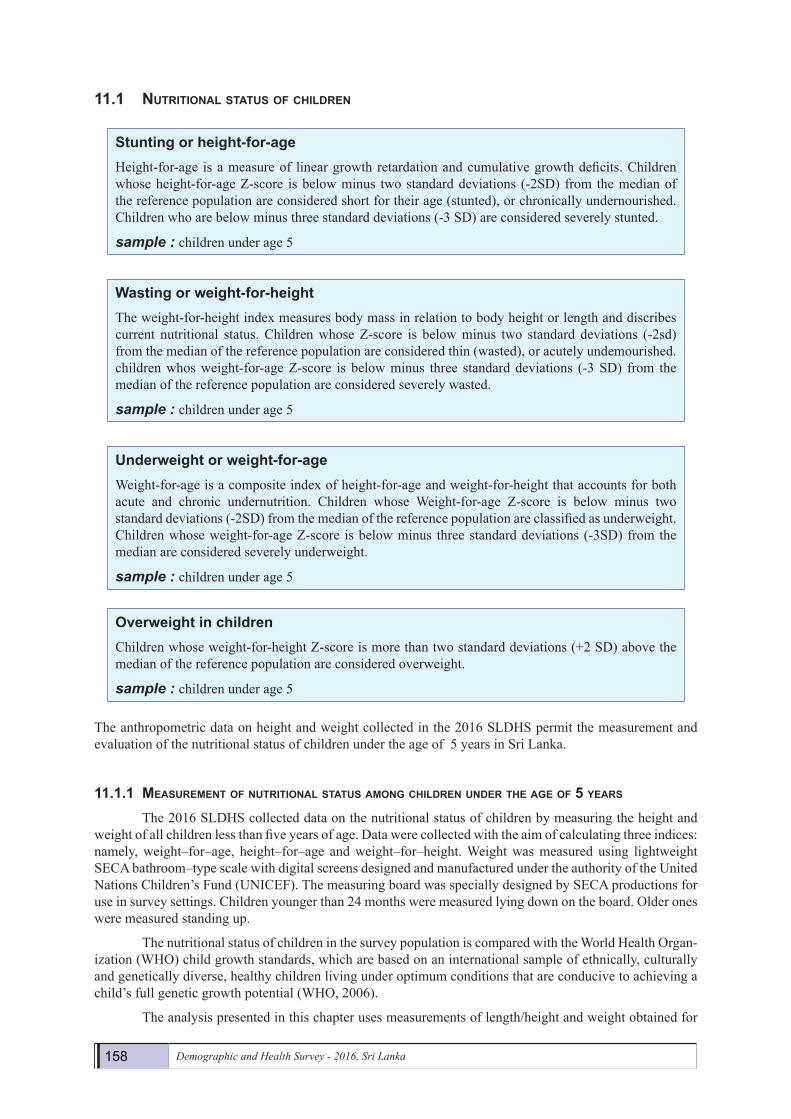
11.1 NutritioNal status of childreN
The anthropometric data on height and weight collected in the 2016 SLDHS permit the measurement and evaluation of the nutritional status of children under the age of 5 years in Sri Lanka.
11.1.1 MeasureMeNt of NutritioNal status aMoNg childreN uNder the age of 5 years
The 2016 SLDHS collected data on the nutritional status of children by measuring the height and weight of all children less than five years of age. Data were collected with the aim of calculating three indices: namely, weight–for–age, height–for–age and weight–for–height. Weight was measured using lightweight SECA bathroom–type scale with digital screens designed and manufactured under the authority of the United Nations Children’s Fund (UNICEF). The measuring board was specially designed by SECA productions for use in survey settings. Children younger than 24 months were measured lying down on the board. Older ones were measured standing up.
The nutritional status of children in the survey population is compared with the World Health Organ-ization (WHO) child growth standards, which are based on an international sample of ethnically, culturally and genetically diverse, healthy children living under optimum conditions that are conducive to achieving a child’s full genetic growth potential (WHO, 2006).
The analysis presented in this chapter uses measurements of length/height and weight obtained for
Stuntingorheight-for-ageHeight-for-age is a measure of linear growth retardation and cumulative growth deficits. Children whose height-for-age Z-score is below minus two standard deviations (-2SD) from the median of the reference population are considered short for their age (stunted), or chronically undernourished. Children who are below minus three standard deviations (-3 SD) are considered severely stunted.
sample : children under age 5
Wastingorweight-for-heightThe weight-for-height index measures body mass in relation to body height or length and discribes current nutritional status. Children whose Z-score is below minus two standard deviations (-2sd) from the median of the reference population are considered thin (wasted), or acutely undemourished. children whos weight-for-age Z-score is below minus three standard deviations (-3 SD) from the median of the reference population are considered severely wasted.
sample : children under age 5
Underweightorweight-for-ageWeight-for-age is a composite index of height-for-age and weight-for-height that accounts for both acute and chronic undernutrition. Children whose Weight-for-age Z-score is below minus two standard deviations (-2SD) from the median of the reference population are classified as underweight. Children whose weight-for-age Z-score is below minus three standard deviations (-3SD) from the median are considered severely underweight.
sample : children under age 5
OverweightinchildrenChildren whose weight-for-height Z-score is more than two standard deviations (+2 SD) above the median of the reference population are considered overweight.
sample : children under age 5
Nutrition of Children and Women 159
all children under age 5 living in the households selected for the 2016 SLDHS sample. The following analysis focuses on the 8,459 children for whom complete and plausible anthropometric and age data measurements were collected.
11.1.2 stuNtiNg
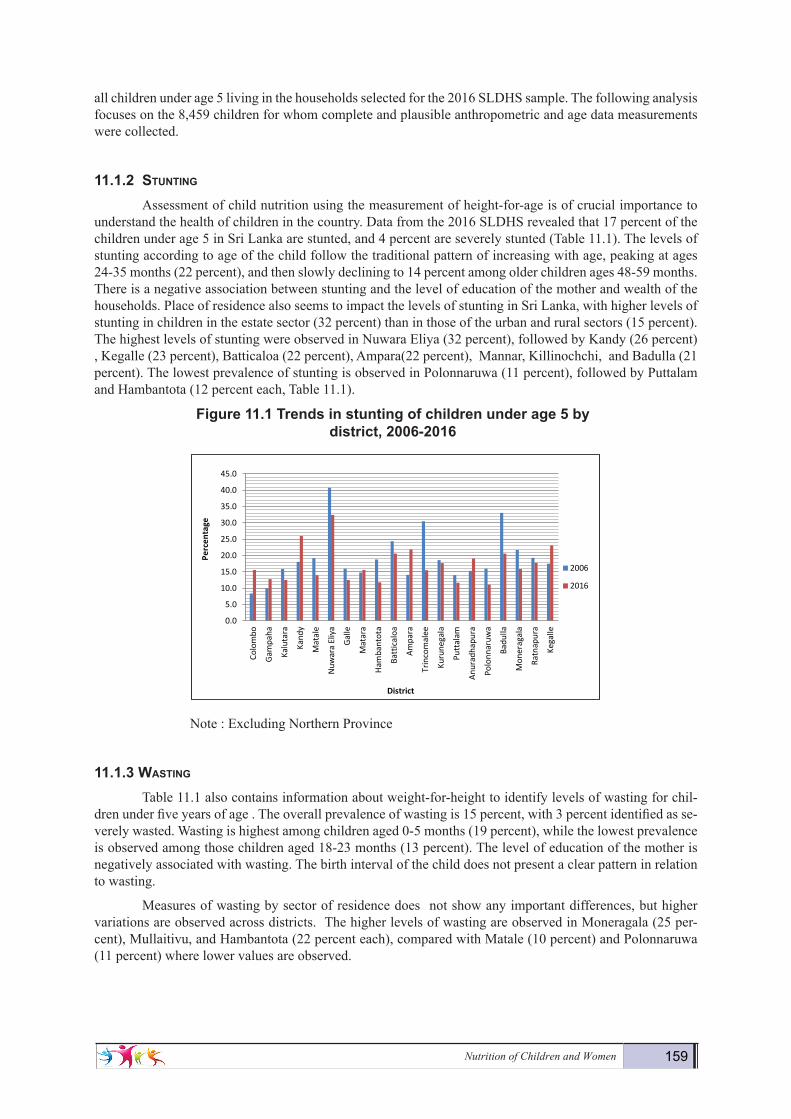
Assessment of child nutrition using the measurement of height-for-age is of crucial importance to understand the health of children in the country. Data from the 2016 SLDHS revealed that 17 percent of the children under age 5 in Sri Lanka are stunted, and 4 percent are severely stunted (Table 11.1). The levels of stunting according to age of the child follow the traditional pattern of increasing with age, peaking at ages 24-35 months (22 percent), and then slowly declining to 14 percent among older children ages 48-59 months.There is a negative association between stunting and the level of education of the mother and wealth of thehouseholds. Place of residence also seems to impact the levels of stunting in Sri Lanka, with higher levels ofstunting in children in the estate sector (32 percent) than in those of the urban and rural sectors (15 percent).The highest levels of stunting were observed in Nuwara Eliya (32 percent), followed by Kandy (26 percent), Kegalle (23 percent), Batticaloa (22 percent), Ampara(22 percent), Mannar, Killinochchi, and Badulla (21percent). The lowest prevalence of stunting is observed in Polonnaruwa (11 percent), followed by Puttalamand Hambantota (12 percent each, Table 11.1).
Figure11.1Trendsinstuntingofchildrenunderage5bydistrict,2006-2016
Note : Excluding Northern Province
11.1.3WastiNg
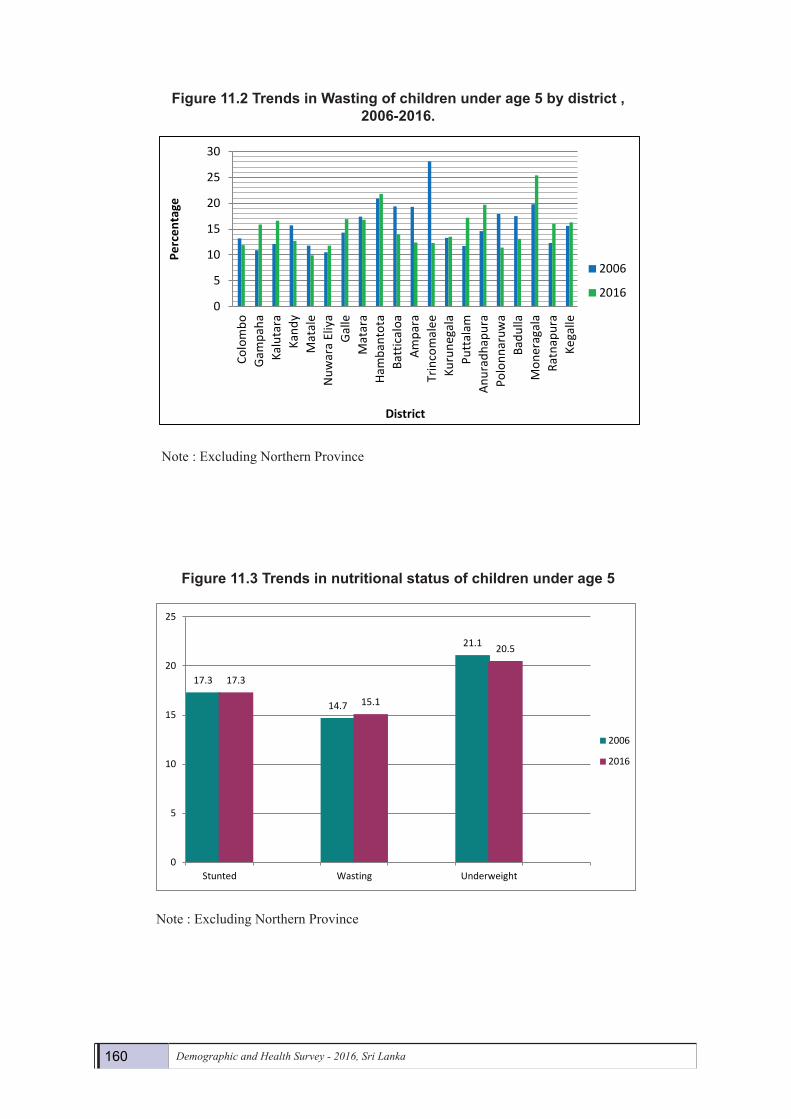
Table 11.1 also contains information about weight-for-height to identify levels of wasting for chil-dren under five years of age . The overall prevalence of wasting is 15 percent, with 3 percent identified as se-verely wasted. Wasting is highest among children aged 0-5 months (19 percent), while the lowest prevalence is observed among those children aged 18-23 months (13 percent). The level of education of the mother is negatively associated with wasting. The birth interval of the child does not present a clear pattern in relation to wasting.
Measures of wasting by sector of residence does not show any important differences, but higher variations are observed across districts. The higher levels of wasting are observed in Moneragala (25 per-cent), Mullaitivu, and Hambantota (22 percent each), compared with Matale (10 percent) and Polonnaruwa (11 percent) where lower values are observed.
0.0
5.0
10.0
15.0
20.0
25.0
30.0
35.0
40.0
45.0
Colo
mbo
Gam
paha
Kalu
tara
Kand
y
Mat
ale
Nuw
ara
Eliy
a
Galle
Mat
ara
Ham
bant
ota
Batt
ical
oa
Ampa
ra
Trin
com
alee
Kuru
nega
la
Putt
alam
Anur
adha
pura
Polo
nnar
uwa
Badu
lla
Mon
erag
ala
Ratn
apur
a
Kega
lle
Perc
enta
ge
District
2006
2016
160 Demographic and Health Survey - 2016, Sri Lanka
Figure11.2TrendsinWastingofchildrenunderage5bydistrict,2006-2016.
Note : Excluding Northern Province
Figure11.3Trendsinnutritionalstatusofchildrenunderage5
Note : Excluding Northern Province
0
5
10
15
20
25
30
Colo
mbo
Gam
paha
Kalu
tara
Kand
yM
atal
eN
uwara
Eliy
aG
alle
Mat
ara
Ham
bant
ota
Batt
ical
oaAm
para
Trin
com
alee
Kuru
nega
laPu
ttal
amAn
urad
hapu
raPo
lonn
aruw
aBa
dulla
Mon
erag
ala
Ratn
apur
aKe
galle
Perc
enta
ge
District
2006
2016
17.3
14.7
21.1
17.3
15.1
20.5
0
5
10
15
20
25
Stunted Wasting Underweight
2006
2016

Nutrition of Children and Women 161Demography and Health Survey - 2016 160
Table 11.1Nutritionalstatusofchildren
Percentage of children under five years classified as malnourished according to three anthropometric indices of nutritional status: height-for-age, weight-for-height, and weight-for-age, by background characteristics, Sri Lanka 2016
Height-for-age1 Weight-for-height Weight-for-age
Background characteristic
Percen-tage
below -3 SD
Percen-tage
below -2 SD2
Mean Z-score
(SD)
Number of
children
Percen-tage
below -3 SD
Percen-tage
below -2 SD2
Percen-tage
above +2 SD
Mean Z-
score (SD)
Number of
children
Percen-tage
below -3 SD
Percen-tage
below -2 SD2
Percen-tage
above +2 SD
Mean Z-score
(SD)
Number of
children
Ageinmonths <6 3.1 11.6 -0.3 613 6.6 19.4 5.3 -0.6 584 4.7 14.8 1.2 -0.8 614 6-8 4.1 16.7 -0.6 396 4.0 15.8 4.1 -0.6 394 2.6 15.9 1.9 -0.8 400 9-11 5.8 15.4 -0.7 370 4.5 15.4 2.2 -0.8 372 3.9 16.3 0.8 -1.0 375 12-17 4.0 18.8 -1.0 747 4.1 14.4 1.5 -0.7 745 3.9 18.4 0.8 -1.0 752 18-23 5.6 21.2 -1.1 771 2.6 13.0 1.3 -0.8 767 5.2 19.8 1.0 -1.2 777 24-35 4.8 21.5 -1.1 1,652 2.2 14.0 0.9 -0.9 1,644 4.3 23.1 0.8 -1.3 1,660 36-47 4.5 16.8 -1.1 1,650 2.7 15.3 1.7 -0.9 1,643 4.1 23.2 0.7 -1.2 1,652 48-59 2.6 13.6 -1.0 1,670 1.9 15.4 2.2 -0.9 1,667 3.2 20.5 1.2 -1.2 1,677
Sex Male 4.7 17.9 -1.0 4,066 3.3 15.4 2.2 -0.9 4,042 3.9 20.5 1.1 -1.1 4,088 Female 3.6 16.6 -0.9 3,804 2.7 14.7 1.7 -0.8 3,775 4.1 20.5 0.9 -1.1 3,821
Birthintervalinmonths3First birth4 3.5 15.5 -0.9 3,027 3.2 13.9 2.2 -0.8 3,007 3.6 19.9 1.2 -1.1 3,041 <24 5.8 17.7 -0.9 380 3.0 17.0 1.7 -0.9 377 4.2 21.2 0.4 -1.2 380 24-47 4.6 19.2 -1.1 1,511 2.9 17.0 1.7 -0.9 1,502 4.5 21.6 1.2 -1.2 1,525 48+ 4.3 18.0 -1.0 2,746 3.0 15.1 2.0 -0.9 2,724 4.2 20.3 0.6 -1.2 2,756
Mother'sinterviewstatus Interviewed 4.1 17.2 -1.0 7,663 3.0 15.1 2.0 -0.8 7,610 4.0 20.4 1.0 -1.1 7,701 Not interviewed but in household 8.6 23.6 -1.0 56 0.5 20.1 0.0 -1.0 57 6.8 29.8 0.0 -1.4 57 Not interviewed and not in the household5 4.4 16.2 -0.9 150 2.6 12.0 1.8 -0.8 150 1.6 19.8 1.8 -1.1 150
Mother'snutritionalstatus6Thin (BMI<18.5) 6.6 22.6 -1.2 814 4.9 24.5 0.8 -1.3 804 7.9 31.5 0.6 -1.5 816 Normal (BMI 18.5-24.9) 4.3 18.1 -1.0 3,415 3.2 15.7 1.7 -0.9 3,409 4.1 22.0 0.6 -1.2 3,440 Overweight/ obese (BMI >= 25) 3.3 15.5 -0.9 2,751 1.9 10.8 2.6 -0.6 2,737 2.9 15.5 1.3 -1.0 2,764
Residence Urban 3.6 14.7 -0.8 1,214 1.6 12.9 2.9 -0.7 1,205 1.9 16.4 1.5 -0.9 1,220 Rural 4.0 17.0 -1.0 6,325 3.2 15.6 1.9 -0.9 6,286 4.2 20.8 0.9 -1.2 6,355 Estate 8.8 31.7 -1.4 332 3.7 13.4 1.3 -0.9 326 7.6 29.7 0.4 -1.5 334
District Colombo 4.3 15.6 -0.7 669 1.7 11.9 2.8 -0.7 667 1.6 14.6 1.9 -0.9 674 Gampaha 2.9 12.8 -0.8 756 2.6 15.9 2.2 -0.8 749 4.1 19.6 1.4 -1.0 756 Kalutara 1.7 12.5 -0.7 497 2.9 16.6 2.1 -0.9 494 2.8 20.1 1.1 -1.0 496 Kandy 5.2 26.0 -1.2 549 2.3 12.7 3.4 -0.7 552 4.9 20.6 2.1 -1.1 559 Matale 2.8 14.0 -1.0 216 1.9 9.9 1.6 -0.8 215 3.1 17.8 0.0 -1.2 216 Nuwara Eliya 10.0 32.4 -1.5 250 3.2 11.8 1.5 -0.7 248 7.8 29.6 0.6 -1.4 250 Galle 3.7 12.5 -0.8 408 2.9 16.9 1.8 -1.0 401 4.7 17.8 0.5 -1.1 410 Matara 3.8 15.6 -0.9 336 2.2 16.8 1.3 -1.0 332 3.9 22.3 0.7 -1.2 337 Hambantota 2.6 11.8 -0.9 216 3.2 21.8 0.5 -1.1 214 5.1 22.4 1.2 -1.2 217 Jaffna 1.5 13.7 -0.8 197 2.2 11.7 0.8 -0.7 196 2.5 13.7 0.2 -1.0 197 Mannar 4.6 20.8 -1.1 41 2.4 13.1 3.5 -0.6 40 5.2 18.2 2.6 -1.1 41 Vavuniya 6.1 18.7 -0.9 64 3.5 16.0 0.6 -0.9 61 4.9 20.3 1.0 -1.2 64 Mullaitivu 6.0 16.7 -0.9 36 3.8 21.6 2.1 -1.0 36 8.5 25.5 1.5 -1.2 37 Killinochchi 6.6 20.9 -1.1 46 3.9 16.8 2.9 -0.8 45 3.1 16.6 0.0 -1.2 46 Batticaloa 3.6 20.6 -1.1 249 2.8 14.0 2.6 -0.9 248 2.8 21.4 1.5 -1.2 250 Ampara 7.2 21.9 -1.1 345 2.3 12.4 2.6 -0.7 342 3.3 18.1 0.7 -1.2 346 Trincomalee 3.5 15.5 -1.0 188 2.4 12.3 1.0 -1.0 184 5.8 22.7 0.4 -1.3 188 Kurunegala 2.0 17.7 -1.0 685 2.3 13.5 1.0 -0.9 683 3.3 21.9 0.4 -1.2 686 Puttalam 2.9 11.7 -0.7 276 6.5 17.2 2.5 -0.9 275 2.9 20.1 1.9 -1.0 276 Anuradhapura 5.9 19.1 -1.1 409 6.0 19.7 3.7 -0.8 404 6.1 24.7 0.8 -1.2 411 Polonnaruwa 3.0 11.1 -0.8 185 2.1 11.4 2.7 -0.9 184 2.3 18.7 1.0 -1.1 185 Badulla 6.5 20.6 -1.2 293 2.6 13.1 1.4 -0.9 294 5.2 22.6 0.0 -1.3 297 Moneragala 3.5 15.9 -0.7 244 5.3 25.4 0.4 -1.2 240 4.9 24.2 0.0 -1.3 244 Ratnapura 4.0 17.8 -1.1 440 3.7 16.0 1.0 -0.9 436 4.5 22.9 0.4 -1.2 446 Kegalle 8.4 23.1 -1.2 275 4.2 16.3 2.2 -0.8 275 4.5 19.9 0.8 -1.2 280
Mother'seducation No education 17.5 37.6 -1.6 58 1.6 17.9 0.0 -1.0 58 6.9 33.9 0.0 -1.6 58 Passed Grade 1-5 8.4 27.2 -1.4 277 4.1 17.6 1.4 -0.9 275 8.5 30.2 0.9 -1.5 278 Passed Grade 6-10 5.0 20.3 -1.1 3,368 3.7 17.5 1.7 -0.9 3,349 5.2 24.6 0.5 -1.3 3,387 Passed G.C.E.(O/L) or equivalent 3.4 15.9 -0.9 1,705 2.5 14.9 2.6 -0.8 1,690 3.6 18.6 1.4 -1.1 1,713 Passed G.C.E.(A/L) or equivalent 2.8 12.2 -0.7 1,868 2.4 12.2 1.9 -0.8 1,853 2.1 15.4 1.2 -0.9 1,878 Degree and above 1.3 12.1 -0.6 444 2.0 8.7 2.8 -0.6 442 2.2 10.0 1.8 -0.7 445
Wealthquintile Lowest 6.2 25.2 -1.3 1,595 3.6 17.3 1.5 -1.0 1,584 6.9 27.6 0.5 -1.4 1,599 Second 5.4 18.9 -1.1 1,620 4.3 18.3 1.6 -1.0 1,601 5.4 24.5 0.7 -1.3 1,625 Middle 3.3 15.9 -0.9 1,578 3.3 15.0 1.8 -0.9 1,572 3.4 20.9 0.5 -1.1 1,590 Fourth 3.4 14.0 -0.8 1,679 2.2 14.1 2.2 -0.8 1,669 2.1 16.1 1.4 -1.0 1,690 Highest 2.3 11.7 -0.6 1,397 1.5 10.0 3.2 -0.6 1,390 2.1 12.5 1.8 -0.7 1,404
Total 4.1 17.3 -1.0 7,870 3.0 15.1 2.0 -0.8 7,817 4.0 20.5 1.0 -1.1 7,908 Note: Table is based on children who stayed in the household on the night before the interview. Each of the indices is expressed in standard deviation units (SD) from the median of the WHO Child Growth Standards adopted in 2006. The indices in this table are NOT comparable to those based on the previously used NCHS/CDC/WHO reference. Table is based on children with valid dates of birth (month and year) and valid measurement of both height and weight. 1 Recumbent length is measured for children under age 2, or in the few cases when the age of the child is unknown and the child is less than 85 cm; standing height is measured for all other children. 2 Includes children who are below -3 standard deviations (SD) from the WHO Child Growth standards population median 3 Excludes children whose mothers were not interviewed 4 First-born twins (triplets, etc.) are counted as first births because they do not have a previous birth interval 5 Includes children whose mothers are deceased 6 Excludes children whose mothers were not weighed and measured, children whose mothers were not interviewed, and children whose mothers are pregnant or gave birth within the preceding 2 months. Mother's nutritional status in terms of BMI (Body Mass Index) is presented in Table 11.10. 7 For women who are not interviewed, information is taken from the Household Questionnaire. Excludes children whose mothers are not listed in the Household Questionnaire

162 Demographic and Health Survey - 2016, Sri Lanka
11.1.4 uNderWeight
The 2016 SLDHS includes a third indicator for assessing malnutrition among children under five years of age which identified 21 percent of children as of low weight or underweight for their age, and 4 percent as severely underweight. (Table11.1) Similar to the measurements for stunting and wasting, under-weight percentages increase with the age of the child, the highest level at 36-47 months of age (23 percent). Differences in the percentage of underweight children by sex, birth interval of the child,level of education, nutritional status of the mother and wealth quintiles are similar to those previously observed and described for stunting and wasting.
Place of residence again shows some interesting differences as with stunting, children living in the estate sector (30 percent) haveing a much higher prevalence of underweight than their counterparts in the urban and rural sectors (21 percent ,16 percent,respectively).Table 11.1, also reveals some differences in underweight across administrative districts. Children in Nuwara Eliya have the highest level of underweight (30 percent), followed by Mullaitivu (26 percent), Anuradhapura (25 percent) and Moneragala (24 percent). The lower levels of underweight children are observed in Jaffna (14 percent) and in Colombo (15 percent).
Figure11.4Comparisionofunderweightofchildrenunderage5byDistrict,2006and2016
Note : Excluding Northern Province
11.2 iNitiatioN of breastfeediNg
Feeding practices play a pivotal role in determining the optimal growth and development of infants. Poor breastfeeding and undesirable complementary feeding practices have adverse consequences for the health and nutritional status of children which could affect their mental and physical development. Exclusive breastfeeding also affects mothers by physiologically suppressing the return of fertility, thereby contribute to lengthening the interval between pregnancies. The pattern of feeding a child has an important influence on both the child and the mother and is one of the key determinants of a child’s nutritional status.
Early breastfeeding practices determine the successful establishment and duration of breastfeeding. Moreover, during the first three days after delivery, colostrum, an important source of nutrition and protection for the newborn, is produced and should be given to the newborn while awaiting the let-down of regular/mature breast milk. Thus, it is recommended that children be put to the breast immediately or within one hour after birth, while discouraging pre-lacteal feeding (i.e. feeding newborns anything other than breast milk before early breastfeeding is initiated).
0.0
5.0
10.0
15.0
20.0
25.0
30.0
35.0
Colo
mbo
Gam
paha
Kalu
tara
Kand
yM
atal
eN
uwara
Eliy
aGa
lleM
atar
aHa
mba
ntot
aBa
ttic
aloa
Ampa
raTr
inco
mal
eeKu
rune
gala
Putt
alam
Anur
adha
pura
Polo
nnar
uwa
Badu
llaM
onar
agal
aRa
tnap
ura
Kega
lle
Perc
enta
ge
District
2006
2016
EarlybreastfeedingInitiation of breastfeeding with in 1 hour of birth.
sample : Last born children who were born in the 2 years before the survey
Nutrition of Children and Women 163
In 2016, almost all of the last-born children under age two (99 percent) had been breastfed at some time (ever breastfed). About 90 percent of the children were breastfed within one hour of birth (98 percent within one day of birth). The percentage of children breastfed within one hour has increased during the last ten years from 80 percent to 90 percent. The percentage of children breastfed within one day has remained stable at 98 percent (compared to 97 percent in 2006-07). Disparities on breastfeeding initiation across dis-tricts are notable. The percentage of infants put to the breast soon after birth ranges from only 77 percent in Mannar to 100 percent in Anuradhapura.
The proportion of children who have ever been breastfed does not show a clear relationship with wealth quintile, but a higher percentage of last-born children of households in the fourth wealth quintile are breastfed within one hour than in any of the other quintiles. The percentage of children who were breastfed within one hour of birth are also higher among children born to mothers who have Passed G.C.E.(A/L) or equivalent education than to mothers of other educational groups.
Table 11.2 shows that thirteen percent of newborns in Sri Lanka received pre-lacteal feeds. The per-centage is higher among infants born in the urban sector, mothers whose education is “degree and above”, or living in the richer wealth quintiles. This practice is discouraged because pre-lacteal feeds are less nutritious than breast milk, more susceptible to contamination, and may reduce milk flow.

164 Demographic and Health Survey - 2016, Sri Lanka
Demography and Health Survey - 2016 163
Table11.2 Initialbreastfeeding
Among last-born children who were born in the two years preceding the survey, the percentage who were ever breastfed and the percentages who started breastfeeding within one hour and within one day of birth; and among last-born children born in the two years preceding the survey who were ever breastfed, the percentage who received a prelacteal feed, by background characteristics, Sri Lanka 2016 Among last-born children born in the past two years: Among last-born children born in
the past two years who were ever breastfed:
Background characteristic
Percentage ever
breastfed
Percentage who started
breastfeeding within 1 hour of
birth
Percentage who started
breastfeeding within 1 day of
birth1
Number of last-born children
Percentage who received a
prelacteal feed2
Number of last-born children
ever breastfed Sex
Male 99.4 90.2 97.4 1,544 14.3 1,535 Female 99.4 90.4 98.4 1,524 11.1 1,515
Residence
Urban 99.4 87.0 97.4 487 18.4 484 Rural 99.5 91.2 98.0 2,443 11.6 2,430 Estate 98.9 86.3 98.1 138 11.4 136
District
Colombo 99.6 88.7 98.2 299 23.5 298 Gampaha 100.0 94.4 99.5 257 16.2 257 Kalutara 98.8 87.5 95.9 198 21.8 195 Kandy 98.8 79.8 97.0 211 10.3 208 Matale 100.0 91.1 99.5 69 15.6 69 Nuwara Eliya 100.0 90.3 100.0 107 8.9 107 Galle 99.1 86.7 98.3 157 15.8 156 Matara 100.0 93.0 93.0 129 10.2 129 Hambantota 100.0 92.1 98.2 105 5.5 105 Jaffna 100.0 90.8 98.1 73 22.8 73 Mannar 100.0 77.1 100.0 11 12.9 11 Vavuniya 100.0 91.7 98.5 20 21.2 20 Mullaitivu 100.0 97.6 100.0 13 14.1 13 Kilinochchi 100.0 83.9 96.5 15 9.7 15 Batticaloa 98.9 92.4 97.6 89 12.9 88 Ampara 98.8 94.5 97.7 125 13.7 124 Trincomalee 96.8 78.2 96.8 70 13.5 68 Kurunegala 100.0 92.1 99.2 274 8.9 274 Puttalam 98.5 87.5 98.5 110 5.6 108 Anuradhapura 100.0 100.0 100.0 153 0.2 153 Polonnaruwa 100.0 84.9 94.7 84 16.0 84 Badulla 99.1 90.5 99.1 97 2.9 96 Moneragala 100.0 95.0 100.0 91 9.9 91 Ratnapura 98.9 91.7 95.8 182 10.1 180 Kegalle 99.3 94.5 97.6 128 8.0 127
Mother'seducation
No education * * * 19 * 17 Passed Grade 1-5 100.0 89.5 97.8 86 14.8 86 Passed Grade 6-10 99.4 88.3 98.0 1,288 8.8 1,281 Passed G.C.E.(O/L) or equivalent 99.6 90.6 97.8 648 10.6 646 Passed G.C.E.(A/L) or equivalent 99.4 93.2 98.2 819 16.8 814 Degree and above 99.6 91.5 97.6 208 26.1 207
Wealthquintile
Lowest 99.2 89.5 98.2 563 10.6 558 Second 99.5 90.3 98.4 599 8.8 596 Middle 99.5 89.1 96.5 641 9.8 637 Fourth 99.5 92.0 98.6 664 13.5 660 Highest 99.5 90.6 97.8 602 20.8 599
Total 99.4 90.3 97.9 3,068 12.7 3,050 Note: Table is based on last-born children born in the 2 years preceding the survey regardless of whether the children are living or dead at the time of interview. 1 Includes children who started breastfeeding within one hour of birth 2 Children given something other than breast milk during the first three days of life 3 Doctor, nurse/midwife, or auxiliary midwife
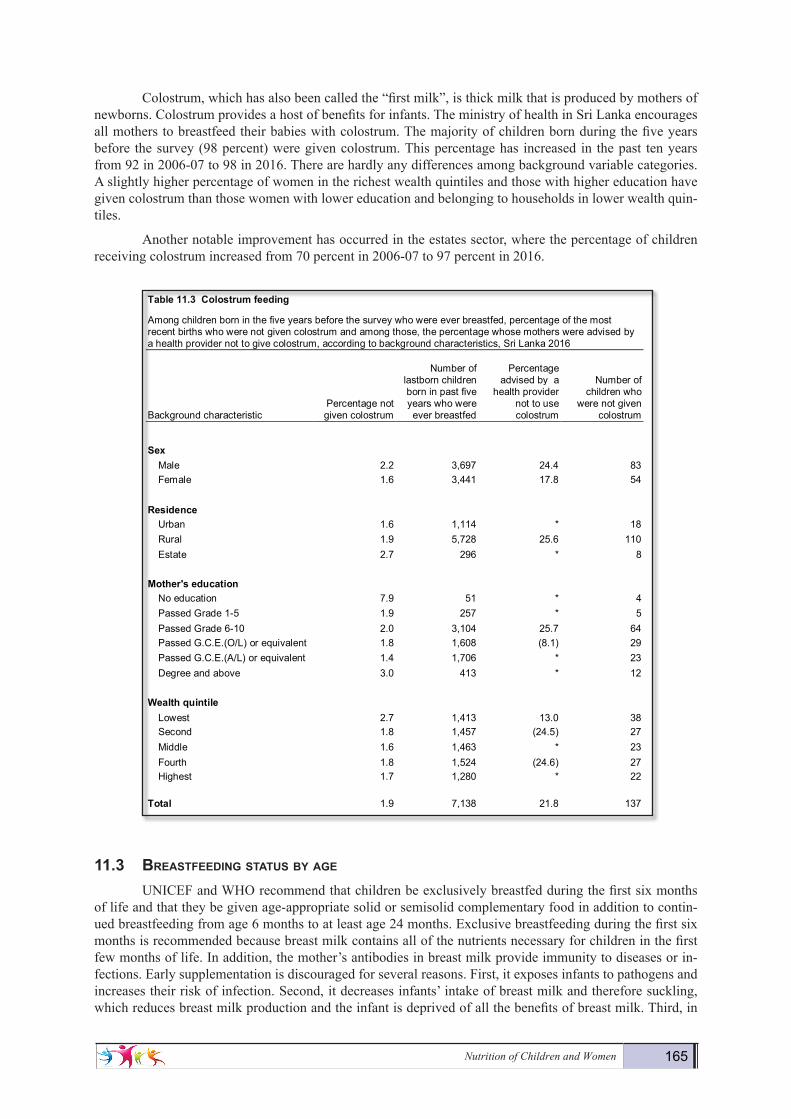
Colostrum, which has also been called the “first milk”, is thick milk that is produced by mothers of newborns. Colostrum provides a host of benefits for infants. The ministry of health in Sri Lanka encourages all mothers to breastfeed their babies with colostrum. The majority of children born during the
Nutrition of Children and Women 165
Colostrum, which has also been called the “first milk”, is thick milk that is produced by mothers of newborns. Colostrum provides a host of benefits for infants. The ministry of health in Sri Lanka encourages all mothers to breastfeed their babies with colostrum. The majority of children born during the five years before the survey (98 percent) were given colostrum. This percentage has increased in the past ten years from 92 in 2006-07 to 98 in 2016. There are hardly any differences among background variable categories. A slightly higher percentage of women in the richest wealth quintiles and those with higher education have given colostrum than those women with lower education and belonging to households in lower wealth quin-tiles.
Another notable improvement has occurred in the estates sector, where the percentage of children receiving colostrum increased from 70 percent in 2006-07 to 97 percent in 2016.
11.3 breastfeediNg status by age
UNICEF and WHO recommend that children be exclusively breastfed during the first six months of life and that they be given age-appropriate solid or semisolid complementary food in addition to contin-ued breastfeeding from age 6 months to at least age 24 months. Exclusive breastfeeding during the first six months is recommended because breast milk contains all of the nutrients necessary for children in the first few months of life. In addition, the mother’s antibodies in breast milk provide immunity to diseases or in-fections. Early supplementation is discouraged for several reasons. First, it exposes infants to pathogens and increases their risk of infection. Second, it decreases infants’ intake of breast milk and therefore suckling, which reduces breast milk production and the infant is deprived of all the benefits of breast milk. Third, in
Demography and Health Survey - 2016 164
five years before the survey (98 percent) were given colostrum. This percentage has increased in the past ten years from 92 in 2006-07 to 98 in 2016. There are hardly any differences among background variable categories. A slightly higher percentage of women in the richest wealth quintiles and those with higher education have given colostrum than those women with lower education and belonging to households in lower wealth quintiles.
Another notable improvement has occurred in the estates sector, where the percentage of children receiving colostrum increased from 70 percent in 2006-07 to 97 percent in 2016.
Table11.3 Colostrumfeeding
Among children born in the five years before the survey who were ever breastfed, percentage of the most recent births who were not given colostrum and among those, the percentage whose mothers were advised by a health provider not to give colostrum, according to background characteristics, Sri Lanka 2016
Background characteristic Percentage not given colostrum
Number of lastborn children born in past five years who were ever breastfed
Percentage advised by a
health provider not to use colostrum
Number of children who
were not given colostrum
Sex
Male 2.2 3,697 24.4 83 Female 1.6 3,441 17.8 54
Residence Urban 1.6 1,114 * 18 Rural 1.9 5,728 25.6 110 Estate 2.7 296 * 8
Mother'seducation No education 7.9 51 * 4 Passed Grade 1-5 1.9 257 * 5 Passed Grade 6-10 2.0 3,104 25.7 64 Passed G.C.E.(O/L) or equivalent 1.8 1,608 (8.1) 29 Passed G.C.E.(A/L) or equivalent 1.4 1,706 * 23 Degree and above 3.0 413 * 12
Wealthquintile Lowest 2.7 1,413 13.0 38 Second 1.8 1,457 (24.5) 27 Middle 1.6 1,463 * 23 Fourth 1.8 1,524 (24.6) 27 Highest 1.7 1,280 * 22
Total 1.9 7,138 21.8 137
11.3 BREASTFEEDING STATUSBYAGE
UNICEF and WHO recommend that children be exclusively breastfed during the first six months of life and that they be given age-appropriate solid or semisolid complementary food in addition to continued breastfeeding from age 6 months to at least age 24 months. Exclusive breastfeeding during the first six months is recommended because breast milk contains all of the nutrients necessary for children in the first few months of life. In addition, the mother’s antibodies in breast milk provide immunity to diseases or infections. Early supplementation is discouraged for several reasons. First, it exposes infants to pathogens and increases their risk of infection. Second, it decreases infants’ intake of breast milk and therefore suckling, which reduces breast milk production and the infant is deprived of all the benefits of breast milk. Third, in low-resource settings, complementary food is often nutritionally inferior.
After six completed months, a child requires adequate complementary foods for normal growth. Lack of appropriate complementary feeding may lead to malnutrition and frequent illnesses, which in turn may even lead to death. However, even with complementary feeding, the child should continue to be

166 Demographic and Health Survey - 2016, Sri Lanka
low-resource settings, complementary food is often nutritionally inferior.
After six completed months, a child requires adequate complementary foods for normal growth. Lack of appropriate complementary feeding may lead to malnutrition and frequent illnesses, which in turn may even lead to death. However, even with complementary feeding, the child should continue to be breast-fed for two years or more. Interviewers obtained information on complementary feeding by asking mothers about the current breastfeeding status of all children under age 5 and, for the youngest child born in the two-year period before the survey and living with the mother, foods and liquids given to the child the day and night before the survey.
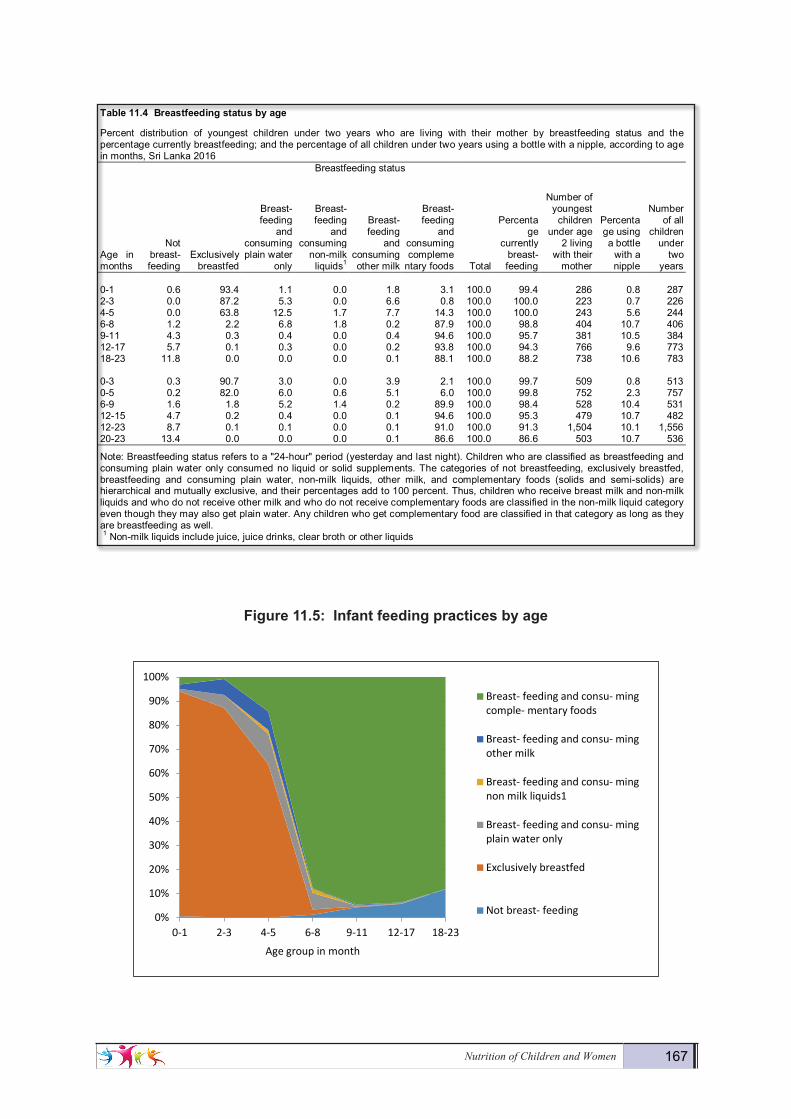
Table 11.4 shows the percent distribution by breastfeeding status of youngest children under age 2 living with their mother and the percentage of children under age 2 using a bottle with a nipple, according to age in months. Exclusive breastfeeding for the first six months in Sri Lanka is 82 percent for children under age 6 months (Table 11.4 and Figure 11.5). Among age subgroups, the percentage of children exclusively breastfed decreases sharply from 93 percent of infants aged 0-1 month to 87 percent of infants’ age 2-3 months and, further to 64 percent of infants aged 4-5 months.
In addition to receiving breast milk, 6 percent of children under age 6 months receive plain water, 5 percent receive other milk, and 6 percent are given complementary foods. After the age of 5 months, a majority of children (88 percent or more) receive complementary foods in addition to breast milk, as recom-mended; however, 12 percent of children aged 6-8 months did not receive complementary foods the day or night preceding the survey.
Only two percent of children below 6 months and 11 percent of children aged 6-8 months used a bottle with a nipple the day or night preceding the survey. Bottle feeding is a concern because of possible con-tamination due to unsafe water and lack of hygiene in its preparation; it also may reduce the child’s interest in breastfeeding, with a consequential decline in the mother’s milk production.
Continued breastfeeding is recommended until a child is 2 years of age or beyond. In Sri Lanka breastfeeding is widely accepted and of long duration. The proportion of children who are currently breast-feeding decreases with the age of the child, from 94 percent among children aged 12-17 months to 88 percent among children aged 18-23 months.
Although it is recommended that breastfeeding be continued throughout the second year of life, 9 percent of children 12-23 months old are not receiving any breast milk. Figure 11.5 illustrates the patterns of child feeding by the age of the child.
Nutrition of Children and Women 167
Figure11.5:Infantfeedingpracticesbyage
0%
10%
20%
30%
40%
50%
60%
70%
80%
90%
100%
0-1 2-3 4-5 6-8 9-11 12-17 18-23
Age group in month
Breast- feeding and consu- mingcomple- mentary foods
Breast- feeding and consu- mingother milk
Breast- feeding and consu- mingnon milk liquids1
Breast- feeding and consu- mingplain water only
Exclusively breastfed
Not breast- feeding
Demography and Health Survey - 2016 166
Table11.4 Breastfeedingstatusbyage
Percent distribution of youngest children under two years who are living with their mother by breastfeeding status and the percentage currently breastfeeding; and the percentage of all children under two years using a bottle with a nipple, according to age in months, Sri Lanka 2016 Breastfeeding status
Age in months
Not breast- feeding
Exclusively breastfed
Breast- feeding
and consuming plain water
only
Breast- feeding
and consuming
non-milk liquids1
Breast- feeding
and consuming other milk
Breast- feeding
and consuming compleme
ntary foods Total
Percentage
currently breast- feeding
Number of youngest
children under age
2 living with their
mother
Percentage using a bottle
with a nipple
Number of all
children under
two years
0-1 0.6 93.4 1.1 0.0 1.8 3.1 100.0 99.4 286 0.8 287 2-3 0.0 87.2 5.3 0.0 6.6 0.8 100.0 100.0 223 0.7 226 4-5 0.0 63.8 12.5 1.7 7.7 14.3 100.0 100.0 243 5.6 244 6-8 1.2 2.2 6.8 1.8 0.2 87.9 100.0 98.8 404 10.7 406 9-11 4.3 0.3 0.4 0.0 0.4 94.6 100.0 95.7 381 10.5 384 12-17 5.7 0.1 0.3 0.0 0.2 93.8 100.0 94.3 766 9.6 773 18-23 11.8 0.0 0.0 0.0 0.1 88.1 100.0 88.2 738 10.6 783 0-3 0.3 90.7 3.0 0.0 3.9 2.1 100.0 99.7 509 0.8 513 0-5 0.2 82.0 6.0 0.6 5.1 6.0 100.0 99.8 752 2.3 757 6-9 1.6 1.8 5.2 1.4 0.2 89.9 100.0 98.4 528 10.4 531 12-15 4.7 0.2 0.4 0.0 0.1 94.6 100.0 95.3 479 10.7 482 12-23 8.7 0.1 0.1 0.0 0.1 91.0 100.0 91.3 1,504 10.1 1,556 20-23 13.4 0.0 0.0 0.0 0.1 86.6 100.0 86.6 503 10.7 536 Note: Breastfeeding status refers to a "24-hour" period (yesterday and last night). Children who are classified as breastfeeding and consuming plain water only consumed no liquid or solid supplements. The categories of not breastfeeding, exclusively breastfed, breastfeeding and consuming plain water, non-milk liquids, other milk, and complementary foods (solids and semi-solids) are hierarchical and mutually exclusive, and their percentages add to 100 percent. Thus, children who receive breast milk and non-milk liquids and who do not receive other milk and who do not receive complementary foods are classified in the non-milk liquid category even though they may also get plain water. Any children who get complementary food are classified in that category as long as they are breastfeeding as well. 1 Non-milk liquids include juice, juice drinks, clear broth or other liquids
Figure 11.5: Infantfeedingpracticesbyage
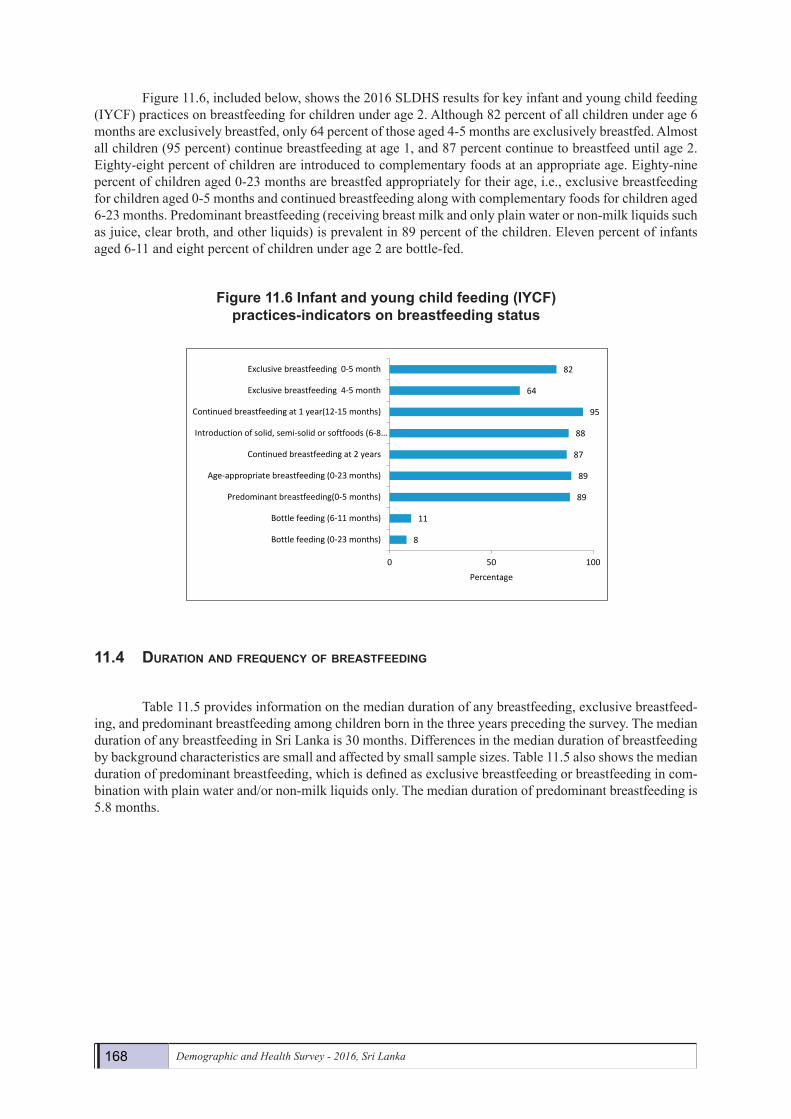
Figure 11.6, included below, shows the 2016 SLDHS results for key infant and young child feeding (IYCF) practices on breastfeeding for children under age 2. Although 82 percent of all children under age 6 months are exclusively breastfed, only 64 percent of those aged 4-5 months are exclusively breastfed. Almost all children (95 percent) continue breastfeeding at age 1, and 87 percent continue to breastfeed until age 2. Eighty-eight percent of children are introduced to complementary foods at an appropriate age. Eighty-nine percent of children aged 0-23 months are breastfed appropriately for their
168 Demographic and Health Survey - 2016, Sri Lanka
Figure 11.6, included below, shows the 2016 SLDHS results for key infant and young child feeding (IYCF) practices on breastfeeding for children under age 2. Although 82 percent of all children under age 6 months are exclusively breastfed, only 64 percent of those aged 4-5 months are exclusively breastfed. Almost all children (95 percent) continue breastfeeding at age 1, and 87 percent continue to breastfeed until age 2. Eighty-eight percent of children are introduced to complementary foods at an appropriate age. Eighty-nine percent of children aged 0-23 months are breastfed appropriately for their age, i.e., exclusive breastfeeding for children aged 0-5 months and continued breastfeeding along with complementary foods for children aged 6-23 months. Predominant breastfeeding (receiving breast milk and only plain water or non-milk liquids such as juice, clear broth, and other liquids) is prevalent in 89 percent of the children. Eleven percent of infants aged 6-11 and eight percent of children under age 2 are bottle-fed.
Figure11.6Infantandyoungchildfeeding(IYCF)practices-indicatorsonbreastfeedingstatus
11.4 duratioN aNd frequeNcy of breastfeediNg
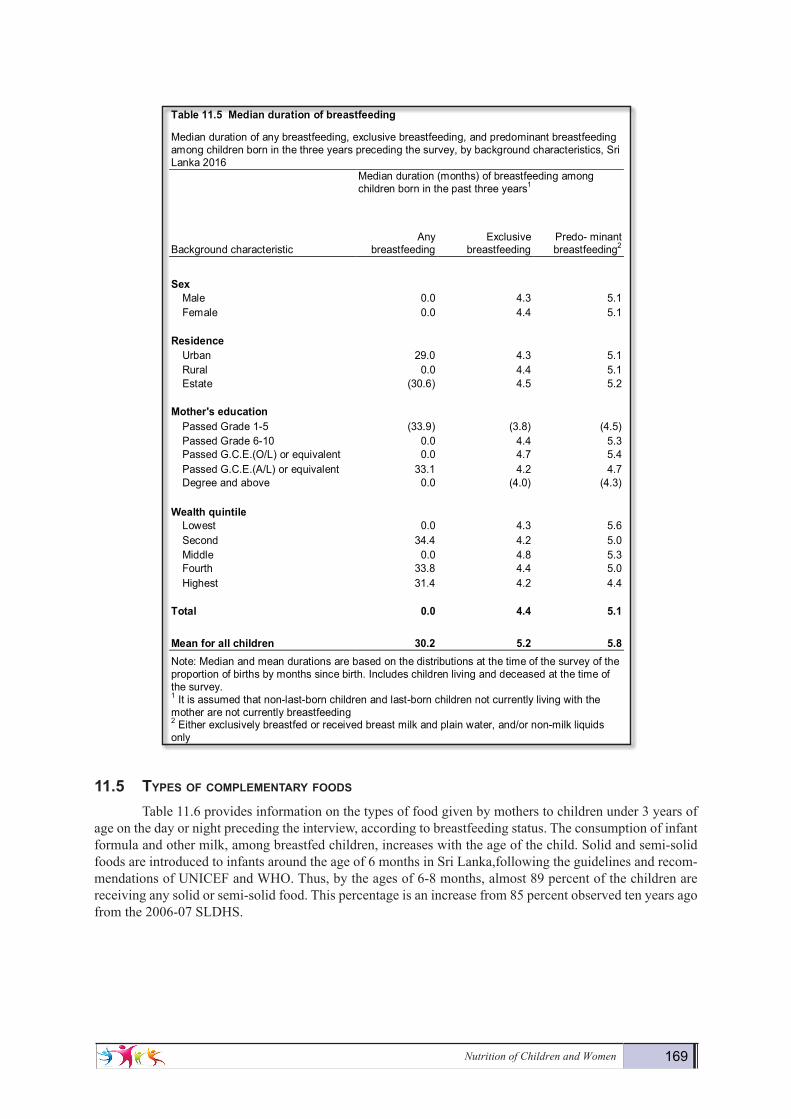
Table 11.5 provides information on the median duration of any breastfeeding, exclusive breastfeed-ing, and predominant breastfeeding among children born in the three years preceding the survey. The median duration of any breastfeeding in Sri Lanka is 30 months. Differences in the median duration of breastfeeding by background characteristics are small and affected by small sample sizes. Table 11.5 also shows the median duration of predominant breastfeeding, which is defined as exclusive breastfeeding or breastfeeding in com-bination with plain water and/or non-milk liquids only. The median duration of predominant breastfeeding is 5.8 months.
8
11
89
89
87
88
95
64
82
0 50 100
Bottle feeding (0-23 months)
Bottle feeding (6-11 months)
Predominant breastfeeding(0-5 months)
Age-appropriate breastfeeding (0-23 months)
Continued breastfeeding at 2 years
Introduction of solid, semi-solid or softfoods (6-8…
Continued breastfeeding at 1 year(12-15 months)
Exclusive breastfeeding 4-5 month
Exclusive breastfeeding 0-5 month
Percentage
Nutrition of Children and Women 169
11.5 types of coMpleMeNtary foods
Table 11.6 provides information on the types of food given by mothers to children under 3 years of age on the day or night preceding the interview, according to breastfeeding status. The consumption of infant formula and other milk, among breastfed children, increases with the age of the child. Solid and semi-solid foods are introduced to infants around the age of 6 months in Sri Lanka,following the guidelines and recom-mendations of UNICEF and WHO. Thus, by the ages of 6-8 months, almost 89 percent of the children are receiving any solid or semi-solid food. This percentage is an increase from 85 percent observed ten years ago from the 2006-07 SLDHS.
Demography and Health Survey - 2016 168
Table11.5 Mediandurationofbreastfeeding
Median duration of any breastfeeding, exclusive breastfeeding, and predominant breastfeeding among children born in the three years preceding the survey, by background characteristics, Sri Lanka 2016 Median duration (months) of breastfeeding among
children born in the past three years1
Background characteristic Any
breastfeeding Exclusive
breastfeeding Predo- minant breastfeeding2
Sex
Male 0.0 4.3 5.1 Female 0.0 4.4 5.1
Residence Urban 29.0 4.3 5.1 Rural 0.0 4.4 5.1 Estate (30.6) 4.5 5.2
Mother'seducation Passed Grade 1-5 (33.9) (3.8) (4.5) Passed Grade 6-10 0.0 4.4 5.3 Passed G.C.E.(O/L) or equivalent 0.0 4.7 5.4 Passed G.C.E.(A/L) or equivalent 33.1 4.2 4.7 Degree and above 0.0 (4.0) (4.3)
Wealthquintile Lowest 0.0 4.3 5.6 Second 34.4 4.2 5.0 Middle 0.0 4.8 5.3 Fourth 33.8 4.4 5.0 Highest 31.4 4.2 4.4
Total 0.0 4.4 5.1
Meanforallchildren 30.2 5.2 5.8 Note: Median and mean durations are based on the distributions at the time of the survey of the proportion of births by months since birth. Includes children living and deceased at the time of the survey. 1 It is assumed that non-last-born children and last-born children not currently living with the mother are not currently breastfeeding 2 Either exclusively breastfed or received breast milk and plain water, and/or non-milk liquids only
11.5 TYPESOFCOMPLEMENTARYFOODS
Table 11.6 provides information on the types of food given by mothers to children under 3 years of age on the day or night preceding the interview, according to breastfeeding status. The consumption of infant formula and other milk, among breastfed children, increases with the age of the child. Solid and semi-solid foods are introduced to infants around the age of 6 months in Sri Lanka,following the guidelines and recommendations of UNICEF and WHO. Thus, by the ages of 6-8 months, almost 89 percent of the children are receiving any solid or semi-solid food. This percentage is an increase from 85 percent observed ten years ago from the 2006-07 SLDHS.
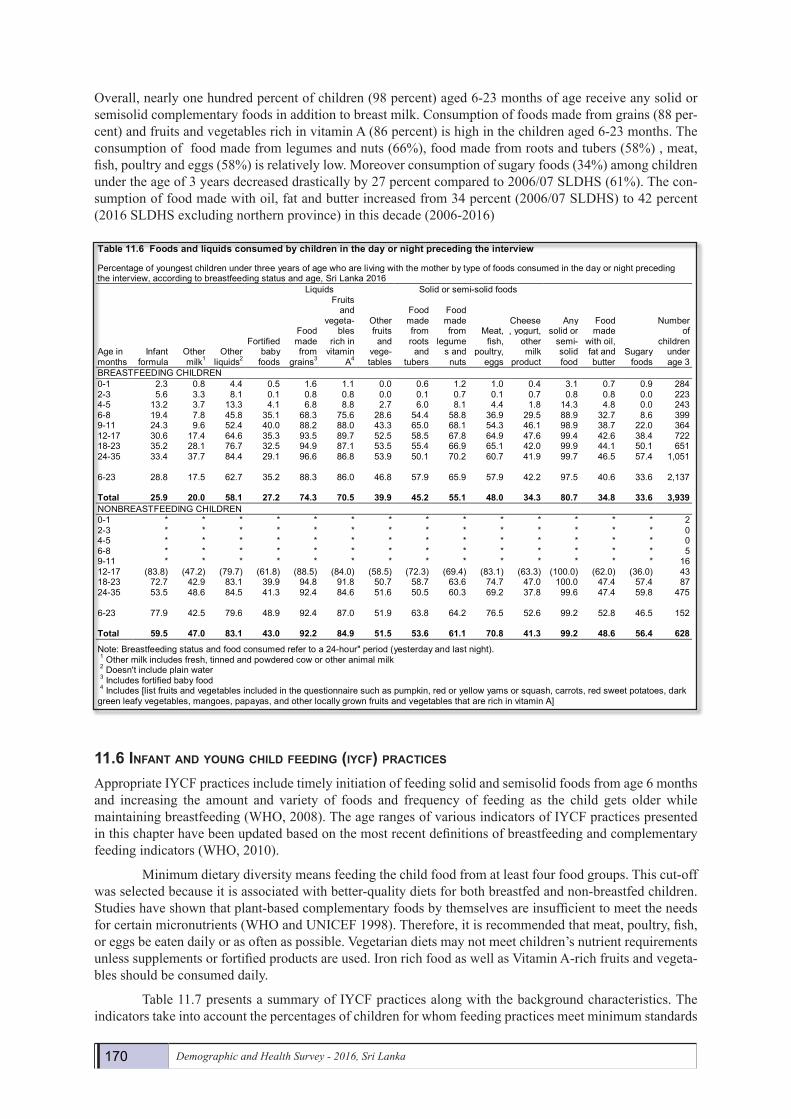
Overall, nearly one hundred percent of children (98 percent) aged 6-23 months of age receive any solid or semisolid complementary foods in addition to breast milk. Consumption of foods made from grains (88 percent) and fruits and vegetables rich in vitamin A (86 percent) is high in the children aged 6-23 months. The consumption of food made from legumes and nuts (66%), food made from roots and tubers (58%) , meat, fish, poultry and eggs (58%) is relatively low. Moreover consumption of sugary foods among children under the age of 3 years decreased drastically by 35 percent compared to 2006/07 SLDHS. The consumption of food made with oil, fat and butter increased from 34 percent (2006/07 SLDHS) to 42 percent (2016 SLDHS excluding northern province) in this decade (2006-2016)
170 Demographic and Health Survey - 2016, Sri Lanka
Overall, nearly one hundred percent of children (98 percent) aged 6-23 months of age receive any solid or semisolid complementary foods in addition to breast milk. Consumption of foods made from grains (88 per-cent) and fruits and vegetables rich in vitamin A (86 percent) is high in the children aged 6-23 months. The consumption of food made from legumes and nuts (66%), food made from roots and tubers (58%) , meat, fish, poultry and eggs (58%) is relatively low. Moreover consumption of sugary foods (34%) among children under the age of 3 years decreased drastically by 27 percent compared to 2006/07 SLDHS (61%). The con-sumption of food made with oil, fat and butter increased from 34 percent (2006/07 SLDHS) to 42 percent (2016 SLDHS excluding northern province) in this decade (2006-2016)
11.6 iNfaNt aNd youNg child feediNg (iycf) practices
Appropriate IYCF practices include timely initiation of feeding solid and semisolid foods from age 6 months and increasing the amount and variety of foods and frequency of feeding as the child gets older while maintaining breastfeeding (WHO, 2008). The age ranges of various indicators of IYCF practices presented in this chapter have been updated based on the most recent definitions of breastfeeding and complementary feeding indicators (WHO, 2010).
Minimum dietary diversity means feeding the child food from at least four food groups. This cut-off was selected because it is associated with better-quality diets for both breastfed and non-breastfed children. Studies have shown that plant-based complementary foods by themselves are insufficient to meet the needs for certain micronutrients (WHO and UNICEF 1998). Therefore, it is recommended that meat, poultry, fish, or eggs be eaten daily or as often as possible. Vegetarian diets may not meet children’s nutrient requirements unless supplements or fortified products are used. Iron rich food as well as Vitamin A-rich fruits and vegeta-bles should be consumed daily.
Table 11.7 presents a summary of IYCF practices along with the background characteristics. The indicators take into account the percentages of children for whom feeding practices meet minimum standards
Demography and Health Survey - 2016 169
Table11.6 Foodsandliquidsconsumedbychildreninthedayornightprecedingtheinterview
Percentage of youngest children under three years of age who are living with the mother by type of foods consumed in the day or night preceding the interview, according to breastfeeding status and age, Sri Lanka 2016 Liquids Solid or semi-solid foods
Age in months
Infant formula
Other milk1
Other liquids2
Fortified baby
foods
Food made from
grains3
Fruits and
vegeta-bles
rich in vitamin
A4
Other fruits and
vege- tables
Food made from roots
and tubers
Food made from
legumes and nuts
Meat, fish,
poultry, eggs
Cheese, yogurt,
other milk
product
Any solid or
semi- solid food
Food made
with oil, fat and butter
Sugary foods
Number of
children under age 3
BREASTFEEDING CHILDREN 0-1 2.3 0.8 4.4 0.5 1.6 1.1 0.0 0.6 1.2 1.0 0.4 3.1 0.7 0.9 284 2-3 5.6 3.3 8.1 0.1 0.8 0.8 0.0 0.1 0.7 0.1 0.7 0.8 0.8 0.0 223 4-5 13.2 3.7 13.3 4.1 6.8 8.8 2.7 6.0 8.1 4.4 1.8 14.3 4.8 0.0 243 6-8 19.4 7.8 45.8 35.1 68.3 75.6 28.6 54.4 58.8 36.9 29.5 88.9 32.7 8.6 399 9-11 24.3 9.6 52.4 40.0 88.2 88.0 43.3 65.0 68.1 54.3 46.1 98.9 38.7 22.0 364 12-17 30.6 17.4 64.6 35.3 93.5 89.7 52.5 58.5 67.8 64.9 47.6 99.4 42.6 38.4 722 18-23 35.2 28.1 76.7 32.5 94.9 87.1 53.5 55.4 66.9 65.1 42.0 99.9 44.1 50.1 651 24-35 33.4 37.7 84.4 29.1 96.6 86.8 53.9 50.1 70.2 60.7 41.9 99.7 46.5 57.4 1,051 6-23 28.8 17.5 62.7 35.2 88.3 86.0 46.8 57.9 65.9 57.9 42.2 97.5 40.6 33.6 2,137 Total 25.9 20.0 58.1 27.2 74.3 70.5 39.9 45.2 55.1 48.0 34.3 80.7 34.8 33.6 3,939 NONBREASTFEEDING CHILDREN 0-1 * * * * * * * * * * * * * * 2 2-3 * * * * * * * * * * * * * * 0 4-5 * * * * * * * * * * * * * * 0 6-8 * * * * * * * * * * * * * * 5 9-11 * * * * * * * * * * * * * * 16 12-17 (83.8) (47.2) (79.7) (61.8) (88.5) (84.0) (58.5) (72.3) (69.4) (83.1) (63.3) (100.0) (62.0) (36.0) 43 18-23 72.7 42.9 83.1 39.9 94.8 91.8 50.7 58.7 63.6 74.7 47.0 100.0 47.4 57.4 87 24-35 53.5 48.6 84.5 41.3 92.4 84.6 51.6 50.5 60.3 69.2 37.8 99.6 47.4 59.8 475 6-23 77.9 42.5 79.6 48.9 92.4 87.0 51.9 63.8 64.2 76.5 52.6 99.2 52.8 46.5 152 Total 59.5 47.0 83.1 43.0 92.2 84.9 51.5 53.6 61.1 70.8 41.3 99.2 48.6 56.4 628 Note: Breastfeeding status and food consumed refer to a 24-hour" period (yesterday and last night). 1 Other milk includes fresh, tinned and powdered cow or other animal milk 2 Doesn't include plain water 3 Includes fortified baby food 4 Includes [list fruits and vegetables included in the questionnaire such as pumpkin, red or yellow yams or squash, carrots, red sweet potatoes, dark green leafy vegetables, mangoes, papayas, and other locally grown fruits and vegetables that are rich in vitamin A]
11.6 INFANT AND YOUNG CHILD FEEDING(IYCF) PRACTICES
Appropriate IYCF practices include timely initiation of feeding solid and semisolid foods from
age 6 months and increasing the amount and variety of foods and frequency of feeding as the child gets older while maintaining breastfeeding (WHO, 2008). The age ranges of various indicators of IYCF practices presented in this chapter have been updated based on the most recent definitions of breastfeeding and complementary feeding indicators (WHO, 2010).
Minimum dietary diversity means feeding the child food from at least four food groups. This cutoff was selected because it is associated with better-quality diets for both breastfed and non-breastfed children. Studies have shown that plant-based complementary foods by themselves are insufficient to meet the needs for certain micronutrients (WHO and UNICEF 1998). Therefore, it is recommended that meat, poultry, fish, or eggs be eaten daily or as often as possible. Vegetarian diets may not meet children’s nutrient requirements unless supplements or fortified products are used. Iron rich food as well as Vitamin A-rich fruits and vegetables should be consumed daily.
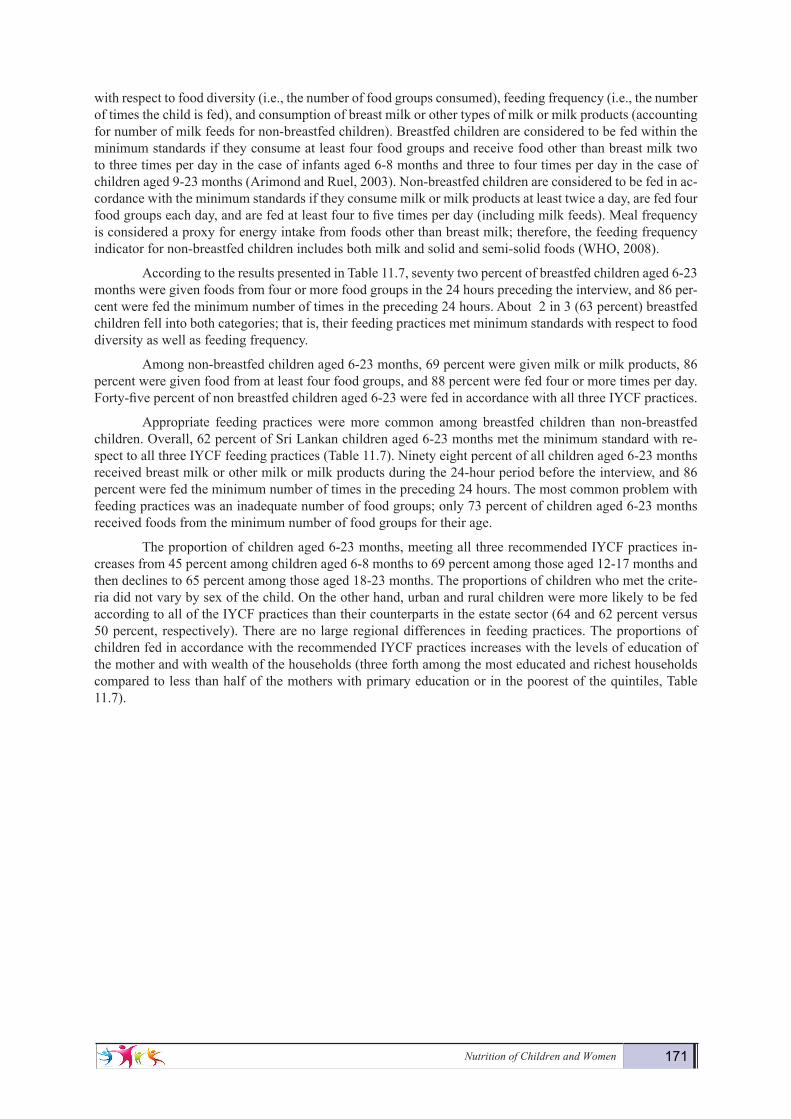
Table 11.7 presents a summary of IYCF practices along with the background characteristics. The indicators take into account the percentages of children for whom feeding practices meet minimum standards with respect to food diversity (i.e., the number of food groups consumed), feeding frequency (i.e., the number of times the child is fed), and consumption of breast milk or other types of milk or milk products (accounting for number of milk feeds for non-breastfed children). Breastfed children are considered to be fed within the minimum standards if they consume at least four food groups and receive food other than breast milk two to three times per day in the case of infants aged 6-8 months and three to four times per day in the case of children aged 9-23 months (Arimond and Ruel, 2003). Non-breastfed children are considered to be fed in accordance with the minimum standards if they consume milk or milk
Nutrition of Children and Women 171
with respect to food diversity (i.e., the number of food groups consumed), feeding frequency (i.e., the number of times the child is fed), and consumption of breast milk or other types of milk or milk products (accounting for number of milk feeds for non-breastfed children). Breastfed children are considered to be fed within the minimum standards if they consume at least four food groups and receive food other than breast milk two to three times per day in the case of infants aged 6-8 months and three to four times per day in the case of children aged 9-23 months (Arimond and Ruel, 2003). Non-breastfed children are considered to be fed in ac-cordance with the minimum standards if they consume milk or milk products at least twice a day, are fed four food groups each day, and are fed at least four to five times per day (including milk feeds). Meal frequency is considered a proxy for energy intake from foods other than breast milk; therefore, the feeding frequency indicator for non-breastfed children includes both milk and solid and semi-solid foods (WHO, 2008).
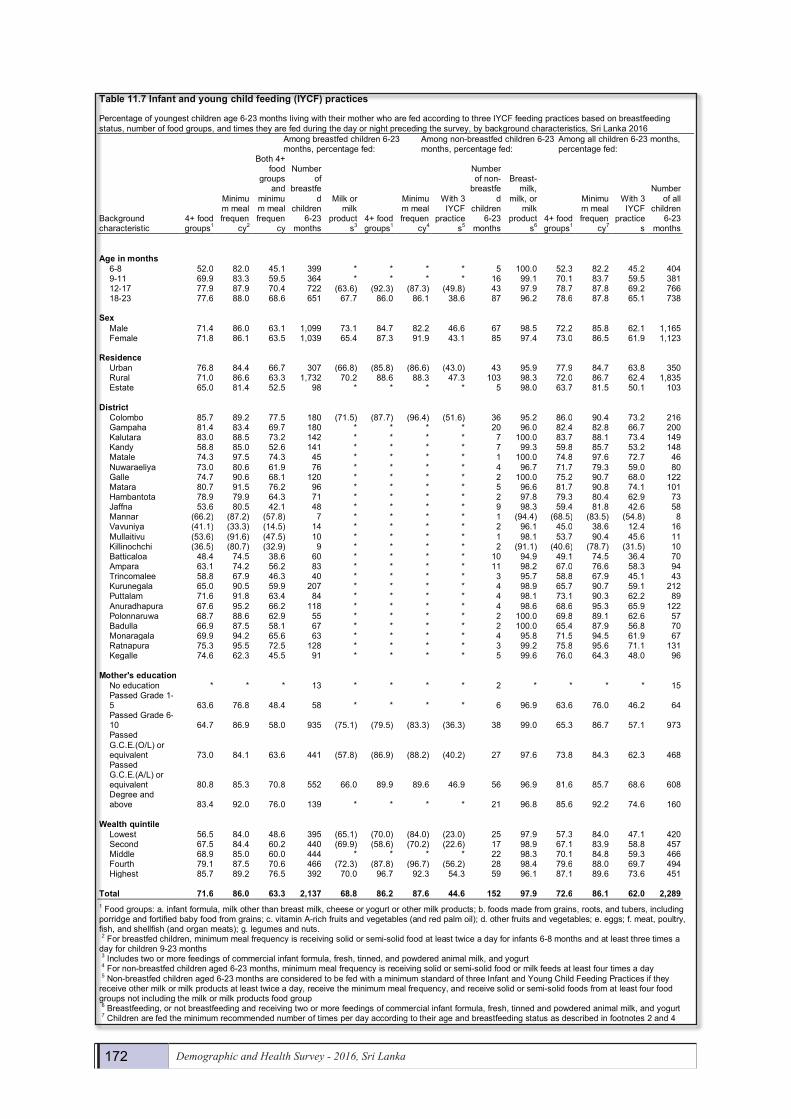
According to the results presented in Table 11.7, seventy two percent of breastfed children aged 6-23 months were given foods from four or more food groups in the 24 hours preceding the interview, and 86 per-cent were fed the minimum number of times in the preceding 24 hours. About 2 in 3 (63 percent) breastfed children fell into both categories; that is, their feeding practices met minimum standards with respect to food diversity as well as feeding frequency.
Among non-breastfed children aged 6-23 months, 69 percent were given milk or milk products, 86 percent were given food from at least four food groups, and 88 percent were fed four or more times per day. Forty-five percent of non breastfed children aged 6-23 were fed in accordance with all three IYCF practices.
Appropriate feeding practices were more common among breastfed children than non-breastfed children. Overall, 62 percent of Sri Lankan children aged 6-23 months met the minimum standard with re-spect to all three IYCF feeding practices (Table 11.7). Ninety eight percent of all children aged 6-23 months received breast milk or other milk or milk products during the 24-hour period before the interview, and 86 percent were fed the minimum number of times in the preceding 24 hours. The most common problem with feeding practices was an inadequate number of food groups; only 73 percent of children aged 6-23 months received foods from the minimum number of food groups for their age.
The proportion of children aged 6-23 months, meeting all three recommended IYCF practices in-creases from 45 percent among children aged 6-8 months to 69 percent among those aged 12-17 months and then declines to 65 percent among those aged 18-23 months. The proportions of children who met the crite-ria did not vary by sex of the child. On the other hand, urban and rural children were more likely to be fed according to all of the IYCF practices than their counterparts in the estate sector (64 and 62 percent versus 50 percent, respectively). There are no large regional differences in feeding practices. The proportions of children fed in accordance with the recommended IYCF practices increases with the levels of education of the mother and with wealth of the households (three forth among the most educated and richest households compared to less than half of the mothers with primary education or in the poorest of the quintiles, Table 11.7).
172 Demographic and Health Survey - 2016, Sri Lanka
Demography and Health Survey - 2016 171
Table11.7 Infantandyoungchildfeeding(IYCF)practices
Percentage of youngest children age 6-23 months living with their mother who are fed according to three IYCF feeding practices based on breastfeeding status, number of food groups, and times they are fed during the day or night preceding the survey, by background characteristics, Sri Lanka 2016 Among breastfed children 6-23
months, percentage fed: Among non-breastfed children 6-23 months, percentage fed:
Among all children 6-23 months, percentage fed:
Background characteristic
4+ food groups1
Minimum meal frequen
cy2
Both 4+ food
groups and
minimum meal frequen
cy
Number of
breastfed
children 6-23
months
Milk or milk
products3
4+ food groups1
Minimum meal frequen
cy4
With 3 IYCF
practices5
Number of non-
breastfed
children 6-23
months
Breast- milk,
milk, or milk
products6
4+ food groups1
Minimum meal frequen
cy7
With 3 IYCF
practices
Number of all
children 6-23
months Ageinmonths
6-8 52.0 82.0 45.1 399 * * * * 5 100.0 52.3 82.2 45.2 404 9-11 69.9 83.3 59.5 364 * * * * 16 99.1 70.1 83.7 59.5 381 12-17 77.9 87.9 70.4 722 (63.6) (92.3) (87.3) (49.8) 43 97.9 78.7 87.8 69.2 766 18-23 77.6 88.0 68.6 651 67.7 86.0 86.1 38.6 87 96.2 78.6 87.8 65.1 738
Sex
Male 71.4 86.0 63.1 1,099 73.1 84.7 82.2 46.6 67 98.5 72.2 85.8 62.1 1,165 Female 71.8 86.1 63.5 1,039 65.4 87.3 91.9 43.1 85 97.4 73.0 86.5 61.9 1,123
Residence
Urban 76.8 84.4 66.7 307 (66.8) (85.8) (86.6) (43.0) 43 95.9 77.9 84.7 63.8 350 Rural 71.0 86.6 63.3 1,732 70.2 88.6 88.3 47.3 103 98.3 72.0 86.7 62.4 1,835 Estate 65.0 81.4 52.5 98 * * * * 5 98.0 63.7 81.5 50.1 103
District
Colombo 85.7 89.2 77.5 180 (71.5) (87.7) (96.4) (51.6) 36 95.2 86.0 90.4 73.2 216 Gampaha 81.4 83.4 69.7 180 * * * * 20 96.0 82.4 82.8 66.7 200 Kalutara 83.0 88.5 73.2 142 * * * * 7 100.0 83.7 88.1 73.4 149 Kandy 58.8 85.0 52.6 141 * * * * 7 99.3 59.8 85.7 53.2 148 Matale 74.3 97.5 74.3 45 * * * * 1 100.0 74.8 97.6 72.7 46 Nuwaraeliya 73.0 80.6 61.9 76 * * * * 4 96.7 71.7 79.3 59.0 80 Galle 74.7 90.6 68.1 120 * * * * 2 100.0 75.2 90.7 68.0 122 Matara 80.7 91.5 76.2 96 * * * * 5 96.6 81.7 90.8 74.1 101 Hambantota 78.9 79.9 64.3 71 * * * * 2 97.8 79.3 80.4 62.9 73 Jaffna 53.6 80.5 42.1 48 * * * * 9 98.3 59.4 81.8 42.6 58 Mannar (66.2) (87.2) (57.8) 7 * * * * 1 (94.4) (68.5) (83.5) (54.8) 8 Vavuniya (41.1) (33.3) (14.5) 14 * * * * 2 96.1 45.0 38.6 12.4 16 Mullaitivu (53.6) (91.6) (47.5) 10 * * * * 1 98.1 53.7 90.4 45.6 11 Killinochchi (36.5) (80.7) (32.9) 9 * * * * 2 (91.1) (40.6) (78.7) (31.5) 10 Batticaloa 48.4 74.5 38.6 60 * * * * 10 94.9 49.1 74.5 36.4 70 Ampara 63.1 74.2 56.2 83 * * * * 11 98.2 67.0 76.6 58.3 94 Trincomalee 58.8 67.9 46.3 40 * * * * 3 95.7 58.8 67.9 45.1 43 Kurunegala 65.0 90.5 59.9 207 * * * * 4 98.9 65.7 90.7 59.1 212 Puttalam 71.6 91.8 63.4 84 * * * * 4 98.1 73.1 90.3 62.2 89 Anuradhapura 67.6 95.2 66.2 118 * * * * 4 98.6 68.6 95.3 65.9 122 Polonnaruwa 68.7 88.6 62.9 55 * * * * 2 100.0 69.8 89.1 62.6 57 Badulla 66.9 87.5 58.1 67 * * * * 2 100.0 65.4 87.9 56.8 70 Monaragala 69.9 94.2 65.6 63 * * * * 4 95.8 71.5 94.5 61.9 67 Ratnapura 75.3 95.5 72.5 128 * * * * 3 99.2 75.8 95.6 71.1 131 Kegalle 74.6 62.3 45.5 91 * * * * 5 99.6 76.0 64.3 48.0 96
Mother'seducation
No education * * * 13 * * * * 2 * * * * 15 Passed Grade 1-5 63.6 76.8 48.4 58 * * * * 6 96.9 63.6 76.0 46.2 64 Passed Grade 6-10 64.7 86.9 58.0 935 (75.1) (79.5) (83.3) (36.3) 38 99.0 65.3 86.7 57.1 973 Passed G.C.E.(O/L) or equivalent 73.0 84.1 63.6 441 (57.8) (86.9) (88.2) (40.2) 27 97.6 73.8 84.3 62.3 468 Passed G.C.E.(A/L) or equivalent 80.8 85.3 70.8 552 66.0 89.9 89.6 46.9 56 96.9 81.6 85.7 68.6 608 Degree and above 83.4 92.0 76.0 139 * * * * 21 96.8 85.6 92.2 74.6 160
Wealthquintile
Lowest 56.5 84.0 48.6 395 (65.1) (70.0) (84.0) (23.0) 25 97.9 57.3 84.0 47.1 420 Second 67.5 84.4 60.2 440 (69.9) (58.6) (70.2) (22.6) 17 98.9 67.1 83.9 58.8 457 Middle 68.9 85.0 60.0 444 * * * * 22 98.3 70.1 84.8 59.3 466 Fourth 79.1 87.5 70.6 466 (72.3) (87.8) (96.7) (56.2) 28 98.4 79.6 88.0 69.7 494 Highest 85.7 89.2 76.5 392 70.0 96.7 92.3 54.3 59 96.1 87.1 89.6 73.6 451
Total 71.6 86.0 63.3 2,137 68.8 86.2 87.6 44.6 152 97.9 72.6 86.1 62.0 2,289 1 Food groups: a. infant formula, milk other than breast milk, cheese or yogurt or other milk products; b. foods made from grains, roots, and tubers, including porridge and fortified baby food from grains; c. vitamin A-rich fruits and vegetables (and red palm oil); d. other fruits and vegetables; e. eggs; f. meat, poultry, fish, and shellfish (and organ meats); g. legumes and nuts. 2 For breastfed children, minimum meal frequency is receiving solid or semi-solid food at least twice a day for infants 6-8 months and at least three times a day for children 9-23 months 3 Includes two or more feedings of commercial infant formula, fresh, tinned, and powdered animal milk, and yogurt 4 For non-breastfed children aged 6-23 months, minimum meal frequency is receiving solid or semi-solid food or milk feeds at least four times a day 5 Non-breastfed children aged 6-23 months are considered to be fed with a minimum standard of three Infant and Young Child Feeding Practices if they receive other milk or milk products at least twice a day, receive the minimum meal frequency, and receive solid or semi-solid foods from at least four food groups not including the milk or milk products food group 6 Breastfeeding, or not breastfeeding and receiving two or more feedings of commercial infant formula, fresh, tinned and powdered animal milk, and yogurt 7 Children are fed the minimum recommended number of times per day according to their age and breastfeeding status as described in footnotes 2 and 4
Nutrition of Children and Women 173
11.7 preseNce of iodized salt iN households
Iodine is an important micronutrient and dietary iodine deficiencies are a major public health con-cern worldwide. A lack of sufficient iodine is known to cause goiter, cretinism (a severe form of neurological defect), spontaneous abortion, premature birth, infertility, stillbirth and increased child mortality. Iodine defi-ciency disorder is the most common cause of preventable mental retardation and brain damage in the world. In the 2016 SLDHS all visited households were requested to provide a sample of the salt used for cooking to test the level of iodine. The iodine testing was successfully completed in 96 percent of the households in-cluded in the sample of the 2016 SLDHS. The remaining 4 percent of the households did not have salt in the household at the time of the survey (Table 11.8).
The results of testing the salt indicate that over ninety-five percent of households have salt with some iodine, a percentage that is very similar across sectors of residence. However, at the district level, the testing found that less than ninety percent of households in Batticaloa and Puttalam Districts had adequately iodized salt (only 85 percent each). The percentage with iodized salt is also greater in the richest households than among the poorest 20 percent of the households.
Demography and Health Survey - 2016 172
Table11.7.1.Infantandyoungchildfeeding(IYCF)practicesaccordingtoDHS-Vcalculation
Percentage of youngest children aged 6-23 months living with their mother who are fed according to three IYCF practices based on breastfeeding status, number of food groups, and times they are fed during the day or night preceding the survey, by background characteristics, Sri Lanka, 2016 Among breastfed children 6-23 months,
percentage fed: Among non-breastfed children 6-23 months,
percentage fed: Among all children 6-23 months, percentage
fed:
Background characteristic
3+ food groups1
Minimum meal
frequency2
Both 3+ food
groups and
minimum meal
frequency
Number of breastfed
children 6-23 months
Milk or milk
products3
4+ food groups1
Minimum meal
frequency4
With 3 IYCF
practices5
Number of non-
breastfed children 6-23 months
Breast milk, milk,
or milk products7
3+ or 4+ food
groups7
Minimum meal frequen
cy8
With all 3
IYCF practi
ces
Number of all
children 6-23
months Total
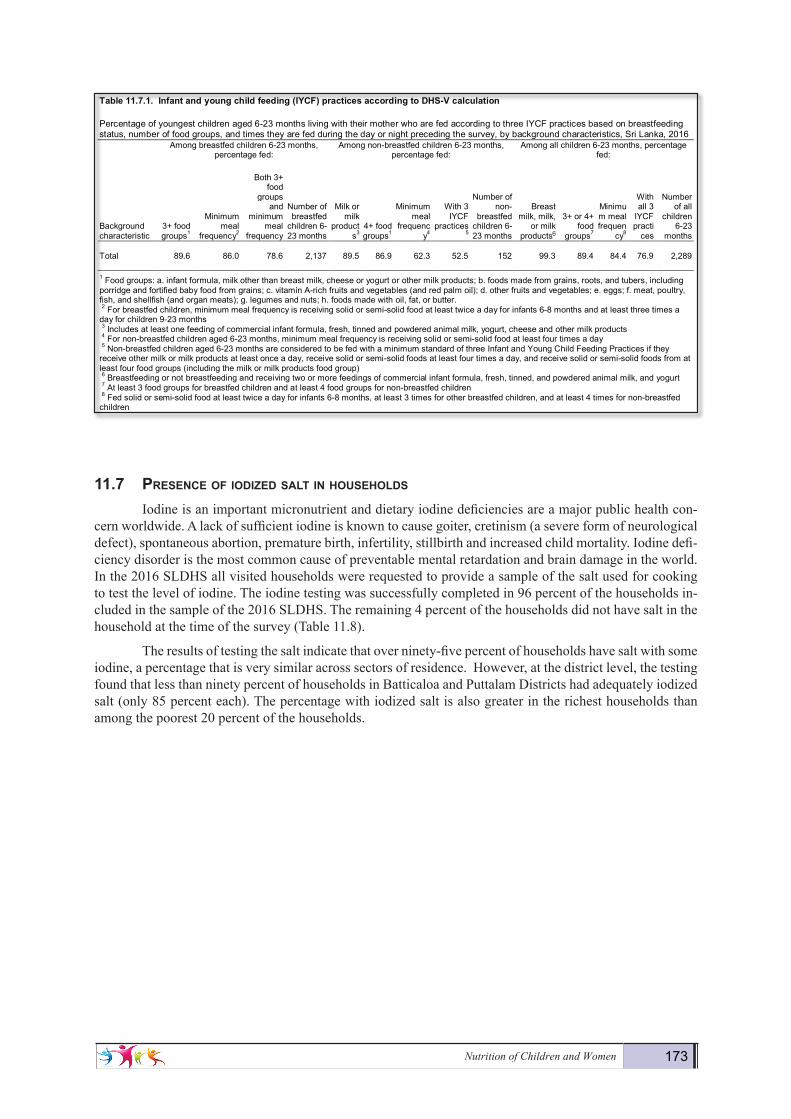
89.6 86.0 78.6 2,137 89.5 86.9 62.3 52.5 152 99.3 89.4 84.4 76.9 2,289
1 Food groups: a. infant formula, milk other than breast milk, cheese or yogurt or other milk products; b. foods made from grains, roots, and tubers, including porridge and fortified baby food from grains; c. vitamin A-rich fruits and vegetables (and red palm oil); d. other fruits and vegetables; e. eggs; f. meat, poultry, fish, and shellfish (and organ meats); g. legumes and nuts; h. foods made with oil, fat, or butter. 2 For breastfed children, minimum meal frequency is receiving solid or semi-solid food at least twice a day for infants 6-8 months and at least three times a day for children 9-23 months 3 Includes at least one feeding of commercial infant formula, fresh, tinned and powdered animal milk, yogurt, cheese and other milk products 4 For non-breastfed children aged 6-23 months, minimum meal frequency is receiving solid or semi-solid food at least four times a day 5 Non-breastfed children aged 6-23 months are considered to be fed with a minimum standard of three Infant and Young Child Feeding Practices if they receive other milk or milk products at least once a day, receive solid or semi-solid foods at least four times a day, and receive solid or semi-solid foods from at least four food groups (including the milk or milk products food group) 6 Breastfeeding or not breastfeeding and receiving two or more feedings of commercial infant formula, fresh, tinned, and powdered animal milk, and yogurt 7 At least 3 food groups for breastfed children and at least 4 food groups for non-breastfed children 8 Fed solid or semi-solid food at least twice a day for infants 6-8 months, at least 3 times for other breastfed children, and at least 4 times for non-breastfed children
11.7 PRESENCE OF IODIZED SALT IN HOUSEHOLDS
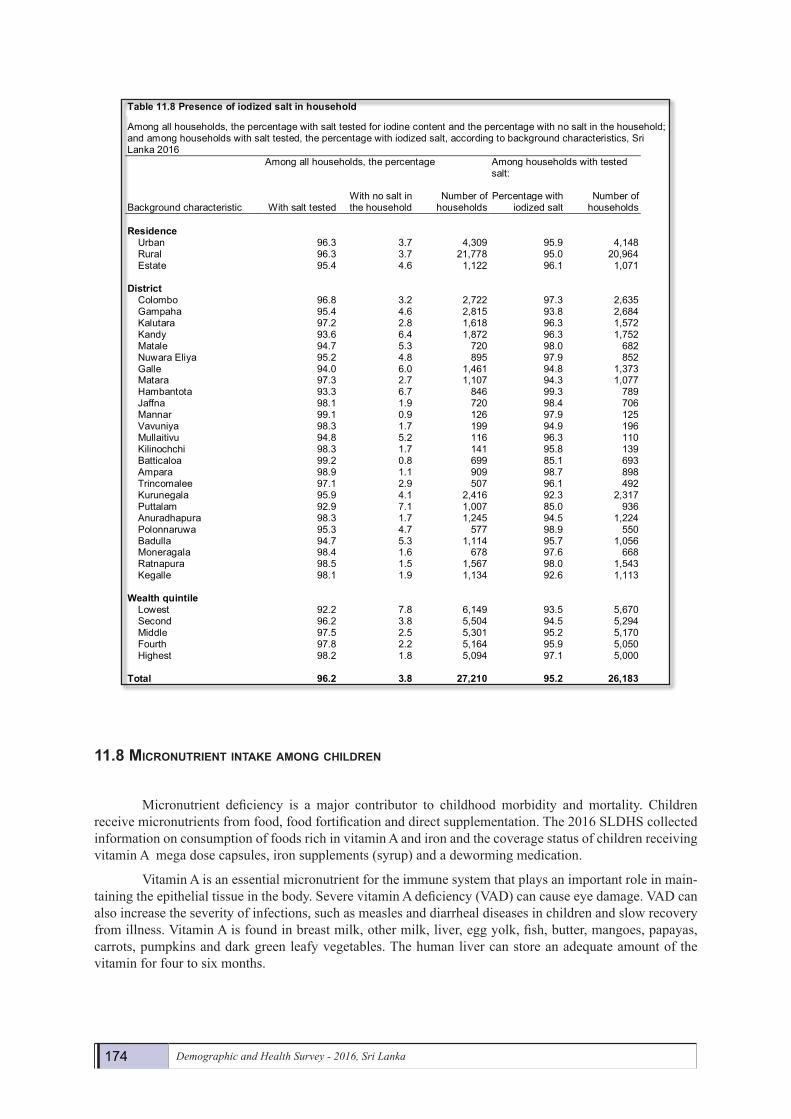
Iodine is an important micronutrient and dietary iodine deficiencies are a major public health concern worldwide. A lack of sufficient iodine is known to cause goiter, cretinism (a severe form of neurological defect), spontaneous abortion, premature birth, infertility, stillbirth and increased child mortality. Iodine deficiency disorder is the most common cause of preventable mental retardation and brain damage in the world. In the 2016 SLDHS all visited households were requested to provide a sample of the salt used for cooking to test the level of iodine. The iodine testing was successfully completed in 96 percent of the households included in the sample of the 2016 SLDHS. The remaining 4 percent of the households did not have salt in the household at the time of the survey (Table 11.8).
The results of testing the salt indicate that over ninety-five percent of households have salt with some iodine, a percentage that is very similar across sectors of residence. However, at the district level, the testing found that less than ninety percent of households in Batticaloa and Puttalam Districts had adequately iodized salt (only 85 percent each). The percentage with iodized salt is also greater in the richest households than among the poorest 20 percent of the households.
174 Demographic and Health Survey - 2016, Sri Lanka
11.8 MicroNutrieNt iNtake aMoNg childreN
Micronutrient deficiency is a major contributor to childhood morbidity and mortality. Children receive micronutrients from food, food fortification and direct supplementation. The 2016 SLDHS collected information on consumption of foods rich in vitamin A and iron and the coverage status of children receiving vitamin A mega dose capsules, iron supplements (syrup) and a deworming medication.
Vitamin A is an essential micronutrient for the immune system that plays an important role in main-taining the epithelial tissue in the body. Severe vitamin A deficiency (VAD) can cause eye damage. VAD can also increase the severity of infections, such as measles and diarrheal diseases in children and slow recovery from illness. Vitamin A is found in breast milk, other milk, liver, egg yolk, fish, butter, mangoes, papayas, carrots, pumpkins and dark green leafy vegetables. The human liver can store an adequate amount of the vitamin for four to six months.
Demography and Health Survey - 2016 173
Table11.8 Presenceofiodizedsaltinhousehold
Among all households, the percentage with salt tested for iodine content and the percentage with no salt in the household; and among households with salt tested, the percentage with iodized salt, according to background characteristics, Sri Lanka 2016 Among all households, the percentage Among households with tested
salt:
Background characteristic With salt tested With no salt in the household
Number of households
Percentage with iodized salt
Number of households
Residence
Urban 96.3 3.7 4,309 95.9 4,148 Rural 96.3 3.7 21,778 95.0 20,964 Estate 95.4 4.6 1,122 96.1 1,071
District Colombo 96.8 3.2 2,722 97.3 2,635 Gampaha 95.4 4.6 2,815 93.8 2,684 Kalutara 97.2 2.8 1,618 96.3 1,572 Kandy 93.6 6.4 1,872 96.3 1,752 Matale 94.7 5.3 720 98.0 682 Nuwara Eliya 95.2 4.8 895 97.9 852 Galle 94.0 6.0 1,461 94.8 1,373 Matara 97.3 2.7 1,107 94.3 1,077 Hambantota 93.3 6.7 846 99.3 789 Jaffna 98.1 1.9 720 98.4 706 Mannar 99.1 0.9 126 97.9 125 Vavuniya 98.3 1.7 199 94.9 196 Mullaitivu 94.8 5.2 116 96.3 110 Kilinochchi 98.3 1.7 141 95.8 139 Batticaloa 99.2 0.8 699 85.1 693 Ampara 98.9 1.1 909 98.7 898 Trincomalee 97.1 2.9 507 96.1 492 Kurunegala 95.9 4.1 2,416 92.3 2,317 Puttalam 92.9 7.1 1,007 85.0 936 Anuradhapura 98.3 1.7 1,245 94.5 1,224 Polonnaruwa 95.3 4.7 577 98.9 550 Badulla 94.7 5.3 1,114 95.7 1,056 Moneragala 98.4 1.6 678 97.6 668 Ratnapura 98.5 1.5 1,567 98.0 1,543 Kegalle 98.1 1.9 1,134 92.6 1,113
Wealthquintile Lowest 92.2 7.8 6,149 93.5 5,670 Second 96.2 3.8 5,504 94.5 5,294 Middle 97.5 2.5 5,301 95.2 5,170 Fourth 97.8 2.2 5,164 95.9 5,050 Highest 98.2 1.8 5,094 97.1 5,000
Total 96.2 3.8 27,210 95.2 26,183
11.8 MICRONUTRIENT INTAKE AMONG CHILDREN
Micronutrient deficiency is a major contributor to childhood morbidity and mortality. Children receive micronutrients from food, food fortification and direct supplementation. The 2016 SLDHS collected information on consumption of foods rich in vitamin A and iron and the coverage status of children receiving vitamin A mega dose capsules, iron supplements (syrup) and a deworming medication.
Vitamin A is an essential micronutrient for the immune system that plays an important role in maintaining the epithelial tissue in the body. Severe vitamin A deficiency (VAD) can cause eye damage. VAD can also increase the severity of infections, such as measles and diarrheal diseases in children and slow recovery from illness. Vitamin A is found in breast milk, other milk, liver, egg yolk, fish, butter, mangoes, papayas, carrots, pumpkins and dark green leafy vegetables. The human liver can store an adequate amount of the vitamin for four to six months.
Nutrition of Children and Women 175
Demography and Health Survey - 2016 174
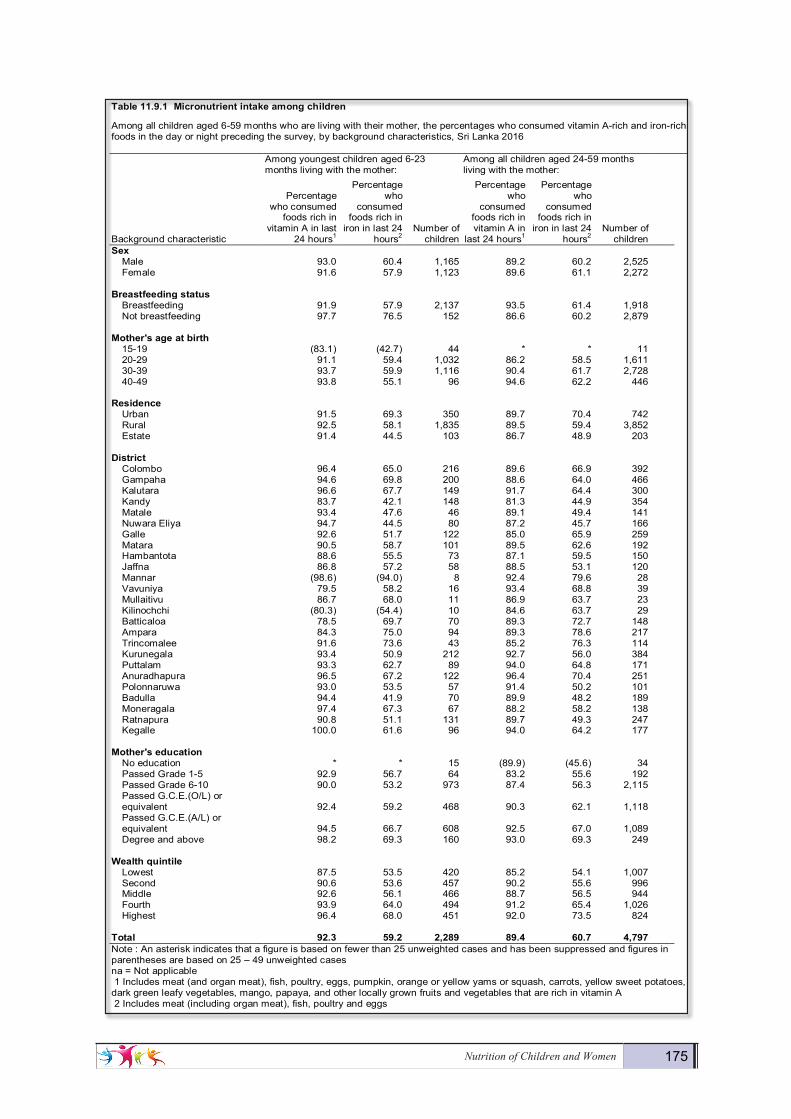
Table11.9.1Micronutrientintakeamongchildren
Among all children aged 6-59 months who are living with their mother, the percentages who consumed vitamin A-rich and iron-rich foods in the day or night preceding the survey, by background characteristics, Sri Lanka 2016 Among youngest children aged 6-23
months living with the mother: Among all children aged 24-59 months living with the mother:
Background characteristic
Percentage who consumed
foods rich in vitamin A in last
24 hours1
Percentage who
consumed foods rich in
iron in last 24 hours2
Number of children
Percentage who
consumed foods rich in vitamin A in
last 24 hours1
Percentage who
consumed foods rich in
iron in last 24 hours2
Number of children
Sex Male 93.0 60.4 1,165 89.2 60.2 2,525 Female 91.6 57.9 1,123 89.6 61.1 2,272
Breastfeedingstatus Breastfeeding 91.9 57.9 2,137 93.5 61.4 1,918 Not breastfeeding 97.7 76.5 152 86.6 60.2 2,879
Mother'sageatbirth 15-19 (83.1) (42.7) 44 * * 11 20-29 91.1 59.4 1,032 86.2 58.5 1,611 30-39 93.7 59.9 1,116 90.4 61.7 2,728 40-49 93.8 55.1 96 94.6 62.2 446
Residence Urban 91.5 69.3 350 89.7 70.4 742 Rural 92.5 58.1 1,835 89.5 59.4 3,852 Estate 91.4 44.5 103 86.7 48.9 203
District Colombo 96.4 65.0 216 89.6 66.9 392 Gampaha 94.6 69.8 200 88.6 64.0 466 Kalutara 96.6 67.7 149 91.7 64.4 300 Kandy 83.7 42.1 148 81.3 44.9 354 Matale 93.4 47.6 46 89.1 49.4 141 Nuwara Eliya 94.7 44.5 80 87.2 45.7 166 Galle 92.6 51.7 122 85.0 65.9 259 Matara 90.5 58.7 101 89.5 62.6 192 Hambantota 88.6 55.5 73 87.1 59.5 150 Jaffna 86.8 57.2 58 88.5 53.1 120 Mannar (98.6) (94.0) 8 92.4 79.6 28 Vavuniya 79.5 58.2 16 93.4 68.8 39 Mullaitivu 86.7 68.0 11 86.9 63.7 23 Kilinochchi (80.3) (54.4) 10 84.6 63.7 29 Batticaloa 78.5 69.7 70 89.3 72.7 148 Ampara 84.3 75.0 94 89.3 78.6 217 Trincomalee 91.6 73.6 43 85.2 76.3 114 Kurunegala 93.4 50.9 212 92.7 56.0 384 Puttalam 93.3 62.7 89 94.0 64.8 171 Anuradhapura 96.5 67.2 122 96.4 70.4 251 Polonnaruwa 93.0 53.5 57 91.4 50.2 101 Badulla 94.4 41.9 70 89.9 48.2 189 Moneragala 97.4 67.3 67 88.2 58.2 138 Ratnapura 90.8 51.1 131 89.7 49.3 247 Kegalle 100.0 61.6 96 94.0 64.2 177
Mother'seducation No education * * 15 (89.9) (45.6) 34 Passed Grade 1-5 92.9 56.7 64 83.2 55.6 192 Passed Grade 6-10 90.0 53.2 973 87.4 56.3 2,115 Passed G.C.E.(O/L) or equivalent 92.4 59.2 468 90.3 62.1 1,118 Passed G.C.E.(A/L) or equivalent 94.5 66.7 608 92.5 67.0 1,089 Degree and above 98.2 69.3 160 93.0 69.3 249
Wealthquintile Lowest 87.5 53.5 420 85.2 54.1 1,007 Second 90.6 53.6 457 90.2 55.6 996 Middle 92.6 56.1 466 88.7 56.5 944 Fourth 93.9 64.0 494 91.2 65.4 1,026 Highest 96.4 68.0 451 92.0 73.5 824
Total 92.3 59.2 2,289 89.4 60.7 4,797 Note : An asterisk indicates that a figure is based on fewer than 25 unweighted cases and has been suppressed and figures in parentheses are based on 25 – 49 unweighted cases na = Not applicable 1 Includes meat (and organ meat), fish, poultry, eggs, pumpkin, orange or yellow yams or squash, carrots, yellow sweet potatoes, dark green leafy vegetables, mango, papaya, and other locally grown fruits and vegetables that are rich in vitamin A 2 Includes meat (including organ meat), fish, poultry and eggs

176 Demographic and Health Survey - 2016, Sri Lanka
According to Table 11.9.1 ninety-two percent of children aged 6-23 months consumed foods rich in vitamin A the day or night preceding the survey. The consumption of foods rich in vitamin A increases with wealth quintile. The consumption of vitamin A rich food the day or night before the survey also varies by district, pointing to the need to target those districts in which children are less protected (Vavuniya and Batticaloa, among others)
Among children aged 24-59 months, eighty-nine percent of children consumed foods rich in vitamin A the day or night preceding the survey. A larger percentage of breastfed children aged 24-59 months con-sumed foods rich in vitamin A than non-breastfed children in the same age group (94 percent vs 87 percent). Very little variations are observed in the proportion of children who consumed food rich in vitamin A by residence, wealth quintile and districts. Percentage of children aged 24-59 months who consumed foods rich in vitamin A is positively associated with mother’s age at birth and mother’s education.
Iron is essential for cognitive development and low iron intake can contribute to anemia. Iron re-quirements are greatest at the age of 6-23 months, when growth is extremely rapid. According to Table 11.9.1, three in five children (59 percent) consumed food rich in iron in the 24 hours prior to the survey. A higher percentage of children in urban areas consume food rich in iron than those in the rural or estates sector (69, 58 and 45 percent respectively).
Among children aged 24-59 months, sixty-one percent of children consumed food rich in iron in the previous 24 hours with a higher percentage in urban sector than in the rural or estate sector. (70, 59 and 49 percent respectively). The highest percentages of children aged 24-59 months who consumed food rich in iron are observed among older mothers (62 percent) , the richest household (74 percent) and mothers with the highest educational level (69 percent).
Figure11.7PercentageofconsumingfoodsrichinvitaminAandironbyAgeGroups
Figure 11.7 - shows the 2016 SLDHS results for infants and young children aged 6-59 months con-suming foods rich in vitamin A and iron in the day or night preceding the survey. Trends of both consuming vitamin A rich foods and iron rich foods are positively associated with child age groups from 6 to 23 months. The proportions of children who consumed foods rich in vitamin A in the age group 24-59 months is less than the proportion of children in the age group 18-23 months.
79
94 96 9589
37
55
66 6661
0
20
40
60
80
100
120
6-8 9-11 12-17 18-23 24-59
Perc
enta
ge
Age group (months)
Percentage whoconsumed foods rich invitamin A in last 24 hours
Percentage whoconsumed foods rich iniron in last 24 hours
Nutrition of Children and Women 177
Demography and Health Survey - 2016 176
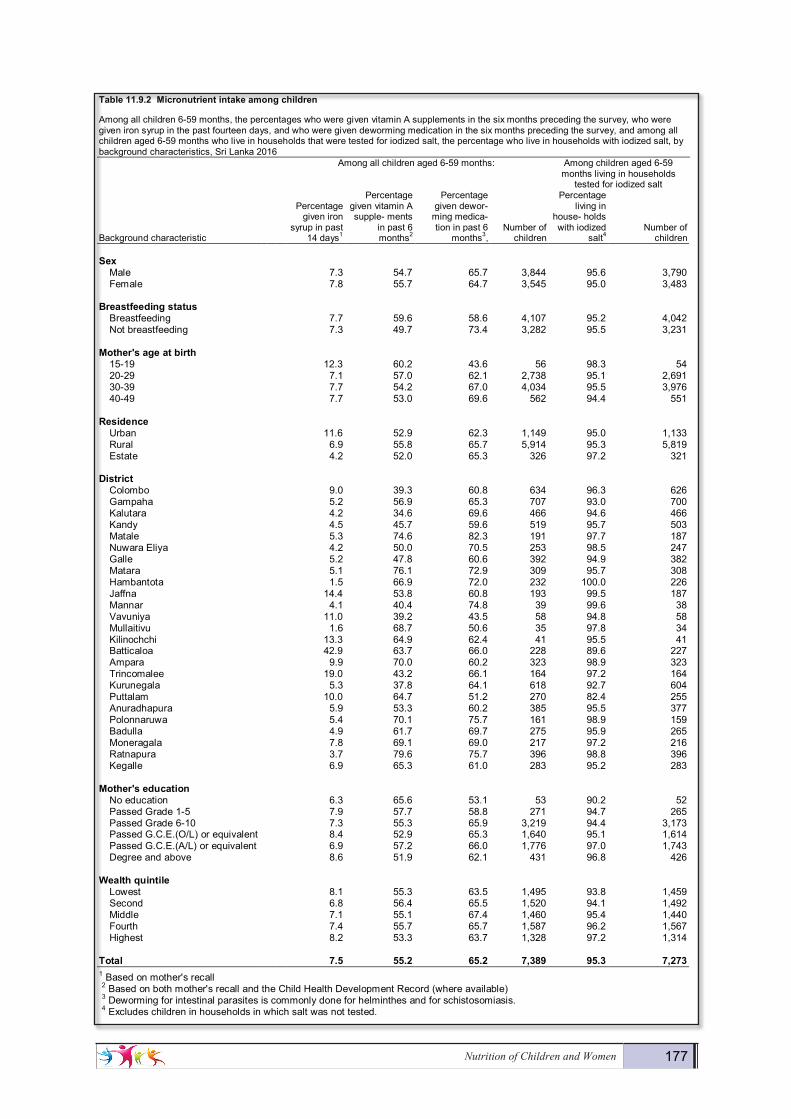
Table11.9.2Micronutrientintakeamongchildren
Among all children 6-59 months, the percentages who were given vitamin A supplements in the six months preceding the survey, who were given iron syrup in the past fourteen days, and who were given deworming medication in the six months preceding the survey, and among all children aged 6-59 months who live in households that were tested for iodized salt, the percentage who live in households with iodized salt, by background characteristics, Sri Lanka 2016 Among all children aged 6-59 months: Among children aged 6-59
months living in households tested for iodized salt
Background characteristic
Percentage given iron
syrup in past 14 days1
Percentage given vitamin A supple- ments
in past 6 months2
Percentage given dewor-
ming medica- tion in past 6
months3, Number of
children
Percentage living in
house- holds with iodized
salt4 Number of
children Sex
Male 7.3 54.7 65.7 3,844 95.6 3,790 Female 7.8 55.7 64.7 3,545 95.0 3,483
Breastfeedingstatus Breastfeeding 7.7 59.6 58.6 4,107 95.2 4,042 Not breastfeeding 7.3 49.7 73.4 3,282 95.5 3,231
Mother'sageatbirth 15-19 12.3 60.2 43.6 56 98.3 54 20-29 7.1 57.0 62.1 2,738 95.1 2,691 30-39 7.7 54.2 67.0 4,034 95.5 3,976 40-49 7.7 53.0 69.6 562 94.4 551
Residence Urban 11.6 52.9 62.3 1,149 95.0 1,133 Rural 6.9 55.8 65.7 5,914 95.3 5,819 Estate 4.2 52.0 65.3 326 97.2 321
District Colombo 9.0 39.3 60.8 634 96.3 626 Gampaha 5.2 56.9 65.3 707 93.0 700 Kalutara 4.2 34.6 69.6 466 94.6 466 Kandy 4.5 45.7 59.6 519 95.7 503 Matale 5.3 74.6 82.3 191 97.7 187 Nuwara Eliya 4.2 50.0 70.5 253 98.5 247 Galle 5.2 47.8 60.6 392 94.9 382 Matara 5.1 76.1 72.9 309 95.7 308 Hambantota 1.5 66.9 72.0 232 100.0 226 Jaffna 14.4 53.8 60.8 193 99.5 187 Mannar 4.1 40.4 74.8 39 99.6 38 Vavuniya 11.0 39.2 43.5 58 94.8 58 Mullaitivu 1.6 68.7 50.6 35 97.8 34 Kilinochchi 13.3 64.9 62.4 41 95.5 41 Batticaloa 42.9 63.7 66.0 228 89.6 227 Ampara 9.9 70.0 60.2 323 98.9 323 Trincomalee 19.0 43.2 66.1 164 97.2 164 Kurunegala 5.3 37.8 64.1 618 92.7 604 Puttalam 10.0 64.7 51.2 270 82.4 255 Anuradhapura 5.9 53.3 60.2 385 95.5 377 Polonnaruwa 5.4 70.1 75.7 161 98.9 159 Badulla 4.9 61.7 69.7 275 95.9 265 Moneragala 7.8 69.1 69.0 217 97.2 216 Ratnapura 3.7 79.6 75.7 396 98.8 396 Kegalle 6.9 65.3 61.0 283 95.2 283
Mother'seducation No education 6.3 65.6 53.1 53 90.2 52 Passed Grade 1-5 7.9 57.7 58.8 271 94.7 265 Passed Grade 6-10 7.3 55.3 65.9 3,219 94.4 3,173 Passed G.C.E.(O/L) or equivalent 8.4 52.9 65.3 1,640 95.1 1,614 Passed G.C.E.(A/L) or equivalent 6.9 57.2 66.0 1,776 97.0 1,743 Degree and above 8.6 51.9 62.1 431 96.8 426
Wealthquintile Lowest 8.1 55.3 63.5 1,495 93.8 1,459 Second 6.8 56.4 65.5 1,520 94.1 1,492 Middle 7.1 55.1 67.4 1,460 95.4 1,440 Fourth 7.4 55.7 65.7 1,587 96.2 1,567 Highest 8.2 53.3 63.7 1,328 97.2 1,314
Total 7.5 55.2 65.2 7,389 95.3 7,273 1 Based on mother's recall 2 Based on both mother's recall and the Child Health Development Record (where available) 3 Deworming for intestinal parasites is commonly done for helminthes and for schistosomiasis. 4 Excludes children in households in which salt was not tested.

178 Demographic and Health Survey - 2016, Sri Lanka
According to Table 11.9.2 eight percent of all children aged 6-59 months were given iron syrup in the fourteen days preceding the survey. Greater variation in the coverage of giving iron syrup in the past 14 days is observed in Batticaloa with the highest coverage of 43 percent compared to percentages in Mullaitivu and Hambantota Districts (2 percent).
Periodic dosing (every six months) of vitamin A is one method of ensuring that children at risk do not develop VAD. Table 11.9.2 also shows that more than half of the children aged 6-59 months were given vitamin A (55 percent) in the past six months. There are only slight differences in the proportion of children receiving vitamin A by background characteristics.
Figure11.8PercentagegivenIronsyrupandVitaminAbyagegroup
According to figure 11.8 , there are no large differences among percentages of children given iron syrup in past 14 days (around 9 percent to 11 percent) up to age group 18-23 months after which it reduces to7 percent in age group 24-59 months. Over 80 percent of children have been given vitamin A before their first birthday. Fifty-one percent of children aged 24-59 months of age received vitamin A in the past six months.
Periodic deworming for organisms such as helminthes can improve children’s micronutrient status. Sixty-five percent of children received deworming medication in the six months before the survey. The likelihood of receiving deworming medication increases with the child’s age. (see figure 11.9) However it must be noted here that the preventive periodic deworming programme starts from the age of 18 months.
Figure11.9Percentagegivendewormingmedicationbyagegroups
9 11 10 9 7
7580
61
53 51
6-8 9-11 12-17 18-23 24-59
Age group ( months)
Given Iron syrup in past 14 days Given vitamin A Mega dose in past 6 months
6
14
42
7177
0
10
20
30
40
50
60
70
80
90
6-8 9-11 12-17 18-23 24-59
Perc
enta
ge
Age group (months)

Nutrition of Children and Women 179
As mentioned in the previous section, iodine deficiency, most frequently caused by inadequate iodine intake, has serious effects on physical growth and mental development. Fortification of salt with iodine is the most common method of preventing iodine deficiency. Over ninety-five percent of children aged 6-59 months live in households with adequately iodized salt. There are few differentials in this figure by background characteristics. The percentage of children living in households that use adequately iodized salt is lowest in the Puttalam District (eight-two percent).
11.9 NutritioNal status of WoMeN Low pre-pregnancy BMI and short stature of women are risk factors for poor birth outcomes and delivery complications. The height of a woman is associated with past socio-economic status and nutrition during childhood and adolescence. The cut-off point at which mothers can be considered at- risk because of short stature is normally taken as below 145 cm. In developing countries being underweight during pregnancy is the leading risk factor for preventable death and diseases (WHO, 2002).
The BMI is used to measure underweight or obesity. It is expressed as weight in kilograms divided by height in meters squared (kg/m2). A cut-off point of 18.5 is used to define thinness or acute under-nutrition. A BMI of 25 or above usually indicates being overweight, and 29.9 or above indicates obesity (WHO, 1995). The prevalence of overweight women is a concern because it predisposes them to a wide range of health problems such as diabetes and heart disease, as well as poor birth outcomes. On the other end of the continuum, chronic energy deficiency of women leads to low work productivity and reduced resistance to illness. In the 2016 SLDHS measurements of weight and height was obtained for the majority of the ever-married women included in the sample (92 percent).
Tables 11.10 presents the mean values of the two indicators of nutritional status and the proportion of women falling into high-risk categories according to their background characteristics. Respondents for whom there was no information on height and/or weight, or for whom the values obtained were implausible, are excluded from this analysis. The data analysis on BMI is based on 16,806 ever-married women, while the height analysis is based on 17,888 ever-married women aged 15-49 years (98 percent).
11.9.1 height of WoMeN
In 2016, 7 percent of ever-married women fall below the cut-off of 145 cm. This value is slightly lower than the approximately 11 percent reported in 2006. Small stature is higher among women 40 and older than those under that age. The prevalence of shortness decreases as women’s education and household wealth increase (11 percent among the poorest quintile compared to only 4 percent for the richest quintile).
The prevalence of short stature among ever-married women in the estate sector is three time shigher than that observed among those residing in the urban sector (15 and 5 percent, respectively). Variations are also observed across districts, with higher percentages of women below 145 cm in Nuwara-Eliya (13 percent) and Ratnapura (15 percent).
11.9.2body Mass iNdex (bMi) of WoMeN
Bodymassindex(BMI)BMI is calculated by dividing weight in kilograms by height in metres squared (kg/m2). A BMI less than 18.5 indicates that the woman is too thin for her height and has a chronic energy deficiency. At the other end of the scale, women are considered overweight if their BMI falls between 25.0 and 29.9 and are obese if their BMI is greater than or equal to 30.0.
sample : Women age15-49 who are not pregnant and who have not had a birth in the 2 months before the survey
180 Demographic and Health Survey - 2016, Sri Lanka
The mean BMI for ever-married women age 15-49 years is 24.8. This value is an increase from 23.1 as measured in 2006-07. From the BMI distribution, we can see that only 46 percent of the ever-married women have a normal BMI (between 18.5 and 24.9). Of the 54 percent remaining, 9 percent are considered thin (BMI<18.5), 32 percent overweight (BMI between 25.0 and 29.9), and 13 percent obese (BMI of 30 or higher) (Table 11.10).
The prevalence of thinness varies with the place of residence of the woman (22 percent among ever-married women residing in the estates sector, compared to less than seven percent among those of the urban and rural sectors. Women in the districts of Ratnapura (15 percent) and Killinochci (14 percent) have the highest prevalence of thinness.
Most women who are thin are mildly thin (5 percent); however, 4 percent of women are moderately or severely thin (BMI<17), which indicates chronic energy deficiency. Moderate to severe thinness is highest in the youngest age group (11 percent). Women in the estate sector are three times as likely to be in this category as urban and rural woman. As with low stature, the prevalence of severe and moderate thinness decreases with the level of education of the woman and wealth of the household.
Forty-five percent of ever-married women are overweight or obese (BMI>25). The percentage of women who are overweight or obese increases with the age of the woman, their level of education, and the wealth of their households. Compared to 2006-07, the percentage of ever-married women overweight or obese has increased substantially. Thus, in the last ten years, the percentage of overweight women increased by 33 percent (from 24 percent in 2006-07 to 32 percent in 2016), while the percentage of obese ever-married women increased from 7 percent to 13 percent during the same period.
The prevalence of overweight and obesity is much higher among women living in the urban sector (36 percent and 20 percent, respectively) than in the rural or estates sectors. The prevalence of overweight and obesity is positively associated with the level of education of the woman and the wealth of the household in which they reside (Table 11.10). By district, the prevalence of overweight and obesity is at the highest points in Colombo (37 and 19 percent), Gampaha (35 and 16 percent), and in Mannar (39 and 16 percent).
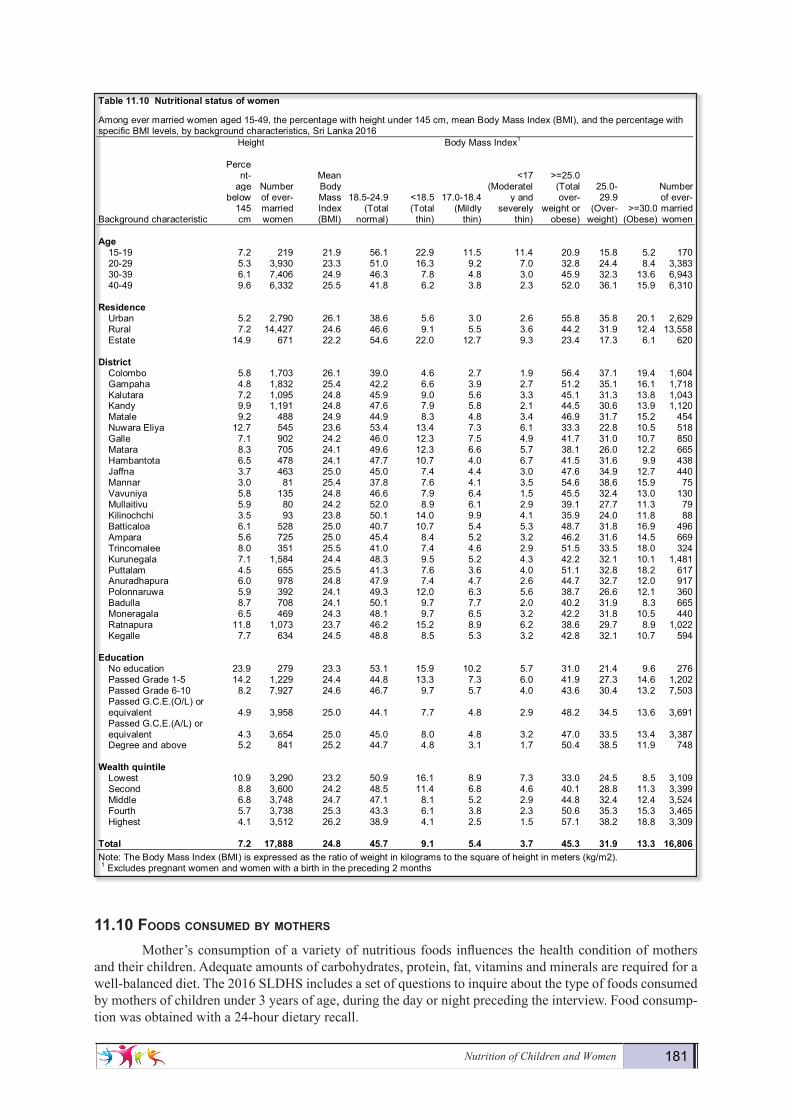
Nutrition of Children and Women 181
11.10 foods coNsuMed by Mothers
Mother’s consumption of a variety of nutritious foods influences the health condition of mothers and their children. Adequate amounts of carbohydrates, protein, fat, vitamins and minerals are required for a well-balanced diet. The 2016 SLDHS includes a set of questions to inquire about the type of foods consumed by mothers of children under 3 years of age, during the day or night preceding the interview. Food consump-tion was obtained with a 24-hour dietary recall.
Demography and Health Survey - 2016 180
Table11.10 Nutritionalstatusofwomen
Among ever married women aged 15-49, the percentage with height under 145 cm, mean Body Mass Index (BMI), and the percentage with specific BMI levels, by background characteristics, Sri Lanka 2016 Height Body Mass Index1
Background characteristic
Percent-
age below
145 cm
Number of ever-married women
Mean Body Mass Index (BMI)
18.5-24.9 (Total
normal)
<18.5 (Total
thin)
17.0-18.4 (Mildly
thin)
<17 (Moderatel
y and severely
thin)
>=25.0 (Total over-
weight or obese)
25.0-29.9
(Over- weight)
>=30.0 (Obese)
Number of ever-married women
Age
15-19 7.2 219 21.9 56.1 22.9 11.5 11.4 20.9 15.8 5.2 170 20-29 5.3 3,930 23.3 51.0 16.3 9.2 7.0 32.8 24.4 8.4 3,383 30-39 6.1 7,406 24.9 46.3 7.8 4.8 3.0 45.9 32.3 13.6 6,943 40-49 9.6 6,332 25.5 41.8 6.2 3.8 2.3 52.0 36.1 15.9 6,310
Residence Urban 5.2 2,790 26.1 38.6 5.6 3.0 2.6 55.8 35.8 20.1 2,629 Rural 7.2 14,427 24.6 46.6 9.1 5.5 3.6 44.2 31.9 12.4 13,558 Estate 14.9 671 22.2 54.6 22.0 12.7 9.3 23.4 17.3 6.1 620
District Colombo 5.8 1,703 26.1 39.0 4.6 2.7 1.9 56.4 37.1 19.4 1,604 Gampaha 4.8 1,832 25.4 42.2 6.6 3.9 2.7 51.2 35.1 16.1 1,718 Kalutara 7.2 1,095 24.8 45.9 9.0 5.6 3.3 45.1 31.3 13.8 1,043 Kandy 9.9 1,191 24.8 47.6 7.9 5.8 2.1 44.5 30.6 13.9 1,120 Matale 9.2 488 24.9 44.9 8.3 4.8 3.4 46.9 31.7 15.2 454 Nuwara Eliya 12.7 545 23.6 53.4 13.4 7.3 6.1 33.3 22.8 10.5 518 Galle 7.1 902 24.2 46.0 12.3 7.5 4.9 41.7 31.0 10.7 850 Matara 8.3 705 24.1 49.6 12.3 6.6 5.7 38.1 26.0 12.2 665 Hambantota 6.5 478 24.1 47.7 10.7 4.0 6.7 41.5 31.6 9.9 438 Jaffna 3.7 463 25.0 45.0 7.4 4.4 3.0 47.6 34.9 12.7 440 Mannar 3.0 81 25.4 37.8 7.6 4.1 3.5 54.6 38.6 15.9 75 Vavuniya 5.8 135 24.8 46.6 7.9 6.4 1.5 45.5 32.4 13.0 130 Mullaitivu 5.9 80 24.2 52.0 8.9 6.1 2.9 39.1 27.7 11.3 79 Kilinochchi 3.5 93 23.8 50.1 14.0 9.9 4.1 35.9 24.0 11.8 88 Batticaloa 6.1 528 25.0 40.7 10.7 5.4 5.3 48.7 31.8 16.9 496 Ampara 5.6 725 25.0 45.4 8.4 5.2 3.2 46.2 31.6 14.5 669 Trincomalee 8.0 351 25.5 41.0 7.4 4.6 2.9 51.5 33.5 18.0 324 Kurunegala 7.1 1,584 24.4 48.3 9.5 5.2 4.3 42.2 32.1 10.1 1,481 Puttalam 4.5 655 25.5 41.3 7.6 3.6 4.0 51.1 32.8 18.2 617 Anuradhapura 6.0 978 24.8 47.9 7.4 4.7 2.6 44.7 32.7 12.0 917 Polonnaruwa 5.9 392 24.1 49.3 12.0 6.3 5.6 38.7 26.6 12.1 360 Badulla 8.7 708 24.1 50.1 9.7 7.7 2.0 40.2 31.9 8.3 665 Moneragala 6.5 469 24.3 48.1 9.7 6.5 3.2 42.2 31.8 10.5 440 Ratnapura 11.8 1,073 23.7 46.2 15.2 8.9 6.2 38.6 29.7 8.9 1,022 Kegalle 7.7 634 24.5 48.8 8.5 5.3 3.2 42.8 32.1 10.7 594
Education No education 23.9 279 23.3 53.1 15.9 10.2 5.7 31.0 21.4 9.6 276 Passed Grade 1-5 14.2 1,229 24.4 44.8 13.3 7.3 6.0 41.9 27.3 14.6 1,202 Passed Grade 6-10 8.2 7,927 24.6 46.7 9.7 5.7 4.0 43.6 30.4 13.2 7,503 Passed G.C.E.(O/L) or equivalent 4.9 3,958 25.0 44.1 7.7 4.8 2.9 48.2 34.5 13.6 3,691 Passed G.C.E.(A/L) or equivalent 4.3 3,654 25.0 45.0 8.0 4.8 3.2 47.0 33.5 13.4 3,387 Degree and above 5.2 841 25.2 44.7 4.8 3.1 1.7 50.4 38.5 11.9 748
Wealthquintile Lowest 10.9 3,290 23.2 50.9 16.1 8.9 7.3 33.0 24.5 8.5 3,109 Second 8.8 3,600 24.2 48.5 11.4 6.8 4.6 40.1 28.8 11.3 3,399 Middle 6.8 3,748 24.7 47.1 8.1 5.2 2.9 44.8 32.4 12.4 3,524 Fourth 5.7 3,738 25.3 43.3 6.1 3.8 2.3 50.6 35.3 15.3 3,465 Highest 4.1 3,512 26.2 38.9 4.1 2.5 1.5 57.1 38.2 18.8 3,309
Total 7.2 17,888 24.8 45.7 9.1 5.4 3.7 45.3 31.9 13.3 16,806 Note: The Body Mass Index (BMI) is expressed as the ratio of weight in kilograms to the square of height in meters (kg/m2). 1 Excludes pregnant women and women with a birth in the preceding 2 months

182 Demographic and Health Survey - 2016, Sri Lanka
Eighty-eight percent of mothers had eaten vitamin A rich food, and 62 percent had eaten animal protein (other than dairy). Sixty-nine percent of women ate legumes or legume –based food in the previous day. The consumption of animal protein (other than dairy) increases with the level of education of the moth-er and wealth of the household. In the estate sector, the consumption of all protein sources such as milk, meat/fish/poultry/ eggs, legumes and cheese/ yogurt is lower than in urban and rural areas. Sugary foods and foods made with oil/fat/butter are most commonly consumed by the mothers in urban sectorsrather than rural or estate sector mothers. Mothers in the lowest wealth quintile have less variety in their diets than those in the highest wealth quintile, a diet that is particularly deficient in the consumption of cheese/yogurt. The consumption of cheese/yogurt in the highest wealth quintile mothers is approximately 3 times of that of the lowest wealth quintile.
Demography and Health Survey - 2016 182
Table11.11 Foodsconsumedbymothersinthedayornightprecedingtheinterview
Among mothers aged 15-49 with a child under age three years living with them, the percentage who consumed specific types of foods in the day or night preceding the interview, by background characteristics, Sri Lanka 2016 Liquids Solid or semi-solid foods
Background characteristic Milk
Tea/ coffee
Other liquids
Foods made from
grains
Foods made from
roots/ tubers
Foods made from
legumes
Meat/ fish/
shellfish/ poultry/
eggs Cheese/
yogurt
Vitamin A -rich fruits/
vegetables Other fruits/ vegetables
Other solid or
semi- solid food
Foods made
with oil/ fat/
butter Sugary
foods
Number of
women Age
15-19 17.7 87.3 31.9 96.5 53.9 64.2 55.5 20.3 85.4 43.2 89.0 49.4 25.6 70 20-29 18.0 89.9 26.9 95.6 53.1 68.1 61.7 21.2 87.5 50.3 88.9 45.5 27.3 1,952 30-39 18.6 91.8 23.7 95.9 55.3 68.8 63.4 22.1 89.1 52.6 89.0 47.5 28.0 2,272 40-49 16.8 92.0 24.0 97.5 60.6 73.1 54.9 20.3 86.7 56.7 93.5 56.5 33.4 223
Residence
Urban 23.2 89.4 34.9 94.1 55.1 64.3 73.7 26.6 85.2 50.8 83.4 49.6 35.5 708 Rural 17.5 91.2 23.5 96.4 54.6 69.5 60.6 21.1 89.2 51.8 90.4 46.7 26.4 3,620 Estate 14.5 92.7 21.5 93.6 52.0 68.0 47.4 12.6 81.1 52.6 86.8 45.6 28.9 189
District
Colombo 17.3 90.5 39.0 96.7 58.1 68.1 71.1 29.6 88.9 49.2 83.1 53.1 37.5 412 Gampaha 15.1 91.5 25.8 98.7 55.7 72.6 63.8 23.4 85.1 50.8 87.1 56.1 26.2 383 Kalutara 10.4 97.8 15.8 98.9 56.5 86.1 61.7 17.2 92.4 63.9 86.5 44.5 15.0 285 Kandy 36.2 88.9 26.5 99.2 45.4 68.8 46.4 23.9 83.9 55.1 89.5 65.6 34.1 322 Matale 10.9 94.4 28.3 98.5 42.8 75.0 58.4 25.5 95.5 46.9 98.5 84.3 36.0 113 Nuwara Eliya 13.1 92.4 16.5 92.6 57.5 66.7 50.3 16.3 88.4 55.9 89.0 43.2 30.4 146 Galle 6.0 86.3 20.2 98.9 45.9 78.4 57.6 24.7 88.5 63.1 94.8 65.3 33.0 236 Matara 6.2 94.5 16.7 90.5 53.7 83.3 68.9 26.2 91.2 69.5 97.1 62.2 30.7 183 Hambantota 15.8 85.1 31.5 97.9 63.3 83.7 76.8 47.2 92.6 84.8 97.2 68.0 28.4 149 Jaffna 68.7 85.9 38.2 88.7 57.4 43.4 58.0 15.8 73.2 48.1 81.1 39.4 30.7 115 Mannar 48.9 80.0 33.6 94.3 46.9 36.5 87.9 20.8 69.0 30.1 83.4 56.4 25.1 20 Vavuniya 57.7 83.9 24.9 90.3 46.5 19.7 60.8 6.7 75.5 36.7 68.5 13.2 28.5 30 Mullaitivu 65.6 95.6 19.7 99.2 50.3 37.0 68.1 4.0 75.6 40.0 72.9 30.9 9.1 21 Kilinochchi 60.9 82.6 29.7 74.6 39.8 29.9 67.0 8.4 79.8 21.1 61.6 39.8 16.6 21 Batticaloa 35.7 92.6 28.2 94.1 53.5 38.9 80.9 19.1 78.7 44.1 80.8 16.5 41.6 137 Ampara 25.1 85.0 19.4 73.4 56.7 49.4 80.6 22.8 78.4 53.0 84.9 29.7 24.6 197 Trincomalee 20.5 83.4 44.1 95.0 54.4 34.7 86.7 19.4 78.9 58.0 88.5 19.4 24.5 106 Kurunegala 11.5 90.6 19.9 97.5 54.9 68.6 54.1 17.4 89.5 45.8 93.4 32.8 29.1 388 Puttalam 14.7 97.0 26.7 97.4 68.9 65.1 63.1 13.1 97.7 37.3 86.5 30.4 25.8 156 Anuradhapura 14.8 97.2 51.7 98.1 72.0 71.9 75.4 24.4 97.3 53.0 93.3 18.2 27.6 250 Polonnaruwa 30.9 88.2 12.7 97.8 58.0 66.3 58.7 20.3 94.4 40.8 94.0 51.4 30.0 114 Badulla 9.3 89.9 17.6 96.5 35.6 63.4 45.5 12.9 92.3 47.8 86.6 30.6 21.4 168 Moneragala 2.0 93.6 13.8 97.8 40.1 80.5 53.5 6.6 90.7 23.2 82.1 52.8 7.1 140 Ratnapura 20.0 92.4 16.2 100.0 49.3 77.8 50.5 17.5 82.1 61.0 95.2 66.9 33.3 249 Kegalle 4.3 88.9 14.3 95.9 65.7 74.3 53.6 24.4 98.1 28.3 92.9 46.0 12.9 178
Education
No education (16.0) (98.3) (6.0) (100.0) (58.8) (63.3) (46.8) (8.1) (69.3) (31.7) (73.0) (49.9) (20.5) 32 Passed Grade 1-5 17.9 90.6 22.6 91.1 39.6 59.9 56.4 11.8 74.6 41.3 78.8 38.3 27.7 143 Passed Grade 6-10 17.1 91.0 19.6 95.3 48.6 64.1 56.3 15.6 85.2 48.3 88.1 42.0 24.8 1,931 Passed G.C.E.(O/L) or equivalent 19.2 91.0 28.8 95.4 56.9 66.5 64.2 23.1 88.5 51.4 90.1 46.7 27.9 979 Passed G.C.E.(A/L) or equivalent 17.9 91.0 29.5 97.3 61.4 76.6 67.6 28.4 93.7 57.5 91.8 54.2 31.5 1,134 Degree and above 24.0 90.1 36.8 97.9 66.4 79.9 76.4 35.9 94.8 59.1 89.6 58.9 35.4 298
Wealthquintile
Lowest 19.7 91.0 18.3 93.9 45.3 57.7 55.5 12.7 79.3 46.3 85.3 37.6 21.6 859 Second 17.9 89.7 22.3 95.8 50.3 66.7 55.7 14.3 87.0 47.2 89.3 41.2 22.9 903 Middle 17.3 91.6 24.5 95.7 57.5 70.0 58.5 18.4 89.6 52.5 92.0 48.6 30.1 905 Fourth 15.3 90.6 27.7 96.5 58.8 72.1 67.0 27.6 92.3 54.4 90.7 50.4 31.3 990 Highest 21.5 91.9 33.1 97.4 60.4 76.3 73.7 34.6 92.3 57.8 88.1 57.5 33.3 861
Total 18.2 90.9 25.2 95.9 54.6 68.7 62.1 21.6 88.2 51.7 89.2 47.1 27.9 4,518 Note: Foods consumed in the last "24-hour" period (yesterday and last night). 1 Includes [list fruits and vegetables included in the questionnaire such as pumpkin, or yellow yams or squash, carrots, yellow sweet potatoes, green leafy vegetables, mangoes, papayas, and other locally grown fruits and vegetables that are rich in vitamin A]

HIV/AIDS-RELATED KNOWLEDGE, ATTITUDES, AND BEHAVIOR 183
11.11 MicroNutrieNt iNtake aMoNg Mothers
Low nutritional status is one of the most important health and welfare problems in Sri Lan-ka. Young children and women of reproductive age are especially vulnerable to nutritional deficits and micronutrient deficiencies.Micronutrient intake can improve the nutritional and immune status of pregnant women and conse-quently, prevent maternal and ne-onatal deaths. Micronutrient de-ficiencies during pregnancy may be caused by inadequate intake of meat, fruits and vegetables or by infections (WHO, 2011).
Parasitic infections may cause iron-deficiency anemia. Deworming during pregnancy is an effective preventive measure against this type of anemia and can improve both the health of the woman and her unborn child. In the 2016 SLDHS, all ever mar-ried women aged 15-49 with a birth in the five years preceding the survey were asked if they ever took any drug for intestinal worms during the pregnancy of their last birth. Table 11.12 shows that, overall, 97 percent of these women took deworming medi-cation during the pregnancy of their last birth. This high percent-age presents small variations by background characteristics of the mother, in particular for younger mothers (less than age 20) who appear to be more likely to take deworming medication during pregnancy than older women. No reasonable variations are ob-served among mother’s residen-tial sector nor in the wealth quin-tiles from lowest to highest.
Demography and Health Survey - 2016 184
Table11.12 Micronutrientintakeamongmothers
Among ever-married women age 15-49 with a child born in the 5 years preceding the survey, percentage who took deworming medication during the pregnancy of the last child; and among women age 15-49 with a child born in the 5 years preceding the survey and who live in households that were tested for iodized salt, percentage who live in households with iodized salt, according to background characteristics, Sri Lanka 2016 Among women
with a child born in the last five years,
who live in households that were tested for
iodized salt
Background characteristic
Percentage of women
who took deworming medication
during pregnancy of
last birth Number of
women
Percentage living in house-
holds with iodized salt1
Number of women
Age
15-19 100.0 75 98.7 74 20-29 97.3 2,727 95.3 2,684 30-39 96.6 3,788 95.6 3,734 40-49 97.0 548 94.2 538
Residence Urban 95.4 1,114 95.2 1,098 Rural 97.3 5,728 95.3 5,640 Estate 95.9 296 97.6 291
District Colombo 94.0 631 96.5 624 Gampaha 95.9 666 93.8 658 Kalutara 98.1 443 95.4 442 Kandy 93.9 489 96.4 474 Matale 98.8 192 97.5 188 Nuwara Eliya 97.0 232 98.7 229 Galle 98.5 380 94.8 372 Matara 98.7 291 95.1 290 Hambantota 99.5 233 100.0 228 Jaffna 96.2 170 99.5 165 Mannar 98.0 35 99.6 35 Vavuniya 96.6 53 95.6 53 Mullaitivu 99.8 32 97.6 31 Kilinochchi 97.0 40 93.9 39 Batticaloa 98.9 217 88.6 217 Ampara 99.4 305 98.6 304 Trincomalee 97.8 168 96.0 168 Kurunegala 98.7 613 92.4 598 Puttalam 97.8 262 83.7 248 Anuradhapura 99.3 369 96.0 363 Polonnaruwa 100.0 167 99.0 164 Badulla 98.3 271 95.0 263 Moneragala 98.3 208 97.6 208 Ratnapura 99.5 393 98.8 393 Kegalle 80.9 275 94.6 275
Education No education 93.9 51 92.2 49 Passed Grade 1-5 97.4 257 94.6 253 Passed Grade 6-10 97.9 3,104 94.6 3,059 Passed G.C.E.(O/L) or equivalent 96.6 1,608 95.2 1,581 Passed G.C.E.(A/L) or equivalent 96.4 1,706 96.9 1,679 Degree and above 92.6 413 97.1 408
Wealthquintile Lowest 96.5 1,413 93.6 1,382 Second 97.4 1,457 94.3 1,432 Middle 98.0 1,463 95.7 1,442 Fourth 97.6 1,524 96.3 1,505 Highest 94.7 1,280 97.1 1,268
Total 96.9 7,138 95.4 7,029 1 Excludes women in households where salt was not tested.

184 Demographic and Health Survey - 2016, Sri Lanka