NUTRITION COUNTRY PROFILE SOMALIA - fao.org · Somalia Nutrition Profile – Food and Nutrition...
32
FOOD AND AGRICULTURE ORGANIZATION OF THE UNITED NATIONS NUTRITION COUNTRY PROFILE SOMALIA
Transcript of NUTRITION COUNTRY PROFILE SOMALIA - fao.org · Somalia Nutrition Profile – Food and Nutrition...

FOOD AND AGRICULTURE ORGANIZATION OF THE UNITED NATIONS
NUTRITION COUNTRY PROFILE SOMALIA
Somalia Nutrition Profile – Food and Nutrition Division, FAO, 2005 2
Acknowledgments
This profile was prepared by Margaret A. Wagah, Lecturer, Kenyatta University, Nairobi, in collaboration with Estelle Bader and Chiara Deligia, Consultants, and Marie Claude Dop, Nutrition Officer, Nutrition Planning, Assessment and Evaluation Service, Food and Nutrition Division, Food and Agriculture Organization of the United Nations. The assistance of Noreen Prendiville, Food Security Analysis Unit, Somalia, and the contribution of volunteer Chloé Charrondière are gratefully acknowledged.

Somalia Nutrition Profile – Food and Nutrition Division, FAO, 2005 3
Summary
Somalia is located in the Horn of Africa. The country has been affected by a civil war since 1991 and the situation has been further aggravated by prolonged droughts. The combination of conflict and natural disasters has eroded livelihoods, caused structural food insecurity, population displacements and extreme poverty. Moreover, as a consequence of civil insecurity and of the absence of a central government, the Somali health and educational systems have ceased functioning. The country belongs to the group of Low-Income Countries Under Stress (LICUS). Poverty and food insecurity affect vulnerable groups such as nomadic pastoral communities and internally displaced people particularly, as well as the rural population as a whole. Agriculture and livestock rearing are the most important sectors of the economy, but the country is still heavily dependant on external aid and remittances from Somali living abroad. The population is predominantly rural and very young, with a high crude birth rate and a very high dependency ratio. The health and educational sectors now depend on international organizations and NGOs. Problems of insecurity limit the provision of services. As a consequence, the level of indicators of human development in Somalia is very low. Infant, child and maternal mortality rates are extremely high. Incidence of infectious diseases is very high, and immunization rates are low. Life expectancy is estimated at 47 years.
The food supply is based on milk and cereals. The dietary energy supply is insufficient to meet the population’s energy requirements. The country depends heavily on imports of cereals, vegetable oil and sweeteners. The supply of fruit and vegetables, as well as that of meat, is low. Agro pastoral communities have a slightly more diversified diet than pastoral communities. Although breastfeeding is common, the rate of exclusive breastfeeding is low and bottle-feeding is widespread. The limited data available also indicate a short duration of breastfeeding.
The security situation precludes conducting large-scale nutrition surveys. Many district surveys are carried out but an overall assessment of the situation at country level is impossible and trends cannot be estimated. Most surveys show that the level of wasting in underfives is extremely high but important variations between districts and over time are also observed. Central/South Somalia is the region most affected by wasting. Data on stunting are limited. Iodine deficiency is probably a major public health problem as access to iodized salt is extremely limited, but data are lacking to assess the situation. Limited data show that vitamin A deficiency is highly prevalent. The coverage by supplementation of preschool children and mothers with vitamin A is still insufficient. Small-scale studies also show that the prevalence of anemia is very high among preschool children.

Somalia Nutrition Profile – Food and Nutrition Division, FAO, 2005 4
Summary Table Basic Indicators Year
Population Total population 6.799 million 2002 Rural population 76 % 2000 Population under 15 years of age 44 % 2000 Annual population growth rate 3.2 % 2000/05 Life expectancy at birth 47 years 2000 Agriculture Agricultural area 70 % 2002 Arable and permanent cropland per agricultural inhabitant 0.3 Ha 2002 Level of development Human development and poverty Human development index 0.284 [0-1] 2001 Proportion of population living with less than 1$ a day (PPP) MDG1 60 % 1990 Population living below the national poverty line MDG1 n.a. Education Gross primary enrolment ratio MDG2 17 % 2002 Youth literacy (15-24 years) MDG2 n.a. Ratio of girls to boys in primary education MDG3 n.a. Health Infant mortality rate MDG4 133 ‰ 2003 Under-five mortality rate MDG4 225 ‰ 2003 Maternal mortality ratio (adjusted) MDG5 1 100 per 100 000 live births 2000 Malaria-related mortality rate in under-fives MDG6 373 per 100 000 deaths 2000 Environment Sustainable access to an improved water source in rural area MDG7 27 % of population 2002
Nutrition indicators Year Energy requirements Population energy requirements n.a. Food supply Dietary Energy Supply (DES) 1 734 kcal per capita/day 2001 Prevalence of undernourishment MDG1 n.a. Percent of energy from protein 12 % 2000/02 Percent of energy from lipids 30 % 2000/02 Food diversification index 62 % 2000/02 Food consumption Average energy intake (per capita or per adult) n.a. Percent of energy from protein n.a. Percent of energy from lipids n.a. Infant and young child feeding Age Exclusive breastfeeding rate <4 months 21 % 1999 Timely complementary feeding rate 6-9 months n.a. Bottle-feeding rate 0-11 months n.a. Continued breastfeeding rate at 2 years of age 8 % 1999 Nutritional anthropometry Stunting in children under 5 years 23 % 1999 Wasting in children under 5 years 17 % 1999 Underweight in children under 5 years MDG1 26 % 1999 Women with BMI<18.5 kg/m² n.a. Micronutrient deficiencies Prevalence of goitre in school-age children n.a. Percentage of households consuming adequately iodized salt <1 % 1999 Prevalence of clinical vitamin A deficiency in preschool children n.a. Prevalence of vitamin A supplementation in children 39 % 1999 Prevalence of vitamin A supplementation in mothers 13 % 1999 Prevalence of anemia in women n.a. Prevalence of iron supplementation in mothers n.a. MDG: Millennium Development Goal; n.a.: not available

Somalia Nutrition Profile – Food and Nutrition Division, FAO, 2005 5
TABLE OF CONTENTS
Acknowledgments.................................................................................................................................. 2 Summary ................................................................................................................................................. 3 Summary Table....................................................................................................................................... 4 List of tables and figures ....................................................................................................................... 6 Acronyms ................................................................................................................................................ 7 Part I: Overview and basic indicators .................................................................................................. 8
I.1 Context ........................................................................................................................................... 8 I.2 Population...................................................................................................................................... 8
Population indicators ....................................................................................................................... 8 Population pyramid for 2001............................................................................................................ 9
I.3 Agriculture ..................................................................................................................................... 9 Land use and irrigation statistics ................................................................................................... 10 Main crops, agricultural calendar, seasonal food shortage ........................................................... 10 Livestock production and fishery ................................................................................................... 10
I.4 Economy ...................................................................................................................................... 11 I.5 Social indicators ......................................................................................................................... 11
Health indicators ............................................................................................................................ 11 Water and sanitation...................................................................................................................... 13 Access to health services .............................................................................................................. 13 Education ....................................................................................................................................... 13 Level of development, poverty....................................................................................................... 14 Other social indicators ................................................................................................................... 14
Part II: Food and nutrition situation ................................................................................................... 15 II.1 Qualitative aspects of the diet and food security ................................................................... 15
Food consumption patterns ........................................................................................................... 15 Food security situation................................................................................................................... 15
II.2 National food supply data ......................................................................................................... 16 Supply of major food groups.......................................................................................................... 16 Dietary energy supply, distribution by macronutrient and diversity of the food supplies............... 17 Vegetable/animal origin of macronutrients .................................................................................... 17 Dietary energy supply by food group............................................................................................. 18 Food imports and exports expressed as percentage of DES........................................................ 19 Food aid ......................................................................................................................................... 20
II.3 Food consumption..................................................................................................................... 20 Surveys in different food economy zones...................................................................................... 20
II.4 Infant and young child feeding practices ................................................................................ 21 II.5 Nutritional anthropometry......................................................................................................... 22
Low birth weight ............................................................................................................................. 22 Anthropometry of preschool children............................................................................................. 22 Anthropometry of school-age children and adolescents ............................................................... 26 Anthropometry of adult women...................................................................................................... 26 Anthropometry of adult men .......................................................................................................... 26
II.6 Micronutrient deficiencies......................................................................................................... 26 Iodine deficiency disorders (IDD)................................................................................................... 26
Prevalence of goitre and urinary iodine level ............................................................................ 26 Iodization of salt at household level .......................................................................................... 26
Vitamin A deficiency (VAD)............................................................................................................ 26 Prevalence of sub-clinical and clinical vitamin A deficiency...................................................... 26 Vitamin A supplementation........................................................................................................ 27
Iron deficiency anemia (IDA) ......................................................................................................... 27 Prevalence of IDA...................................................................................................................... 27 Interventions to combat IDA ...................................................................................................... 28
II.7 Policies and programmes aiming to improve nutrition and food security .......................... 28 Reference list ........................................................................................................................................ 29

Somalia Nutrition Profile – Food and Nutrition Division, FAO, 2005 6
List of tables and figures List of tables Table 1: Population indicators ................................................................................................................. 9 Table 2: Land use and irrigation............................................................................................................ 10 Table 3: Livestock and fishery statistics ................................................................................................ 10 Table 4: Basic economic indicators....................................................................................................... 11 Table 5: Health indicators...................................................................................................................... 12 Table 6: Access to safe water and sanitation........................................................................................ 13 Table 7: Access to Health Services....................................................................................................... 13 Table 8: Education................................................................................................................................. 13 Table 9: Human development and poverty ........................................................................................... 14 Table 10: Other social indicators........................................................................................................... 14 Table 11: Trends in per capita supply of major food groups (in g/day)................................................. 16 Table 12: Share of the main food groups in the Dietary Energy Supply (DES), trends ........................ 18 Table 13: Type of infant and young child feeding ................................................................................. 22 Table 14: Anthropometry of preschool children .................................................................................... 23 Table 15: Vitamin A supplementation of children and mothers............................................................. 27
List of figures � Figure 1: Dietary energy supply (DES), trends and distribution by macronutrient ....................... 17 � Figure 2: Vegetable/animal origin of energy, protein and lipid supplies ....................................... 17 � Figure 3: Dietary energy supply by food group............................................................................. 18 � Figure 4: Major food exports as percentage of Dietary Energy Supply (DES), trends................. 19 � Figure 5: Major food imports as percentage of Dietary Energy Supply (DES), trends................. 19

Somalia Nutrition Profile – Food and Nutrition Division, FAO, 2005 7
Acronyms BFHI Baby friendly hospital initiative BMI Body mass index CDC Centers for Disease Control CED Chronic energy deficiency DEC Delegation of the European Commission DES Dietary energy supply DPT3 Diphtheria, pertussis (whooping cough) and tetanus vaccine – three doses FAO Food and Agriculture Organization of the United Nations FAOSTAT FAO Statistical Databases FIVIMS Food Insecurity and Vulnerability Information and Mapping Systems FSAU Food Security Analysis Unit GDP Gross domestic product GNP Gross national product HIV/AIDS Human immunodeficiency virus/ acquired immuno deficiency IDA Iron deficiency anaemia IDD Iodine deficiency disorders IDP Internally displaced people ILO International Labour Organization IMC International Medical Corps (Somalia) ITU International Telecommunication Union MICS Multiple Indicator Cluster Survey MOH Ministry of Health MOHL Ministry of Health and Labour NGO Non Governmental Organization PPP Purchase power parity PWA Pre war average SRCS Somali Red Crescent Society SuRF Surveillance of chronic disease Risk Factors UN United Nations UNAIDS Joint United Nations Programme on HIV/AIDS UNDP United Nations Development Programme UNESCO United Nations Educational, Scientific and Cultural Organization UNICEF United Nations Children’s Fund UNPD United Nations Population Division UNSTAT United Nations Statistics Division VAD Vitamin A deficiency WB World Bank WFP World Food Programme WHO World Health Organization
Somalia Nutrition Profile – Food and Nutrition Division, FAO, 2005 8
Part I: Overview and basic indicators
I.1 Context
Somalia is located in the Horn of Africa and lies along the Gulf of Aden and the Indian Ocean. It covers a total land area of 637 660 km2 and has a coastline of 3 025 km. It is bordered by Kenya to the southwest, Ethiopia to the west and Djibouti to the north. It is principally a desert and is characterized by a harsh tropical climate that is mostly only favourable for nomadic livestock rearing (FAO, Forestry Division).
Rainfall patterns are mainly unreliable. The gu rains constitute the long rainy season from April to June, while deyr rains constitute the short rainy season from October to November. The dry season covers the rest of the year and peaks during July to September. Occasionally, heavy rains from the Ethiopian highlands result in floods especially in southern parts along the Juba River. Mean annual rainfall is 500 mm (FAO, 2005).
Somalia is one of the poorest countries in the world, a situation aggravated by an on-going civil war since 1991. The resulting collapse of political institutions, destruction of social and economic infrastructures, human losses, massive internal and external migrations and degradation of the environment have profoundly altered human development in Somalia. The absence of a central government throughout the 1990s led to the emergence of a northwest “Republic of Somaliland” in 1991, of a northeastern “Puntland State of Somalia” in 1998 and of a military administration in the southern regions of Bay and Bakool in 1999. The country is part of the group of Low-Income Countries Under Stress (LICUS). Although, after years of civil unrest, a Transitional Federal Charter of the Somali Republic was adopted in February 2004 and a government was formed, the political and security situation remain unstable (UNDP, 2001; UNDP & WB, 2003a and 2003b; UN, 2005a).
I.2 Population
Population indicators
It is extremely difficult to track population data for Somalia with accuracy. Population movements resulting from the nomadic lifestyle have been accentuated by climatic hardship causing food shortages and by prolonged civil strife since 1991. However, the Somali population is estimated at 6.8 million, distributed as 24% of urban population, 17% of rural settled and 59% of nomads. The population is very young. Consequently the dependency ratio is high. Life expectancy is low.
It is estimated that the nomads face the worst conditions in terms of human development indicators and access to social services (UNDP, 2001). There are currently about 400 000 Internally Displaced People (IDPs) in Somalia, mostly from southern minority groups. Of these, some 250 000 live in Mogadishu almost completely out of reach of any concrete international assistance (UN, 2005a). IDPs are amongst the poorest population groups (WFP, 2001).

Somalia Nutrition Profile – Food and Nutrition Division, FAO, 2005 9
Table 1: Population indicators Indicator Estimate Unit Reference Period Source Total population 6.799 million 2002 UNDP Annual population growth rate 3.20 % 2000-2005 UNPD Crude birth rate 45.8 ‰ 2000-2005 UNPD Population distribution by age: 2000 UNPD
0-4 years 18 % 5-14 years 26 % 15-24 years 20 % 60 and over 4 %
Rural population 76 % 2000 UNPD Agricultural population 69 % 2004 FAOSTAT Population density 11 inhabitants per km2 2000 UNPD Median age 18 years 2000 UNPD Life expectancy at birth 47 years 2000 UNDP Population sex ratio 98 males per 100 female 2000 UNDP Net migration rate 4.5 ‰ 2000-2005 UNPD Total dependency rate 87 % 2000 UNPD
Population pyramid for 2001
Source: UNAIDS, 2002
I.3 Agriculture
According to 2001 estimates, agriculture accounts for 65% of the Gross Domestic Product (GDP), with livestock representing 40% of the GDP and 65% of export earnings, even though the 1998 ban on livestock exports into neighbouring countries affected the Somalian economy. Agriculture represents about three quarters of the labour force, mainly in the form of pastoral nomadism (UNDP, 2001).
Primary food crops grown include bananas, sugarcane, maize, and wheat while meat products are beef, camel, lamb and chicken. Production of milk is very important for the pastoral population. A decline in agricultural production has however been experienced over the years. Long standing civil war, displacements, lack of credit, inadequate agricultural inputs, destruction of flood embankments, and inadequate extension services have contributed to poor agricultural performance. Agricultural recovery is also hindered by the presence of large numbers of IDPs (Montani & Omwega, 2002; FAO, 2004).
Somalia Nutrition Profile – Food and Nutrition Division, FAO, 2005 10
Land use and irrigation statistics
Table 2: Land use and irrigation Type of area Estimate Unit Reference period Source Total Land Area 62 734 1000 Ha 2002 FAO Agricultural Area 70 % 2002 FAO Arable lands & Permanent Crops 2 % 2002 FAO Permanent Crops <1 % 2002 FAO Permanent Pasture 69 % 2002 FAO Forested land areas 12 % 2000 FAO Irrigated agricultural land <1 % 2002 FAO Arable & Permanent cropland in Ha per agricultural inhabitant 0.3 Ha 2002 FAO
N.B. Percents are calculated on the total land area.
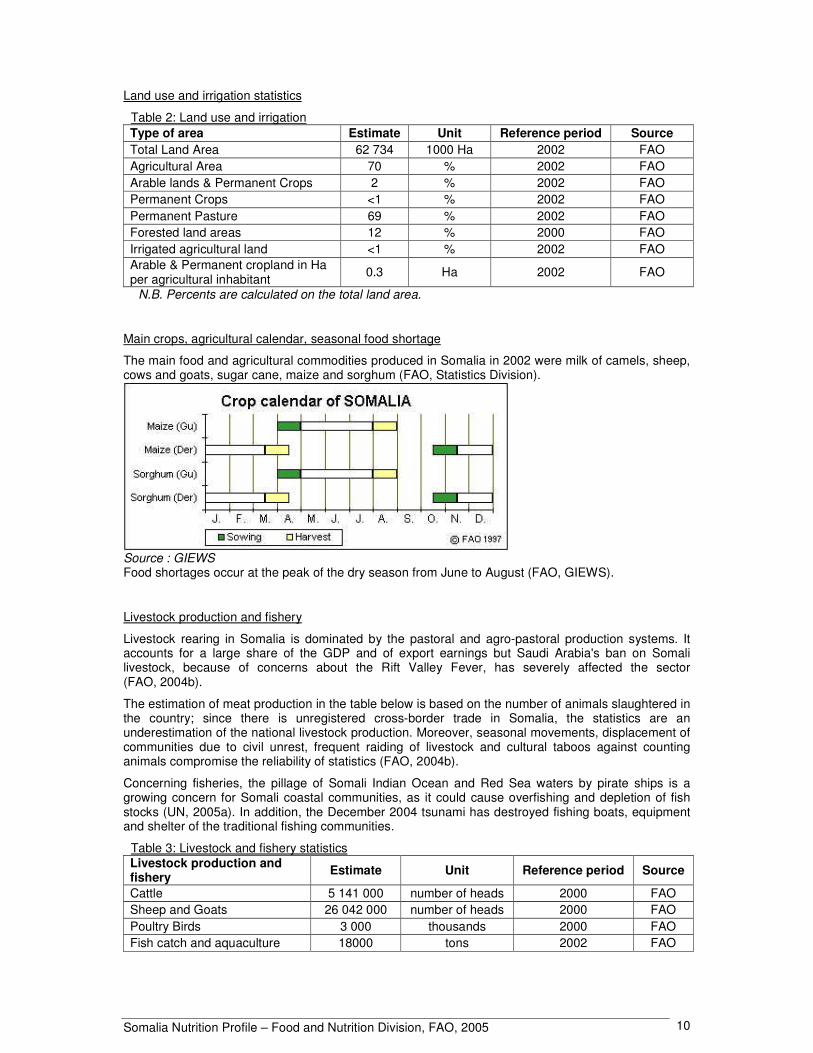
Main crops, agricultural calendar, seasonal food shortage
The main food and agricultural commodities produced in Somalia in 2002 were milk of camels, sheep, cows and goats, sugar cane, maize and sorghum (FAO, Statistics Division).
Source : GIEWS Food shortages occur at the peak of the dry season from June to August (FAO, GIEWS).
Livestock production and fishery
Livestock rearing in Somalia is dominated by the pastoral and agro-pastoral production systems. It accounts for a large share of the GDP and of export earnings but Saudi Arabia's ban on Somali livestock, because of concerns about the Rift Valley Fever, has severely affected the sector (FAO, 2004b).
The estimation of meat production in the table below is based on the number of animals slaughtered in the country; since there is unregistered cross-border trade in Somalia, the statistics are an underestimation of the national livestock production. Moreover, seasonal movements, displacement of communities due to civil unrest, frequent raiding of livestock and cultural taboos against counting animals compromise the reliability of statistics (FAO, 2004b).
Concerning fisheries, the pillage of Somali Indian Ocean and Red Sea waters by pirate ships is a growing concern for Somali coastal communities, as it could cause overfishing and depletion of fish stocks (UN, 2005a). In addition, the December 2004 tsunami has destroyed fishing boats, equipment and shelter of the traditional fishing communities.
Table 3: Livestock and fishery statistics Livestock production and fishery Estimate Unit Reference period Source
Cattle 5 141 000 number of heads 2000 FAO Sheep and Goats 26 042 000 number of heads 2000 FAO Poultry Birds 3 000 thousands 2000 FAO Fish catch and aquaculture 18000 tons 2002 FAO
Somalia Nutrition Profile – Food and Nutrition Division, FAO, 2005 11
I.4 Economy
Somalia’s economy remains in recession and has been weakened by many years of civil strife. Besides war, other factors have contributed to weakening the economy, for example poor basic services, high unemployment rates, a high dependency ratio, and a low per capita GNP. The country’s per capita income is presently one of the lowest in the world (UNDP, 2001).
The country was long characterized by the absence of a functional central government and therefore a lack of a centrally planned economy. The situation is however different for Somaliland where there is a central government. There are also marked disparities between economic development in the north and in the south, and between the food economy zones, i.e. agro-pastoralists, pastoralists, riverine, and urban communities (UNDP, 2001).
The economy is however slowly progressing largely due to contributions from Somali emigrants who have played a significant role in reviving the country’s economic life. The Somali receiving remittances from the Diaspora have better economic security and have access to private social services for health and education (UNDP, 2001).
Table 4: Basic economic indicators Indicator Estimate Unit Reference Period Source Gross Domestic Product per capita 795 PPP US $ 2000 UNDP GDP annual growth n.a. Gross National Income per capita n.a. Industry as % of GDP 9 % 1988 WB Agriculture as % of GDP 65 % 1988 WB Services as % of GDP 26 % 1988 WB Paved roads as % of total roads 12 % 1999 WB
Internet users 0.9 per 10 000 people 2002 ITU
Total debt service as % of GDP n.a. Military Public expenditure 4.4 % of GNP 1986 UNDP
n.a.: not available Major non-agricultural imports are second hand clothes, construction materials, and vehicles. Non-agricultural exports are hides and charcoal (UNDP, 2001).
I.5 Social indicators
Health indicators
Somalia is one of the countries in the world with the lowest levels for health indicators. Due to the absence of a central government, there is virtually no public health system. Current estimations place Somalia as the country with the highest maternal mortality rates in the world, at 1 100 per 100 000 live births in 2000, caused by absence of antenatal and postnatal care, malaria, malnutrition, anemia and the consequences of female genital cutting (UNDP, 2001; UNICEF, Database). Most childbirths take place without adequate medical facilities. In fact, for the country as a whole, 88% of childbirths took place at home in 2002. Childbirths are mainly attended by traditional birth attendants (43% of urban births and 61% of rural and nomadic births). Doctors’ assistance is confined to urban areas (UNDP & WB, 2003b).
Immunization rates are very low, with great disparities between urban, rural settled and nomadic populations. Estimates are that only 15% of rural people have access to health services, compared to 50% of the urban people, although actual data are scarce. There have been no Yellow Fever vaccinations for a decade. Moreover, the public health sector is heavily dependant on foreign aid (UNDP, 2001).

Somalia Nutrition Profile – Food and Nutrition Division, FAO, 2005 12
It has been established through various surveys that major causes of morbidity and mortality among infants and young children are malnutrition, diarrhea, intestinal parasites, malaria, acute respiratory infections and tuberculosis (UNDP, 2001).
HIV/AIDS prevalence is estimated at less than 1%. However, the high mobility of the population (due to the nomadic life style and population displacements caused by food shortages), and the vicinity of countries with high prevalence rates, added to the high prevalence of sexually transmitted diseases (affecting 30% of women attending antenatal clinics in Somaliland) suggest that the HIV/AIDS epidemic could progress very quickly in Somalia and that the situation needs to be monitored closely (UNICEF, 2003a).
The provision of health care is dependent on UN agencies and NGOs. A high level of insecurity hinders efforts to reach the population in need of health care. Nevertheless efforts are made to increase the level of immunization, through measles catch-up campaigns and strengthening of routine immunization. Other activities have focused on malaria and response to acute nutritional emergencies. Distribution of insecticide-treated nets is ongoing (UN, 2005a).
Table 5: Health indicators
Indicator Estimate Unit Reference Period Source
Mortality Infant mortality 133 ‰ 2003 UNICEF Under-five mortality 225 ‰ 2003 UNICEF Maternal mortality ratio : UNICEF
reported n.a.
adjusted 1100 per 100 000 live births 2000 UNICEF
Morbidity
Malaria-related mortality rate in under-fives 373
per 100 000 deaths in
under-fives 2000 UNSTAT
Percent of under-fives sleeping under a treated bed net 0.3 % 1999 UNSTAT
Prevalence of diarrhea in the last 2 weeks in under-fives n.a.
Oral Rehydration rate among under-fives n.a. Percentage of under-fives with acute respiratory infections in the last 2 weeks n.a.
Tuberculosis prevalence 748 per 100 000 people 2003 UNSTAT
HIV/AIDS Prevalence of HIV/AIDS cases in adults <1 % 2003 UNICEF Percentage of women (15-24) who know that a person can protect herself from HIV infection by consistent condom use
2 % 2000 UNSTAT
Immunization Percent of infants with immunization against tuberculosis at 1 year of age 65 % 2003 UNICEF/WHO
Percent of infants with DTP3 immunization at 1 year of age 40 % 2003 UNICEF/WHO
Percent of infants with immunization against measles at 1 year of age 40 % 2003 UNICEF/WHO
Percent of pregnant women immunized against tetanus n.a.
n.a.: not available

Somalia Nutrition Profile – Food and Nutrition Division, FAO, 2005 13
Water and sanitation
Improved water sources in urban areas are at an average distance of 0.5 km to 0.7 km from dwellings. In rural and nomadic areas, the average distance is about 1.2 km to 5.8 km (UNDP & WB, 2003b). Acute water shortage in Somalia has widespread implications on pasture, milk production and massive deaths of animals, and is therefore a major cause of food insecurity. Looting of water supply equipments as well as lack of maintenance of existing water points are factors aggravating the effects of intermittent droughts (UNICEF, 2001).
Concerning sanitation, about half of the population does not have access to proper toilets, using mainly pit latrines or open space. This concerns 6% of urban and 70% of rural and nomadic populations (UNDP & WB, 2003b).
Table 6: Access to safe water and sanitation Indicator Estimate Unit Reference period Source Sustainable access to an improved water source: Urban 32 % of population 2002 WHO Rural 27 % of population 2002 WHO Access to improved sanitation: Combined urban/rural 25 % of population 2002 UNICEF
Access to health services
Table 7: Access to Health Services
Indicator Estimate Unit Reference Period Source
Health personnel: number of physicians 0.4 per 100 000 people 2002 UNDP
Population with sustainable access to affordable essential drugs n.a.
% of births attended by skilled health personnel 34 % 1999 UNICEF Public expenditure on Health 0.2 % of GNP 1986 UNESCO n.a.: not available
Education
During the last two decades, the Somali education system ceased to function. Generations of children affected by the collapse of the educational system are commonly referred to as the “lost generations”. Enrolment figures for basic education show that only 14%-17% of school age children are enrolled in the early grades. Somalia is one of the countries in the world with the lowest enrolment rates (UNDP, 2001).
Education is often provided by Non Governmental Organizations (NGOs) and private groups supported by Somali in the Diaspora, and local communities. The educational situation in Somaliland is better due to the existence of a functional ministry of education (UNDP, 2001).
Table 8: Education Indicator Estimate Unit Reference Period Source Adult literacy 19 % 2002 UNESCO Adult literacy rate : females as % of males 52 % 1999 UNESCO Youth literacy (15-24 years) n.a. Gross primary enrolment rate 17 % 2002 UNDP Grade 5 completion rate 72.5 % 1999 UNESCO Ratio of girls to boys in primary education n.a. Public expenditure on education n.a. n.a.: not available
Somalia Nutrition Profile – Food and Nutrition Division, FAO, 2005 14
Level of development, poverty
Somalia has been classified as one of the world’s poorest countries. All Human development indicators remain low. The prolonged civil war, the collapse of social services and the number of IDPs contribute to the high prevalence of poverty in the country. The poorest populations are the pastoral and agropastoral communities affected by drought, and the urban IDPs. No studies have been conducted to determine the percentage of population living below the national poverty line (UNDP, 2001; WFP, 2002; UN, 2005a).
Presently, poor infrastructure and insecurity are a major hindrance to economic development especially in southern parts of the country.
In terms of economic performance, there are wide disparities between southern and northern parts of the country (UNDP, 2001).
Table 9: Human development and poverty Indicator Estimate Unit Reference period Source
Human development index (HDI) 0.284 value between 0-1 2001 UNDP
Proportion of population living with less than 1$ a day (PPP) 60 % 1990 WB
Population living below the national poverty line n.a.
Human poverty index (HPI-1) n.a. n.a.: not available
Other social indicators
Child labour is highly prevalent in Somalia and concerns children of IDPs especially (UNICEF, 2005). Surveys have revealed that 30% of IDP adults report that their families are dependant on the income earned by children, against 17% at the national level (UNICEF, 2003b). Children have also been recruited by military factions. Demobilization and reinsertion programmes are supported by UNICEF (UN, 2003a).
Table 10: Other social indicators Indicator Estimate Unit Reference period Source Gender related development index (GDI) n.a. Women’s wage employment in non-agricultural sector as % of total non agricultural employees
21.9 % 1990 UNSTAT
Ratification of ILO Convention 182 on The Worst Forms of Child Labour Not ratified ILO
n.a.: not available

Somalia Nutrition Profile – Food and Nutrition Division, FAO, 2005 15
Part II: Food and nutrition situation
II.1 Qualitative aspects of the diet and food security
Food consumption patterns
Milk, sorghum and maize are the staples of the Somali diet, complemented with beans, some vegetables (tomatoes and onions) and fruit. Rice and pasta are consumed by households that can afford them. Common dishes are canjeero (anjera), a flat unleavened bread, soor, a sorghum or maize porridge, cambulo, boiled maize with beans and oil. Dishes can be accompanied with milk or meat. Milk and meat are from camels, cattle or goat, and there is some wild game. Sugar and vegetable oil are consumed by all households. Tea is the common beverage. Fish consumption has been traditionally limited to coastal towns, although in recent years more fish is being consumed in the interior.
Location and livelihoods influence the diet. Pastoral communities rely on milk, while farmers consume more legumes and vegetables, and urban households have better access to more vegetables and imported cereals.
Within households, prioritisation of children was reported particularly in reference to food stress. No difference was found between the allocation of food between male and female children. Under-consumption by pregnant women was found to be widespread (Montani & Omwega, 2002).
Food security situation
Food security is defined as “A situation that exists when all people, at all times, have physical, social and economic access to sufficient, safe and nutritious food that meets their dietary needs and food preferences for an active and healthy life” (FIVIMS). Food insecurity may be caused by the unavailability of food, insufficient purchasing power, inappropriate distribution, or inadequate use of food at the household level. Food insecurity may be chronic, seasonal or transitory.
Many factors contribute to food insecurity in Somalia, differing between regions and livelihoods systems. Food insecurity is the result of a combination of harsh environmental conditions and prolonged conflict and civil insecurity. Natural disasters have eroded livelihoods. Internal displacement causes extreme poverty. Access to food remains a major problem for the most vulnerable groups – displaced people, rural minorities, female-headed households, rainfed farmers, pastoral communities, urban poor and returnees – due primarily to their low purchasing power and narrow economic base. The livelihoods of Somali are weak and traditional coping mechanisms are overstretched, causing an increased vulnerability to even relatively minor shocks (DEC, 2004).
The country experienced severe floods in the south in the late 1990s, followed by successive years of drought, especially inland and in the north. Coastal areas were also badly hit by the Indian Ocean tsunami that struck in December 2004, affecting over 16 000 families in traditional fishing communities (Save the Children, 2005). In 2004, approximately 350 000 IDPs and poor urban populations continued to be chronically food insecure (FAO, 2004).
According to the 2005 post gu assessment by FSAU finalized in July, 919 000 people are in need of immediate assistance, of which 197 000 are in a state of humanitarian emergency, 343 000 people face an acute livelihood crisis, and further 377 000 are IDPs (FSAU, 2005).
Concerning the agricultural sector, the 2005 gu season cereal production in the south was the lowest in a decade (44% of pre-war average (PWA)). In four regions cereal production was less than 10% of PWA (Hiran, Middle Juba, Gedo and Lower Juba). In the south, Middle Shabelle was the only region recording above normal cereal production (116% of PWA) as the region benefited from high river levels and flood gravity irrigation. In the North and Central regions, water and pasture conditions were good in most places, livestock body conditions were satisfying and improving. In the south, water and pasture conditions were generally normal in Bay, Bakool and Riverine areas in Shabelle, but stressed in Juba and Gedo (FSAU, 2005).

Somalia Nutrition Profile – Food and Nutrition Division, FAO, 2005 16
Concerning markets, both the Somali and Somaliland Shillings continued to remain stable over the last six months. Imported rice prices in the North and Central regions remained fairly stable through the gu 2005 season. Maize prices in Shabelle and Juba increased significantly and steadily since April 2005 (FSAU, 2005).
II.2 National food supply data
Supply of major food groups
Table 11: Trends in per capita supply of major food groups (in g/day) Supply for human consumption in g/day
Major food groups 1965-67 1972-74 1979-81 1986-88 1993-95 2000-2002
Milk and eggs 749 765 689 677 658 593 Cereals (excl. beer) 215 183 221 292 171 187 Fruit and vegetables 141 146 65 101 108 89 Meat and offals 84 79 58 67 70 76 Sweeteners 27 41 25 26 50 81 Starchy roots 15 18 14 15 16 26 Pulses, nuts, oilcrops 10 14 12 16 13 10 Vegetable oils 6 7 16 14 7 10 Animal fats 7 7 6 6 7 6 Fish, seafood 2 2 4 7 11 7 Other 3 3 2 1 1 1 Source: FAOSTAT
In terms of supply, the major food group is milk. After a slight increase in the late 1970s, the per capita supply of this food group steadily decreased. Cereals rank second and were characterized by a relatively low and fluctuating supply. The supply of fruit and vegetables was limited and decreased steadily over the period. The supply of starchy roots increased but not enough to compensate for the reduction in cereals and remained very limited. The supply of fish increased relatively but remained at a low level. A significant increase in the supply of sweeteners was observed. The supply of vegetable oils increased significantly during the period 1979/81 to 1986/88 but decreased thereafter (FAO, FAOSTAT Database).
Because of the absence of a central government, supply statistics have remained unreliable. Thus estimates of food supplies can be considered at best as indications of the relative importance of the different food groups.
Somalia Nutrition Profile – Food and Nutrition Division, FAO, 2005 17
Dietary energy supply, distribution by macronutrient and diversity of the food supplies
• Figure 1: Dietary energy supply (DES), trends and distribution by macronutrient
14 1214 13 13 14
32 33 33 30 32 30
5353 5357
55 58
0
500
1000
1500
2000
1965-67 1972-74 1979-81 1986-88 1993-95 2000-2002
kcal
/day
protein lipids carbohydratesSomalia Source: FAOSTAT
Figure 1: Trends in DES per capita and percentages from protein, lipids & carbohydrates
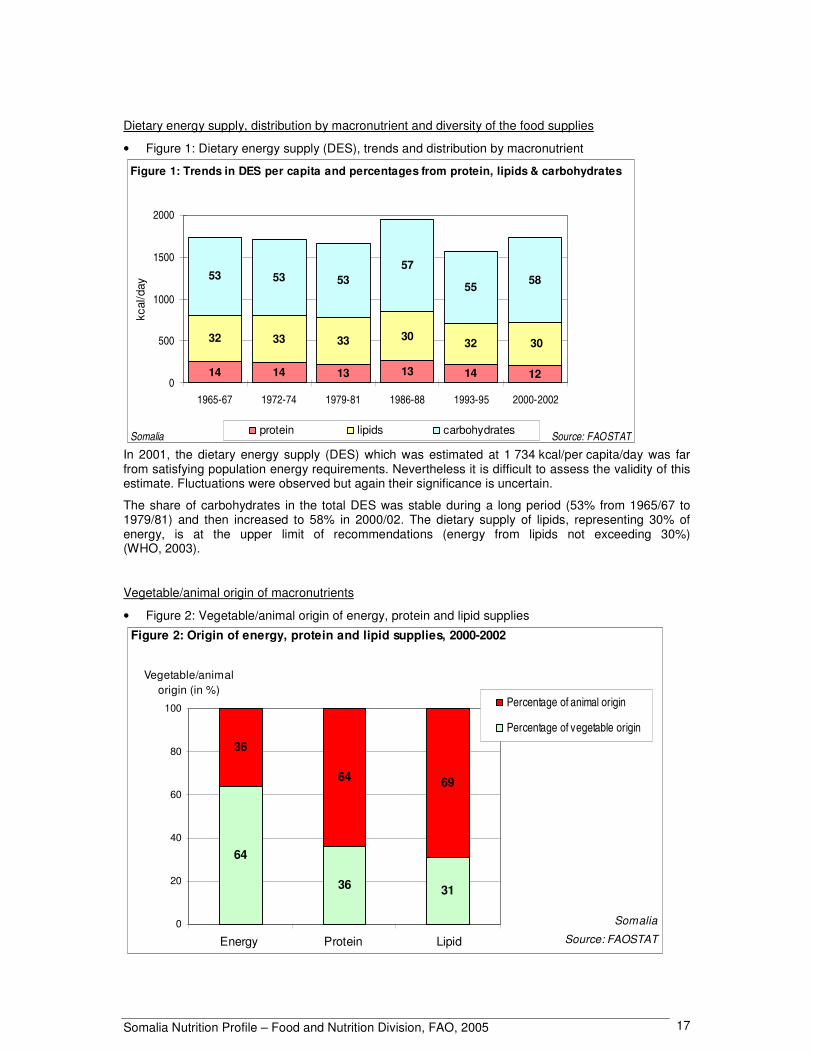
In 2001, the dietary energy supply (DES) which was estimated at 1 734 kcal/per capita/day was far from satisfying population energy requirements. Nevertheless it is difficult to assess the validity of this estimate. Fluctuations were observed but again their significance is uncertain.
The share of carbohydrates in the total DES was stable during a long period (53% from 1965/67 to 1979/81) and then increased to 58% in 2000/02. The dietary supply of lipids, representing 30% of energy, is at the upper limit of recommendations (energy from lipids not exceeding 30%) (WHO, 2003).
Vegetable/animal origin of macronutrients
• Figure 2: Vegetable/animal origin of energy, protein and lipid supplies
64
36 31
36
64 69
0
20
40
60
80
100
Energy Protein Lipid
Percentage of animal origin
Percentage of vegetable origin
Somalia
Source: FAOSTAT
Vegetable/animal origin (in %)
Figure 2: Origin of energy, protein and lipid supplies, 2000-2002
Somalia Nutrition Profile – Food and Nutrition Division, FAO, 2005 18
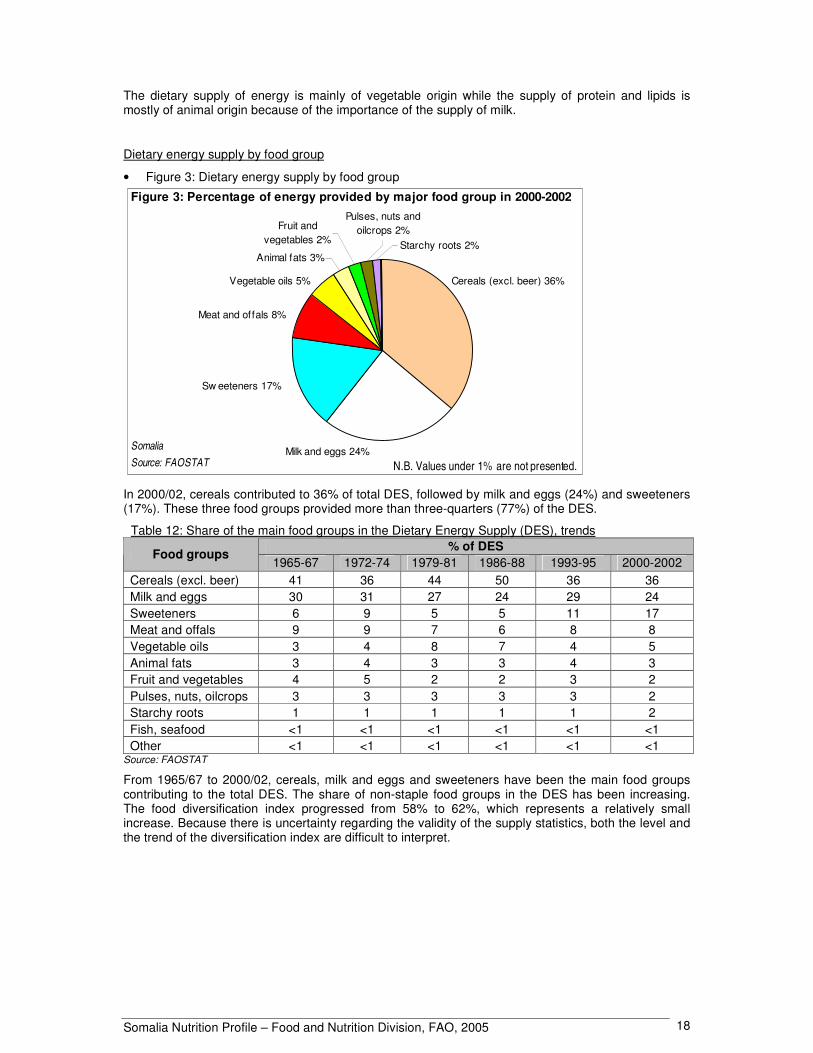
The dietary supply of energy is mainly of vegetable origin while the supply of protein and lipids is mostly of animal origin because of the importance of the supply of milk.
Dietary energy supply by food group
• Figure 3: Dietary energy supply by food group
Animal fats 3%
Pulses, nuts and oilcrops 2%Fruit and
vegetables 2% Starchy roots 2%
SomaliaSource: FAOSTAT
Figure 3: Percentage of energy provided by major food group in 2000-2002
N.B. Values under 1% are not presented.
Vegetable oils 5%
Meat and offals 8%
Milk and eggs 24%
Cereals (excl. beer) 36%
Sw eeteners 17%
In 2000/02, cereals contributed to 36% of total DES, followed by milk and eggs (24%) and sweeteners (17%). These three food groups provided more than three-quarters (77%) of the DES.
Table 12: Share of the main food groups in the Dietary Energy Supply (DES), trends % of DES
Food groups 1965-67 1972-74 1979-81 1986-88 1993-95 2000-2002
Cereals (excl. beer) 41 36 44 50 36 36 Milk and eggs 30 31 27 24 29 24 Sweeteners 6 9 5 5 11 17 Meat and offals 9 9 7 6 8 8 Vegetable oils 3 4 8 7 4 5 Animal fats 3 4 3 3 4 3 Fruit and vegetables 4 5 2 2 3 2 Pulses, nuts, oilcrops 3 3 3 3 3 2 Starchy roots 1 1 1 1 1 2 Fish, seafood <1 <1 <1 <1 <1 <1 Other <1 <1 <1 <1 <1 <1
Source: FAOSTAT
From 1965/67 to 2000/02, cereals, milk and eggs and sweeteners have been the main food groups contributing to the total DES. The share of non-staple food groups in the DES has been increasing. The food diversification index progressed from 58% to 62%, which represents a relatively small increase. Because there is uncertainty regarding the validity of the supply statistics, both the level and the trend of the diversification index are difficult to interpret.

Somalia Nutrition Profile – Food and Nutrition Division, FAO, 2005 19
Food imports and exports expressed as percentage of DES
Fruit and meat and offals are the major food exports. Food exports never exceeded 3% of DES. In 2000/02, exports of fruit dropped to 0.1% of DES while exports of meat and offals were of 1.7%. • Figure 4: Major food exports as percentage of Dietary Energy Supply (DES), trends
1965-67 1972-74 1979-81 1986-88 1993-95 2000-2002
Meat and offals
Fruit (excl. wine)
0
1
2
3
4
5
% o
f DE
S
SomaliaSource: FAOSTAT
Figure 4: Food exports expressed as percentage of DES, trends.
Note that only the 3 most important food groups are shown.
Cereals are Somalia’s major food imports. Import of cereals was highest in 1979/81 and in the early 1990s during the droughts and floods with 22% and 19% of the total DES respectively, compared to 13% in 2000/02. Sweeteners represented the second largest food import, increasing from 1% in 1965/67 to 19% in 2000/02. Import of vegetable oils increased rapidly in the early 1990s to reach 4% of the DES in 2000/02.
• Figure 5: Major food imports as percentage of Dietary Energy Supply (DES), trends
1965-67 1972-74 1979-81 1986-88 1993-95 2000-2002
Cereals (excl. beer)
Sw eeteners
Vegetable oils0
5
10
15
20
25
30
% o
f DE
S
SomaliaSource: FAOSTAT
Figure 5: Food imports expressed as percentage of DES, trends.
Note that only the 3 most important food groups are shown.

Somalia Nutrition Profile – Food and Nutrition Division, FAO, 2005 20
Food aid
In 2004, Somalia received a total food aid of 33 218 t, of which 29 278 t of cereals — mainly coarse grains (96%), blended/fortified cereals (3%), wheat (1%) — and 3 940 t of non-cereals — mainly pulses (93%) and oils and fats (7%). This food aid was mainly delivered as emergency food aid (99%), with a small part as project food aid (1%)1 (WFP, 2004).
II.3 Food consumption
Surveys in different food economy zones
In 2004, a dietary diversity study was conducted by FSAU in agro-pastoral areas of Dinsor District, in southern Somalia and in pastoral areas of Dangorayo District in northern Somalia. A total of 420 households (265 agro-pastoral and 155 pastoral households) were surveyed during January 2004. Household dietary intakes were studied using the 24-hour recall and counts of food groups (12 food groups were used) consumed in the previous 24 hours. Anthropometric data on 378 children aged 6-59 months were collected on the same sample (FSAU, 2004).
In the pastoral areas, the assessment was conducted during a drought period and consequently, there was an acute shortage of animal products. The agro-pastoralists had just experienced late 2003 deyr rains and the assessment coincided with a time of increased energy requirements, as weeding and other cropping activities were at peak. To their advantage, the agro-pastoral villages had had relatively good harvests in the 2003 gu season and most households still had stocks of cereals (FSAU, 2004).
Overall, a majority of the households studied consumed at least three food groups in the previous 24 hours but agro-pastoral households had a more diversified diet than the pastoral households. The study showed that consuming less than three food groups pre-disposes the households to heightened food insecurity. While only 4% of the agro-pastoral households consumed two or less food groups in the previous 24 hours, this percentage reached 15% for pastoral households. The average meal frequency was of about 3 per day among the agro-pastoralists, while it was of about 2.6 for the pastoral households (FSAU, 2004).
The main food groups consumed by both communities were cereals, sugar, meat, pulses, milk and milk products and oils and fats. Consumption of vegetables, fruit and starchy roots were insignificant overall. Agro-pastoral households consumed more milk and meat than their pastoral counter-parts (FSAU, 2004).
The average household per capita energy intake for the two communities was about 2 600 kcal. This was higher than energy requirements estimated at about 2 100 kcal/day. However there were significant differences in energy intakes of the two study communities. Whereas the agro-pastoral had a surplus intake (about 3 100 kcal/per capita/day against their requirement of about 2 200 kcal/per capita/day), the pastoralists in Dangorayo had a deficit in energy intake (about 1 800 kcal/day against a per capita requirement of about 2 000 kcal/day). While only about 14% of the agro-pastoral households had insufficient energy intake at the time of study, more than half of the pastoral households had inadequate energy intake (FSAU, 2004).
Among the 378 children under five years that were studied (256 agro-pastoralists children, 122 pastoralists children), prevalence of wasting reached 12%, while prevalence of severe wasting was 2%. The prevalence of wasting in children was comparable among agro-pastoralists and pastoral households. There were no significant variation in malnutrition levels across the food economy groups, but higher malnutrition rates were correlated with lower meal frequencies at household level. Overall, dietary diversity at household level was associated with the nutritional status of under-fives (FSAU, 2004).
1 Emergency food aid is destined to victims of natural or man-made disasters; Project food aid aims at supporting specific poverty-alleviation and disaster-prevention activities; Programme food aid is usually supplied as a resource transfer for balance of payments or budgetary support activities. Unlike most of the food aid provided for project or emergency purposes, it is not targeted to specific beneficiary groups. It is sold on the open market, and provided either as a grant, or as a loan.
Somalia Nutrition Profile – Food and Nutrition Division, FAO, 2005 21
A previous study conducted in 2002 assessed dietary patterns at household level based on case studies in four food economy zones. The study was based on available secondary information and primary data collected through focus group discussions, interviews and observations. Each case study represented one of the four basic livelihood systems: agro-pastoral, pastoral, riverine and urban. Fieldwork for the case studies was conducted in two sites in Somalia within the following specific food economy zones identified by FSAU: Riverine and agro-pastoral in the Belet-Weyne district of Hiran, pastoral in northern Wagooyi Galbeed, and urban in Hargeysa town (Montani & Omwega, 2002). Recommended intakes for nutrients were taken from FAO & WHO (2002).
In the four food economy groups, the case studies revealed consumption patterns that, outside times of particular food stress, satisfied only the minimum or less than the minimum nutritional requirements of households. This was clear both for energy and nutrient requirements such as protein, lipids, iron and vitamins A and C. Some households in all food economy groups had difficulty meeting basic household energy requirements. Poor households across the four groups did not satisfy their minimum energy requirements during the dry season. The composition of diets varied between food economy zones with nutrient intake also showing some variation. Micronutrient intake was, in some cases, as low as 10% of requirements. Poor agro-pastoral households showed the lowest vitamin intakes. Iron intakes of poor riverine and both poor and middle wealth groups in the agro-pastoral zone covered only 60% or less of iron requirements (Montani & Omwega, 2002).
Not all consumption possibilities were exploited in some food economy zones. Bioavailability of nutrients could be enhanced in some cases by using appropriate preparation techniques. However, the main issues in relation to adequate food intakes are problems of level of production and purchasing power (Montani & Omwega, 2002).
II.4 Infant and young child feeding practices
In Somalia, infant and young child feeding practices often do not follow the World Summit for Children recommendations which stipulate that children should be exclusively breastfed for four to six months, and that breastfeeding should continue alongside complementary feeding till the child is two years of age.
According to the national survey of 1999, only one-fifth of children under 4 months were exclusively breastfed. Data are not available on timely introduction of complementary feeding. At age 12-15 months, 27% of children were still breastfed and at 20-23 months, this percentage was only 8% (UNICEF, 1999).
Other more local studies have highlighted inadequate practices regarding initiation of breastfeeding and complementary feeding, and the use of bottle feeding. Some discrepancies exist between studies that could be due to differences in definition of practices or to regional variations in feeding practices.
A harmful cultural practice has been the discarding of colostrum in the belief that it is harmful. Closely associated with this practice is the delay in initiating breastfeeding. It was established that 10% of mothers in rural areas of the northwest gave infants animal milk within the first 12 hours, while in Mogadishu, 75% of mothers reported having given water and sugar or animal milk diluted in water to their infant (UNICEF, 1998). Moreover, the widespread utilization of bottle-feeding predisposes infants and young children to high rates of diarrhea and malnutrition.
A local study conducted in Belet-Weyne district of Hiran (July 2002), revealed that 95% of children were introduced to foods other than breastmilk before 4 months. The most typical complementary foods were cereal based porridges (sorghum, maize), mashed sorghum with camel’s milk and family food. The family diet consumed by children was monotonous, lacking variety and principally dictated by food availability and food prices in the local markets (UNICEF, 2002).
The Baby-Friendly Hospital Initiative (BFHI) is not applicable in Somalia because very few women give birth in hospitals. UNICEF promotes exclusive breastfeeding through health and nutrition education sessions regularly held at maternal and child health centres, through radio programmes and community advocacy (UNICEF Somalia, Supplementary feeding and breastfeeding).

Somalia Nutrition Profile – Food and Nutrition Division, FAO, 2005 22
Table 13: Type of infant and young child feeding Type of feeding in the 24 hours preceding the survey Survey
name/date (Reference) Indicator by age Sample size Percentage of children
Exclusive breastfeeding rate <4 months n.a. 21.0
Timely complementary feeding rate 6-9 months n.a. n.a.
Bottle-feeding rate 0-11 months n.a. n.a.
Continued breastfeeding rate 12-15 months (1 year) n.a. 26.6
MICS Tables
Somalia, 1999 (UNICEF, 1999)
20-23 months (2 years) n.a. 7.5
II.5 Nutritional anthropometry
Low birth weight
The only available data state a prevalence of low birth weight (less than 2 500g) of 0.3%, but only 4.7% of neonates were weighed (UNICEF, 1999). Therefore a reliable estimate of the prevalence of low birth weight is not available.
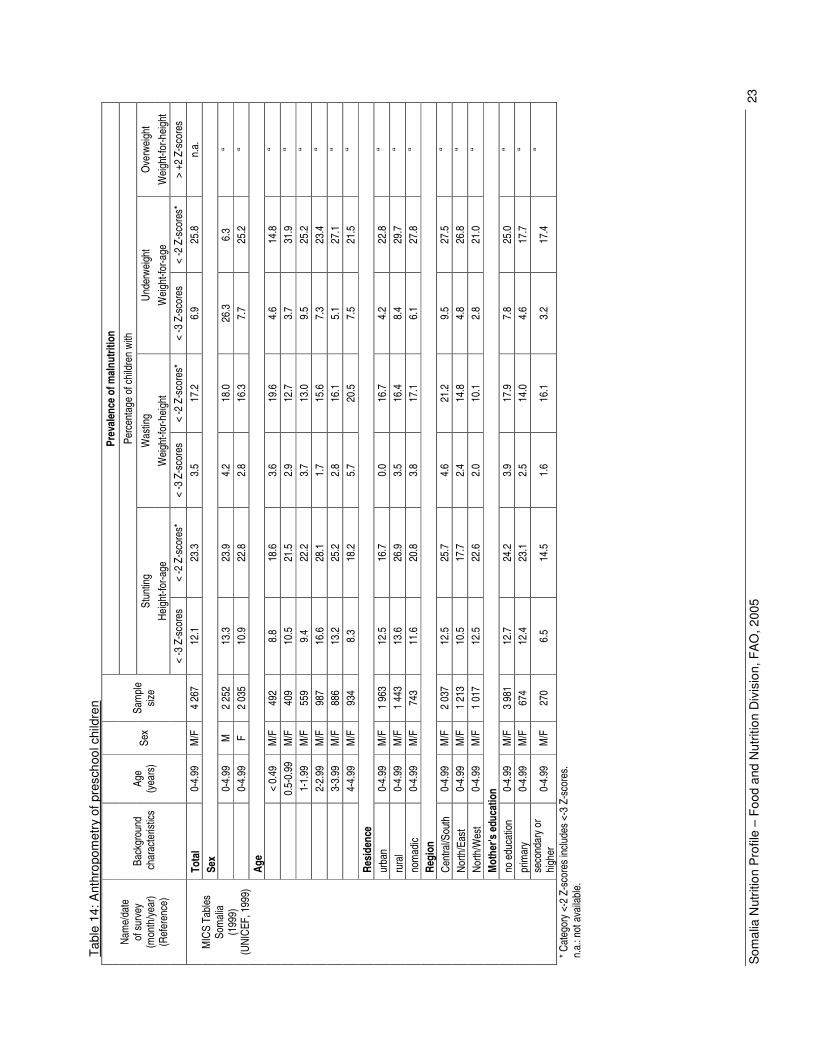
Anthropometry of preschool children
The only national survey documenting the nutritional status of preschool children in Somalia is the 1999 MICS (UNICEF, 1999). The survey showed a very high prevalence of wasting (17%) and a moderate prevalence of stunting (23%).
The level of wasting was above the threshold indicating a food crisis. All sectors, urban, rural and nomadic, showed the same level of prevalence. There were variations by region, the Central/South region being more affected (21%) than other regions. Severe wasting affected 4% of children overall. The level of education of mothers did not appear to influence prevalence of wasting.
The prevalence of stunting was higher in rural areas (27%) compared to nomadic populations (21%) and urban areas (17%). Central/South Somalia also has the highest prevalence of stunting (26%), with the lowest in the northeast (18%). Children of women with secondary and higher education were less frequently stunted than others. Boys showed slightly higher prevalences of both stunting and wasting than girls. The prevalence of underweight followed a pattern quite similar to that of stunting.
The displaced populations are highly vulnerable nutritionally as they have fewer opportunities for livelihood initiatives. They are amongst the most disadvantaged population groups in Somalia and child malnutrition rates have been shown to be very high amongst them. The nutritional status of children from farming communities is sensitive to seasonal stress. When rainfall is scarce, households become highly vulnerable to undernutrition (FSAU, 2002).
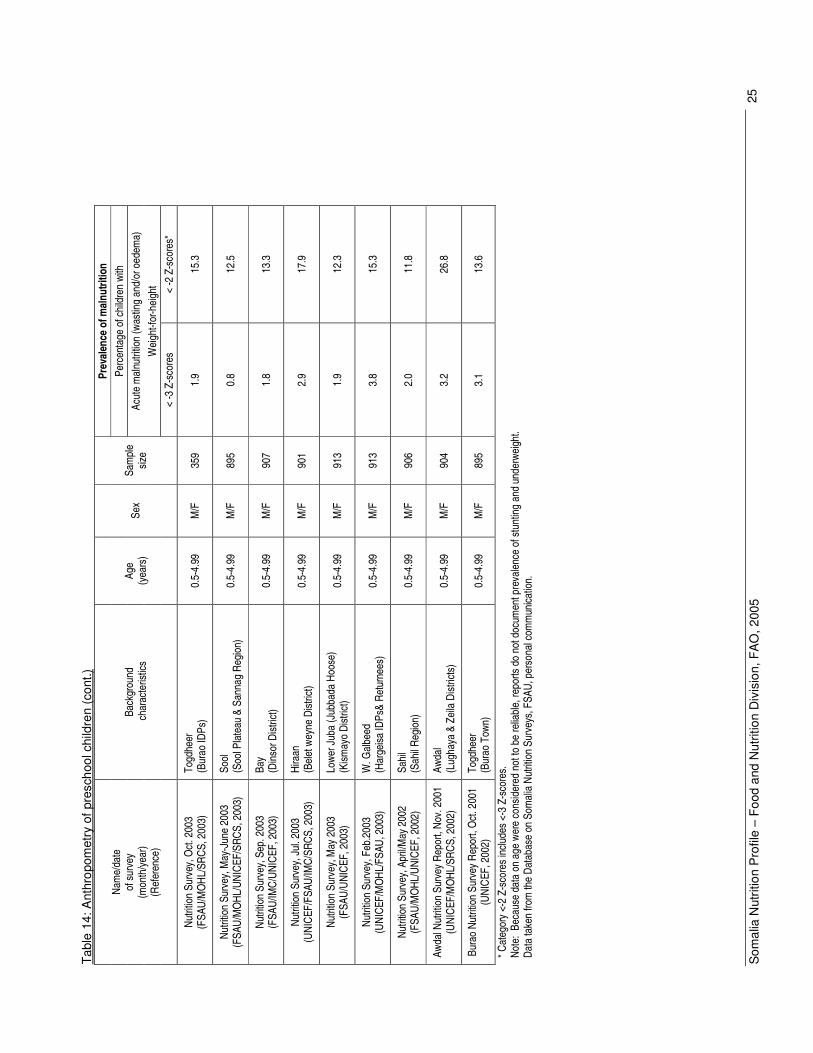
Many surveys are conducted by International relief organizations and NGOs. The surveys target population groups and districts that are considered particularly vulnerable due to displacement, seasonal stress, drought and problems of insecurity. Thus most surveys are conducted in difficult conditions and assessment of the prevalence of wasting and oedema is usually the main objective in order to detect major food crises requiring emergency food aid. Thus age of the children is not precisely determined during the surveys and estimates of prevalence of stunting and underweight are not published. The surveys are conducted at different times of the year and consecutive surveys in the same regions do not necessarily target the same population groups. Therefore it is difficult to assess trends in wasting. Many surveys show high to very high levels of wasting among underfives even when there is no major agricultural or security crisis.
Som
alia
Nut
ritio
n P
rofil
e –
Food
and
Nut
ritio
n D
ivis
ion,
FA
O, 2
005
23
Tabl
e 14
: Ant
hrop
omet
ry o
f pre
scho
ol c
hild
ren
Prev
alen
ce o
f mal
nutri
tion
Perc
enta
ge o
f chi
ldre
n wi
th
Stun
ting
Was
ting
Unde
rwei
ght
Ove
rwei
ght
Heig
ht-fo
r-age
W
eigh
t-for
-hei
ght
Wei
ght-f
or-a
ge
Wei
ght-f
or-h
eigh
t
Nam
e/da
te
of s
urve
y
(mon
th/y
ear)
(Ref
eren
ce)
Back
grou
nd
cha
ract
erist
ics
Age
(yea
rs)
Sex
Sam
ple
size
< -3
Z-s
core
s <
-2 Z
-sco
res*
<
-3 Z
-sco
res
< -2
Z-s
core
s*
< -3
Z-s
core
s <
-2 Z
-sco
res*
>
+2 Z
-sco
res
Tota
l 0-
4.99
M
/F
4 26
7 12
.1
23.3
3.
5 17
.2
6.9
25.8
n.
a.
Sex
0-
4.99
M
2
252
13.3
23
.9
4.2
18.0
26
.3
6.3
“
0-4.
99
F 2
035
10.9
22
.8
2.8
16.3
7.
7 25
.2
“ Ag
e
<
0.49
M
/F
492
8.8
18.6
3.
6 19
.6
4.6
14.8
“
0.
5-0.
99
M/F
40
9 10
.5
21.5
2.
9 12
.7
3.7
31.9
“
1-
1.99
M
/F
559
9.4
22.2
3.
7 13
.0
9.5
25.2
“
2-
2.99
M
/F
987
16.6
28
.1
1.7
15.6
7.
3 23
.4
“
3-3.
99
M/F
88
6 13
.2
25.2
2.
8 16
.1
5.1
27.1
“
4-
4.99
M
/F
934
8.3
18.2
5.
7 20
.5
7.5
21.5
“
Resi
denc
e ur
ban
0-4.
99
M/F
1
963
12.5
16
.7
0.0
16.7
4.
2 22
.8
“ ru
ral
0-4.
99
M/F
1
443
13.6
26
.9
3.5
16.4
8.
4 29
.7
“ no
mad
ic 0-
4.99
M
/F
743
11.6
20
.8
3.8
17.1
6.
1 27
.8
“ Re
gion
Ce
ntra
l/Sou
th
0-4.
99
M/F
2
037
12.5
25
.7
4.6
21.2
9.
5 27
.5
“ No
rth/E
ast
0-4.
99
M/F
1
213
10.5
17
.7
2.4
14.8
4.
8 26
.8
“ No
rth/W
est
0-4.
99
M/F
1
017
12.5
22
.6
2.0
10.1
2.
8 21
.0
“ M
othe
r's e
duca
tion
no
edu
catio
n 0-
4.99
M
/F
3 98
1 12
.7
24.2
3.
9 17
.9
7.8
25.0
“
prim
ary
0-4.
99
M/F
67
4 12
.4
23.1
2.
5 14
.0
4.6
17.7
“
M
ICS
Tabl
es
Som
alia
(1
999)
(U
NICE
F, 1
999)
seco
ndar
y or
hi
gher
0-
4.99
M
/F
270
6.5
14.5
1.
6 16
.1
3.2
17.4
“
* Cat
egor
y <-
2 Z-
scor
es in
clude
s <-
3 Z-
scor
es.
n.a.
: not
ava
ilabl
e.

Som
alia
Nut
ritio
n P
rofil
e –
Food
and
Nut
ritio
n D
ivis
ion,
FA
O, 2
005
24
Tabl
e 14
: Ant
hrop
omet
ry o
f pre
scho
ol c
hild
ren
(con
t.)
Prev
alen
ce o
f mal
nutri
tion
Perc
enta
ge o
f chi
ldre
n wi
th
Acut
e m
alnu
tritio
n (w
astin
g an
d/or
oed
ema)
W
eigh
t-for
-hei
ght
Nam
e/da
te
of s
urve
y
(mon
th/y
ear)
(Ref
eren
ce)
Back
grou
nd
cha
ract
erist
ics
Age
(yea
rs)
Sex
Sam
ple
size
< -3
Z-s
core
s <
-2 Z
-sco
res*
Regi
on
Nutri
tion
Surv
ey, J
une
2005
(F
SAU/
UNIC
EF/S
RCS/
MO
HL, 2
005)
So
ol
(Tal
eex
and
Hudd
un D
istric
ts)
0.5-
4.99
M
/F
895
0.7
10.5
Nutri
tion
Surv
ey, O
ct. 2
004
(FSA
U/UN
ICEF
/SRC
S, 2
004)
G
edo
(Luu
q Di
stric
t) 0.
5-4.
99
M/F
92
0 5.
0 25
.4
Nutri
tion
Surv
ey, A
pr. 2
004
(U
NICE
F/FS
AU/M
OH
2004
) M
udug
(G
alka
cyo
Dist
rict)
0.5-
4.99
M
/F
906
1.9
9.7
Nutri
tion
Surv
ey, S
ep. 2
004
(F
SAU/
SRCS
, 200
4)
Gal
gadu
ud
(Dus
amar
eb)
0.5-
4.99
M
/F
928
2.5
20.5
Nutri
tion
Surv
ey, S
ep/O
ct. 2
004
(UNI
CEF/
FSAU
/MO
H/SR
CS, 2
004)
Bari
(Alu
lla, K
anda
la &
Isku
shub
an
Dist
ricts
) 0.
5-4.
99
M/F
90
9 1.
9 14
.6
Nutri
tion
Surv
ey, J
ul 2
004
(UNI
CEF,
200
4)
Bena
dir
(Mog
adish
u ID
Ps)
0.5-
4.99
M
/F
900
3.2
15.8
Nutri
tion
Surv
ey, J
une/
July
2004
(F
SAU/
UNIC
EF, 2
004)
M
iddl
e Ju
ba
(Jilib
Rive
rine)
0.
5-4.
99
M/F
91
3 3.
7 19
.5
Nutri
tion
Surv
ey, A
pr 2
004
(UNI
CEF/
FSAU
/IMC/
SRCS
, 200
4)
Bako
ol
(Elb
erde
) 0.
5-4.
99
M/F
70
7 1.
0 16
.0
* Cat
egor
y <-
2 Z-
scor
es in
clude
s <-
3 Z-
scor
es.
Note
: Bec
ause
dat
a on
age
wer
e co
nsid
ered
not
to b
e re
liabl
e, re
ports
do
not d
ocum
ent p
reva
lenc
e of
stu
ntin
g an
d un
derw
eigh
t.
Data
take
n fro
m th
e Da
taba
se o
n So
mal
ia N
utrit
ion
Surv
eys,
FSA
U, p
erso
nal c
omm
unica
tion.
Som
alia
Nut
ritio
n P
rofil
e –
Food
and
Nut
ritio
n D
ivis
ion,
FA
O, 2
005
25
Tabl
e 14
: Ant
hrop
omet
ry o
f pre
scho
ol c
hild
ren
(con
t.)
Prev
alen
ce o
f mal
nutri
tion
Perc
enta
ge o
f chi
ldre
n wi
th
Acut
e m
alnu
tritio
n (w
astin
g an
d/or
oed
ema)
W
eigh
t-for
-hei
ght
Nam
e/da
te
of s
urve
y
(mon
th/y
ear)
(Ref
eren
ce)
Back
grou
nd
cha
ract
erist
ics
Age
(yea
rs)
Sex
Sam
ple
size
< -3
Z-s
core
s <
-2 Z
-sco
res*
Nutri
tion
Surv
ey, O
ct. 2
003
(FSA
U/M
OHL
/SRC
S, 2
003)
To
gdhe
er
(Bur
ao ID
Ps)
0.5-
4.99
M
/F
359
1.9
15.3
Nutri
tion
Surv
ey, M
ay-J
une
2003
(F
SAU/
MO
HL/U
NICE
F/SR
CS, 2
003)
So
ol
(Soo
l Pla
teau
& S
anna
g Re
gion
) 0.
5-4.
99
M/F
89
5 0.
8 12
.5
Nutri
tion
Surv
ey, S
ep. 2
003
(FSA
U/IM
C/UN
ICEF
, 200
3)
Bay
(Din
sor D
istric
t) 0.
5-4.
99
M/F
90
7 1.
8 13
.3
Nutri
tion
Surv
ey, J
ul. 2
003
(UNI
CEF/
FSAU
/IMC/
SRCS
, 200
3)
Hira
an
(Bel
et w
eyne
Dist
rict)
0.
5-4.
99
M/F
90
1 2.
9 17
.9
Nutri
tion
Surv
ey, M
ay 2
003
(F
SAU/
UNIC
EF, 2
003)
Lo
wer J
uba
(Jub
bada
Hoo
se)
(Kism
ayo
Dist
rict)
0.5-
4.99
M
/F
913
1.9
12.3
Nutri
tion
Surv
ey, F
eb.2
003
(UNI
CEF/
MO
HL/F
SAU,
200
3)
W. G
albe
ed
(Har
geisa
IDPs
& Re
turn
ees)
0.
5-4.
99
M/F
91
3 3.
8 15
.3
Nutri
tion
Surv
ey, A
pril/M
ay 2
002
(FSA
U/M
OHL
/UNI
CEF,
200
2)
Sahi
l (S
ahil R
egio
n)
0.5-
4.99
M
/F
906
2.0
11.8
Awda
l Nut
ritio
n Su
rvey
Rep
ort,
Nov.
200
1 (U
NICE
F/M
OHL
/SRC
S, 2
002)
Aw
dal
(Lug
haya
& Z
eila
Dist
ricts
) 0.
5-4.
99
M/F
90
4 3.
2 26
.8
Bura
o Nu
tritio
n Su
rvey
Rep
ort,
Oct
. 200
1 (U
NICE
F, 2
002)
To
gdhe
er
(Bur
ao T
own)
0.
5-4.
99
M/F
89
5 3.
1 13
.6
* Cat
egor
y <-
2 Z-
scor
es in
clude
s <-
3 Z-
scor
es.
Note
: Be
caus
e da
ta o
n ag
e we
re c
onsid
ered
not
to b
e re
liabl
e, re
ports
do
not d
ocum
ent p
reva
lenc
e of
stu
ntin
g an
d un
derw
eigh
t. Da
ta ta
ken
from
the
Data
base
on
Som
alia
Nut
ritio
n Su
rvey
s, F
SAU,
per
sona
l com
mun
icatio
n.
Somalia Nutrition Profile – Food and Nutrition Division, FAO, 2005 26
Anthropometry of school-age children and adolescents
No data are available on anthropometry of school-age children and adolescents.
Anthropometry of adult women
According to the SuRF Report, the mean body mass index (BMI) among Somali women aged 15 years and above was 21.6 kg/m² in 2002. The prevalence of overweight (BMI of 25.0-29.9 kg/m²) was estimated at 19% the same year and the prevalence of obesity (BMI �30.0) was estimated at 2% (WHO, 2005). The representativeness of the data is however not documented.
Anthropometry of adult men
In 2002, the mean BMI of men aged 15 years and above was 20.5 kg/m². Only 9.8% of these men were overweight and 0.3% were obese (WHO, 2005). The representativeness of the data is however not documented.
II.6 Micronutrient deficiencies
Iodine deficiency disorders (IDD)
Prevalence of goitre and urinary iodine level
In Somalia, no data are available on the prevalence of goitre or on the level of urinary iodine. Iodine deficiency is most probably a public health concern as access to iodized salt is extremely low (UNICEF, Somalia, Micronutrient supplementation).
Iodization of salt at household level
In 1999, a MICS survey revealed that less than 1% of all households where salt was tested used adequately iodized salt (UNICEF, 1999).
Vitamin A deficiency (VAD)
Prevalence of sub-clinical and clinical vitamin A deficiency
After the severe drought of 1986, a rapid assessment was conducted in three drought-affected regions (Bakool, Bay and Gedo) and in Hiran. Ten villages in each region were randomly selected for data collection, and the sample included 30 children from each village. Children with a height under 110 cm (corresponding in a normal population to an age of approximately 60 months) were surveyed. In the Bay region, night blindness was reported in 3% of the children. Night blindness was most prevalent in Bakool, where 7% of the children were reported to be affected (CDC, 1987).
Vitamin A deficiency could be widespread because of the low supply and low consumption of fruit and vegetables and meat. Nevertheless the substantial supply of milk is a good source of vitamin A. A food consumption survey revealed insufficient intake of vitamin A among households but more data are needed to assess the extent of the deficiency (Montani and Omwega, 2002).
Somalia Nutrition Profile – Food and Nutrition Division, FAO, 2005 27
Vitamin A supplementation
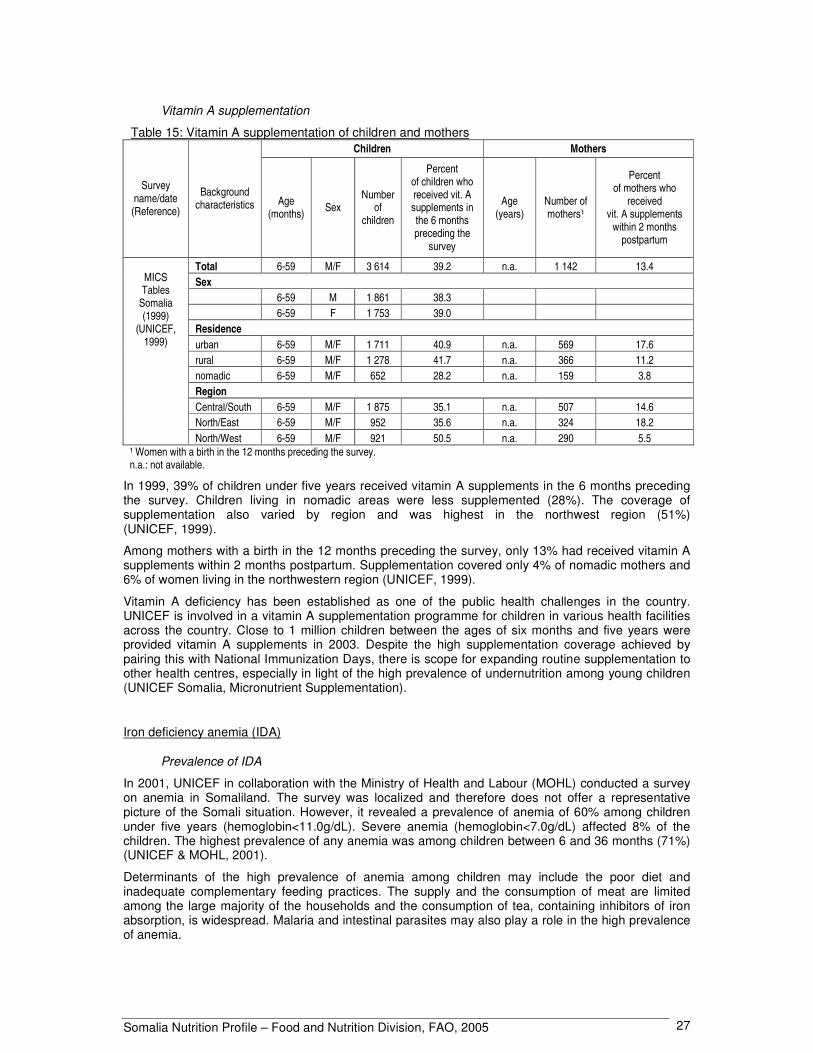
Table 15: Vitamin A supplementation of children and mothers Children Mothers
Survey name/date (Reference)
Background characteristics Age
(months) Sex Number
of children
Percent of children who received vit. A supplements in the 6 months preceding the
survey
Age (years)
Number of mothers¹
Percent of mothers who
received vit. A supplements
within 2 months postpartum
Total 6-59 M/F 3 614 39.2 n.a. 1 142 13.4 Sex 6-59 M 1 861 38.3 6-59 F 1 753 39.0 Residence urban 6-59 M/F 1 711 40.9 n.a. 569 17.6 rural 6-59 M/F 1 278 41.7 n.a. 366 11.2 nomadic 6-59 M/F 652 28.2 n.a. 159 3.8 Region Central/South 6-59 M/F 1 875 35.1 n.a. 507 14.6 North/East 6-59 M/F 952 35.6 n.a. 324 18.2
MICS Tables
Somalia (1999)
(UNICEF, 1999)
North/West 6-59 M/F 921 50.5 n.a. 290 5.5 ¹ Women with a birth in the 12 months preceding the survey. n.a.: not available.
In 1999, 39% of children under five years received vitamin A supplements in the 6 months preceding the survey. Children living in nomadic areas were less supplemented (28%). The coverage of supplementation also varied by region and was highest in the northwest region (51%) (UNICEF, 1999).
Among mothers with a birth in the 12 months preceding the survey, only 13% had received vitamin A supplements within 2 months postpartum. Supplementation covered only 4% of nomadic mothers and 6% of women living in the northwestern region (UNICEF, 1999).
Vitamin A deficiency has been established as one of the public health challenges in the country. UNICEF is involved in a vitamin A supplementation programme for children in various health facilities across the country. Close to 1 million children between the ages of six months and five years were provided vitamin A supplements in 2003. Despite the high supplementation coverage achieved by pairing this with National Immunization Days, there is scope for expanding routine supplementation to other health centres, especially in light of the high prevalence of undernutrition among young children (UNICEF Somalia, Micronutrient Supplementation).
Iron deficiency anemia (IDA)
Prevalence of IDA
In 2001, UNICEF in collaboration with the Ministry of Health and Labour (MOHL) conducted a survey on anemia in Somaliland. The survey was localized and therefore does not offer a representative picture of the Somali situation. However, it revealed a prevalence of anemia of 60% among children under five years (hemoglobin<11.0g/dL). Severe anemia (hemoglobin<7.0g/dL) affected 8% of the children. The highest prevalence of any anemia was among children between 6 and 36 months (71%) (UNICEF & MOHL, 2001).
Determinants of the high prevalence of anemia among children may include the poor diet and inadequate complementary feeding practices. The supply and the consumption of meat are limited among the large majority of the households and the consumption of tea, containing inhibitors of iron absorption, is widespread. Malaria and intestinal parasites may also play a role in the high prevalence of anemia.

Somalia Nutrition Profile – Food and Nutrition Division, FAO, 2005 28
Interventions to combat IDA
As follow-up to the survey findings, 20 health facilities were equipped with simple, cost-effective devices to screen patients for anemia. Iron-cum-folic acid supplements for pregnant women are regularly included in the expanded programme of immunization (UNICEF Somalia, Micronutrient Supplementation).
II.7 Policies and programmes aiming to improve nutrition and food security
UN agencies, international organizations, local health authorities, national and international NGOs provide support to a variety of health services, ranging from curative care to immunization, ante-natal care, nutritional rehabilitation, etc. These services are rendered through a network of some 150 mother-and-child centres. However, not all Somali have access to these services, women having particularly difficult access to health care (UN, 2003b). Moreover insecurity is a major constraint which hinders provision of services and access of the population to health care centres.

Somalia Nutrition Profile – Food and Nutrition Division, FAO, 2005 29
Reference list CDC, 1987. International Notes Rapid Nutrition Evaluation in Drought-affected regions of Somalia. Centers for Disease Control. (available at http://www.cdc.gov/mmwr/preview/mmwrhtml/00001049.htm). DEC. 2004. Food Security Programme for Somalia. Delegation of the European Commission. (available at http://www.delken.cec.eu.int/en/eu_and_somalia/cooperation/food_security.htm). FAO. 2004. Consolidated Inter-Agency Appeal 2004. Technical Cooperation Department, Food and Agriculture Organization of the United Nations, Rome. (available at http://www.fao.org/reliefoperations/en/appeals/2004/highlight_40478.html). FAO & WHO. 2002. Expert consultation on human vitamin and mineral requirements. Food and Agriculture Organization of the United Nations, Rome, and World Health Organization, Geneva. FAO. 2005. AQUASTAT country profile: Somalia. Land and Water Division, Food and Agriculture Organization of the United Nations, Rome. (available at http://www.fao.org/ag/agl/aglw/aquastat/countries/somalia/index.stm). FAO. 2004b. A review of the livestock sector in the Horn of Africa (IGAD countries). Food and Agriculture Organization of the United Nations, Rome. (also available at http://www.fao.org/docs/eims/upload/164037/lsr_IGAD.pdf). FAO. Forestry Division. Country Profiles - Somalia. Food and Agriculture Organization of the United Nations, Rome. (available at http://www.fao.org/forestry/foris/webview/forestry2/index.jsp?sitetreeId=18927&langId=1&geoId=0). Accessed 2005. FAO. FAOSTAT Database. Food and Agriculture Organization of the United Nations, Rome. (available at http://faostat.external.fao.org/faostat). Accessed 2005. FAO. GIEWS workstation. Food and Agriculture Organization of the United Nations, Rome. (available at http://www.fao.org/giews/workstation/english/index.htm). Accessed 2005. FSAU. 2005. Highlights: FSAU Post Gu 2005 Seasonal Assessment. Food Security Analysis Unit – Somalia, Nairobi. (available at http://www.fews.net/centers/files/Somalia_200507en.pdf). FSAU. 2004. Dietary Diversity in Dangarayo and Dinsor Districts, Somalia. Food Security Analysis Unit – Somalia, Nairobi. (available at http://www.fsausomali.org/uploads/Other/243.pdf). FSAU. Database on Somalia Nutrition Surveys. Food Security Analysis Unit – Somalia, Nairobi, personal communication. Hemrich, G. 2003. Matching Food security Analysis to Context: the experience of the Somalia Food security Assessment Unit. FAO International Workshop. (available at ftp://ftp.fao.org/docrep/fao/meeting/009/ae506e.pdf). ILO. C182 Worst Forms of Child Labour Convention, 1999 – list of ratifications. International Labour Organization, Geneva. (available at http://www.ilo.org/ilolex/cgi-lex/ratifce.pl?C182). Accessed in May 2005.
Somalia Nutrition Profile – Food and Nutrition Division, FAO, 2005 30
ITU. World Telecommunication Indicators Database. International Telecommunication Union. (available at http://www.itu.int/ITU-D/ict/statistics/). Accessed 2005. Montani & Omwega. 2002. Food and utilisation study. Food Security Analysis Unit (FSAU) Somalia. (available at http://www.fsausomali.org/uploads/Other/75.pdf). Save the Children, 2005. Country Brief 2004/2005. Save the Children UK. (available at http://www.savethechildren.org.uk/cb/Soma.pdf). UN. 2005a. Report of the Secretary-General on the situation in Somalia – 16 June 2005. S/2005/392. United Nations Security Council, New York. (available at http://daccessdds.un.org/doc/UNDOC/GEN/N05/383/84/PDF/N0538384.pdf?OpenElement). UN. 2005b. Humanitarian Situation in Somalia, Monthly Analysis. United Nations, New York. (available at http://www.reliefweb.int/library/documents/2005/unct-som.31jul.pdf). UN. 2003a. Report of the Secretary-General on children and armed conflict – 30 October 2003. A/58/546–S/2003/1053. United Nations Security Council, New York. (available at http://daccessdds.un.org/doc/UNDOC/GEN/N03/555/09/PDF/N0355509.pdf?OpenElement). UN. 2003b. Consolidated Appeals Process (CAP), Somalia 2004. United Nations, New-York and Geneva. UN. 2002. Consolidated Interagency Appeal 2002: Somalia. United Nations, New-York and Geneva. UN Somalia. 2004. Report on the Inter-Agency Internal Displacement Division Mission to Somalia - 7 to 16 December 2004. United Nations System in Somalia. (available at http://www.unsomalia.net/Reports_Publications/McNamara%20mission%20report_Dec04.pdf). UNAIDS. 2002. Epidemiological Fact Sheets, Somalia. Joint United Nations Programme on HIV/AIDS, Geneva. (available at http://www.who.int/emc-hiv/fact_sheets/All_countries.html). UNAIDS. 2004. Epidemiological Fact Sheets, Somalia. Joint United Nations Programme on HIV/AIDS, Geneva. (available at http://www.who.int/hiv/pub/epidemiology/pubfacts/en/). UNDP. 2001. National Human Development Report for Somalia. United Nations Development Programme. New York. (available at http://www.unsomalia.org). UNDP. 2004. Human Development Report 2004. United Nations Development Programme. New York. (available at http://hdr.undp.org/reports/global/2004/). UNDP & WB. 2003a. Country re-engagement note – Somalia, April 2003. United Nations Development Programme, New York, and the World Bank, Washington DC. (available at http://www-wds.worldbank.org/servlet/WDSContentServer/WDSP/IB/2004/03/25/000112742_20040325090551/Rendered/PDF/282760Somalia0Country0reengagement0note.pdf). UNDP & WB. 2003b. Somalia socio-economic survey 2002. Report N. 1, Somalia Watching Brief. United Nations Development Programme, New York, and the World Bank, Washington DC. (available at http://www.so.undp.org/docs/whole%20SWB%20book.pdf).

Somalia Nutrition Profile – Food and Nutrition Division, FAO, 2005 31
UNESCO. Global Education Digest 2004. Institute for Statistics, United Nations Educational, Scientific and Cultural Organization, Montreal. (available at http://www.uis.unesco.org/TEMPLATE/pdf/ged/2004/GED2004_EN.pdf). UNFPA & WB. 2004. Female Genital Mutilation / Cutting in Somalia. United Nations Population Fund and the World Bank. (available at http://www.sacb.info/HIVAIDS/FGM/World%20Bank%20UNFPA%20FGM%20Report.pdf).� UNICEF. 2003a. Strategic Framework for the Prevention and Control of HIV/AIDS and STIs within Somali Populations 2003-2008. United Nations Children’s Fund, New York. (available at http://www.sacb.info/HIVAIDS/HIV%20Strategic%20Framework.pdf). UNICEF. 2003b. From Perception to Reality: A Study On Child Protection in Somalia. United Nations Children’s Fund, New York. (available at http://www.db.idpproject.org/Sites/IdpProjectDb/idpSurvey.nsf/wViewCountries/C3B9CC01C598DA3AC1256E840055F8B2/$file/UNICEF+Chapter+8+protection.pdf). UNICEF, 2002. Nutrition Survey Report, Beledweyne District, Hiiran Region Somalia. United Nations Children’s Fund, New York. (available at http://www.fsausomali.org/uploads/Other/108.pdf). UNICEF. 2001. End Decade Multiple Cluster Survey for Somalia. United Nations Children’s Fund, New York. UNICEF. 1999. Multiple Indicator Cluster Survey, Tables from Somalia, 1999. United Nations Children’s Fund, New York. (available at http://www.childinfo.org/MICS2/newreports/somalia/somaliatables.PDF). UNICEF. 1998. Children and women in Somalia, a situation analysis. United Nations Children’s Fund, Somalia. UNICEF. The State of the World's Children 2005. United Nations Children’s Fund, New York. (available at http://www.unicef.org/publications/index_24432.html). UNICEF. Information by country. United Nations Children’s Fund, New York. (available at http://www.unicef.org/statistics/). Accessed 2005. UNICEF & MOHL. 2001. Report of Anaemia Survey in Somaliland. United Nations Children’s Fund, Hargeisa, Ministry of Health and Labour, Somalia.
UNICEF Somalia. Activities. Supplementary feeding and breastfeeding. United Nations Children’s Fund, Somalia. (available at http://www.unicef.org/somalia/nutrition_109.html). UNICEF Somalia. Micronutrient supplementation. United Nations Children’s Fund, Somalia. (available at http://www.unicef.org/somalia/nutrition_106.html). UNPD. World Population Prospects: the 2004 Revision. Population Division of the Department of Economic and Social Affairs of the United Nations Secretariat. New York, USA. (available at http://esa.un.org/unpp). Accessed in 2005. UNSTAT. Millennium Indicators Database. United Nations Statistics Division, New York. (available at http://unstats.un.org/unsd/mi/mi_goals.asp). Accessed 2005.

Somalia Nutrition Profile – Food and Nutrition Division, FAO, 2005 32
WB. World Development Indicators Database. World Bank, Washington D.C. (available at http://devdata.worldbank.org/data-query/). Accessed 2005. WFP. 2004. Food Aid Monitor 2003. International Food Aid Information System. World Food Programme of the United Nations, Rome. (available at: http://www.wfp.org/interfais/index2.htm). Acceded July 2005. WFP. 2002. Summary report of the Evaluation of Somalia PRRO 6073.00. World Food Programme of the United Nations, Rome. (available at http://www.wfp.org/eb/docs/2002/wfp006965~2.pdf). WHO. 2005. The SuRF Report 2. Surveillance of chronic disease Risk Factor. Country-level data and comparable estimates. World Health Organization, Geneva. (available at http://www.who.int/ncd_surveillance/infobase/web//surf2/start.html). WHO. 2003. Diet, nutrition and the prevention of chronic diseases. Report of a joint WHO/FAO Expert Consultation. WHO Technical Report Series 916. World Health Organization, Geneva. WHO. 2001 Female Genital Mutilation: Integrating the Prevention and the Management of the Health Complications into the curricula of nursing and midwifery. A Student’s Manual. World Health Organization, Geneva. (available at http://www.who.int/gender/other_health/Studentsmanual.pdf). WHO.1983. Measuring Change in Nutritional Status. World Health Organization, Geneva. WHO. Global Database on Child Growth and Malnutrition. World Health Organization, Geneva. (available at http://www.who.int/nutgrowthdb/). Accessed July 2005.