Nutrient Removal in Constructed Wetlands Treating ...
43
Nutrient Removal in Constructed Wetlands Treating Agricultural Tile Drainage by Copyright 2016 Hyunjung Lee Submitted to the graduate degree program in Civil, Environmental, and Architectural Engineering and the Graduate Faculty of the University of Kansas in partial fulfillment of the requirements for the degree of Master of Science. ________________________________ Chairperson Edward F. Peltier, Ph.D. ________________________________ C. Bryan Young, Ph.D., P.E. ________________________________ Ray E. Carter Jr, Ph.D. Date Defended: September 2, 2016
Transcript of Nutrient Removal in Constructed Wetlands Treating ...

Nutrient Removal in Constructed Wetlands Treating Agricultural Tile Drainage
by
Copyright 2016
Hyunjung Lee
Submitted to the graduate degree program in Civil, Environmental, and Architectural Engineering and the Graduate Faculty of the University of Kansas in partial fulfillment of the
requirements for the degree of Master of Science.
________________________________ Chairperson Edward F. Peltier, Ph.D.
________________________________ C. Bryan Young, Ph.D., P.E.
________________________________ Ray E. Carter Jr, Ph.D.
Date Defended: September 2, 2016
ii
The Thesis Committee for Hyunjung Lee certifies that this is the approved version of the following thesis:
Nutrient Removal in Constructed Wetlands Treating Agricultural Tile Drainage
________________________________ Chairperson Edward F. Peltier, Ph.D.
Date approved: September 6, 2016

iii
Abstract Agricultural runoff can carry substantial loadings of nitrogen and phosphorus that can
impact local surface water quality and contribute to impairment of water bodies further
downstream. Subsurface tile drainage, a drainage water management practice commonly used in
the Midwest, is known to contribute to elevated levels of these contaminants. Strategies to
improve drainage water quality must be implemented in a way that minimally impacts land
utilization and crop yield. In this study, three constructed wetlands were utilized to treat runoff
from tile outlet terrace (TOT) agricultural fields managed under either a no-till corn-soybean
rotation with wheat prior to soybean, or a no-till soybean crop. Nutrient and sediment removal
efficiencies and runoff impact on receiving streams were determined during two growing seasons
in 2014 and 2015. Water samples were collected with an auto-sampler at the wetland influent
and effluent locations at Harvest Hills North (HHN/site 1), Harvest Hills Middle (HHM/site2),
and Dan Cain site (Cain/site3). Using stream bottles, samples were also collected from two local
streams that receive TOT runoff during and after storm events.
Over the two years, changes in nutrient and sediment loads to the wetlands were observed.
Runoff quality was affected by changes in crop type, fertilizer application rate, and precipitation
pattern, frequency and intensity. During the two growing seasons, TOT runoff was responsible
for 99.5, 71.2 and 197.7 kg of TN entering the wetlands at sites 1, 2 and 3, respectively, of which
67.7, 59.3 and 93.8 kg exited the system in the wetland effluent (32, 17 and 53% load removal).
For TP, approximately 16.54, 8.75 and 45.18 kg entered the wetlands, of which 10.24, 5.25 and
19.67 kg exited (38, 40 and 56% removal). For total suspended solids (TSS), roughly 14793,
4023 and 64624 kg entered, of which 4824, 1748 and 10876 kg exited (67, 57 and 83% removal).
Compared to the year with soybean crop coverage (2014) at the sites with a no-till corn-soybean

iv
rotation (sites 1 and 2), higher sediment concentration in TOT runoff was observed at the site
with a no-till soybean crop both years (site3). The wetlands’ performance was typically better
with higher influent concentrations, although the wetland design and inflow volume also seemed
to contribute as well. Variations in behavior between two similar wetlands (sites 1 and 2) were
likely due to differences in seepage rates and flow distribution through the wetlands, which is
believed to have changed as sediments built up near the influent discharge pipe at site 1.
Stream monitoring results showed that median concentrations of TN and TP were higher
than the benchmark values for streams in U.S. EPA Region 7, with no measureable impact from
either the treated (wetland effluent) or the untreated runoff. Potential reasons for why no
significant impact to stream quality was observed are the relatively low volume of discharge
relative to stream flow, and the relatively high stream levels of nutrients and sediments even
upstream of the discharge location.

v
Acknowledgements I would first like to express my sincere gratitude to my advisor Dr. Edward Peltier for his
continuous guidance and support through my master’s work. Dr. Peltier has been supportive not
only academically in successfully completing tough coursework and thesis project, and
emotionally with invaluable encouragements and patience, but also by providing a teaching
assistantship and a research assistantship over the two years.
I would like to thank the committee members, Dr. Bryan Young and Dr. Ray Carter. I
would like to thank Dr. Bryan Young for his patience and assistance by providing first insight
into data analysis using R, feedback and edit suggestions of the thesis draft, and constructive
comments on my work. I would also like to thank Dr. Ray Carter for providing analytical and
technical assistance, and critical comments and edit suggestions of the thesis write up. I also
appreciate LlynnAnn Luellen’s time and patience as she assisted me with learning the laboratory
tests and her work with collection of field samples.
I gratefully acknowledge the Ross E. McKinney Environmental Engineering Scholarship
that allowed me to undertake my master’s work.
I would also like to thank my parents for the endless support and belief, and for always
being there for me even though we live almost 9000 miles away. And finally to Sanghee, who
has been by my side along this journey, encouraging and supporting me to do my best.

1
Table of Contents
1 INTRODUCTION ................................................................................................................ 21.1 BACKGROUND........................................................................................................................21.2 TILE OUTLET TERRACE (TOT) DRAINAGE AND ITS POTENTIAL IMPACTS...............21.3 AGRICULTURAL RUNOFF TREATMENT WETLANDS......................................................51.4 KANSAS WATERS AND LANDS............................................................................................51.5 STUDY OBJECTIVES...............................................................................................................6
2 MATERIALS AND METHODS ......................................................................................... 72.1 SITE BACKGROUND...............................................................................................................72.2 COLLECTION, PRESERVATION AND STORAGE OF WATER SAMPLES........................82.3 ANALYSIS OF WATER SAMPLES.......................................................................................11
2.3.1 TOTAL SUSPENDED SOLIDS (TSS) ANALYSIS................................................................112.3.2 TOTAL PHOSPHORUS (TP) AND TOTAL DISSOLVED PHOSPHORUS (TDP) ANALYSIS 122.3.3 TOTAL NITROGEN (TN) AND TOTAL DISSOLVED NITROGEN (TDN) ANALYSIS........122.3.4 STATISTICAL ANALYSIS.....................................................................................................13
3 RESULTS AND DISCUSSION ......................................................................................... 153.1 NITROGEN IN TOT RUNOFF................................................................................................153.2 PHOSPHORUS AND TOTAL SUSPENDED SOLIDS IN TOT RUNOFF.............................183.3 PERFORMANCE OF WETLANDS IN CONSTITUENT REMOVAL...................................223.4 STREAM MONITORING RESULTS......................................................................................28
4 CONCLUSIONS ................................................................................................................. 335 REFERENCES .................................................................................................................... 35

2
1 INTRODUCTION
1.1 BACKGROUND
According to U.S. EPA 1, agricultural runoff was responsible for almost 40 percent of the
impairment in assessed rivers and lakes in the United States. Nutrients and sediment were the
fifth and the seventh leading causes, along with pathogens, habitat alteration, oxygen depletion
and metals. Agricultural runoff can contain significant loadings of suspended solids, nitrate,
phosphorus, and agricultural chemicals, which are normally mobilized in association with
precipitation events 2-4. Studies suggest that such runoff can negatively impact local receiving
surface water as well as water bodies further downstream such as the Gulf of Mexico 5,6. This
deterioration of receiving water bodies, especially those associated with high levels of nitrogen
and phosphorus, are likely to contribute to an increase in algal growth, which can lead to variety
of problems like oxygen depletion, turbidity and stream habitat degradation 1,5. Effective
treatment of pollutants from nonpoint sources can significantly reduce such impacts but must be
achieved with minimal reduction to land utilization and crop yield 2.
1.2 TILE OUTLET TERRACE (TOT) DRAINAGE AND ITS POTENTIAL IMPACTS
The subsurface drainage pipes that make up a network system in tile outlet drainage
systems were originally made of clay, not plastic as is used today 7. French farmers are generally
known to have found the modern type of tile drainage, although it may have first used far before
that 7. Today, a commonly used TOT system incorporates conventional terraces with perforated
risers that drains runoff when water level is above a designated height, allowing longer residence
time for removal of nutrients and sediments (Figure 1). In the United States, subsurface drainage
systems are commonly used in the Midwest as a water management practice in soil with a water
table near or above the soil surface due to poor drainage. Prolonged soil saturation interrupts
3
plant growth and development, these systems improve productivity, which allows a rapid rate of
return on the investment.
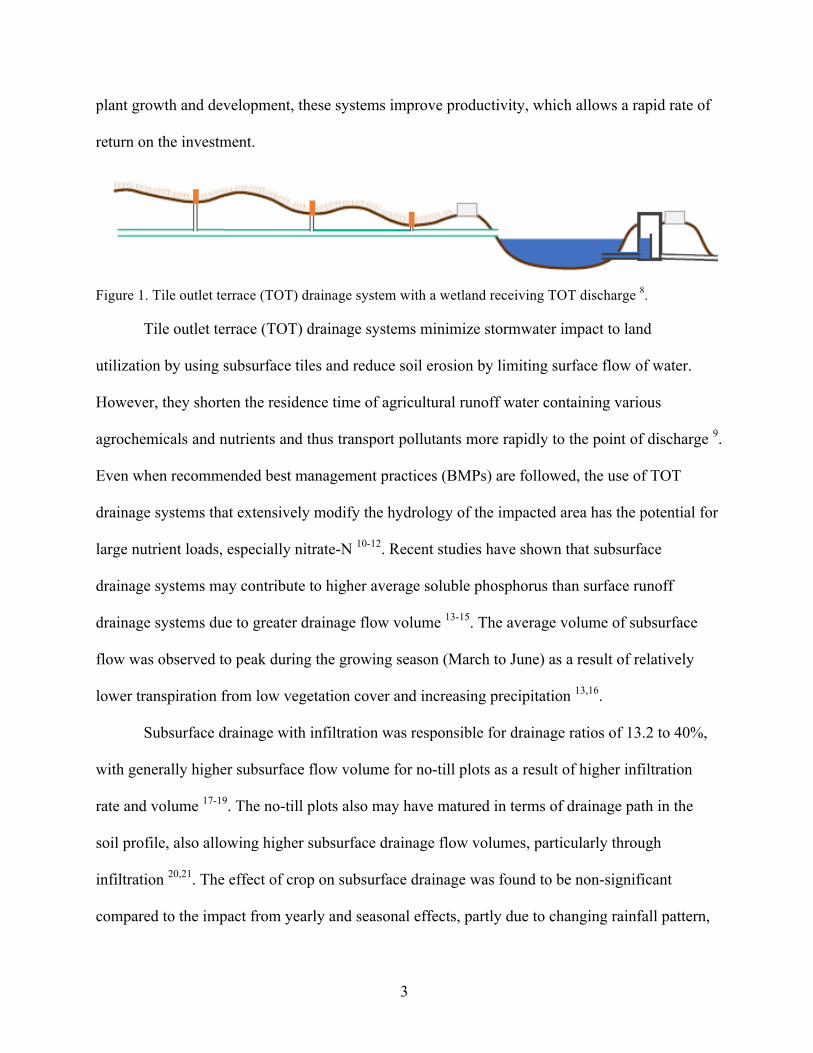
Figure 1. Tile outlet terrace (TOT) drainage system with a wetland receiving TOT discharge 8.
Tile outlet terrace (TOT) drainage systems minimize stormwater impact to land
utilization by using subsurface tiles and reduce soil erosion by limiting surface flow of water.
However, they shorten the residence time of agricultural runoff water containing various
agrochemicals and nutrients and thus transport pollutants more rapidly to the point of discharge 9.
Even when recommended best management practices (BMPs) are followed, the use of TOT
drainage systems that extensively modify the hydrology of the impacted area has the potential for
large nutrient loads, especially nitrate-N 10-12. Recent studies have shown that subsurface
drainage systems may contribute to higher average soluble phosphorus than surface runoff
drainage systems due to greater drainage flow volume 13-15. The average volume of subsurface
flow was observed to peak during the growing season (March to June) as a result of relatively
lower transpiration from low vegetation cover and increasing precipitation 13,16.
Subsurface drainage with infiltration was responsible for drainage ratios of 13.2 to 40%,
with generally higher subsurface flow volume for no-till plots as a result of higher infiltration
rate and volume 17-19. The no-till plots also may have matured in terms of drainage path in the
soil profile, also allowing higher subsurface drainage flow volumes, particularly through
infiltration 20,21. The effect of crop on subsurface drainage was found to be non-significant
compared to the impact from yearly and seasonal effects, partly due to changing rainfall pattern,

4
intensity and amount between the years 17,19. Early rainfall occurrence, for example, before crop
coverage was shown to increase drainage volume even with very similar annual discharge
volumes 16.
One way to indicate contamination potential, especially crucial when streams receiving
tile runoff join a drinking water source, is studying flow-weighted average NO3-N concentrations
(FWANC) 17,22. Typical NO3-N FWANC values found ranged from 5 to 15.5 mg-N/L 17-19. It
was found that lower levels of NO3-N in tile water can occur due to the prior year was very wet,
resulting in excessive flushing from soil profile, dilution effects from high tile drainage volume,
reduction in fertilizer application rate and/or coverage of plots in winter with a “trap crop” 17-
19,23.
Despite the fact that subsurface drainage is subject to higher nutrient concentrations and
loadings, there are few specific effective policies and plans that target this issue. For example,
the Clean Water Rule, which aims to address issues related to water pollution, protects only
waters that are already covered by the Clean Water Act (CWA), and fails to address problems of
wastewater generated from crop land which includes tile drains. The Hypoxia Task Force Action
Plan 2008 24, a national program to reduce Gulf hypoxia, called for a significant reduction of
nitrogen loading from the Mississippi River Basin to the Gulf through a combination of several
proven techniques, which includes the creation and restoration of wetlands and riparian
reservoirs 25,26. Despite the efforts and investments to reduce inputs of nitrogen into the system,
the most recent report27 states that the levels of nitrogen have stayed the same or increased in 84
percent of streams in the United States.

5
1.3 AGRICULTURAL RUNOFF TREATMENT WETLANDS
Wetlands have demonstrated potential to address water quality problems associated with
agricultural runoff and to provide an environmental buffer 3,4,28. Wetlands can target a range of
contaminants alone or in combination, such as suspended solids, nitrate, phosphorus and
agrochemicals 4. Compared to other treatment options, constructed wetlands provide passive, low
maintenance systems that are capable of dealing with pulses of flow and contaminants associated
with highly variable storm events 28. Unfortunately, the effectiveness of these systems depends
on many variables, including rainfall pattern, intensity and frequency, influent nutrient loading,
and hydraulic retention time 29,30.
In previous studies, TN load removal in wetlands ranged between 33 to 55% and TP load
removal from negative removal to 80% 28,31,32. At all times, TN loads exiting the constructed
wetlands were lower than those flowing into the wetlands 28. The fraction of dissolved nitrogen,
particularly nitrate nitrogen (NO3-N) was found to decrease as water flows through the wetlands,
and a possible explanation for this is that there was some production of organic N within the
wetland 31. The wide range of removal efficiency of wetlands can be due to the combination of
complex processes and interactions. For treatment wetlands to be designed for the best
performance, it is therefore important to understand the impact of local climate, farming
practices and soil conditions.
1.4 KANSAS WATERS AND LANDS
In Kansas, a program called Watershed Restoration and Protection Strategy (WRAPS)
addresses the issues regarding impaired water bodies affected by nonpoint sources, and aims to
reduce contaminant loading from those to achieve Clean Water Act requirements 33. The
assessment of the Upper Wakarusa Watershed identified it as one of the watersheds that needs

6
restoration, and thus a WRAPS program for this watershed area began in 2001 33. The Upper
Wakarusa is 235,400 acres in area, of which roughly 83% is made up of grassland/rangeland
(roughly 56%) and cropland (roughly 27%) 33. Farmed land with steeper slopes is usually
terraced in an effort to reduce soil erosion 33.
Serving as the primary drinking water source to most residents of Douglas County 33,
Clinton Lake must maintain appropriate water quality standards. Nutrient and sediment load
reductions within the watershed are believed to be sufficient to meet these requirements 33. The
Kansas Water Vision for the Kansas Water Regional Planning Area, which includes Douglas
County, suggests learning the strengths and limitations of technologies and best management
practices for better utilization 34. In an effort to do this, the Kansas Water Office (KWO) and U.S.
EPA, along with local landowners, invested in the construction of treatment wetlands in Douglas
County as a pilot project. This paper focuses on the strength and weakness of wetlands as a
strategy to treat agricultural tile drainage before discharging to receiving water bodies.
1.5 STUDY OBJECTIVES
To assess the effectiveness of constructed wetlands for treating runoff from tile outlet
terrace (TOT) agricultural fields, we collected and tested influent and effluent water from more
than 20 storm events over two growing seasons. To find the impact of direct TOT runoff and
wetland effluent and to determine reference values, two intermittent streams located adjacent to
farmlands were monitored. This paper presents the effectiveness of these wetlands on effluent
water quality and downstream nitrogen and phosphorus loadings.

7
2 MATERIALS AND METHODS
2.1 SITE BACKGROUND
The three wetlands observed in this study were the Harvest Hills North (HHN), Harvest
Hills Middle (HHM) and Dan Cain (Cain) wetlands, all located within the Upper Wakarusa
River watershed in Douglas County, Kansas (Figure 3a and b). As can be seen from Figure 3, the
two Harvest Hills wetlands are similar in shape and size with a length to width ratio close to 1:1,
whereas the Cain wetland has a ratio of roughly 1:4. At the HHN and HHM wetland retention
sites, the contributing drainage areas (CDA) are 14.8 and 17.4 acres of cropland, respectively. It
should be noted that the drainage surface inlet on the second terrace at HHN is exposed without a
riser, thus is vulnerable to significant erosion during heavy storm events. The crops planted were
winter wheat in the last quarter of 2013 then soybeans in 2014 and corn in 2015. At the Cain
wetland site, the CDA is roughly 29 acres through a tile drainage system, in addition to a small
area below the last terrace that drains directly into the wetland. The crops planted were soybeans
in both years.
Figure 2. Comparison between normal monthly mean precipitation for Clinton Lake, KS, to 2014 and 2015 monthly mean precipitation 35.

8
Located in the Northeastern Kansas, the study region receives about 36 to 38 inches of
average annual rainfall. Precipitation occurs particularly during the spring and early summer
seasons. Figure 2 shows normal monthly mean precipitation and 2014 and 2015 monthly mean
precipitation. Most precipitation events occurred from early Spring to June, with highest mean
precipitation in June 2014 and in May 2015.
2.2 COLLECTION, PRESERVATION AND STORAGE OF WATER SAMPLES
The sampling setup consisted of an autosampler, area-velocity meter and rain gage at
each sampling location. The autosamplers to sample inflow were installed at the outlet of the
TOT system at the Harvest Hills sites and at the standpipe on third terrace at the Cain site.
Outflow autosamplers sampled from the pond at the weir overflow box at the Harvest Hills sites
and from the pipe outlet pond at the Cain site. During each rain event, flow is registered by the
sensor, which turns on the autosamplers. The area-velocity meters (ISCO Model 750 Area
Velocity Flow Module) were set up in the tile drain over the effluent weir at Harvest Hills sites
and in the effluent pipe at the Cain site. In addition, an ISCO Model 674 Tipping Bucket Rain
Gauge installed near each inflow sampling location measured rainfall amounts. The system was
powered with an ISCO 12 VDC Battery with Solar Panel Charger (Figure 4).
Samples were collected at the wetland influent and effluent throughout the growing
seasons in 2014 and 2015 (June-October in 2014, n = 5-17 per site; April-November in 2015, n=
9-12 per site). Due to discharges that were mostly event-driven, auto samplers (ISCO Model
6712 Full-Size Samplers) were programmed to collect 200 mL into a bottle (ISCO Single-Bottle
2.5 Gallon (9.46 L) Polyethylene Round Bottle) for each specified trigger volume along with
grab samples, occasionally, at each monitoring location for entire runoff events. The details in
calculating the magnitude of the specified trigger volume can be found in the standard operating

9
(a)
(b)
Figure 3. Location of (a) the study sites within the Douglas County, KS, and (b) close-up imagery of the Harvest Hills wetland sites and Dan Cain wetland sites.

10
procedures for the monitoring project 8. Time sequence samples were collected for a few storm
events but only data from composited samples were used for this paper.
Figure 4. Typical wetland auto-sampling equipment set up 8.
Stream samples were collected at the Cain site (site 3) and the Haase site to investigate
the impacts of treated and untreated TOT runoff on surface water quality, and to provide
reference values for sediment and nutrient values in TOT runoff. The Haase site used similar
farming practices as the two Harvest Hills sites but had no wetland, which means it discharged
untreated TOT runoff directly into an adjacent stream. TOT discharge samples were collected at
both locations. At Haase, an outfall sample was collected immediately downstream of the TOT
discharge pipe from this cropland. At the Cain site, it was collected just downstream of a
submerged bubble-up pipe discharging direct TOT runoff from a portion of that site that does not
drain to the wetland. Stream samples were also collected upstream and downstream of the TOT
outfall (Haase site) and the wetland effluent discharge location (Cain site).
Collected water samples were sub sampled and preserved according to the specific
analytical methods. The sub samples were kept in a cooler packed with ice to achieve a water
11
temperature at or below 10 °C when brought back to the laboratory. For total phosphorus (TP),
total nitrogen (TN), total dissolved phosphorus (TDP), total dissolved nitrogen (TDN) and total
suspended solids (TSS), more than 300 mL, typically around 500 mL, were sub sampled in the
laboratory into a plastic container. For whole sample and dissolved sample analyses, maximum
holding times were 28 days and 2 days, respectively, at 4 °C. Dissolved water samples were
obtained by filtering whole water samples through a microfiber filter (Fisher Scientific # 09-874-
35 or equivalent) after removing any large chunks of plant material.
2.3 ANALYSIS OF WATER SAMPLES
Aliquots of each water sample were measured for TSS, TP, TDP, TN and TDN. If not
stated otherwise, QA/QC procedures were adapted from Standard Method 1020, and sample
collection and preservation guidelines followed Standard Method 1060 36. All water samples
were analyzed following published SOPs approved for this project by USEPA, which can be
found in the final project report 8. A brief summary of each method is provided below.
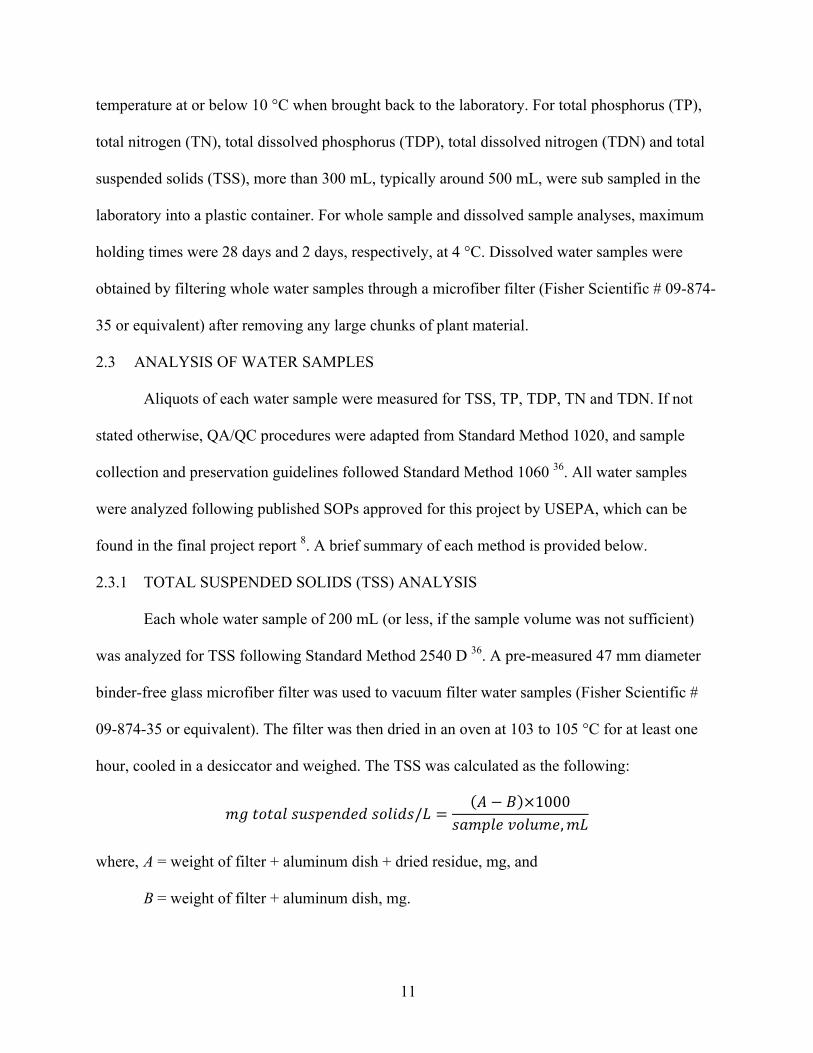
2.3.1 TOTAL SUSPENDED SOLIDS (TSS) ANALYSIS
Each whole water sample of 200 mL (or less, if the sample volume was not sufficient)
was analyzed for TSS following Standard Method 2540 D 36. A pre-measured 47 mm diameter
binder-free glass microfiber filter was used to vacuum filter water samples (Fisher Scientific #
09-874-35 or equivalent). The filter was then dried in an oven at 103 to 105 °C for at least one
hour, cooled in a desiccator and weighed. The TSS was calculated as the following:
𝑚𝑔𝑡𝑜𝑡𝑎𝑙𝑠𝑢𝑠𝑝𝑒𝑛𝑑𝑒𝑑𝑠𝑜𝑙𝑖𝑑𝑠/𝐿 =𝐴 − 𝐵 ×1000
𝑠𝑎𝑚𝑝𝑙𝑒𝑣𝑜𝑙𝑢𝑚𝑒,𝑚𝐿
where, A = weight of filter + aluminum dish + dried residue, mg, and
B = weight of filter + aluminum dish, mg.

12
2.3.2 TOTAL PHOSPHORUS (TP) AND TOTAL DISSOLVED PHOSPHORUS (TDP)
ANALYSIS
Standard Method 4500-P (E) was used in the analysis of water samples for TP and TDP
36. In this method, persulfate digestion is used to convert all phosphorus in the sample to ortho-
phosphate. Phosphate concentrations are then determined by colorimetric analysis. For each
sample 30 mL of either whole water sample (for TP) or filtered water (for TDP) was mixed with
7.5 mL of a 40 g/L potassium persulfate solution in acid-cleaned 55 mL Pyrex tubes. The
samples were then autoclaved for 45 minutes at 121 °C and 15 psi.
Digested samples were allowed to be stored at 4 °C for no more than one week before
analysis. Immediately before analysis, 3.75 mL of the final mixed reagent was added in 1 mL
increments at one-minute intervals, mixing tubes by inversion after each addition, for color
development. The final reagent, stable was prepared from mixing the phosphorus premix reagent,
which is a mixture of potassium antiomonyl tartrate, antimonyl tartrate, concentrated sulfuric
acid, deionized (D.I.) water, and ascorbic acid. The tubes were then let to stand at room
temperature for 30-35 minutes to allow for full color development. A Shimadzu 1650-PC
UV/Visible light spectrophotometer was used at 885 nm to measure the concentration of ortho-
phosphate in water samples in a 10-cm path length plastic cuvette with reagent water in the
second cuvette.
2.3.3 TOTAL NITROGEN (TN) AND TOTAL DISSOLVED NITROGEN (TDN)
ANALYSIS
Standard Methods 4500-NO3- (b). was used in the analysis of water samples for TN and
TDN 36. In this method, alkaline-persulfate digestion is used to convert all inorganic and organic
nitrogenous compounds to nitrate. Nitrogen concentrations are then determined by

13
spectrophotometric analysis with a Shimadzu 1650-PC UV/Visible light spectrophotometer at
two wavelengths, 220 nm and 275 nm. For each sample, 30 mL of either whole water sample
(for TN) or filtered water (for TDN) was mixed with 7.5 mL of a 20 g/L potassium persulfate
solution and 0.75 mL of a 6 N sodium hydroxide solution in acid-cleaned 55 mL Pyrex tubes.
The samples were then autoclaved for 45 minutes at 121 °C and 15 psi. Before
spectrophotometer analysis, the autoclaved samples were acidified with 0.75 ml of 7N
hydrochloric acid.
2.3.4 STATISTICAL ANALYSIS
Due to the presence of particularly high or low numbers, median values were used to
represent central tendencies of the data rather than the mean. Statistical analyses were performed
using R version 3.3.1 for Macintosh. To avoid the assumption of normally distributed data, non-
parametric tests were used for statistical analyses. The two-sample Wilcoxon test, also known as
the Mann-Whitney test, with a significance level of 95% (p =0.05) was used to check for
significant differences between median values in the influent and effluent water samples from
the wetlands, and in the upstream and downstream, and upstream and outfall water samples from
the stream samples. A one-sample Wilcoxon test with a significance level of 95% (p =0.05) was
used to estimate whether the median relative differences between paired upstream and
downstream samples were significantly different from zero. Due to the presence of ties in most
of datasets, which are not allowed by the R statistical package, adjustments were made to ties to
process them for nonparametric statistical analysis. Tied values were adjusted by
adding/subtracting a tenth of the significant digit (i.e. 0.13, 0.13 and 0.13 mg-N/L were adjusted
to 0.131, 0.13 and 0.132 mg-N/L) without changing the overall distribution. Some samples
demonstrated results that were below detection limits, especially for dissolved nitrogen and

14
phosphorus in 2014, and those were assigned values that were half of the lowest calibration
standard for nitrogen and phosphorus analysis, after a thorough review of all standard curves. For
TSS, a value of 5 mg/L was assigned to those samples with below detection limit results.
15
3 RESULTS AND DISCUSSION
3.1 NITROGEN IN TOT RUNOFF
During the two-year study period, each site’s tile outlet terrace was responsible for
approximately 99.5, 71.2 and 197.7 kg of TN entering the wetlands for sites 1, 2 and 3,
respectively, of which 67.7, 59.3, and 93.8 kg exited the system in the wetland effluent (Table 1).
Overall, the majority of the load that drained into the wetlands occurred in 2015, rather than in
2014, due to delayed sampling and consequently fewer number of samples obtained in the first
year of the study.
Concentrations of TN in TOT runoff, or wetland inflow, from 2014 and 2015 are shown
in boxplots (Figure 5). The boxes indicate the middle 50 percent of the data, the line in the box
marks the median, error bars show full data range, and the asterisks points out significant
differences between 2014 and 2015 data at each site (Figure 5). For example, the median
concentrations of TN at site 1 were 3.1 mg-N/L and 7.6 mg-N/L in 2014 and 2015, respectively,
and the difference between the two values was significant (p = 0.01) (Figure 5). Likewise,
significant increases in incoming TN were observed at site 2 and site 3, from 1.8 to 9.1 mg-N/L
(p < 0.001) and 3.1 to 4.2 mg-N/L (p = 0.046), respectively. This significant increase in TN can
be traced to application of fertilizer prior to planting in 2015 and a consequent increase in total
dissolved nitrogen, which will be discussed further in the following paragraph.
In 2015, total dissolved nitrogen (TDN) was analyzed along with TN whereas, in 2014,
only dissolved nitrite and dissolved nitrate were individually measured. Dissolved nitrite and
nitrate concentrations were no longer measured in 2015 because they were found to be below
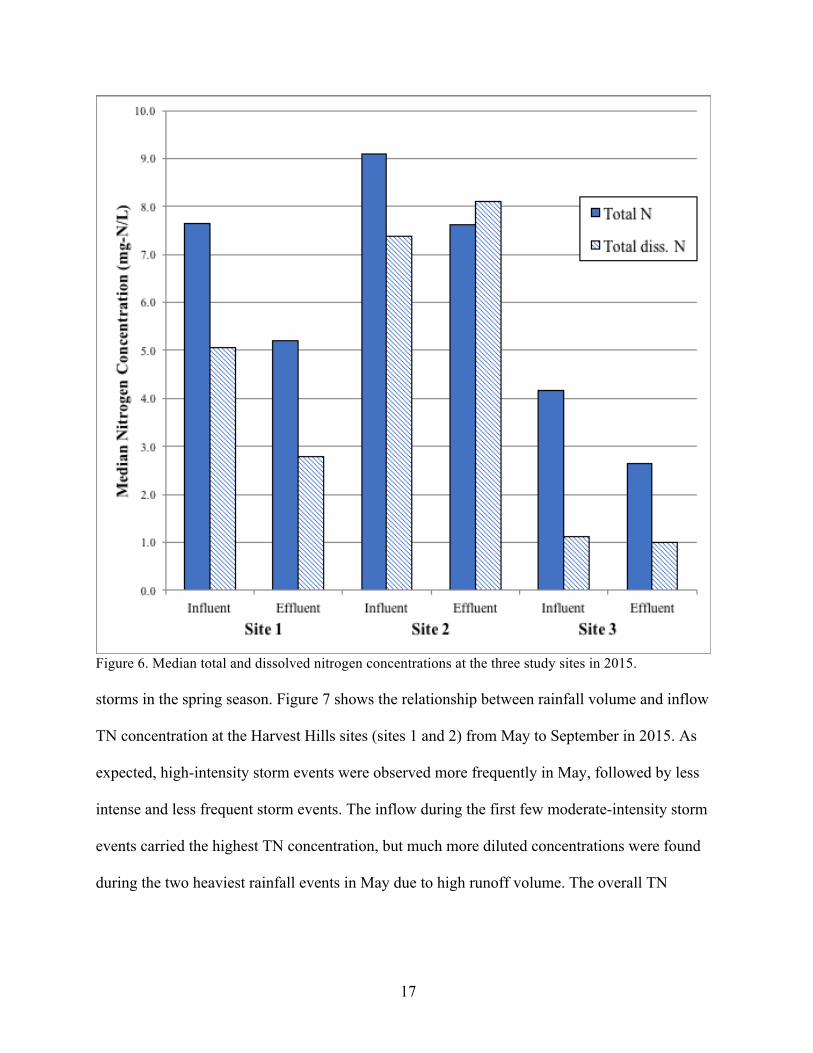
detection limit in most samples in 2014. The median dissolved nitrogen percentage in the
influent was 71% at site 1, 76% at site 2 and 25% at site 3, found by dividing TDN by TN.

16
Dissolved fraction values were not calculated for dissolved data from 2014. Higher fractions of
influent dissolved nitrogen at the two Harvest Hills sites, compared to that at Cain site, are
believed to be from the application of higher levels of nitrogen prior to planting corn than
soybeans (Figure 6). By contrast, no nitrate fertilizer was applied to the Cain site in either year.
This suggests that the major dissolved nitrogen source was fertilizer and that there was
background dissolved nitrogen in the runoff possibly from erosion and soil mineralization 37.
Figure 5. Influent TN concentrations in 2014 and 2015.
Inflow TN pattern. Pollutant loadings from croplands are event driven 28 and
depends on the frequency and intensity of intermittent storm events, runoff volume, peak
discharge, and pollutant mobilization can be controlled 28,38. Similarly, our wetlands experienced
higher runoff volume and pollutant loading as a response to more frequent, more high-intensity
17
Figure 6. Median total and dissolved nitrogen concentrations at the three study sites in 2015. storms in the spring season. Figure 7 shows the relationship between rainfall volume and inflow
TN concentration at the Harvest Hills sites (sites 1 and 2) from May to September in 2015. As
expected, high-intensity storm events were observed more frequently in May, followed by less
intense and less frequent storm events. The inflow during the first few moderate-intensity storm
events carried the highest TN concentration, but much more diluted concentrations were found
during the two heaviest rainfall events in May due to high runoff volume. The overall TN

18
concentration decrease from spring to fall (Figure 7) because of the N-based fertilizer application
timing, which was most likely in spring of 2015.
Figure 7. Relationship between rainfall volume and inflow TN concentration at Harvest Hills sites in
2015. 3.2 PHOSPHORUS AND TOTAL SUSPENDED SOLIDS IN TOT RUNOFF
Similar to inflow TN concentrations, inflow concentrations of TP into each wetland
showed significant increases from 2014 to 2015 (Figure 8). In 2014, the median inflow TP
concentrations were 0.37, 0.20 and 0.34 mg-P/L at site 1, site 2 and site 3, respectively. In 2015,
all median inflow TP concentrations were elevated at 0.80, 0.86 and 1.07 mg-P/L. The increase
in phosphorus from 2014 to 2015 at sites 1 and 2 was potentially due to higher fertilizer
application rates in Fall 2014 (assumed to be approximately 58 lb/ac based on similar application
as the Haase site) compared to 2013 (35 lb/ac) at sites 1 and 2, and late crop planting at site 3. In
0
10
20
30
40
50
60
0
2
4
6
8
10
12
14
16
18
Apr May Jun Aug Sep Oct
Rainfall V
olume (ac-in)
Tot
al N
Con
cent
ratio
n (m
g-N
/L)
Precipitation Site 1 Site 2

19
2015, delayed crop planting, coupled with high-intensity storm events in May, likely resulted in
higher sediment erosion. Phosphorus (P) in agricultural runoff is known to correlate to sediment
in runoff since phosphorus found in runoff is mostly particulate rather than dissolved P 39-42.
Thus, the elevated TP concentration in 2015 was likely from the increased sediment erosion due
to late crop planting, along with higher fertilizer application rates. The patterns of median
influent TP and TSS concentrations were similar in 2014 and 2015 (Figure 8 and Figure 9). The
only exception was that no significant difference was observed between the median influent TSS
concentrations in 2014 and 2015 at site 1 (Figure 9).
Generally, site 2 received runoff with lower TSS concentration than site 1 and site 3 did.
This difference contradicts the expectation that sites 1 and 2 will receive similar quality inflow,
given that the two sites were almost identical in wetland design, contributing drainage area
(CDA) and crop cover. One possible reason for the difference can be traced to an exposed riser
on the second terrace at site 1, which caused more sediments, and thus more particulate nitrogen
and phosphorus in runoff. For this reason, total soil loss from a plot covered with soybeans both
years (site 3) and that from a plot covered with winter wheat then soybeans in 2014 and corn in
2015 (site 1 and 2) should be compared using data from sites 2 and 3 only. In both years, site 3
with soybean coverage and residue yielded higher soil loss, which lead to an observation of
higher inflow TSS concentration into the wetland (Figure 9). This occurrence, in which sediment
concentration is greater, sometimes even statistically significant, from a system with soybean
residue than that with corn residue, was observed in other studies, and was explained by the
extent of surface coverage of residue, in conjunction with tillage system and other factors
including erodibility factor, and slope 43,44.
As stated above, TP concentration in runoff are known to correlate to sediment

20
Figure 8. Influent TP concentrations in 2014 and 2015
Figure 9. Influent TSS concentrations in 2014 and 2015

21
concentration in runoff. In this study, inflow TP significantly correlated with TSS (n = 64, R =
0.75, p < 0.001), when any data points with TSS concentrations of 10 mg/L or below were
excluded. In 2015, dissolved P concentrations were less than 0.30 mg-P/L at all three study sites’
wetland influent whereas total P concentrations were equal to or greater than 0.80 mg-P/L
(Figure 10). Similar to median TDN in influent, median influent TDP was the highest at site 2,
followed by site 1 and site 3.
Figure 10. Median total and dissolved phosphorus concentrations at the three study sites in 2015.

22
3.3 PERFORMANCE OF WETLANDS IN CONSTITUENT REMOVAL
Overall, contaminant removal in the three wetlands varied greatly from 2014 to 2015
(Table 1). Median inflow and outflow values of TN and TP were calculated using all measured
values, whereas the concentration removal efficiency (CRE) values for each wetland were
calculated using differences between paired inflow and outflow concentrations from individual
storm events. The load removal efficiency (LRE) and areal removal rate were calculated
differently, using the following equation:
The summation of loads in and out of the wetlands included all values with available flow data
(flow volume) and concentration data over the indicated sampling period. Then, the difference
between the two summation values was used to calculate the LRE. This approach incorporates
storm events for which there was runoff to the wetlands, but no effluent flow from them.
CRE was generally higher in 2015 than that in 2014, with the exception of TN at site 1
and TSS at site 3. At site 1, the CRE value of TN was potentially affected by the data collected
from 5/7/15 to 5/14/15, during which no flow data was available for two of the four collections.
These missing flow data could imply that the outflow from site 1 at the time period were not
resulting from the inflow, but rather from standing water that may be higher in nutrient
concentration. At site 3, the number of samples collected during 2014 was very low (n = 3),
which inhibits statistical analysis, so comparing the median CRE from those to that from 2015 (n
= 10) could have skewed the result. Other than those, the increase in CRE from 2014 to 2015
corresponded to the increase in inflow concentrations of TN, TP and TSS at all three study sites.
In addition, the overall increase was not unexpected due to potentially higher plant coverage,
!"# = !%&'() − !%&'+,-!%&'() ×100%

23
which slows the flow and increases the retention time 45,46, and higher organic matter, which
increases the denitrification process 3.
At site 1, the median TN CRE values were 8% in 2014, 28% in 2015, and 19% over both
years (Table 1). Individual wetlands varied in performance in terms of CRE and site 2, especially,
performed poorly compared to the other sites (Table 1). Possible reasons for this poor
performance at site 2 are discussed below. TN load inputs ranged from 5.8 to 21.7 kg N in the
2014 growing season (June – October), and 68.4 to 182.0 kg N in the 2015 growing season (May
– November) (Table 1). The median TN outputs, which ranged from 1.8 to 8.8 kg N in 2014 and
from 57.5 to 85.1 kg N in 2015, were lower than median inputs at all sites and in both years.
During the 2-year period, site 3 received the greatest TN load and exhibited the highest load
removal efficiency (LRE) of 53% as well as the highest CRE of 38%. In a previous study, three
other constructed wetlands demonstrated TN removal of 37% of the overall 4639 kg N during
the three-year study period 28, compared to 27% of an overall 369 kg N during the two-year
study period here.
In this study, total nitrogen removal, as well as total phosphorus and total suspended
solids removal, were calculated considering outlet surface flow as the only outflow from the
wetland. It was observed in previous studies that the extent of highly mobile total nitrogen (NO3-
N) removal via seepage flow may account for up to 33%, depending on flow volume, wetland
capacity and soil type and condition 28. A high inflow volume that exceeds the wetland capacity
during pulse flow events may result in rapid flow and thus much less seepage 28. Nevertheless,
consideration of combination of seepage and outlet flow in the NO3-N budget was not evaluated
in this study, although it will likely change the overall values of TN removal if seepage is
significant as observed elsewhere 47.

24
Unlike with TN, all three wetlands have been shown to function as sources of TP, usually
when the inflow concentration was equal to or below 0.17 mg-P/L. These constructed wetlands
performed very much in agreement with an the irreducible TP concentration of 0.2 mg-P/L, as
suggested by Schueler 48 . The two largest negative removals occurred at site 1 in 2014 only, of
which the -118% removal took place the day after the first heavy rainfall in June of 2014. In
2015, negative removal was seen only once at site 2 in September. Similar to the correlation
found between inflow TP and TSS concentrations, the removal of TP and TSS in the wetlands
were significantly correlated (R = 0.95, p < 0.0001).
Table 1. Summary of inflow and outflow concentrations, total loading, concentration removal efficiency (CRE), load removal efficiency and areal removal rate of TN and TP.
NOTE: Not all parameters were calculated using the same datasets; details on what data were used for
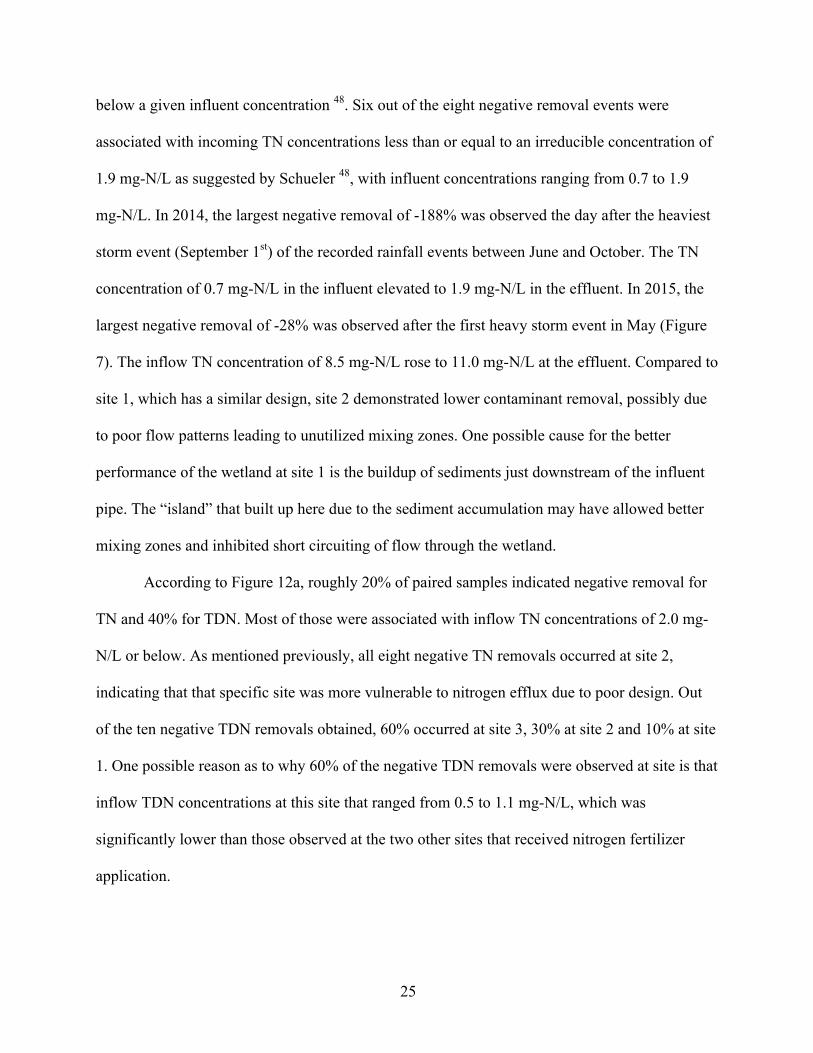
each are summarized in the beginning of Section 3.3. Negative removals (or source). Negative removals of constituents of interest were
sometimes observed, which are shown as red and yellow triangles in figures 11 a-d. For TN,
negative removals were observed after eight separate rainfall events at site 2 only, of which five
occurred in 2014 (red) and the rest in 2015 (yellow) (Figure 11c). The irreducible concentration
concept assumes that a given best management practice (BMP) cannot reliably remove pollutants
25
below a given influent concentration 48. Six out of the eight negative removal events were
associated with incoming TN concentrations less than or equal to an irreducible concentration of
1.9 mg-N/L as suggested by Schueler 48, with influent concentrations ranging from 0.7 to 1.9
mg-N/L. In 2014, the largest negative removal of -188% was observed the day after the heaviest
storm event (September 1st) of the recorded rainfall events between June and October. The TN
concentration of 0.7 mg-N/L in the influent elevated to 1.9 mg-N/L in the effluent. In 2015, the
largest negative removal of -28% was observed after the first heavy storm event in May (Figure
7). The inflow TN concentration of 8.5 mg-N/L rose to 11.0 mg-N/L at the effluent. Compared to
site 1, which has a similar design, site 2 demonstrated lower contaminant removal, possibly due
to poor flow patterns leading to unutilized mixing zones. One possible cause for the better
performance of the wetland at site 1 is the buildup of sediments just downstream of the influent
pipe. The “island” that built up here due to the sediment accumulation may have allowed better
mixing zones and inhibited short circuiting of flow through the wetland.
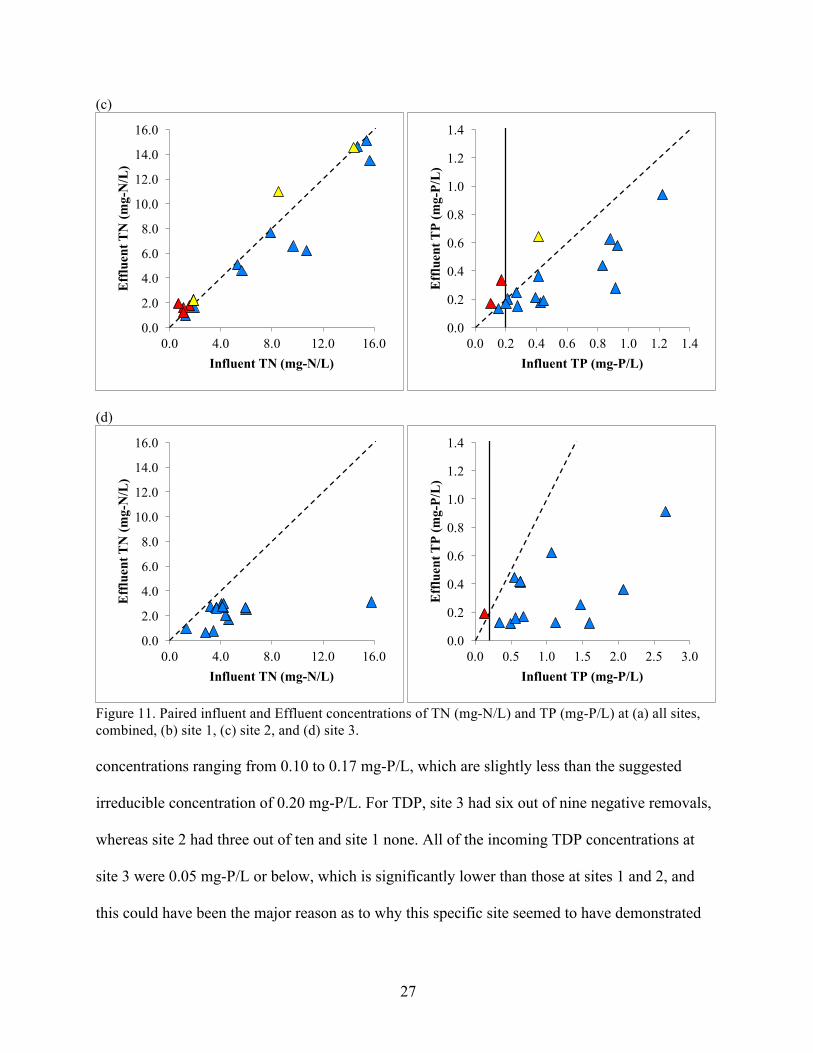
According to Figure 12a, roughly 20% of paired samples indicated negative removal for
TN and 40% for TDN. Most of those were associated with inflow TN concentrations of 2.0 mg-
N/L or below. As mentioned previously, all eight negative TN removals occurred at site 2,
indicating that that specific site was more vulnerable to nitrogen efflux due to poor design. Out
of the ten negative TDN removals obtained, 60% occurred at site 3, 30% at site 2 and 10% at site
1. One possible reason as to why 60% of the negative TDN removals were observed at site is that
inflow TDN concentrations at this site that ranged from 0.5 to 1.1 mg-N/L, which was
significantly lower than those observed at the two other sites that received nitrogen fertilizer
application.

26
Approximately 15% of paired samples demonstrated negative removal for TP and just
under 40% for TDP (Figure 12b). Except for the one event with an influent TP concentration of
0.42 mg-P/L (Figure 11c), all storm events with negative removal were associated with influent
(a)
(b)
0.0
2.0
4.0
6.0
8.0
10.0
12.0
14.0
16.0
0.0 4.0 8.0 12.0 16.0
Efflu
entT
N(m
g-N/L)
InfluentTN(mg-N/L)
0.0
0.2
0.4
0.6
0.8
1.0
1.2
1.4
0.0 0.5 1.0 1.5 2.0 2.5 3.0
Efflu
entT
P(m
g-P/L)
InfluentTP(mg-P/L)
0.0
2.0
4.0
6.0
8.0
10.0
12.0
14.0
16.0
0.0 4.0 8.0 12.0 16.0
Eff
luen
t TN
(mg-
N/L
)
Influent TN (mg-N/L)
0.0
0.2
0.4
0.6
0.8
1.0
1.2
1.4
0.0 0.2 0.4 0.6 0.8 1.0 1.2 1.4
Eff
luen
t TP
(mg-
P/L
)
Influent TP (mg-P/L)
27
(c)
(d)
Figure 11. Paired influent and Effluent concentrations of TN (mg-N/L) and TP (mg-P/L) at (a) all sites, combined, (b) site 1, (c) site 2, and (d) site 3. concentrations ranging from 0.10 to 0.17 mg-P/L, which are slightly less than the suggested
irreducible concentration of 0.20 mg-P/L. For TDP, site 3 had six out of nine negative removals,
whereas site 2 had three out of ten and site 1 none. All of the incoming TDP concentrations at
site 3 were 0.05 mg-P/L or below, which is significantly lower than those at sites 1 and 2, and
this could have been the major reason as to why this specific site seemed to have demonstrated
0.0
2.0
4.0
6.0
8.0
10.0
12.0
14.0
16.0
0.0 4.0 8.0 12.0 16.0
Eff
luen
t TN
(mg-
N/L
)
Influent TN (mg-N/L)
0.0
0.2
0.4
0.6
0.8
1.0
1.2
1.4
0.0 0.2 0.4 0.6 0.8 1.0 1.2 1.4
Eff
luen
t TP
(mg-
P/L
)
Influent TP (mg-P/L)
0.0
2.0
4.0
6.0
8.0
10.0
12.0
14.0
16.0
0.0 4.0 8.0 12.0 16.0
Eff
luen
t TN
(mg-
N/L
)
Influent TN (mg-N/L)
0.0
0.2
0.4
0.6
0.8
1.0
1.2
1.4
0.0 0.5 1.0 1.5 2.0 2.5 3.0
Eff
luen
t TP
(mg-
P/L
)
Influent TP (mg-P/L)
28
poor removal. At site 2, the TDP concentrations in the influent samples were relatively high but
all three paired samples that were collected between late May and mid-June demonstrated
negative TDP removals.
(a) (b)
Figure 12. Range of percent removal and associated inflow concentrations of (a) TN, TDN and TSS, and (b) TP, TDP and TSS. Note that the unit of inflow TSS concentrations is mg/L * 102. 3.4 STREAM MONITORING RESULTS
The range of TN, TP and TSS concentrations in the Haase site and Cain site stream
samples are shown in Figure 13. At the Haase outfall discharge point, the median concentrations
of TN and TP were 6.5 mg-N/L and 0.93 mg-P/L, respectively (Figure 13 a-b). At the Cain
outfall, the concentrations of TN and TP were more than 50% lower, with 3.0 mg-N/L (n = 24)
and 0.48 mg-P/L (n = 22), respectively (Figure 13 a-b). Although the nutrient concentrations
were lower at the Cain outfall, TSS concentrations were significantly higher at Cain with 315
mg/L compared to Haase with 248 mg/L. This discrepancy may be due to already significantly
higher TSS concentrations (p = 0.02) at the Cain upstream location compared to the Haase
upstream sampling point. While nutrient and TSS concentrations had a wide range at both sites,
the median downstream concentrations at the downstream of Cain site were lower than those at
the upstream. At Haase, the median concentrations of TP and TSS were equal in the downstream

29
and upstream samples. Median TN concentrations downstream (3.4 mg-N/L) were only slightly
higher than that those upstream (3.3 mg-N/L), even though the median outfall TN concentration
was 97% higher.
Stream water concentrations of TN, TP and TSS differed substantially between 2014 and
2015 (Figure 14), with upstream concentrations higher by 71, 44 and 131% in the second year.
This increase in stream concentration values, especially TSS, can be traced to precipitation
pattern, frequency and intensity. During these two years, the heaviest rainfall event occurred in
September of 2014 (3.72 inches) followed by June in 2014 (3.36 inches) and June of 2015 (3.16
inches). High intensity storms in the early spring may have disturbed the streambed and acted as
a driving force for erosion of sediments. However, it is also possible that the stream samples
collected a mixture of both suspended solids and larger sediments that are less likely to be
carried long distance (bedload sediments). In an attempt to adjust for this effect, bottles were
installed at different heights at each sampling sites, one higher (closer to water surface) and the
other lower (closer to streambed). No significant differences were observed between high and
low samples, and it is possible that both high and low samples were affected by bedload
sediment transport.
Haase Outfall Analysis Results. The Haase outfall samples also showed a difference in
water quality from year to year. The TSS concentration values increased, similar to the other
stream samples, from 155 to 250 mg/L. However, TN and TP concentrations decreased from
10.1 to 5.6 mg-N/L and from 1.04 to 0.90 mg-P/L, respectively. This is in contrasts to the TOT
runoff quality results from the wetland sites, where nutrients increased from 2014 to 2015.
However, the crop rotation at the Haase site, with corn in 2014 and soybeans in 2015, was the
opposite of the Harvest Hills sites. This further demonstrates that the crop type plays a

30
(a)
(b)
(c)
Figure 13. Stream sample concentrations of (a) total nitrogen (TN), (b) total phosphorus (TP) and (c) total suspended solids (TSS) at the Haase and Cain sites.
0.01
0.1
1
10
Tota
l Pho
spho
rus C
once
ntra
tion
(mg-
P/L
)
u/s d/s outfall u/s d/s outfallHaase Cain
(n=21) (n=24) (n=29) (n=20) (n=22) (n=22)
1
10
100
1000
10000
100000
TSS
Con
cent
ratio
n (m
g/L
)
u/s d/s outfall u/s d/s outfall
Haase Cain
(n=22) (n=61) (n=37) (n=21) (n=23) (n=20)

31
significant role in determining runoff water quality, especially nutrients and sediments, because
of difference in fertilizer application rates and in soil cover levels.
Figure 14. Upstream TN, TP and TSS concentration values at Haase and Cain site streams in 2014 (solid) and 2015 (striped).
Impact of Agricultural Runoff on Stream Quality. The wide range of concentration values
observed for nutrients and solids may hinder our assessment of any impact of agricultural runoff
on receiving stream quality. To determine whether there was any measurable impact of either
untreated or treated runoff discharge on stream quality, median relative difference value was
calculated over the whole data set for TN, TP and TSS at each site. Then, the one-sample
Wilcoxon Signed-Rank test was used to determine if the median values were significantly
different from zero. A positive relative difference would indicate a higher downstream
concentration, and a negative value a lower downstream concentration. (Zero indicates no
difference.)
The relative differences and confidence intervals are shown in Figure 15. All median
values were below zero, which indicates lower concentrations downstream relative to the
upstream sample point. However, confidence intervals for all parameters include zero, showing

32
that the difference is not statistically significant. Thus, concentrations of TSS, TN and TP in the
two streams showed no consistent change due to either the wetland effluent (Cain site) or the
TOT runoff (Haase site). As discussed above, the concentrations entering the streams at the
discharge were generally higher, although not significantly, than upstream or downstream values.
It may be that the volume of runoff discharge entering the streams is small compared to the
stream flow, so any impact would be rapidly diluted out. Another possible reason may be the
method of sample collection, which may have collected only the early portion of storm runoff.
Collecting samples over a longer period during and after a storm event may show a greater
impact of discharge on water quality.
Figure 15. Relative differences between upstream and downstream water quality parameters in the at Haase and Cain streams.

33
4 CONCLUSIONS
The use of constructed wetlands to treat tile drainage runoff demonstrated a positive
removal efficiency in the 2-year study for TSS, TN and TP. The TOT runoff from the three sites
(and at the Haase outfall) contained elevated concentrations of nitrogen, phosphorus and
suspended solids compared to benchmark or typically observed values for surface waters in the
state of Kansas. Benchmark values for streams in EPA Region 7 are 0.9 mg/L for TN and 0.075
mg/L for TP 49. Late crop planting coupled with earlier, high-intensity storm events were seen to
negatively affect agricultural runoff quality, especially for TSS in runoff, and higher fertilizer
application rates coupled with moderate-intensity storm events were shown to significantly
elevate levels of TN and TP, particularly with dissolved species of N and P.
For wetland performance, higher influent concentrations typically resulted in better
removal efficiencies, although the wetland design and inflow volume played an important role,
as well. The difference in wetland performance between sites 1 and 2, which had similar design,
CDA, and quality and volume of inflow, may be due to the high sediment loading and
consequent development of a sediment bed near the TOT influent discharge location in wetland 1,
causing better flow distribution. Other potential factors contributing to the performance
differences of the three wetlands were wetland seepage rates and extent of vegetation
establishment. Analysis of adjacent streams receiving treated (wetland effluent) and untreated
(direct) TOT runoff suggest no measurable direct impact of the runoff on stream quality.
However, the median wetland influent concentrations were higher than those in the stream
samples, and the stream values were higher than reference values for Kansas streams and rivers
to begin with. The results demonstrate the reduction of nutrients in agricultural TOT runoff in the
wetlands, and hence the use of constructed wetlands is suggested to improve the quality of

34
receiving waterbodies. A further assessment of constructed wetlands is suggested for future
studies, through more frequent water collection throughout the year, not just during the growing
season, to understand performance under various weather conditions, and through better
knowledge of other important factors including hydrology and vegetation. Through more
frequent field data collection in combination with modeling studies, determination of important
wetland design parameters could be achieved and, consequently, will lead to a better design of
future guidelines for treatment wetlands.

35
5 REFERENCES 1 U.S. EPA. National Water Quality Inventory: Report to Congress. (Tech. rep.,
Washington, DC: Environmental Protection Agency, Washington, DC, 2009).
2 Baker, L. A. Introduction to nonpoint source pollution in the United States and prospects for wetland use. Ecological Engineering 1, 1-26 (1992).
3 Fink, D. F. & Mitsch, W. J. Seasonal and storm event nutrient removal by a created wetland in an agricultural watershed. Ecological Engineering 23, 313-325 (2004).
4 Kadlec, R. H. & Wallace, S. Treatment wetlands. (CRC press, 2008).
5 Ribaudo, M. O., Heimlich, R., Claassen, R. & Peters, M. Least-cost management of nonpoint source pollution: source reduction versus interception strategies for controlling nitrogen loss in the Mississippi Basin. Ecological Economics 37, 183-197 (2001).
6 Smith, D. et al. Nutrient losses from row crop agriculture in Indiana. Journal of Soil and Water Conservation 63, 396-409 (2008).
7 Pavelis, G. A. Farm drainage in the United States: History, status, and prospects. (US Department of Agriculture, Economic Research Service, 1987).
8 Edward F. Peltier, C. B. Y., LlynnAnn Luellen, Hyunjung Lee. Monitoring effectiveness of tile outlet terrace fields with constructed wetlands for sediment, nutrient, and volume reduction in Northeastern Kansas. Report No. [Draft Version], (Topeka, KS, 2016).
9 Kladivko, E., Grochulska, J., Turco, R., Van Scoyoc, G. & Eigel, J. Pesticide and nitrate transport into subsurface tile drains of different spacings. Journal of Environmental Quality 28, 997-1004 (1999).
10 Royer, T. V., David, M. B. & Gentry, L. E. Timing of riverine export of nitrate and phosphorus from agricultural watersheds in Illinois: Implications for reducing nutrient loading to the Mississippi River. Environmental Science & Technology 40, 4126-4131 (2006).
11 David, M. B., Drinkwater, L. E. & McIsaac, G. F. Sources of nitrate yields in the Mississippi River Basin. Journal of Environmental Quality 39, 1657-1667 (2010).
12 Hatfield, J., McMullen, L. & Jones, C. Nitrate-nitrogen patterns in the Raccoon River Basin related to agricultural practices. Journal of soil and water conservation 64, 190-199 (2009).
13 Algoazany, A., Kalita, P., Czapar, G. & Mitchell, J. Phosphorus transport through subsurface drainage and surface runoff from a flat watershed in east central Illinois, USA. Journal of environmental quality 36, 681-693 (2007).

36
14 King, K. W. et al. Phosphorus transport in agricultural subsurface drainage: A review. Journal of environmental quality 44, 467-485 (2015).
15 Zimmer, D., Kahle, P. & Baum, C. Loss of soil phosphorus by tile drains during storm events. Agricultural Water Management 167, 21-28 (2016).
16 Jaynes, D., Colvin, T., Karlen, D., Cambardella, C. & Meek, D. Nitrate loss in subsurface drainage as affected by nitrogen fertilizer rate. Journal of Environmental Quality 30, 1305-1314 (2001).
17 Bakhsh, A. et al. Cropping system effects on NO3–N loss with subsurface drainage water. Transactions of the ASAE 45, 1789 (2002).
18 Bjorneberg, D. L., Karlen, D. L., Kanwar, R. S. & Cambardella, C. A. Alternative N fertilizer management strategies effects on subsurface drain effluent and N uptake. Applied engineering in agriculture 14, 469-473 (1998).
19 Kladivko, E. et al. Nitrate leaching to subsurface drains as affected by drain spacing and changes in crop production system. Journal of Environmental Quality 33, 1803-1813 (2004).
20 Kanwar, R. S., Colvin, T. S. & Karlen, D. L. Ridge, moldboard, chisel, and no-till effects on tile water quality beneath two cropping systems. Journal of Production Agriculture 10, 227-234 (1997).
21 Bakhsh, A. et al. Tillage and nitrogen management effects on crop yield and residual soil nitrate. Transactions of the ASAE 43, 1589 (2000).
22 Jaynes, D., Hatfield, J. & Meek, D. Water quality in Walnut Creek watershed: Herbicides and nitrate in surface waters. Journal of environmental quality 28, 45-59 (1999).
23 Kanwar, R. S., Baker, J. L. & Baker, D. Tillage and split N-fertilization effects on subsurface drainage water quality and crop yields. Transactions of the ASAE 31, 453-0461 (1988).
24 Mississippi River Gulf of Mexico Watershed Nutrient Task Force. Gulf Hypoxia Action Plan 2008. (2008).
25 Sprague, L. A., Hirsch, R. M. & Aulenbach, B. T. Nitrate in the Mississippi River and its tributaries, 1980 to 2008: Are we making progress? Environmental Science & Technology 45, 7209-7216 (2011).
26 David, M. B. et al. Biophysical and social barriers restrict water quality improvements in the Mississippi River basin. Environmental science & technology 47, 11928-11929 (2013).
27 Sprague, L. A., Mueller, D. K., Schwarz, G. E. & Lorenz, D. L. Nutrient Trends in Streams and Rivers of the United States, 1993-2003. (U. S. Geological Survey, 2009).

37
28 Kovacic, D. A., David, M. B., Gentry, L. E., Starks, K. M. & Cooke, R. A. Effectiveness of constructed wetlands in reducing nitrogen and phosphorus export from agricultural tile drainage. Journal of environmental quality 29, 1262-1274 (2000).
29 Reinelt, L. E. & Horner, R. R. Pollutant removal from stormwater runoff by palustrine wetlands based on comprehensive budgets. Ecological Engineering 4, 77-97 (1995).
30 Rushton, B., Miller, C., Hull, C. & Cunningham, J. in Proceedings of the Fourth Biennial Stormwater Research Conference, Clearwater Beach, FL.
31 Groh, T. A., Gentry, L. E. & David, M. B. Nitrogen removal and greenhouse gas emissions from constructed wetlands receiving tile drainage water. Journal of environmental quality 44, 1001-1010 (2015).
32 Hoagland, C. R., Gentry, L. E., David, M. B. & Kovacic, D. A. Plant nutrient uptake and biomass accumulation in a constructed wetland. Journal of Freshwater Ecology 16, 527-540 (2001).
33 KDHE. Upper Wakarusa Watershed Restoration and Protection Strategy: Nine Element Plan. (Kansas Dept. of Health and Environment, Topeka, KS, 2011).
34 KWO. A long-term vision for the future of water supply in Kansas. (Kansas Water Office, Topeka, KS, 2015).
35 NOAA. NOAA Online Weather Data (NOWData). (2014).
36 Federation, W. E. & Association, A. P. H. Standard methods for the examination of water and wastewater. American Public Health Association (APHA): Washington, DC, USA (2005).
37 Kumar, K. & Goh, K. Crop residues and management practices: effects on soil quality, soil nitrogen dynamics, crop yield, and nitrogen recovery. Advances in Agronomy 68, 197-319 (1999).
38 Vigon, B. W. The Status of Nonpoint Source Pollution: Its Nature, Exten and Control 1. JAWRA Journal of the American Water Resources Association 21, 179-184, doi:10.1111/j.1752-1688.1985.tb00127.x (1985).
39 Heathwaite, A. & Dils, R. Characterising phosphorus loss in surface and subsurface hydrological pathways. Science of the Total Environment 251, 523-538 (2000).
40 McDowell, R. & Sharpley, A. Approximating phosphorus release from soils to surface runoff and subsurface drainage. Journal of environmental quality 30, 508-520 (2001).
41 Steegen, A. et al. Factors controlling sediment and phosphorus export from two Belgian agricultural catchments. Journal of Environmental Quality 30, 1249-1258 (2001).

38
42 McDowell, R., Sharpley, A., Condron, L., Haygarth, P. & Brookes, P. Processes controlling soil phosphorus release to runoff and implications for agricultural management. Nutrient Cycling in Agroecosystems 59, 269-284 (2001).
43 Dickey, E. C., Shelton, D. P., Jasa, P. J. & Peterson, T. R. Soil erosion from tillage systems used in soybean and corn residues. Transactions of the ASAE 28, 1124-1130 (1985).
44 Ghidey, F. & Alberts, E. Runoff and soil losses as affected by corn and soybean tillage systems. Journal of Soil and Water Conservation 53, 64-70 (1998).
45 Sabokrouhiyeh, N., Bottacin-Busolin, A., Nepf, H. & Marion, A. in Hydrodynamic and Mass Transport at Freshwater Aquatic Interfaces: 34th International School of Hydraulics (eds Paweł M. Rowiński & Andrea Marion) 101-113 (Springer International Publishing, 2016).
46 Jadhav, R. S. & Buchberger, S. G. Effects of vegetation on flow through free water surface wetlands. Ecological Engineering 5, 481-496 (1995).
47 Hey, D. L., Kenimer, A. L. & Barrett, K. R. Water quality improvement by four experimental wetlands. Ecological Engineering 3, 381-397 (1994).
48 Schueler, T. Irreducible pollutant concentrations discharged from urban BMPs. Watershed Protection Techniques 2, 369-372 (1996).
49 U.S. EPA RTAG7. Nutrient Reference Condition Identification and Ambient Water Quality Benchmark Development Process: Rivers and Streams within EPA Region 7. (USEPA RTAG7, Kansas City, KS, 2011).


![Determining the Impact of Riparian Wetlands on Nutrient ... · HydroGeoMorphic UNIT (HGMU) classification of wetlands [29], using a novel toolkit of geophysical, geochemical and](https://static.fdocuments.us/doc/165x107/5f095e0f7e708231d4267ff6/determining-the-impact-of-riparian-wetlands-on-nutrient-hydrogeomorphic-unit.jpg)