Nutrient Loadings to Utah Lake
39
Interim Report on Nutrient Loadings to Utah Lake Prepared for Jordan River, Farmington Bay & Utah Lake Water Quality Council By LaVere B. Merritt A. Woodruff Miller October 2016 Provo, Utah
Transcript of Nutrient Loadings to Utah Lake

Interim Report on
Nutrient Loadings to Utah Lake
Prepared for
Jordan River, Farmington Bay & Utah Lake
Water Quality Council
By
LaVere B. Merritt
A. Woodruff Miller
October 2016
Provo, Utah

Utah Lake Studies
i Utah Lake Nutrient Budget - 2016
TABLE OF CONTENTS
LIST OF TABLES iii
LIST OF FIGURES iv
EXECUTIVE SUMMARY 1
INTRODUCTION 2
Background 2
NUTRIENT BUDGET STUDY 3
Objectives 3
Scope 3
Time Period Simulated 4
LKSIM Modifications 4
Flowrate Values 4
Nutrient Concentrations 4
WWTP (POTW) Discharge Point Assumptions 4
LKSIM Simulations 5
RESULTS AND DISCUSSION 6
Phosphorus – Predicted Trophic Level 9
Measured Utah Lake Phosphorus Retention 11
Measured Trophic Level in Utah lake 12
Nitrogen 13
Postulated Conditions for Blue-Green Algae Blooms in Utah Lake 14
Managing Blue-Green Algae Blooms 15
CONCLUSIONS 16
REFERENCES 17
Appendix A 18

Utah Lake Studies
ii Utah Lake Nutrient Budget - 2016
Nutrient Evaluation Issues 18
Appendix B 19
Trophic State Assessment 19
Predicted Trophic State 19
Dynamic Simulation Models 20
Measured Trophic Level 20
Carlson Trophic State Model 21
Carlson Model Components 21
Appendix C 22
Appendix D – Utah Lake Major Tributary Flow Rates, Nutrient Data and Plots 32
Raw Data Acquisition 32
Data Analysis 32
Plots of Nutrients 33
Year by Year Variability 34

Utah Lake Studies
iii Utah Lake Nutrient Budget - 2016
LIST OF TABLES
Table 1. Utah Lake Inflows: Salts, Nutrients and Water Quantities for 2009 – 2013 6
Table 2. Utah Lake Nutrients Inflows and Outflows for 2009 – 2013 7
Table 3. Nutrient Loadings to Utah Lake by water year, 2009 – 2013 7
Table 4. Inflows carrying over one-half a percent of total nutrient loadings to Utah Lake, 2009 – 2013 8
Table 5. Utah Lake as Indexed in the Carlson Trophic State Index Model 13
Table C-1. Utah Lake Tributaries and Locations – Nutrient Budget Study 23
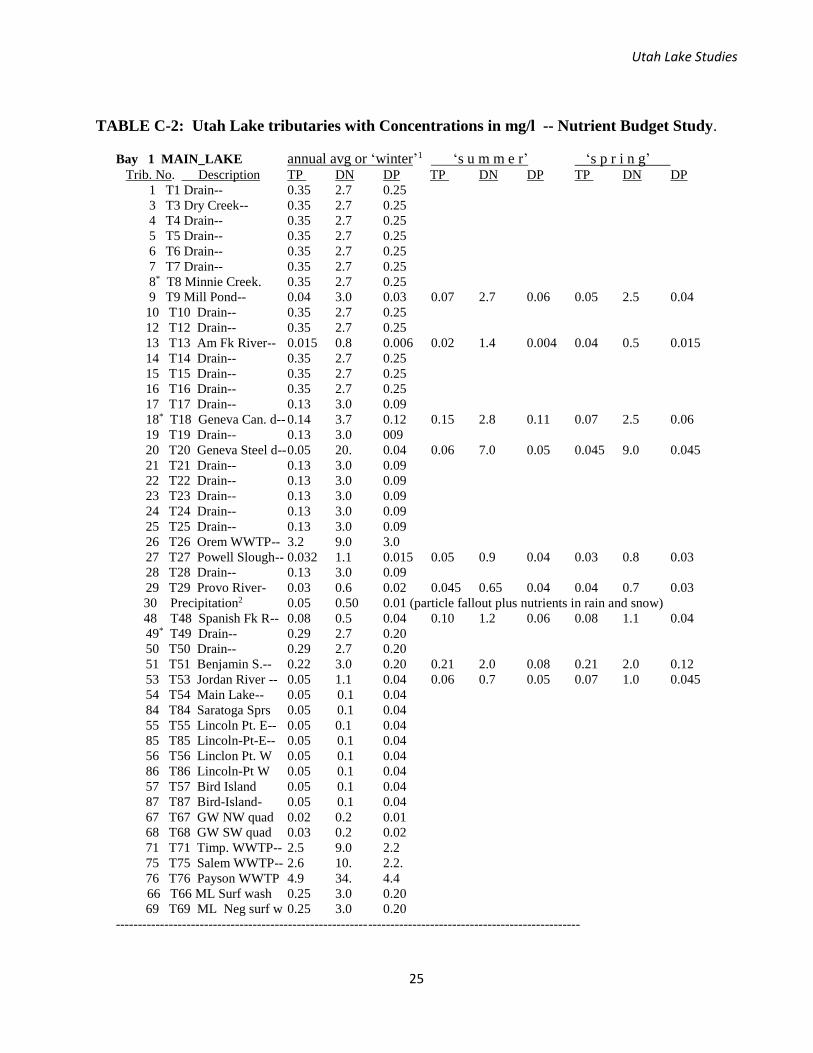
Table C-2. Utah Lake Tributaries with Concentration in mg/l – Nutrient Budget Study 25
Table C-3. Tabulation of flow and tons and percentages of salts and nutrients for 2009 – 2013
water years – results from LKSIM 27

Utah Lake Studies
iv Utah Lake Nutrient Budget - 2016
LIST OF FIGURES
Figure 1. Predicted Utah lake Trophic State – Larsen-Mercier Model 10
Figure 2. Utah Lake Locations and the Larsen-Mercier Trophic State Model 11
Figure C-1. Sampling sites and code numbers for Utah Lake sites and tributaries 22

Utah Lake Studies
1
EXECUTIVE SUMMARY
1. The phosphorus loading to Utah Lake averages 272 tons/yr for the 2009-2013 period of study,
which gives an average inflowing concentration of 634 µg /l. If one assumes the lake could be
made a phosphorus-limited lake and using phosphorus retention equations associated with the
trophic state modeling, a phosphorus retention of about 0.5 (50%) would be expected. At this 50%
point, the Larsen-Mercier Tropic State Model indicates that the loading is 15 times larger than
needed by the lakes current moderately eutrophic condition.
2. The actual phosphorus retention in the lake was found to be 0.9 (90%) which is an extremely high
retention of phosphorus. This extremely high removal is likely due to very favorable chemical
conditions for mineral precipitation of phosphorus to the bottom sediments that are largely
comprised of phosphate, calcium, carbonate and silica. These solubility equilibrium reactions,
connecting mineral phosphorus in suspension and in bottom sediments to the available phosphorus
in the water column, appear to produce in situ phosphorus concentrations that are largely
independent of the amount of phosphorus coming into the lake.
3. Nitrogen loadings show a nitrogen excess comparable to the phosphorus excess. Jointly they result
in a N/P ratio of 8:1 which normally would indicate possible nitrogen limitation vs phosphorus if
nutrients were the limiting factors in algae growth—that appears not to be the case.
4. According to the Carlson Trophic State Index model, that is based on actual in-lake measurements
and samples, the lake is moderately eutrophic, not ultra-hyper eutrophic as predicted by the
Larsen-Mercier Model. This is strong evidence that lake algae growth is not limited by nutrients,
rather most likely by the natural turbidity resulting from the large amount of mineral precipitation
in the lake (about 100,000 tons/year).
5. Again, if one assumes that phosphorus might be made limiting, according to the Larsen-Mercier
model removal of all phosphorus in Wastewater Treatment Plant discharges plus 25% of all other
sources would still leave the total annual loading some 3 to 4 times higher than needed to support
the lakes observed moderately eutrophic level. Therefore, even removal of all anthropogenic
nutrient inputs is unlikely to achieve any improvements in Utah Lake water quality, i.e., the lake
appears to naturally receive enough nutrients to support an eutrophic state even without human-
caused contributions!
6. In summary, this study strongly supports a hypothesis that the Utah Lake nutrient loadings are
irrelevant to algae growth and water quality since: (a) These are not the limiting factors to algae
growth, and cannot feasibly be reduced to growth-limiting levels. And, (b) the best hypothesis is
that low light availability caused by the lakes natural turbidity is the overall growth-limiting factor
that determines the amount of algae growth, hence biological productivity, in Utah Lake.

Utah Lake Studies
2
INTRODUCTION
Background.
Utah Lake is a remnant of Lake Bonneville that, on a geological time scale, periodically filled the Great Basin
to a depth of over 150 meters (500 ft) and extended over an area larger than any of the Great Lakes. Utah
Lake formed in the Utah Valley sub-basin when Lake Bonneville receded at the end of the most recent ice
age about 8000 years ago as the climate slowly morphed into the current global weather pattern.
Utah Lake forms the westerly border of the Lehi-Orem-Provo-Spanish Fork area in Utah Valley of Central
Utah, some 60 kilometers (35 mi) south of Salt Lake City. The lake is some 50 km (30 mi) long and 10 km (6
mi) wide and has a drainage area of about 7,500 square kilometers (2,700 sq m). When full, the lake has a
surface area of about 40,000 hectares (95,000 ac or 150 sq mi). The lake covers about one half of the Utah
Valley floor and is one of the largest freshwater lakes in the US (in surface area) west of the Great Lakes.
When full, the lakes maximum depth is about 4.3 meters (14 ft) with an average depth of 2.8 meters (9.2
ft). The lake becomes essentially dry at elevation 1364 m (4475 ft). It begins to flood low-lying lakeshore
lands when higher than compromise elevation of 1368.25 m (4489.04 ft). The lakes outlet is the Jordan
River that flows northerly some 65 km (40 mi) to the Great Salt Lake.
Utah Lake is a major physical feature and very valuable resource in Utah Valley. The lake can also be
described as a shallow, turbid, slightly-saline, eutrophic lake in a semi-arid area. Fortunately, it naturally
has good pollution degradation and stabilization capacity associated with its shallow, well-oxygenated, high
pH waters. It supports and harbors abundant wildlife as part of a very productive ecosystem. The lake
provides and supports a wide range of beneficial uses: aesthetic vistas and open space, water storage and
recreation (boating, sailing, fishing, hunting, etc.). Abundant wildlife and ecological richness are some of its
more significant assets.
Beginning some 150 years ago, much of summertime Jordan River outflow has been used for irrigation in
southern areas of the Salt Lake Valley. However, with ongoing urbanization, particularly following World
War II some 70 years ago, irrigated acreage has been steadily declining, and is now likely less than 25% of
the area irrigated from the Jordan River 100 years ago. As compared to pre-colonization conditions, the
lake size and flows have not likely changed dramatically; natural inflows and outflows have decreased due
to upstream water diversions, but these reductions have been significantly offset by the importation of
water from the Weber River Basin and Uintah Basin drainages. Utah Valley groundwater outflow is
relatively small.
A series of articles written by Dr. Merritt (2015) for the Wasatch Water Review (online) is an additional
source of information addressing common questions raised about physical, hydrologic and water quality
characteristics of the lake.

Utah Lake Studies
3
NUTRIENT BUDGET STUDY.
A current issue of wide interest is the nature and response of Utah Lake to nutrients (phosphorus and
nitrogen) contributed by various categories of inflowing waters, particularly publically owned treatment
works (POTWs, aka WWTPs)—as well as effects of these nutrients on the lakes trophic level (biological
productivity) and water quality. A key component in understanding and evaluating the nutrient issue is
identification and quantification of nutrient inputs and outputs—commonly referred to as a Nutrient
Budget.
Objectives.
1. Determine Utah Lake nutrient inflows (loadings) and outflows.
2. Evaluate nutrient loadings as related to Utah Lake ecosystem productivity (trophic) level.
3. Consider the feasibility of changing Utah Lake’s trophic level via nutrient control.
Scope.
This study was structured to generate the most detailed delineation to date of Utah Lake’s nutrient
loadings. The LKSIM model developed in the past by Dr. LaVere Merritt was used; primarily since it
incorporates the most detailed delineation currently available for the numerous lake inflows. A 2009 –
2013 study of flowrates and dissolved salts for the 14 largest surface tributaries to Utah Lake also collected
nutrient data in anticipation of the need for an up-to-date nutrient budget for the lake. That study,
directed by Dr. Wood Miller, was funded by the Central Utah Water Conservancy District (CUWCD) with
substantial cooperating support and resources of the Utah State Division of Water Quality (DWQ).
The nutrient data for the largest 14 inflows were also used as the basis for estimates of nutrient
concentrations for similar, smaller surface tributaries that were not sampled in that study. WWTPs in Utah
Valley also contributed to the data accumulation by increasing water quality monitoring, including nutrient
data, during most of the 2009 – 2013 period. Groundwater and mineral spring nutrient concentrations are
based on rather limited nutrient data, but errors in estimates for these are a minor concern since available
data indicates these contain much lower nutrient concentrations than typical surface waters and constitute
a very small percentage of the total nutrient loadings. Ongoing sampling associated with other lake studies
will generate some additional nutrient data and assist in future fine-tuning of current estimates. Literature
values were used to estimate nutrient values in atmospheric precipitation (Emmerich, 1983; USEPA, 1983).
In the afore-mentioned project, funds were not available to quantify the additional nutrients associated
with runoff from storm events, other than the fact that some storm effect is present in the data when a
sampling run happened to occur during or shortly after a storm. Storm event nutrients are often rather
large, and for some lakes can make up a substantial part of the nutrient loading. It is likely that storm event
nutrients are a significant additional source of nutrients to Utah Lake as part of the large, natural nutrient
loading. Additional studies to quantify storm nutrient loadings would be of interest but are not considered
as critical in current trophic-level evaluations of Utah Lake.

Utah Lake Studies
4
Time Period Simulated.
In order to align with the new data, the 2009 – 2013 water-year increment was chosen as the time period
for the nutrient loadings evaluation. It was fortuitous that this 5 year period from 1 Oct 2008 to 30 Sep
2013 was also a near-average period as to climatological and hydrological conditions. For example, the
average total lake inflow, including precipitation, was 646,000 af /yr during the 5 year, 2009 -2013 period as
compared to 630,000 af/yr for the 84 year, 1930 – 2014 period—this 84 year period is the total time
currently covered by the LKSIM model.
LKSIM Modifications.
The LKSIM computer model that Dr. Merritt developed in the past and continues to use to simulate Utah
Lake hydrology and conservative salts concentrations over time, was modified to include three more quality
parameters: Total Phosphorus (TP), Dissolved Nitrogen (DN) and Dissolved Phosphorus (DP). Information
and data for other components of the lake hydrology (precipitation, evaporation, groundwater, and
miscellaneous small surface inflows) were updated and made current through the 2013 water year.
Flowrate Values.
Measured and estimated monthly flowrates for the ’tributaries’ to Utah Lake are available from LKSIM
simulation work over the years; as are monthly values for evaporation and precipitation. Some new
flowrate correlations from the 2009-2013 study were added to the LKSIM data base to help fine-tune
values for the five year simulation period.
Nutrient Concentrations.
Appendix D contains the flowrate, nutrient data and other information used to develop nutrient
concentration values for the study period. The data from the 5 year study were entered into Excel
spreadsheets to facilitate the search for correlations between flowrates and nutrient concentrations.
Nutrients were also correlated with time and sometimes also by season of the year when adequate data
were available to allow seasonal delineation. If seasonal correlations were not significantly different than
annual correlations, annual values were used.
WWTP (POTW) Discharge Point Assumptions.
Effluent discharges from the WWTPs were treated as if they discharge directly into Utah Lake. In all cases,
except the Salem WWTP that discharges to a retention pond, they actually discharge into some other
tributary that then flows into the lake. In this case, the receiving tributaries were treated as if they were
separate from WWTP discharges so as to identify individual impacts. For all WWTP plants, except Salem
and Payson, for most of the year effluent makes up a large part of the combined flow in the receiving
tributaries. The larger-flow WWTPs (Orem, Provo and Timpanogos) are less than half a mile from the lake.

Utah Lake Studies
5
The smaller-flow plants (Payson, Springville and Spanish Fork) are one to two miles from the lake. The
Payson WWTP discharges to Benjamin Slough which has a much larger flow than the WWTP flow.
This approach represents a maximum estimate for WWTP nutrient loadings to Utah Lake. However, the
actual loading was likely not much less than this scenario. The Salem WWTP is relatively small and is the
only one that does not discharge into an inflowing tributary, but likely some significant parts of the
nutrients ultimately find their way to the lake; the discharged loading is a maximum estimate. Other
WWTP plants discharge to waters that in some cases and/or seasons follow diffused paths to the lake.
Even with very costly, long term, detailed investigations and data collection in these carriage waters, it
would most likely still not be possible to accurately quantify actual attenuation of phosphorus and nitrogen
before they reach the lake. Attenuation is probably rather small compared to the large amounts reaching
the lake, particularly for phosphorus.
One significant reason for low attenuation is that essentially all of these receiving tributaries are accreting
waters with upward artesian pressure gradients beneath them. This fact tends to minimize nutrient losses
to soils and groundwater. Either directly or in a delayed pathway, there is a high probability that most of
the discharged phosphorus reaches the lake. Nitrogen is likely attenuated significantly, particularly during
the hot summer months, since nitrification-denitrification is undoubtedly occurring in the sediment
interface in the organically-rich bottom sediments of these tributaries.
LKSIM Simulations.
LKSIM model simulations were run for the 2009-2013 time period. Note again that the LKSIM model does
not include any reaction rate or chemical equilibria equations and is essentially a mass-balance model, with
the exception of resetting monthly dissolved calcium (Ca) and bicarbonate (HCO3) ions to long term
monthly average values measured in the lake so as to allow calculation of the quantities being chemically
precipitated to the bottom sediments. Note that bicarbonate (HCO3) is actually precipitated as carbonate
(CO3) which is readily formed from bicarbonate in the lakes high pH environment.
During simulation runs, the nutrient loads for each tributary were calculated and tabulated, along with the
major salt ions (Calcium, Magnesium, Potassium, Sodium, Bicarbonate, Chloride and Sulfate).
Note that upgrades and modifications at WWTPs since 2013 are not included in this report, particularly the
Orem and Timpanogos facilities where substantial reductions in phosphorus loading to about 1 mg/l have
occurred. However, differences between current nutrient values and those during the 2009 – 2013 period
do not represent large changes in total loadings nor change the conclusions given in this report.

Utah Lake Studies
6
RESULTS AND DISCUSSION.
Table C-1 in Appendix C contains nutrient loading results for each of the individual ‘tributaries’ to Utah
Lake. Table 1 below gives a summary of the water volumes, percent of total inflow, and salt and nutrient
percentages by inflow category. Table 2 uses the same inflow categories and lists average nutrient inputs in
tons/yr for the 2009-2013 time period. Table 3 lists the combined total lake nutrient loadings by year.
Table 4 lists the tributaries that contribute at least one-half percent of the total nutrient loading of either
phosphorus or nitrogen or both.
Table 1. Utah Lake Inflows: Salts, Nutrients and Water Quantities for 2009-2013. ______________________________________________________________________________________
I. INFLOW
Flow |--Percent of Inflowing S a l t s------|% of Nutrients|
af/yr % _ TDS Na Ca Mg K Cl HCO3 SO4 TP DN DP
1. Surface Inflow
a. Mtn Strms 287862. 52.0 24.3 12.9 42.5 28.3 14.5 10.0 39.6 19.6 7.0 14.5 4.2
b. WWTPs 53126. 9.6 11.0 12.9 8.9 9.0 14.2 14.3 10.4 6.3 79.0 54.7 85.5 c. Main L-other 77799. 14.1 17.3 12.4 16.6 24.1 15.2 9.8 22.1 27.8 7.6 17.5 6.2
d. Provo B-other 53232. 9.6 9.8 4.8 13.0 11.8 7.6 4.6 12.1 11.4 1.6 5.5 1.3
e. Gosh. B-other 23073. 4.2 14.0 24.1 3.2 10.1 17.5 23.7 3.4 14.3 1.6 2.3 1.5
1. Subtotal: 495092. 89.5 76.4 67.1 84.2 83.3 69.0 62.5 87.6 79.4 96.8 94.6 98.7
2. Fresh Groundwater
a. Main L-gw 31640. 5.7 3.3 1.9 3.9 5.2 3.4 1.7 5.2 2.7 0.4 1.8 0.3
b. Gosh. B-gw 11531. 2.1 3.0 3.4 2.1 3.9 4.7 3.8 2.3 2.9 0.1 0.7 0.1
2. Subtotal: 43171. 7.8 6.2 5.2 6.0 9.0 8.0 5.4 7.5 5.6 0.5 2.4 0.4
3. Thermal/Mineral Groundwater
a. Main-min sprs 13957. 2.5 16.7 26.8 9.5 7.0 22.6 31.1 4.6 14.5 0.3 0.1 0.3
b. Gosh. B-m sprs 787. 0.1 0.3 0.6 0.1 0.1 0.4 0.5 0.1 0.4 0.0 0.0 0.0
3. Subtotal: 14744. 2.7 17.1 27.4 9.6 7.2 23.0 31.6 4.7 14.9 0.4 0.1 0.3
1,2& 3 subtot 553007. 100. 100. 100. 100. 100. 100. 100. 100. 100. 97.7 97.0 99.4
4. Precipitation
a. Main Lake 52884.
b. Provo Bay 8633.
c. Goshen Bay 31649.
4.Total Precip 93164. 2.3 3.0 0.6 100. 100. 100.
INFLOW TOTAL 646171.
II. Outflow.
1. Jordan River 336045.
2. Evaporation
a. Main Lake 218073.
b. Provo Bay 22133.
c. Goshen Bay 92602.
2. Subtotal 332808.
II. Outflow tot 668853.
Lake Storage -22682.
Net 646171.
TDS Na Ca Mg K Cl HCO3 SO4 TP DN DP
% Ratio: salts out/salts in (%): 85. 108. 39. 107. 109. 110. 54. 110. 9.4 17.1 9.4 Approx. corrected
for lake volume change: 79. 101. 36. 100. 102. 103. 50. 103. 8.7 15.9 8.7

Utah Lake Studies
7
Table 2. Utah Lake Nutrient Inflows and Outflows for 2009-2013.
___________________________________________________________
Nutrient L o a d I n g s -- tons/yr TP DN DP 1. Surface Inflow af/yr %
a. Mtn Strms 287862. 52.0 19 311 10
b. WWTP 53126. 9.6 215 1174 196 c. Main L-other 77799. 14.1 21 375 14
d. Provo B-other 53232. 9. 4 118 3
e. Gosh. B-other 23073. 4.2 4 50 3
1. Subtotal: 495092. 89.5 264 2028 226 2. Fresh Grnd water
a. Main L-gw 31640. 5.
b. Gosh. B-gw 11531. 2.1
2. Subtotal: 43171. 7.8 1 51 1
3. Thermal/Mineral GW
a. Main-min sprs 13957. 2.5
b. Gosh. B-m sprs 787. 0.1
3. Subtotal: 14744. 2.7 1 2 2
1,2& 3 subtot 553007. 100.0
4. Precipitation
a. Main Lake 52884.
b. Provo Bay 8633.
c. Goshen Bay 31649.
4.Total Precip 93164 6 64 1
INFLOW TOTAL 646171. 272 2145 229
II. Outflow.
1. Jordan River 33604. 26 367 22
2. Evaporation
a. Main Lake 218073.
b. Provo Bay 22133.
c. Goshen Bay 92602.
2. Subtotal 332808. 0 0 0
II. Outflow tot 668853.
Lake Storage -22682. TP DN DP
Net 646171. 26 367 22 Lost/Retained in the Lake 246 1778 207
_____________________________________________________
Table 3. Nutrient Loadings to Utah Lake by water year, 2009 – 2013
_______________________________________________________________
Water Year Phosphorus, tons/yr Nitrogen, tons/yr
Total Dissolved Dissolved
2009 277 232 2235
2010 257 219 1813
2011 327 267 2872
2012 247 211 1812
2013 252 216 1816
Average 272 229 2145

Utah Lake Studies
8
Table 4. Inflows carrying over one-half a percent of total nutrient loadings to Utah Lake, 2009-2013 ____________________________________________________________________________________________________________________ Trib af/yr tons/yr TP DN DP
----------------------------------------------------------------------------------------------------
T8 Minnie Creek. 3916. 1.90 14.4 1.33
Pct 0.71 0.69 0.71 0.60
----------------------------------------------------------------------------------------------------
T9 Mill Pond. 8270. 0.53 31.1 0.31
7400 W and 7550 N. Pct 1.50 0.20 1.45 0.14
----------------------------------------------------------------------------------------------------
T13 American Fork River 17544. 0.63 14.1 0.31
0.75 mile N of Am. Fork Boat Har.on 100 W. 3.17 0.23 0.66 0.14
----------------------------------------------------------------------------------------------------
T18 Geneva Cannery Drain 16036. 2.5 65.0 2.1
4250 W and 5600 N. Pct 2.90 0.94 3.1 0.93
----------------------------------------------------------------------------------------------------
T20 Geneva Steel Drain 5617. 0.41 105. 0.34
Geneva effluent recording station. Pct 1.02 0.15 4.9 0.15
----------------------------------------------------------------------------------------------------
T261 Orem WWTP discharge. 8949. 36.5 97.3 34.1
Pct 1.62 13.6 4.5 15.2
----------------------------------------------------------------------------------------------------
T27 Powell Slough Below Orem WWTP. 17764. 0.80 21.2 0.53
--Outflow from pond area Pct 3.22 0.304 1.020 0.240
----------------------------------------------------------------------------------------------------
T29 Provo River 161378. 8.26 142. 6.50
Historical flow data near Utah Lake. Pct 29.2 3.07 6.6 2.9
----------------------------------------------------------------------------------------------------
T48 Spanish Fork River 77068. 8.95 105. 1.73
Historical & correl.flows near Lake. Pct 13.97 3.33 4.9 0.77
----------------------------------------------------------------------------------------------------
T51 Benjamin Slough 28200 8.65 100. 5.75
0.2 mi east of 6000 W and 6400 S. Pct 5.10 3.2 4.7 2.6
----------------------------------------------------------------------------------------------------
T711 Timpanogos WWTP discharge 17169. 58.3 210. 51.3
(North end Utah Valley) Pct 3.11 21.7 9.8 23.0
----------------------------------------------------------------------------------------------------
T752 Salem WWTP discharge. 1200. 4.08 19.6 3.59
Pct 0.22 1.52 0.91 1.61
----------------------------------------------------------------------------------------------------
T76 Payson WWTP discharge. 1704 11.1 78.7 9.72
Pct 0.31 4.13 3.68 4.35
----------------------------------------------------------------------------------------------------
T39 Provo WWTP discharge. 15048. 61.4 511. 55.2
Pct 2.73 22.8 23.9 24.7
----------------------------------------------------------------------------------------------------
T43 Spring Creek 7714. 0.41 11.9 0.31
0.55 mi S of Kuhni Packing Plant. Pct 1.40 0.156 0.573 0.138
----------------------------------------------------------------------------------------------------
T44 Hobble Creek 31872. 1.45 47.0 1.25
0.4 mi east of 750 E and 2800 S. Pct 5.78 0.54 2.204 0.56
----------------------------------------------------------------------------------------------------
T47 Dry Creek 10640. 2.06 45.6 0.95
0.85 mi west of Freeway on 4000 S. Pct 1.93 0.76 2.13 0.43
----------------------------------------------------------------------------------------------------
T73 Springville WWTP discharge. 4172. 18.7 102. 16.4
Pct 0.76 6.95 4.76 7.36
----------------------------------------------------------------------------------------------------
T74 Spanish Fork WWTP discharge. 4884. 21.9 146. 19.9
Pct 0.89 8.14 6.82 8.92
----------------------------------------------------------------------------------------------------
T52 White Lake 6326. 1.72 17.2 1.29
Overflow into Goshen Bay. Pct 1.15 0.64 0.80 0.58
----------------------------------------------------------------------------------------------------
30 Precipitation3 (rain and snow) 93164. 6.3 63.3 1.3
Pct 14.4 2.4 3.0 0.57
---------------------------------------------------------------------------------------------------- 1Modifications have been made in the Orem and Timpanogos WWTPs since 2013 that have reduced these
values to lower values.
2The Salem WWTP discharges into a lagoon system with no direct discharge to a Lake tributary. It is
included here for comparison with the other Plants.
____________________________________________________________________________________________________

Utah Lake Studies
9
3Based on avg. precip. Conc. in mg/l: TP 0.05, DN 0.50, DP 0.01. Estimates are likely low, research
is needed in Utah Valley to verify concentrations.
The 6.3 tons/yr attributed to atmospheric precipitation gives insight as to why most shallow lakes in the
Mountain West and Southwest (and other similar areas around the world) are naturally eutrophic.
Precipitation waters (rain, hail, snow, particles) often contain enough nutrients to support eutrophic
systems unless diluted several times with very-low nutrient waters from other sources. The impact of
precipitation nutrients is often significantly increased by evaporation in shallow lakes.
In this study, the phosphorus loading accuracy is estimated to be plus or minus 10% of ‘true’ values for
individual tributaries and about 5% for the combined loadings. For nitrogen, the accuracy is likely some
20% and 10%, resp. However, the possibility remains that individual tributaries might have larger
deviations than these--particularly the very small tributaries and shallow groundwater inflows for which
data are sparse.
Phosphorus—Predicted Trophic Level.
Initially considering whether Utah Lake might be a phosphorus-limited lake, Figure 1 shows predicted
trophic states for Utah Lake using the Larsen-Mercier Trophic State Model (1975) that is briefly described in
Appendix B. From a 1976 study (Merritt, L.B., et. al., 1976), comparison results for several Central Utah
reservoirs are also shown. Current results also plotted in Figure 1 show the average inflowing phosphorus
concentration for Utah Lake of 634 µg /l—note that the vertical scale is logarithmic. The phosphorus
retention coefficient value of about 0.5 was calculated from retention equations associated with predictive
trophic-state modeling—which is the retention expected if the lake were a phosphorus-limited lake.
Continuing evaluation of Utah Lake as to whether it might become a phosphorus-limited lake—Average
phosphorus loading concentration would need to be dramatically reduced to about 40 µg /l to reach the
boundary of the eutrophic zone—moderately eutrophic. Note that the reason this trophic point has been
selected here is that actual in-lake observations indicate that the lake is actually moderately eutrophic as
discussed in a following section. Stated another way, the existing annual phosphorus loading is some 17
times higher than needed to support the lakes observed moderately-eutrophic state. However, since
massive amounts of phosphorus exist in Utah Lake bottom sediments, larger reductions would be needed,
say to perhaps 30 µg /l, i.e. to the middle of the mesotrophic zone, to actually reach a condition where
phosphorus might begin to be significantly limiting at the level of algae growth currently observed. Current
phosphorus loadings are 21 times larger than 30 µg /l.
Continuing with an assumed nutrient limitation scenario, Figure 2 depicts the projected situation resulting
from removing 100% of the WWTP loadings and 25% of all other tributary phosphorus inflow. These
removals still leave the lake well into the hyper-eutrophic loading zone, with inflowing average
concentrations at some 100-130 µg/l or about three times higher than a 40 µg/l target at the eutrophic
boundary and four times a 30 µg/l target.

Utah Lake Studies
10
Figure 1. Predicted Utah Lake Trophic State — Larsen-Mercier Model
Phosphorus retention coefficient

Utah Lake Studies
11
Figure 2. Utah Lake Locations on the Larsen-Mercier Trophic State Model
Measured Utah Lake Phosphorus Retention.
Figure 2 also shows the plot location of Utah Lake based on actual nutrient data in the outflowing Jordan
River. This gives a very high phosphorus retention of 90%. To explain: This simply means that Utah Lake is
presently very far from being a phosphorus-limited lake. The plot point at 90% retention does not really fit
the model since the model is only applicable to phosphorus-limited lakes. The 90% point is shown on the
graph to highlight the extraordinary phosphorus removal that occurs in Utah Lake via mineral precipitation;
and to illustrate that to become phosphorus-limited it would be necessary to reduce the lake loading to
that associated with approximately the 50% retention point and the desired trophic level. Under those
conditions about 50% of the inflowing phosphorus would be ‘lost’ in the lake as it was incorporated into the
lake ecosystem—ultimately, most of the removed phosphorus resides in the bottom sediments. Perhaps
the best way to visualize the situation is to remember that the model does not represent the predicted lake
condition unless phosphorus is the overall most limiting growth factor to algae on a longer term basis.
Extraordinary phosphorus retention mechanisms are obviously occurring in Utah Lake. Preliminary
research on lake mineral precipitates (Carling, 2016) indicates that a variety of phosphorus-rich minerals

Utah Lake Studies
12
form in the lake—to the extent determined from LKSIM simulations of nearly 100,000 tons/year of largely
calcium-carbonate-silica-phosphate mineral species. The re-suspension of flocculent fractions of these
minerals by wave action causes the almost-constant high turbidity observed in this shallow lake.
Due to relatively unlimited quantities of Ca, HCO3, SiO2 and a high pH, the lake likely has an essentially
unlimited capacity to precipitate phosphorus. This supports the hypothesis that the amount of phosphorus
in solution and available to algae is determined largely by chemical solubility reactions in situ, rather than
by the magnitude of overall lake loadings.
In summary, a very significant finding is that the amount of phosphorus going to the sediments each year is
some 15 to 20 times that needed to support the moderately eutrophic growth occurring naturally in the
lake. Remember, caution needs to be used in considering the Utah Lake plot on the L-M TSM: In fact, the
model applies as a predictive tool only if the lake became phosphorus-limited. It appears that the natural
lake turbidity (light-limitation) is the controlling factor to overall annual algae growth, not nutrients. It is
postulated that lake phosphorus-loading average concentration would have to be reduced to near 40 µg /l
(17 tons/yr) in order for phosphorus to enter the zone of competition with natural lake turbidity as the
overall most limiting factor to algae growth. Although apparently impossible, for discussion sake, suppose
lake phosphorus loading could be reduced to about 17 tons/yr—giving an average inflowing concentration
of about 40 µg /l. Since, overall, phosphorus solubility from bottom sediments appears to be some 50 to 60
µg/l (the smoothed concentration range in the outflowing Jordan River), phosphorus release from bottom
sediments could likely continue indefinitely.
Measured Trophic Level in Utah Lake.
Table 5 shows the current trophic state as indexed by the Carlson TSI Model (1977) (see Appendix B for a
brief review of this model). Utah Lake values generally fall into the ranges shown in bold italics. This
identifies the lake as being eutrophic with the Chlorophyll a and phosphorus levels falling into that range.
The Secchi Disk data indicate hyper-eutrophic conditions, but this is a false indicator for Utah Lake since, as
mentioned earlier, most of the high turbidity readings (low Secchi Disk values) result from the mineral
turbidity and only a small part of the turbidity is due to algae and other lake biota and their residues.

Utah Lake Studies
13
Table 5. Utah Lake (in italics) as Indexed in the Carlson Trophic State Index Model
____________________________________________________________________________________________________________
Nitrogen.
In a large lake such as Utah Lake, particularly one with a long water detention time, it is much more difficult
to relate nitrogen to trophic level since nitrogen has many reaction pathways, some of which link to
gaseous nitrogen which is always abundant. One of the most significant pathways for nitrogen removal is
oxidation to nitrate and then denitrification to nitrogen gas, a pathway in bacteria but not in algae.
Denitrification commonly occurs in sediments where needed anoxic conditions often exist. Conditions for
such denitrification are enhanced in eutrophic systems such as Utah Lake due to the abundance of
decomposing organic debris that often fosters anoxic conditions at the sediment-water interface where
specialized facultative bacteria are able to take oxygen from nitrate (NO3-) and release N2 gas. When lake
conditions have led to near depletion of ionic nitrogen species in the water, cyanobacteria (commonly
erroneously referred to as blue-green algae) are capable of fixing gaseous nitrogen. This gives them a
competitive edge over other algae and sometimes results in blue-green blooms, some of which produce
significant amounts of toxins.
Table 1 indicates that, in balance, about 84% of inflowing nitrogen is being removed in Utah Lake.
Apparently much of this removal is accomplished via denitrification. Nitrogen loading is about the same
excess as for phosphorus, 15+ times the amount needed to support eutrophic algae growth. The overall
annual nutrient load results in an 8:1 N/P ratio. Based on this ratio, one might conclude the lake is
nitrogen-limited, since ratios of less than about 10:1 often point toward nitrogen limitation. However, for
Utah Lake, this argument is superfluous due to the huge amount of nitrogen and phosphorus supplied by
the inflows as compared to the amount needed to support the algae growth. The same as for phosphorus,
on an overall basis nitrogen is not a limiting factor to Utah Lake algae growth.

Utah Lake Studies
14
Postulated Conditions for Blue-Green Algae Blooms in Utah Lake.
The possible role of nutrient loadings in large cyanobacteria (blue-green) blooms that sometimes occur in
Utah Lake needs study, but the authors postulate that in Utah Lake these blooms usually develop when a
sequence similar to the following occurs:
1. A calm, sunny weather period of more than two or three days causes warmer water. If the water is
already rather warm, such as in late summer/early fall, the setup is more serious. Warmer
temperatures speed up algae growth rates.
2. Relatively calm lake water allows suspended precipitates to settle and the resulting clearer water
allows deeper penetration of more sunlight thus providing more photosynthetic energy for algal
growth.
3. Since there is normally an abundance of nutrients in the water, within a few days these conditions
results in exponential increases in algae numbers (a bloom) which is initially dominated by normal
green algae since these can generally out-compete cyanobacteria.
4. The zooplankton species (very small aquatic bugs) present at the time are also very important.
These preferentially graze on various algae and can multiply very quickly and often play an
important role in limiting a bloom by consuming much of it.
5. If calm, warm conditions continue over a week or two, a series of blooms may occur as various
algae types grow and die away. In the ambient environment, bio-competition is constantly
changing the species and relative numbers. As time elapses, algae will locally begin to experience
phosphorus and/or nitrogen limitation since nutrients, initially available in situ, are temporarily
depleted via growth and incorporation into the biomass.
6. As phosphorus concentrations trend down toward growth-limiting values, more is fairly slowly
released from phosphorus-rich precipitates. However, additional ionic nitrogen is relatively
unavailable and nitrogen concentrations may drop to growth-limiting values. As this occurs, the
non-toxic green algae are in a nitrogen-limited condition, and blue-green algae are not. This allows
the cyanobacteria to dominate since these can use dissolved N2 gas to obtain nitrogen and
continue their growth.
7. The longer the relatively calm, hot conditions continue, the more likely the end result will be a
massive blue-green bloom, particularly towards the end of the bloom series. The various blue-
green algae vary significantly as to the kinds and amounts of toxins they generate during their short
life cycle and decay. Normally the amount of toxins released will be fairly low. The toxicity and
toxin quantities produced vary significantly among the various cyanobacteria. Most blue-green
blooms on Utah Lake appear to be relatively low in overall toxicity. (Utah DWQ ,2016) Under rare,
poorly understood, conditions more dangerous cyanobacteria species occur. Typically these much

Utah Lake Studies
15
more serious events occur in small ponds or pools where their ambient environment is quite
different than in open-lake waters.
8. In Utah Lake, algae blooms are usually halted by windy weather that returns the lake to turbid,
light-limited, cooler conditions. However, waves may windrow and concentrate algae in some
areas—sometimes resulting in high blue-green toxin concentrations and localized potential health
hazards.
9. As blooms and associated zooplankton die off, much of the nutrients are released back into the
water, usually making nutrients relatively abundant as algae growth again becomes limited by light
availability in the lakes turbid waters.
Note: Algal blooms occur naturally: rarely in oligotrophic lakes, occasionally in mesotrophic lakes
and often in eutrophic lakes. These blooms might be likened to a lush growth of grass on land.
Algae are the base of the aquatic food chain. A eutrophic lake routinely grows algae blooms as it
also supports large populations of aquatic life and associated terrestrial life. But, continuing the
analogy, it also has a higher probability of supporting noxious weeds (cyanobacteria) that
occasionally get the upper hand for a short period of time.
Managing Blue-Green Algae blooms.
Perhaps blue-green algae blooms are best handled by simply acknowledging that these occur naturally in
Utah Lake, and periodically (every few years for a short time) it may be necessary to issue use restrictions
when large blooms occur. Because of the apparent impossibility of reducing lake phosphorus loading
enough to make phosphorus limiting to algae growth, such temporary lake-use limitations seem to be the
best way manage this problem. A possibility also exists that reductions in nitrogen loadings could
exacerbate the cyanobacteria problem since these tend to dominate over green algae as ionic nitrogen is
depleted.
Note: In situ phosphorus levels would have to be lowered to near 20 µg /l to begin to limit algae growth,
and lowered to near 10 µg /l or less, to significantly limit algae growth. This level is an impossible goal for
Utah Lake, given the huge overall lake loading of over 30 times the 20 µg /l value and over 60 times the 10
µg/l value. (The 10 µg/l and 20 µg /l are commonly considered the approximate values necessary for grow-
limitation—as indicated also by the L-M TSM and Carlson TSI model used above.)

Utah Lake Studies
16
CONCLUSIONS.
1. Utah Lake phosphorus loading averaged 272 tons/yr during the 2009 -2013 period of study. The
dissolved nitrogen loading averaged 2145 tons/yr during the same period. This converts into an
average phosphorus concentration of 634 µg /l, that is some 15 to 20 times larger than the amount
needed to support the lakes natural eutrophic condition.
2. Current nitrogen loadings are about the same excess as for phosphorus. The overall N/P ratio is 8:1
which indicates possible nitrogen limitation vs phosphorus, if the lake were a ‘typical’, nutrient-limited
lake.
3. According to the Larsen-Mercier Trophic State Model, removal of all phosphorus from Wastewater
Treatment Plant discharges plus 25% of all other sources would still leave the total annual loading
some 3 to 4 times higher than growth-limiting values at the eutrophic boundary, and 5 to 6 times
higher than at the mesotrophic-oligotrophic boundary.
4. The Carlson Tropic State Index Model, based on measurements of chlorophyll a , phosphorus and
Secchi Disk, shows that Utah lake is actually just moderately eutrophic, and not an ultra-hyper
eutrophic lake as predicted by the Larsen-Mercier Model, if it were phosphorus-limited. This is strong
evidence that, overall, Utah lake algae growth is controlled by a growth factor(s) other than
phosphorus—most likely its natural turbidity.
5. Currently, the actual phosphorus retention in the lake is about 90%, rather than about 50% as it would
be if it were a typical phosphorus-limited lake. This finding is strong evidence that Utah Lake is not a
phosphorus-limited lake and large-scale natural phosphorus-removal mechanisms are at work in the
lake, notably chemical precipitation of various calcium, carbonate, silica and phosphate minerals—
some 100,000 tons/yr, of which phosphorus constitutes some 245 tons/yr. In this regard, the lake
itself is naturally removing far more phosphorus than could even the most advanced wastewater
treatment facilities along with a strident and extensive upstream removal/control of all other sources.
6. This study supports a hypothesis that the huge Utah Lake nutrient loadings are actually irrelevant to
algae growth and water quality since: (a) These are not the limiting factors to overall algae growth,
and cannot be reduced to growth-limiting levels. And, (b) the best hypothesis is that light availability
caused by natural turbidity is the limiting factor determining the trophic level (biological productivity).
In summary, there is a very high probability that nutrient removal in Utah Lake would achieve
negligible, if any, improvements in lake water quality.

Utah Lake Studies
17
REFERENCES
Borup, B. et.al. (2012). Water quality in Utah Lake tributaries over forty years. Environmental
Science and Technology. Vol. 1. American Science Press. Houston, Texas.
Carling, G. T. (2016). Personal communication. Assoc.Prof. in Dept. of Geological Sciences. Brigham
Young Univ., Provo, Ut
Carlson, R. (1977). A trophic state index for lakes. Limnology and Oceanography. 22(2): 361-369.
Dillon, P.J. (1974). The phosphorus-chlorophyll relationship in lakes. Limnology and Oceanography.
19(4): 767-73.
Emmerich, W.E. (1990). Precipitation Nutrient Inputs in Semiarid Environments. J. Env. Qual.
Larsen, D. and Mercier, H. (1975). Lake phosphorus loading graphs: an alternative. Working Paper
#174. Pacific Northwest Env. Res. Lab., EPA. Corvallis, Oregon.
Merritt, L.B., et al (1976). A report on selected aspects of water quality in the Provo River system,
The Diamond Fork system and the Strawberry Reservoir system. Eyring Res. Inst.,
Provo, UT. for the US Bureau of Reclamation.
Merritt, L. B., (2014) Five-part series of articles about Utah Lake in online Wasatch Water Review.
Porcella, D. (1976). Algal assay results on selected waters in the MAG area. MAG TWP #27, Eyring
Res. Inst. for the Mountainland Assoc. of Govts.
USEPA (1983?). Section II, Atmospheric Sources of Nutrients , Chesapeake Bay Prog. Tech. Studies.
Utah State Division of Water Quality (2016). Results of Algae tests on Utah Lake in Aug, 2016
(unpublished—on web site)
Vollenweider, R. (1968). Fundamentals of the eutrophication of lakes and flowing water, with
particular reference to N and P as factors in eutrophication. Technical Report OECH. Paris, France.

Utah Lake Studies
18
Appendix A
Nutrient Evaluation Issues.
As part of modern water quality management, nutrients are listed as potential pollutants. Concern for
nutrients exists because in some waters additional nutrients stimulate increased growth of aquatic plants
that may cause an increase in water quality problems. But a conundrum exists in dealing with nutrients as
pollutants in specific areas. Some of the issues are:
1. Limiting factor. In a given lake or river, addition or removal of nutrients may not cause significant
changes in the amount of aquatic plant growth—it depends on whether nutrients are the overall plant-
growth ‘limiting’ factors in the ecology of the waters being addressed. Other factors that may be limiting
are: temperature, light/turbidity/shading, shortage of other trace nutrients, toxicants, harvesting and
grazing, rapidity of changes in factors, and perhaps others in some cases.
2. Significant Effect. Since nutrients are not generally toxic in and of themselves (for the concentration
ranges normally found in open waters), it is excessive growth (and decay) of algae that may cause water
quality problems. However, additional algae (or other aquatic plant) growth may not be excessive—may
not result in significant additional water quality problems.
3. Benefits vs costs. Admittedly it can be very difficult to accurately assess the benefits (in environmental
issues benefits are often largely the prevention of damages) and the total costs associated with regulating,
managing, building and operating all of the programs and facilities needed for a given regulatory action,
e.g., nutrient removal. In some regulatory and pollution-control programs it is argued that it is not relevant
to consider benefits as compared to costs. However, most people still recognize that the benefit/cost
picture always needs to be an over-arching concept as difficult decisions are made as to how far to go in
actions/regulations in pollution control and environmental management.
4. Costs for Nutrient control/removal. The cost of nutrient removal facilities is rather high compared to
traditional sewage treatment. Even moderate modifications of existing facilities to achieve, perhaps, a 30
to 60% nutrient reduction is often very expensive. In addition, if nutrients are, in fact, triggering conditions
that are causing or will cause serious pollution and water quality damage, it is doubtful that removing 30 to
60% will significantly change the situation. Current advanced technology that achieves over 90% nutrient
(phosphorus and nitrogen) removal is extremely expensive—Removal of both nutrients at these high levels
would cost several times more than traditional sewage treatment facilities.
5. Regulatory Umbrellas. Given the many and complex factors inherent in understanding, evaluating and
predicting the role/response of parts of an ecosystem, regulators tend to look for a regulatory umbrella
that will simplify the management and control of a perceived problem. For example: disease, filth and
oxygen-depletion problems associated with the discharge of raw sewage to waters led to ‘umbrella’
rules/regulations for sewage collection and minimum allowable treatment.
One very difficult issue with the umbrella approach to environmental regulations is how far might the
approach be rationally used since ultimately there has to be a reasonability consideration (usually benefit
vs cost) of the impact of regulations and requirements.

Utah Lake Studies
19
Appendix B
Trophic State Assessment.
Background: For a long time, humans have linked increased human activity near lakes to increased filth,
disease and undesirable changes in water quality; in some cases these changes include troublesome aquatic
plant growth. Addressing the filth and disease aspects became the rallying impetus for modern
sanitary/environmental engineering. But even after these aspects were fairly-well addressed, issues
related to increased aquatic plant growth have continued to be an issue, but they can be very controversial
since:
(1) Many of the impacts are aesthetic and linked to subjective perceptions of what a particular pond or
lake should be like. Mother Nature naturally presents us with waters that vary from ‘pristine’
alpine lakes to ‘disgusting’ decaying swamps, and everything in between.
(2) Nutrients in aquatic plant growth issues are not direct pollutants, but are pre-cursors that may or
may not cause appreciable increases in bio-productivity and increased water quality problems. (An
exception is ammonia nitrogen—at ‘high’ concentrations it is directly harmful to many aquatic
organisms.)
However, since increases in nutrients often lead to increased bio-productivity and these increases
sometimes cause increased water quality problems, beginning about 60 years ago researchers began to
search for and identify correlations between nutrient levels and overall lake bio-productivity (trophic level).
Predicted Trophic State.
Vollenweider (1968) first formalized the concept that for many lakes phosphorus loading can be predictive
of biological productivity (trophic level). Vollenweider’s early work fostered the work of others, e.g., Dillon
(1974) modified Vollenweider’s Model to include phosphorus retention capacity. Larsen and Mercier
(1975) of the EPA Corvallis Laboratory modified earlier results in their similar model that has been widely
used to evaluate lakes and reservoirs. For lakes that tend to be ‘phosphorus-limiting’ the Larsen-Mercier,
and similar other models, are very helpful in predicting a lake’s trophic condition and also in projecting
responses to changes in phosphorus loadings. Although it is a ‘steady-state’ model it often helps to
maintain perspective of the overall situation, as well as keep us from not seeing the forest because of all
the trees we are studying.
Development: To develop predictive trophic state models, they gathered and plotted data for a number of
lakes from around the world for which there were sufficient phosphorus loadings and measured bio-
productivity data. Curves dividing the graphical plot into productivity zones were then delineated:
oligotrophic (low productivity—high quality), mesotrophic (moderate productivity—fair quality), eutrophic
(high productivity—sometimes poor quality), and hyper-eutrophic (very high productivity—often poor
water quality). Correlation equations were developed to calculate the expected retention coefficient –if a

Utah Lake Studies
20
lake is phosphorus-limited. Most retention equations use hydraulic detention time and mean depth as the
primary variables in the equations.
It should be noted that there was considerable scatter in the points (lakes) used, and it should be
highlighted that some lakes simply do not fit the model. One obvious reason is that phosphorus may not be
the overall limiting growth factor in a ‘non-conforming’ lake.
To determine the expected trophic condition of a lake using the trophic state model, then all annual
inflowing phosphorus quantities are summed and divided by the net annual inflowing water volume to
obtain the average inflowing phosphorus concentration. (tributary inflow + precipitation – evaporation,
often precipitation and evaporation are neglected, but these should not be neglected in shallow lakes) If
phosphorus retention has not been measured, or is far different than values given by the correlation
equations developed from data in phosphorus-limited lakes, a retention coefficient is calculated using a
retention equation and the resulting point on the plot gives the lime along which one can predict trophic
states for various loadings—based on the assumption that phosphorus is limiting or might be made limiting.
Dynamic Simulation Models.
For any given lake, evaluation of biological productivity, evaluation of water quality impacts, and
assignment of ‘trophic level’ are challenging tasks. A myriad of climatic, physical, and biological factors are
continuously affecting the aquatic ecosystem. It will likely be a long time before scientists and engineers
will have a comprehensive set of tools to track or predict in real time the short term productivity and the
overall water quality impacts occurring even in a controlled, fairly homogenous system, let alone in a large,
heterogeneous system such as Utah Lake.
Several aquatic-ecosystem dynamic simulation models have been developed that attempt to model
nutrients over time as related to the growth and decay of algae and the main pathways in the food web
they are part of. These efforts are very daunting and often frustrating due to the complexity of the task and
our often elementary knowledge as to the important reactions and interactions taking place in real
systems. These problems are compounded when large subareas of the lake are significantly different, such
as in Utah Lake. These types of modeling efforts may teach much about the lakes complexity and can be a
valuable asset, but comprehensive, definitive results are very difficult to achieve—some day we may get
there.
Measured Trophic Level.
Because of the high cost and difficulty of dynamic, time step modeling in lakes, researchers have developed
indexing models that use ‘standard’ water quality data periodically collected from a lake. These models are
intended to be practical, low cost methods of estimating/indexing the actual trophic condition occurring in
a body of water.

Utah Lake Studies
21
Carlson Trophic State Model: One model that has been quite successful and is widely used is the Carlson
‘Trophic State Index’ Model (1977). It uses three important, commonly-collected parameters to index the
apparent existing trophic conditions in a lake. Although one can use the data from a single sampling,
generally combined average data are used from several representative sites taken from late spring through
early fall.
Carlson Model components:
1. Chlorophyll a concentration: This component is found in all algae. Although not in the same
weight ratio in all algae, it is considered to be a fairly reliable measure of the amount of algae in the
sampled water.
2. Phosphorus concentration: This component is the amount of phosphorus in the sampled water.
Although phosphorus concentration is fairly dynamic as it is used and released by algae and in
aquatic chemical reactions, it indicates the level of phosphorus available to support algae growth.
3. Secchi Disk depth: This component indicates the general turbidity (cloudiness) of the water. It is
normally a good indicator of the level of algae growth and overall biological activity.
The Carlson Model is used to indicate a lakes existing trophic state. When any of the three indicators
seems to be giving inconsistent or questionable results, the user looks for other evidence to identify the
status of the lake.

Utah Lake Studies
22
Appendix C
LKSIM tributary descriptions (Figure C-1), code numbers and locations (Table C-1), tributary
concentrations (Table C-2) and salt and nutrient loading results (Table C-3) are given below.
Figure C-1. Sampling sites and code numbers for Utah Lake sites and tributaries

Utah Lake Studies
23
TABLE C-1: Utah Lake Tributaries and Locations -- Nutrient Budget Study.
Bay 1 MAIN_LAKE
Trib. No. Description
1 T1 Drain--6900 N and Saratoga Rd.
3 T3 Dry Creek--0.1 mi east of 9950 W and 7350 N.
4 T4 Drain--0.7 mi east of 9550 W and 7350 N.
5 T5 Drain--approx. 200 ft west of 8730 W and 7350 N.
6 T6 Drain--approx. 200 ft south of 8350 W and 7350 N.
7 T7 Drain--800 W and 7350 N.
8 T8 Minnie Creek.
9 T9 Mill Pond--7400 W and 7550 N.
10 T10 Drain--1.25 mi south of 6500 W and 7750 N.
11 T11 American Fork WWTP discharge (closed in 1980).
12 T12 Drain--02 mi west, thence 1 mi south of 6500 W and 7750 N.
13 T13 American Fork River--0.75 mi north of Am. Fk. Boat Harbor 100 W.
14 T14 Drain--0.1 mi west of 6400 N and 5750 W.
15 T15 Drain--0.1 mi east of 6400 N and 5750 W.
16 T16 Drain--0.1 mi south of 6400 N and 5300 W.
17 T17 Drain--0.25 mi west, thence 0.15 mi south of 4850 W & 6400 N.
18 T18 Geneva Cannery drain--4250 W and 5600 N.
19 T19 Drain--0.15 mile N of Geneva effl. recording stat. on W Geneva Rd.
20 T20 Geneva Steel drain--Geneva effluent recording station.
21 T21 Drain--0.2 mi south of Geneva effl recording stat. on W Geneva Rd.
22 T22 Drain--0.5 mi south of Geneva effl recording stat. on W Geneva Rd.
23 T23 Drain--0.9 mi south of Geneva effl recording stat. on W Geneva Rd.
24 T24 Drain--1.3 mi south of Geneva effl recording stat. on W Geneva Rd.
25 T25 Drain--West Geneva Rd. and 4000 N.
26 T26 Orem WWTP discharge.
27 T27 Powell Slough--outflow from pond area--below Orem WWTP.
28 T28 Drain--on N Boat Harbor Dr. 1.0 mi W of Geneva Rd. & N Boat H Dr.
29 T29 Provo River--Historical flow near Utah Lake.
48 T48 Spanish Fork River--Historical & correlated flows near Utah Lake.
49 T49 Drain--0.8 mi north of 3200 W and 5200 S.
50 T50 Drain--4000 W and 5200 S.
51 T51 Benjamin Slough--0.2 mi east of 6000 W and 6400 S.
53 T53 Jordan River --Historical flows from Utah Lake.
54 T54 Main Lake--Saratoga thermal springs.
84 T84 Main Lake--Saratoga-quality thermal spr (unknown-diffuse).
55 T55 Main Lake--Lincoln Pt. East thermal springs.
85 T85 Main Lake--Lincoln-Pt-east-quality thermal sprs (unknown-diffuse).
56 T56 Main Lake: Lincoln Pt. West thermal springs.
86 T86 Main Lake: Lincoln-Pt-west-quality thermal sprs (unknown-diffuse).
57 T57 Main Lake: Bird Island thermal springs.
87 T87 Main Lake: Bird-Island-quality thermal sprs (unknown-diffuse).
67 T67 Main Lake: Fresh GW inflow, Spanish Fk to Jordan R (NW quad).
68 T68 Main Lake: Fresh GW inflow, Spanish Fk to West Mtn (SW quad).
70 T70 Lehi WWTP discharge (closed in 1980).
71 T71 Timpanogos WWTP discharge (Northern Utah Valley--opened in 1980).
72 T72 Pleasant Grove WWTP Discharge (closed in 1980).
75 T75 Salem WWTP discharge.
76 T76 Payson WWTP discharge
66 T66 Main Lake: Surface wash and shallow seepage-shoreline-from calib.
69 T69 Total Lake: Negative surface wash & seepage-shoreline-from calib.
81 T81 Total Lake: Unmeas inflow (to get water bal. during simulation runs).
---------------------------------------------------------------------------------------------------------

Utah Lake Studies
24
Bay 2 PROVO BAY
Trib. No. Description
31 T31 Little Dry Cr.--0.1 mi west thence 0.25 mi south of 560 S and 2470 W.
32 T32 Drain--0.25 mi south and 250 ft west of 1600 W and 1150 S.
33 T33 Flowing well--0.5 mi S of 1600 W & 1150 S & 50' N of culv. at Big Dry Cr.
34 T34 Big Dry Cr--0.5 mi south of 1600 W and 1150 S.
35 T35 11th West ditch--in pasture approx 600 ft SE of 1100 W & 1560 S.
36 T36 5th West ditch--1560 S and 500 W.
37 T37 University Ditch--0.25 mi SSE of 1420 S and Univ. Ave.
38 T38 Mill Race--350 E and 1500 S.
39 T39 Provo WWTP discharge.
40 T40 Drain--0.35 mi south of Provo WWTP, thence 0.27 mi east.
41 T41 Rat Farm drain--0.35 mi south of Provo WWTP thence 0.3 mi east.
42 T42 Steel Mill drain--2770 S & 1050 E near old Kuhni Packing Plant site.
43 T43 Spring Creek--0.55 mi south of old Kuhni Packing Plant site.
44 T44 Hobble Creek--0.4 mi east of 750 E and 2800 S.
45 T45 Packard Drain--on Frontage Rd. 0.85 mi north of 3900 S.
46 T46 Drain--0.35 mi west of Freeway on 3900 S.
47 T47 Dry Creek--0.85 mi west of Freeway on 4000 S.
73 T73 Springville WWTP discharge.
74 T74 Spanish Fork WWTP discharge.
---------------------------------------------------------------------------------------------------------
Bay 3 GOSHEN BAY
Trib. No. Description
52 T52 White Lake--Overflow into Goshen Bay.
58 T58 Goshen Bay: Eastside thermal springs.
88 T88 Goshen Bay: East-side-quality thermal springs (unknown-diffuse).
61 T61 Goshen Bay: Groundwater-- Westside Smith property area.
62 T62 Goshen Bay: Groundwater--Westside Mosida Bay N.(Fitzgerald well #2 qual.)
64 T64 Goshen Bay: Groundwater-- Westside - South end (Elberta Church well).
60 T60 Goshen Bay: Surface wash and shallow seepage-shoreline-from calib.
Utah Lake Studies
25
TABLE C-2: Utah Lake tributaries with Concentrations in mg/l -- Nutrient Budget Study.
Bay 1 MAIN_LAKE annual avg or ‘winter’1 ‘s u m m e r’ ‘s p r i n g’ Trib. No. Description TP DN DP TP DN DP TP DN DP
1 T1 Drain-- 0.35 2.7 0.25
3 T3 Dry Creek-- 0.35 2.7 0.25
4 T4 Drain-- 0.35 2.7 0.25
5 T5 Drain-- 0.35 2.7 0.25
6 T6 Drain-- 0.35 2.7 0.25
7 T7 Drain-- 0.35 2.7 0.25
8* T8 Minnie Creek. 0.35 2.7 0.25
9 T9 Mill Pond-- 0.04 3.0 0.03 0.07 2.7 0.06 0.05 2.5 0.04
10 T10 Drain-- 0.35 2.7 0.25
12 T12 Drain-- 0.35 2.7 0.25
13 T13 Am Fk River-- 0.015 0.8 0.006 0.02 1.4 0.004 0.04 0.5 0.015
14 T14 Drain-- 0.35 2.7 0.25
15 T15 Drain-- 0.35 2.7 0.25
16 T16 Drain-- 0.35 2.7 0.25
17 T17 Drain-- 0.13 3.0 0.09
18* T18 Geneva Can. d-- 0.14 3.7 0.12 0.15 2.8 0.11 0.07 2.5 0.06
19 T19 Drain-- 0.13 3.0 009
20 T20 Geneva Steel d-- 0.05 20. 0.04 0.06 7.0 0.05 0.045 9.0 0.045
21 T21 Drain-- 0.13 3.0 0.09
22 T22 Drain-- 0.13 3.0 0.09
23 T23 Drain-- 0.13 3.0 0.09
24 T24 Drain-- 0.13 3.0 0.09
25 T25 Drain-- 0.13 3.0 0.09
26 T26 Orem WWTP-- 3.2 9.0 3.0
27 T27 Powell Slough-- 0.032 1.1 0.015 0.05 0.9 0.04 0.03 0.8 0.03
28 T28 Drain-- 0.13 3.0 0.09
29 T29 Provo River- 0.03 0.6 0.02 0.045 0.65 0.04 0.04 0.7 0.03
30 Precipitation2 0.05 0.50 0.01 (particle fallout plus nutrients in rain and snow)
48 T48 Spanish Fk R-- 0.08 0.5 0.04 0.10 1.2 0.06 0.08 1.1 0.04
49* T49 Drain-- 0.29 2.7 0.20
50 T50 Drain-- 0.29 2.7 0.20
51 T51 Benjamin S.-- 0.22 3.0 0.20 0.21 2.0 0.08 0.21 2.0 0.12
53 T53 Jordan River -- 0.05 1.1 0.04 0.06 0.7 0.05 0.07 1.0 0.045
54 T54 Main Lake-- 0.05 0.1 0.04
84 T84 Saratoga Sprs 0.05 0.1 0.04
55 T55 Lincoln Pt. E-- 0.05 0.1 0.04
85 T85 Lincoln-Pt-E-- 0.05 0.1 0.04
56 T56 Linclon Pt. W 0.05 0.1 0.04
86 T86 Lincoln-Pt W 0.05 0.1 0.04
57 T57 Bird Island 0.05 0.1 0.04
87 T87 Bird-Island- 0.05 0.1 0.04
67 T67 GW NW quad 0.02 0.2 0.01
68 T68 GW SW quad 0.03 0.2 0.02
71 T71 Timp. WWTP-- 2.5 9.0 2.2
75 T75 Salem WWTP-- 2.6 10. 2.2.
76 T76 Payson WWTP 4.9 34. 4.4
66 T66 ML Surf wash 0.25 3.0 0.20
69 T69 ML Neg surf w 0.25 3.0 0.20
---------------------------------------------------------------------------------------------------------

Utah Lake Studies
26
Bay 2 Provo Bay annual avg or ‘winter’ ‘s u m m e r’ ‘s p r i n g’
Trib. No. Description TP DN DP TP DN DP TP DN DP
31 T31 Little Dry Cr- 0.04 1.2 0.035
32 T32 Drain-- 0.04 1.2 0.035
33 T33 Flowing well-- 0.02 0.1 0.01
34 T34 Big Dry Cr 0.04 1.2 0.035
35 T35 11th W ditch-- 0.04 1.2 0.035
36 T36 5th Wditch-- 0.04 1.2 0.035
37 T37 Univ Ditch 0.04 1.2 0.035
38 T38 Mill Race-- 0.08 3.0 0.07 0.10 3.0 0.10 0.06 2.0 0.06
39 T39 Provo WWTP-- 3.0 25. 2.8
40 T40 Drain-- 0.04 1.2 0.035
41 T41 Rat Farm drain-- 0.04 1.2 0.035
42* T42 Steel Mill d-- 0.04 1.2 0.04 0.04 0.8 0.035 0.030 1.2 0.030
43 T43 Spring Cr-- 0.04 1.2 0.03 0.042 0.9 0.03 0.04 1.1 0.025
44 T44 Hobble Cr-- 0.025 1.4 0.018 0.042 1.3 0.035 0.04 0.8 0.03
45 T45 Packard Drain-- 0.04 1.2 0.035
46 T46 Drain-- 0.04 1.2 0.035
47 T47 Dry Creek-- 0.14 4.1 0.07 0.13 3.0 0.08 0.16 2.4 0.05
73 T73 Sprvle WWTP-- 3.3 18. 3.0
74 T74 Sp. Fk WWTP-- 3.3 22. 3.0
---------------------------------------------------------------------------------------------------------
Bay 3 GOSHEN BAY
Trib. No. Description
52 T52 White Lake-- 0.2 2.0 0.15
58 T58 GB E thermal 0.05 0.1 0.04
88 T88 GB E thermal 0.05 0.1 0.04
61 T61 GB GW Smith 0.03 2.0 0.02
62 T62 GB GW MB N 0.02 0.2 0. 01
64 T64 GB GW S 0.03 2.0 0.02
60 T60 GB Surf W 0.25 3.0 0.20
_________________________________
1 ‘spring’ is Mar, Apr, May & Jun; ‘summer’ is July, Aug & Sep’, ‘winter’ is Oct, Nov, Dec, Jan &,Feb..
2 These are tentative values taken largely from several publications of precipitation nutrient values in the US.

Utah Lake Studies
27
Table C-3. Tabulation of flow and tons and percentages of salts and nutrients for 2009-2013
water years—results from LKSIM.
Trib af/yr t o n s / y e a r
---------------TDS-----Na------Ca-------Mg------K------Cl------HCO3----SO4-----TP------DN------DP---
1 334. 292. 53. 25. 16. 7. 73. 99. 67. 0.16 1.22 0.11
Pct1 0.06 0.069 0.090 0.043 0.072 0.121 0.090 0.050 0.073 0.060 0.059 0.051
T1 Drain--6900 N and Saratoga Rd
----------------------------------------------------------------------------------------------------
3 450. 77. 4. 18. 4. 1. 3. 62. 12. 0.21 1.65 0.15
Pct 0.08 0.018 0.006 0.030 0.016 0.020 0.004 0.031 0.013 0.081 0.080 0.069
T3 Dry Creek--0.1 mi east of 9950 W and 7350 N.
----------------------------------------------------------------------------------------------------
4 409. 271. 21. 51. 16. 1. 18. 202. 51. 0.19 1.50 0.14
Pct 0.07 0.064 0.035 0.085 0.071 0.019 0.023 0.102 0.056 0.074 0.072 0.063
T4 Drain--0.7 mi east of 9550 W and 7350 N.
----------------------------------------------------------------------------------------------------
5 337. 215. 15. 42. 13. 1. 15. 159. 44. 0.16 1.24 0.11
Pct 0.06 0.051 0.025 0.070 0.059 0.012 0.018 0.080 0.049 0.061 0.059 0.052
T5 Drain--approx. 200 ft west of 8730 W and 7350 N.
----------------------------------------------------------------------------------------------------
6 1382. 761. 45. 135. 64. 10. 43. 590. 141. 0.66 5.07 0.47
Pct 0.25 0.181 0.076 0.229 0.282 0.172 0.053 0.299 0.154 0.250 0.244 0.211
T6 Drain--approx. 200 feet south of 8350 W and 7350 N.
----------------------------------------------------------------------------------------------------
7 1013. 655. 48. 96. 62. 9. 36. 471. 147. 0.48 3.72 0.34
Pct 0.18 0.156 0.081 0.163 0.274 0.156 0.044 0.239 0.161 0.183 0.179 0.155
T7 Drain--800 W and 7350 N.
----------------------------------------------------------------------------------------------------
8 3916. 2470. 208. 378. 218. 42. 197. 1820. 463. 1.86 14.37 1.33
Pct 0.71 0.587 0.351 0.639 0.964 0.692 0.243 0.923 0.506 0.709 0.692 0.599
T8 Minnie Creek.
----------------------------------------------------------------------------------------------------
9 8270. 5564. 348. 910. 450. 37. 495. 3484. 1012. 0.53 31.11 0.31
Pct 1.50 1.321 0.589 1.539 1.986 0.618 0.611 1.766 1.106 0.203 1.498 0.139
T9 Mill Pond--7400 W and 7550 N.
----------------------------------------------------------------------------------------------------
10 1213. 707. 25. 147. 51. 7. 30. 523. 155. 0.58 4.45 0.41
Pct 0.22 0.168 0.042 0.248 0.226 0.110 0.037 0.265 0.169 0.220 0.214 0.186
T10 Drain--1.25 mi south of 6500 W and 7750 N.
----------------------------------------------------------------------------------------------------
12 891. 483. 16. 99. 33. 4. 18. 340. 110. 0.42 3.27 0.30
Pct 0.16 0.115 0.027 0.168 0.144 0.071 0.022 0.172 0.120 0.161 0.157 0.136
T12 Drain--0.2 mi west thence 1 mi south of 6500 W and 7750 N.
----------------------------------------------------------------------------------------------------
13 17544. 5585. 132. 1368. 371. 33. 236. 4381. 992. 0.63 14.12 0.31
Pct 3.18 1.326 0.222 2.313 1.638 0.549 0.291 2.221 1.084 0.238 0.680 0.139
T13 American Fork River--0.75 mile north of Am. Fork Boat Harbor on 100 W. ------------------------
----------------------------------------------------------------------------
14 1752. 1157. 38. 243. 81. 9. 48. 769. 279. 0.83 6.43 0.60
Pct 0.32 0.275 0.064 0.411 0.358 0.147 0.059 0.390 0.305 0.317 0.310 0.268
T14 Drain--0.1 mi west of 6400 N and 5750 W.
----------------------------------------------------------------------------------------------------
15 1978. 1151. 38. 234. 75. 7. 43. 766. 315. 0.94 7.26 0.67
Pct 0.36 0.273 0.064 0.395 0.332 0.121 0.053 0.388 0.344 0.358 0.350 0.303
T15 Drain--0.1 mi east of 6400 N and 5750 W.
----------------------------------------------------------------------------------------------------
16 1339. 1032. 55. 198. 65. 8. 55. 588. 307. 0.64 4.91 0.45
Pct 0.24 0.245 0.092 0.335 0.289 0.127 0.067 0.298 0.336 0.242 0.237 0.205
T16 Drain--0.1 mi south of 6400 N and 5300 W.
----------------------------------------------------------------------------------------------------

Utah Lake Studies
28
17 3406. 2264. 93. 426. 157. 23. 120. 1449. 569. 0.60 13.89 0.42
Pct 0.62 0.538 0.156 0.720 0.695 0.378 0.149 0.734 0.623 0.229 0.669 0.188
T17 Drain--0.25 mi west thence 0.15 mi south of 4850 W and 6400 N.
----------------------------------------------------------------------------------------------------
18 16036. 12342. 997. 1969. 840. 101. 1200. 6741. 13291. 2.53 65.99 2.07
Pct 2.91 2.932 1.683 3.329 3.709 1.675 1.483 3.417 14.530 0.963 3.178 0.930
T18 Geneva Cannery Drain--4250 W and 5600 N.
----------------------------------------------------------------------------------------------------
19 3. 2. 0. 0. 0. 0. 0. 1. 0. 0.00 0.04 0.00
Pct 0.00 0.001 0.000 0.001 0.001 0.002 0.000 0.001 0.000 0.000 0.002 0.000
T19 Drain--0.15 mi north of Geneva effl recording station on West Geneva Rd.
----------------------------------------------------------------------------------------------------
20 5617. 4657. 313. 573. 321. 145. 649. 1832. 1069. 0.41 104.66 0.34
Pct 1.02 1.106 0.529 0.968 1.416 2.417 0.802 0.929 1.168 0.154 5.040 0.153
T20 Geneva Steel Drain--Geneva effluent recording station.
----------------------------------------------------------------------------------------------------
21 39. 32. 4. 4. 3. 1. 3. 28. 3. 0.01 0.16 0.00
Pct 0.01 0.008 0.007 0.006 0.012 0.024 0.004 0.014 0.004 0.003 0.008 0.002
T2 Drain--0.2 mi south of Geneva effl recording station on West Geneva Rd.
----------------------------------------------------------------------------------------------------
22 60. 28. 1. 7. 2. 0. 1. 25. 4. 0.01 0.24 0.01
Pct 0.01 0.007 0.002 0.011 0.008 0.006 0.002 0.013 0.004 0.004 0.012 0.003
T22 Drain--0.5 mi south of Geneva effl recording station on West Geneva Rd. -----------------------
-----------------------------------------------------------------------------
23 80. 64. 7. 7. 7. 2. 7. 59. 3. 0.01 0.33 0.
Pct 0.01 0.015 0.012 0.012 0.032 0.031 0.009 0.030 0.003 0.005 0.016 0.004
T23 Drain--0.9 mi south of Geneva effl recording station on West Geneva Rd.
----------------------------------------------------------------------------------------------------
24 167. 85. 4. 17. 6. 1. 3. 69. 11. 0.03 0.68 0.02
Pct 0.03 0.020 0.007 0.028 0.025 0.013 0.004 0.035 0.012 0.011 0.033 0.009
T24 Drain--1.3 mi south of Geneva effl recording station on West Geneva Rd.
---------------------------------------------------------------------------------------------------
25 753. 622. 43. 90. 57. 18. 56. 456. 115. 0.13 3.07 0.09
Pct 0.14 0.148 0.073 0.152 0.253 0.307 0.070 0.231 0.125 0.051 0.148 0.041
T25 Drain--West Geneva Rd. and 4000 N.
----------------------------------------------------------------------------------------------------
26 8949. 7261. 1362. 876. 389. 170. 1946. 3345. 924. 36.49 97.29 34.05
Pct 1.62 1.725 2.301 1.481 1.719 2.837 2.405 1.695 1.010 13.890 4.685 15.340
T26 Orem WWTP discharge
----------------------------------------------------------------------------------------------------
27 17764. 9825. 519. 1839. 708. 174. 589. 6781. 1962. 0.80 21.18 0.53
Pct 3.22 2.334 0.877 3.109 3.129 2.893 0.728 3.437 2.144 0.304 1.020 0.240
T27 Powell Slough--Outflow from pond area--below Orem WWTP.
----------------------------------------------------------------------------------------------------
28 899. 658. 43. 97. 67. 26. 44. 546. 118. 0.16 3.66 0.11
Pct 0.16 0.156 0.072 0.163 0.297 0.427 0.054 0.277 0.130 0.060 0.176 0.050
T28 Drain--on N Boat Harbor Dr. 1.0 mi west of Geneva Rd. & N. Boat Harbor Dr. --------------------
--------------------------------------------------------------------------------
29 161378. 50664. 2762. 11925. 2882. 455. 3352. 36633. 8421. 8.26 141.83 6.50
Pct 29.26 12.034 4.665 20.163 12.728 7.574 4.144 18.567 9.206 3.146 6.829 2.926
T29 Provo River--Historical flow data near Utah Lake.
----------------------------------------------------------------------------------------------------
48 77068. 35630. 4413. 9265. 2599. 334. 4189. 28281. 7153. 8.95 104.79 1.73
Pct 13.97 8.463 7.455 15.666 11.479 5.573 5.179 14.334 7.819 3.409 5.046 0.779
T48 Spanish Fork River--Historical & correlated flows near Utah Lake.
----------------------------------------------------------------------------------------------------
49 516. 1270. 320. 45. 68. 4. 240. 468. 322. 0.20 1.89 0.14
Pct 0.09 0.302 0.540 0.076 0.300 0.062 0.297 0.237 0.353 0.077 0.091 0.063
T49 Drain--0.8 mi north of 3200 W and 5200 S.
----------------------------------------------------------------------------------------------------
50 2979. 7409. 1539. 389. 494. 35. 1555. 2449. 2186. 1.17 10.93 0.81
Pct 0.54 1.760 2.599 0.657 2.182 0.587 1.922 1.241 2.390 0.447 0.526 0.365
T50 Drain--4000 W and 5200 S.

Utah Lake Studies
29
----------------------------------------------------------------------------------------------------
51 28200. 26200. 3580. 2848. 1998. 388. 3755. 15725. 4475. 8.65 100.36 5.75
Pct 5.11 6.223 6.046 4.815 8.824 6.459 4.642 7.970 4.892 3.293 4.832 2.590
T51 Benjamin Slough--0.2 mi east of 6000 W and 6400 S. --------------------------------------------
--------------------------------------------------------
53 -336045. 361085. 64299. 23230. 24320. 7161. 89007. 106442. 100887. 25.28 366.37 20.93
Pct 100.00 100.000 100.000 100.000 100.000 100.000 100.000 100.000 100.000 100.000 100.000 100.000
T53 Jordan River--Historical flows from Utah Lake.
---------------------------------------------------------------------------------------------------
54 4193. 8150. 1254. 1054. 342. 114. 1966. 1710. 2451. 0.28 0.57 0.23
Pct 0.76 1.936 2.118 1.783 1.510 1.899 2.431 0.867 2.679 0.108 0.027 0.103
T54 Main Lake--Saratoga Thermal Springs.
---------------------------------------------------------------------------------------------------
84 3473. 6749. 1038. 873. 283. 94. 1628. 1416. 2029. 0.24 0.47 0.19
Pct 0.63 1.603 1.754 1.476 1.251 1.573 2.013 0.718 2.219 0.090 0.023 0.085
T84 Main Lake--Saratoga-quality thermal springs.
----------------------------------------------------------------------------------------------------
55 328. 2850. 668. 200. 49. 58. 1069. 303. 436. 0.02 0.04 0.02
Pct 0.06 0.677 1.128 0.339 0.216 0.964 1.321 0.153 0.477 0.008 0.002 0.008
T55 Main Lake--Lincoln Pt East thermal springs. ---------------------------------------------------
-------------------------------------------------
85 983. 8549. 2004. 601. 147. 174. 3206. 908. 1309. 0.07 0.13 0.05
Pct 0.18 2.031 3.384 1.016 0.649 2.893 3.963 0.460 1.431 0.025 0.006 0.024
T85 Main Lake--Lincoln-Pt-East-quality thermal springs.
----------------------------------------------------------------------------------------------------
56 131. 1140. 267. 80. 20. 23. 427. 121. 175. 0.01 0.02 0.01
Pct 0.02 0.271 0.451 0.136 0.087 0.386 0.528 0.061 0.191 0.003 0.001 0.003
T56 Main Lake: Lincoln Pt West thermal springs.
----------------------------------------------------------------------------------------------------
86 3211. 27926. 6545. 1964. 480. 567. 10472. 2967. 4276. 0.22 0.44 0.17
Pct 0.58 6.633 11.055 3.320 2.120 9.452 12.945 1.504 4.675 0.083 0.021 0.079
T86 Main Lake: Lincoln-Pt-West-quality thermal springs.
----------------------------------------------------------------------------------------------------
57 328. 3117. 846. 174. 58. 67. 1336. 329. 459. 0.02 0.04 0.02
Pct 0.06 0.740 1.429 0.294 0.256 1.113 1.651 0.167 0.501 0.008 0.002 0.008
T57 Main Lake: Bird Island thermal springs.
----------------------------------------------------------------------------------------------------
87 1310. 12467. 3384. 695. 232. 267. 5343. 1318. 2226. 0.09 0.18 0.07
Pct 0.24 2.961 5.716 1.174 1.023 4.451 6.605 0.668 2.434 0.034 0.009 0.032
T87 Main Lake: Bird-Island-quality thermal springs.
----------------------------------------------------------------------------------------------------
67 20294. 8550. 552. 1517. 827. 110. 965. 6399. 1434. 0.55 5.52 0.28
Pct 3.68 2.031 0.932 2.565 3.654 1.838 1.193 3.243 1.568 0.210 0.266 0.124
T67 Main Lake: Fresh GW inflow, Spanish Fk to Jordan R (Northwest quad).
----------------------------------------------------------------------------------------------------
68 11346. 5243. 571. 786. 355. 93. 386. 3901. 1079. 0.46 30.84 0.31
Pct 2.06 1.245 0.964 1.330 1.566 1.542 0.477 1.977 1.180 0.176 1.485 0.139
T68 Main Lake: Fresh GW inflow Spanish Fk to West Mtn (Southwest quad).
----------------------------------------------------------------------------------------------------
71 17169. 16451. 3057. 1633. 700. 233. 4434. 6440. 2310. 58.34 210.01 51.34
Pct 3.11 3.907 5.163 2.762 3.092 3.888 5.481 3.264 2.525 22.208 10.112 23.125
T71 Timpanogos WWTP discharge (North end Utah Valley)
----------------------------------------------------------------------------------------------------
75 1200. 946. 106. 126. 65. 24. 98. 718. 98. 4.08 19.57 3.59
Pct 0.22 0.225 0.179 0.212 0.288 0.408 0.121 0.364 0.107 1.552 0.942 1.616
T75 Salem WWTP discharge.
----------------------------------------------------------------------------------------------------
76 1704. 1885. 364. 194. 67. 32. 500. 908. 185. 11.11 78.72 9.72
Pct 0.31 0.448 0.614 0.329 0.297 0.540 0.618 0.460 0.202 4.231 3.790 4.380
T76 Payson WWTP discharge.
----------------------------------------------------------------------------------------------------

Utah Lake Studies
30
31 1607. 904. 41. 205. 55. 10. 55. 670. 168. 0.09 2.62 0.08
Pct 0.29 0.215 0.070 0.347 0.241 0.167 0.067 0.340 0.184 0.033 0.126 0.034
T31 Little Dry Cr.--0.1 mi west thence 0.25 mi south of 560 S and 2470 W.
----------------------------------------------------------------------------------------------------
32 886. 467. 22. 114. 28. 5. 28. 387. 77. 0.05 1.45 0.04
Pct 0.16 0.111 0.037 0.193 0.122 0.080 0.034 0.196 0.084 0.018 0.070 0.019
T32 Drain--0.25 mi south and 250 ft west of 1600 W and 1150 S.
----------------------------------------------------------------------------------------------------
33 230. 94. 10. 18. 7. 1. 8. 88. 6. 0.01 0.03 0.00
Pct 0.04 0.022 0.016 0.031 0.029 0.018 0.010 0.045 0.006 0.002 0.002 0.001
T33 Flowing well--0.5 M south of 1600 W & 1150 S & 50' north of culv. at Big Dr
----------------------------------------------------------------------------------------------------
34 5741. 2996. 140. 671. 164. 32. 172. 2294. 577. 0.31 9.36 0.27
Pct 1.04 0.712 0.237 1.135 0.724 0.533 0.212 1.163 0.631 0.119 0.451 0.123
T34 Big Dry Creek--0.5 mi south of 1600 W and 1150 S.
----------------------------------------------------------------------------------------------------
35 1198. 510. 23. 107. 26. 5. 24. 387. 80. 0.07 1.95 0.06
Pct 0.22 0.121 0.038 0.182 0.115 0.087 0.030 0.196 0.087 0.025 0.094 0.026
T35 11th West Ditch--in pasture approx 600 ft SE of 1100 W & 1560 S.
----------------------------------------------------------------------------------------------------
36 848. 430. 20. 90. 27. 5. 24. 343. 66. 0.05 1.38 0.04
Pct 0.15 0.102 0.033 0.152 0.117 0.077 0.030 0.174 0.072 0.018 0.067 0.018
T36 5th West Ditch--1560 S and 500 W.
----------------------------------------------------------------------------------------------------
37 1053. 617. 27. 143. 37. 6. 33. 491. 103. 0.06 1.72 0.05
Pct 0.19 0.147 0.046 0.242 0.164 0.095 0.041 0.249 0.113 0.022 0.083 0.023
T37 University Ditch--0.25 mi SSE of 1420 S and Univ. Ave.
----------------------------------------------------------------------------------------------------
38 2162. 1440. 118. 250. 94. 14. 241. 955. 159. 0.23 7.41 0.20
Pct 0.39 0.342 0.199 0.422 0.415 0.240 0.298 0.484 0.173 0.088 0.357 0.091
T38 Mill Race--350 E and 1500 S.
----------------------------------------------------------------------------------------------------
39 15048. 11044. 1227. 1452. 450. 205. 2372. 5011. 1186. 61.35 511.29 55.22
Pct 2.73 2.623 2.073 2.455 1.987 3.408 2.933 2.540 1.297 23.358 24.618 24.874
T39 Provo WWTP discharge.
----------------------------------------------------------------------------------------------------
40 2434. 1489. 93. 261. 99. 83. 165. 1105. 205. 0.13 3.97 0.12
Pct 0.44 0.354 0.156 0.442 0.438 1.378 0.204 0.560 0.224 0.050 0.191 0.052
T40 Drain--0.35 mi south of Provo WWTP thence 0.27 mi east.
----------------------------------------------------------------------------------------------------
41 4176. 2248. 136. 448. 170. 23. 125. 1896. 346. 0.23 6.81 0.20
Pct 0.76 0.534 0.230 0.758 0.752 0.378 0.154 0.961 0.378 0.086 0.328 0.089
T41 Rat Farm Drain--0.35 mi south of Provo WWTP thence 0.3 mi east.
----------------------------------------------------------------------------------------------------
42 6996. 9223. 466. 1616. 542. 65. 675. 2662. 3898. 0.44 10.14 0.35
Pct 1.27 2.191 0.787 2.733 2.394 1.077 0.835 1.349 4.262 0.166 0.488 0.159
T42 Steel Mill Drain--2770 S & 1050 E near Kuhni Packing Plant.
----------------------------------------------------------------------------------------------------
43 7714. 8282. 577. 1499. 493. 48. 891. 3260. 2831. 0.41 11.89 0.31
Pct 1.40 1.967 0.974 2.535 2.176 0.804 1.102 1.653 3.094 0.156 0.573 0.138
T43 Spring Creek--0.55 mi south of Kuhni Packing Plant.
----------------------------------------------------------------------------------------------------
44 31872. 11099. 424. 2706. 636. 57. 427. 9041. 1529. 1.45 47.02 1.25
Pct 5.78 2.636 0.716 4.576 2.811 0.948 0.527 4.582 1.671 0.553 2.264 0.562
T44 Hobble Creek--0.4 mi east of 750 E and 2800 S.
----------------------------------------------------------------------------------------------------
45 4472. 2929. 170. 511. 231. 31. 170. 2303. 480. 0.24 7.29 0.21
Pct 0.81 0.696 0.287 0.863 1.020 0.516 0.210 1.167 0.525 0.093 0.351 0.096
T45 Packard Drain--on Frontage Rd. 0.85 mi north of 3900 S.
----------------------------------------------------------------------------------------------------
46 3075. 2203. 209. 334. 176. 18. 238. 1651. 393. 0.17 5.02 0.15
Pct 0.56 0.523 0.353 0.565 0.775 0.306 0.295 0.837 0.430 0.064 0.241 0.066
T46 Drain--0.35 mi west of Freeway on 3900 S.

Utah Lake Studies
31
----------------------------------------------------------------------------------------------------
47 10640. 7953. 795. 1432. 550. 116. 940. 5495. 1085. 2.06 45.60 0.95
Pct 1.93 1.889 1.343 2.421 2.427 1.928 1.162 2.785 1.186 0.784 2.195 0.428
T47 Dry Creek--0.85 mi west of Freeway on 4000 S.
----------------------------------------------------------------------------------------------------
73 4172. 3300. 397. 471. 142. 85. 822. 1639. 312. 18.71 102.07 16.44
Pct 0.76 0.784 0.670 0.796 0.626 1.417 1.016 0.831 0.341 7.124 4.915 7.408
T73 Springville WWTP discharge.
----------------------------------------------------------------------------------------------------
74 4884. 5901. 1182. 531. 246. 106. 1494. 2576. 803. 21.91 146.04 19.91
Pct 0.89 1.402 1.996 0.898 1.085 1.770 1.846 1.305 0.878 8.340 7.032 8.971
T74 Spanish Fork WWTP discharge.
----------------------------------------------------------------------------------------------------
52 6326. 51432. 13327. 688. 1892. 903. 18055. 3439. 11349. 1.72 17.20 1.29
Pct 1.15 12.216 22.510 1.163 8.354 15.043 22.319 1.743 12.407 0.655 0.828 0.581
T52 White Lake--Overflow into Goshen Bay.
----------------------------------------------------------------------------------------------------
58 459. 842. 224. 50. 19. 16. 249. 156. 206. 0.03 0.06 0.02
Pct 0.08 0.200 0.379 0.084 0.083 0.260 0.308 0.079 0.225 0.012 0.003 0.011
T58 Goshen Bay: East side thermal springs
----------------------------------------------------------------------------------------------------
88 328. 601. 160. 36. 13. 11. 178. 111. 147. 0.02 0.04 0.02
Pct 0.06 0.143 0.271 0.060 0.059 0.185 0.220 0.056 0.161 0.008 0.002 0.008
T88 Goshen Bay: East-side-quality thermal springs.
----------------------------------------------------------------------------------------------------
61 2583. 4037. 281. 421. 456. 123. 772. 1545. 1158. 0.11 7.02 0.07
Pct 0.47 0.959 0.474 0.712 2.015 2.047 0.955 0.783 1.266 0.040 0.338 0.032
T61 Goshen Bay: Groundwater-- Westside Smith Property Area.
----------------------------------------------------------------------------------------------------
62 6365. 6055. 1125. 606. 346. 87. 1471. 2336. 1125. 0.17 0.87 0.09
Pct 1.15 1.438 1.899 1.024 1.528 1.441 1.818 1.184 1.229 0.066 0.042 0.039
T62 Goshen Bay: Groundwater--Westside Mosida Bay N.(Fitzgerald well #2 quality)
----------------------------------------------------------------------------------------------------
64 2583. 2492. 597. 211. 70. 70. 842. 737. 351. 0.11 7.02 0.07
Pct 0.47 0.592 1.008 0.356 0.310 1.170 1.041 0.374 0.384 0.040 0.338 0.032
T64 Goshen Bay: Groundwater-- Westside - Southend (Elberta Church well).
----------------------------------------------------------------------------------------------------
60 16747. 8017. 1055. 1213. 422. 158. 1371. 3376. 1793. 2.64 31.65 2.11
Pct 3.04 1.904 1.782 2.051 1.864 2.637 1.695 1.711 1.960 1.004 1.524 0.950
T60 Goshen Bay: Positive Surface wash and shallow seepage--shoreline--estimated from calib
----------------------------------------------------------------------------------------------------
66 39075. 10830. 738. 1846. 738. 98. 738. 7877. 2215. 6.15 73.84 4.92
Pct 7.08 2.572 1.247 3.121 3.261 1.641 0.913 3.992 2.422 2.343 3.555 2.218
T66 Main Lake: Positive Surface wash and shallow seepage--shoreline--estimated from calib
----------------------------------------------------------------------------------------------------
69 -61079. -17797. -1693. -2889. -1096. -242. -1992. -10625. -3785. -8.30 -99.61 -6.64
Pct -11.07 -4.227 -2.860 -4.885 -4.840 -4.039 -2.463 -5.385 -4.138 -3.160 -4.796 -2.991
T69 Total Lake: Negative surface wash & seepage--shoreline--estimated from calib
----------------------------------------------------------------------------------------------------
81 -1408. -2076. -382. -117. -132. -45. -543. -483. -577. -0.14 -2.17 -0.09
Pct -0.26 -0.493 -0.645 -0.197 -0.582 -0.758 -0.671 -0.245 -0.631 -0.052 -0.104 -0.041
T81 Total Lake: Unmeas. Inflow (to get water bal during simulation run.)
1These are the percentages of the total tributary inputs to Utah Lake

Utah Lake Studies
32
Appendix D – Utah Lake Major Tributary Flow Rates, Nutrient Data and Plots
Raw Data Acquisition.
During a study for the Central Utah Water Conservancy District, from October 2008 to August 2013,
monthly water samples were collected at 14 different sites from Utah Lake major tributaries (major
tributaries were identified as the 14 contributing the most water to Utah Lake), the Jordan River at Utah
Lake outlet, and at 7 wastewater treatment plants (WWTPs). During periods of high flow from April to June
of each year, flow measurements and water samples were sometimes taken twice a month; during the
winter some months were skipped. There were approximately 60 sampling dates during the study period.
In the study, flowrates, major dissolved ions (salts), and nutrients were included.
Of the 14 original sites, four were located downstream from WWTPs. Beginning in October 2009 to August
2013 data were also collected at 4 additional sites upstream from these WWTPs, making a total of 18 sites
on the major tributaries. The water samples taken at each site were delivered to the Unified State
Laboratory in Taylorsville, Utah where nutrient concentrations were analyzed. The nitrogen and
phosphorus constituents that were analyzed and reported are: T-P, D-P, D-N, D-NO2-3, NO2-3, and NH3.
For each sample, weather conditions were also observed and recorded.
From November 2009 to August 2013, data for the various WWTP discharges and the Geneva Steel Site (UT
20) were acquired directly from data collected by the State of Utah, DWQ. Prior to November 2009, the
flow rates and nutrient data for the WWTPs and Geneva Steel outfall were taken by this study team.
Flow rates of the various tributaries were measured as one of the water sampling tasks. Flow rates for the
Provo River and Hobble Creek for the sample dates and times were taken from the United States Geological
Survey (USGS) data since these 2 tributaries have gaging stations. Flow rates for the Jordan River for the
sample dates were provided by the Jordan River/Utah Lake Commissioner.
Flow measurements (in cfs) were determined by using the common sub-section method using depth and
average velocity for two to four sub-sections within the total flow cross section. Velocities were measured
using a Flo-Mate Model 2000 Portable Flow Meter, manufactured by Marsh-McBinney, Inc. A single velocity
reading at 0.4 of the depth from the bottom was used as the average velocity for each sub-section. This
velocity was multiplied by the sub-section area thus giving the flow rate for each subsection. The total
tributary flow rate was the summed subsection flows.
Data Analysis.
Test result data from the Unified State Laboratory were entered into the Microsoft Excel program for each
of the total 25 site locations, along with flow data collected by the study team. Using Excel functions,
averages were calculated along with several different plots of concentrations (mg/l) and loadings (kg/day)
to provide information and insight as to time variations, differences and overall magnitudes for the various
nutrient parameters.

Utah Lake Studies
33
Excel sheets are included in this Appendix. Included for each of the approximately 60 sample dates are
daily flows, overall average flow rate (cfs), along with concentrations, overall average concentrations
(mg/l), and loading rates (kg/day) for TP, DN and DP. Excel sheets include plots of the flows, the 3 nutrient
concentrations and the 3 nutrient loadings versus dates (7 plots). Also there are plots of the 3 nutrient
concentrations and loadings vs. flowrates for ‘all the data’ (6 plots) and for the ‘seasonal’ data (6 plots).
These tables and plots for locations T9 (see Table C-1 for reference), T13, T18, T20, T27, T29, T38, T42, T43,
T44, T47 and T71 are given in Excel File UtahLakeNutrientSamplingData4PlotsReport as sheets 2 – 13. The
tables and plots for T48, T51, T26, T39, T38B, T73, T43B, T74, T47B, T75, T76 and T51B are given in Excel
File UtahLakeNutrientSamplingData3PlotsReport as sheets 14 – 25. And the tables and plots for T53 (Jordon
River) are in UtahLakeNutrientSamplingData5PlotsReport as sheet 1.
LKSIM calculates concentrations and flows from WWTPs separately from their respective tributaries as if
the effluent from these plants goes directly into Utah Lake. Actually the effluents from most WWTPs are
carried to Utah Lake in various tributaries. For this reason, the tributaries which carried WWTP effluent are
analyzed in a different manner in this study than those without WWTP effluent. In this study, four
tributaries carry WWTP effluent: Millrace (UT 38B), Spring Creek (UT 43), Dry Creek (UT 47), and Benjamin
Slough (UT 51). Effluent flow rates from these WWTPs were obtained directly from the plant operators or
from the State of Utah data base. The Timpanogos WWTP Ponds (UT 71) and Orem WWTP (UT 27A) both
discharge directly into Utah Lake.
As mentioned earlier, beginning in October of 2009, on Millrace, Spring Creek, and Dry Creek the water
quality data and flows upstream of the WWTPs were measured to obtain the data for LKSIM. It was
assumed that the water quality upstream for these tributaries would be the same downstream if the
WWTP effluent was not taken into account. However, Benjamin Slough (UT 51) has a much greater
difference in its upstream and downstream flow rates than the other three tributaries due to additional
inflows between the sampling locations. Therefore, the influence of the Payson WWTP (UT 51A) and Salem
WWTP (UT 51C) on UT 51 was removed using a mass balance equation.
Plots of Nutrients.
Correlations between various nutrient concentrations and flow rates were the primary objectives in the
Excel correlations. For the tributaries with substantial spring-runoff flows, correlations were also done by
seasons. Earlier LKSIM simulations done by the authors had revealed that seasonal grouping of common-
ion concentrations often gave better flowrate-salt concentration correlations. The ‘seasons’ found to be
the best were: March through June (spring), July through September (summer) and October through
February (winter). (Earlier studies using LKSIM had identified this seasonal delineation as the most
meaningful for many lake tributaries). These seasons were also used for nutrient correlations.
Various data groupings and equation types were tried in the search for the most practical and meaningful
correlations. Excel has a variety of trendline types which include: exponential, polynomial, logarithmic,
power, and linear trendlines. After considerable work with various equation types, the decision was made
to use linear trendlines / equations for the sampled tributaries.

Utah Lake Studies
34
Year by Year Variability.
For nearly all of the tributaries, considerable correlation variability, for flow vs nutrient, is apparent from
year to year. This is due to many hydrological and environmental factors that are, at present, difficult to
identify, measure or correlate. Therefore, plotted data show rather large ‘scatter’.
This scatter would likely be even greater if some extreme water years had occurred during the 5-year data
collection period. However, the years during the collection period were very close to average and likely
give a good representation of typical conditions in the Utah Lake hydrological system. The 2009 year was
about average, the 2010 – 2011 years were moderately above average, and the 2012 – 2013 years were
moderately below average.
For example, the 47 year average flow rate of the Provo River measured at the Woodland station is 211 cfs,
whereas the average flow rate at this station during 2009 - 2011 was 257 cfs. Also, the 83 year average flow
rate of the Spanish Fork River measured at the Castilla station is 237 cfs, whereas the average flow rate
during 2009 – 2011 at that location was 287 cfs.
Likewise, the average precipitation for the past 30 years measured at the Provo/BYU station is 20.13 inches,
whereas the average precipitation during 2009 – 2011 at that same station was 23.14 inches. Further, the
average Spanish Fork precipitation for the past 30 years is 21.55 inches, whereas the average at the same
location during 2009 – 2011 was 25.74 inches.
As the resulting correlation plots given later in this appendix were studied we came to the conclusion, that
for a few tributaries, correlation equations were likely superior to just using mean values, but that for many
tributaries only the use of mean values was justified—although seasonal means appeared to be better than
overall means for many of them.
There is also the difficulty that new measured data were not available for the 30+ ‘smaller’ and
groundwater tributaries to the Lake. To help clarify the situation, LKSIM simulation runs were made using
the concentration-flowrate-season equations for the ‘larger’ tributaries and then simulation runs using just
overall means or else seasonal means for those tributaries where seasonal effects were found to be
appreciable. It was found that there was very little difference in nutrient loadings between the two
approaches and so the decision was made to just use the means run for the final results. It also should be
noted that the means used (tabulated in Table C-2) are not precisely the calculated means, but rather
means that were estimated ‘by eye’ from the plots where Dr. Merritt, who has had many years of
experience working with these types of data in the Utah Lake area, worked at discounting ‘wild’ points and
giving slightly more weight to the higher flowrate points since they have a greater influence on the total
loadings.
Interested Parties: To obtain the EXCEL files containing the data plots and curve fitting—contact Dr. Merritt