Nutrient flows in small-scale bio-energy use in developing...
45
L.T.C. Bonten and J.H.M. Wösten Alterra Report 2304 ISSN 1566-7197 Nutrient flows in small-scale bio-energy use in developing countries
Transcript of Nutrient flows in small-scale bio-energy use in developing...

More information: www.alterra.wur.nl/uk L.T.C. Bonten and J.H.M. Wösten
Alterra Report 2304
ISSN 1566-7197
Nutrient flows in small-scale bio-energy use in developing countries
Alterra is part of the international expertise organisation Wageningen UR (University & Research centre). Our mission is ‘To explore the potential of nature to improve the quality of life’. Within Wageningen UR, nine research institutes – both specialised and applied – have joined forces with Wageningen University and Van Hall Larenstein University of Applied Sciences to help answer the most important questions in the domain of healthy food and living environment. With approximately 40 locations (in the Netherlands, Brazil and China), 6,500 members of staff and 10,000 students, Wageningen UR is one of the leading organisations in its domain worldwide. The integral approach to problems and the cooperation between the exact sciences and the technological and social disciplines are at the heart of the Wageningen Approach.
Alterra is the research institute for our green living environment. We offer a combination of practical and scientific research in a multitude of disciplines related to the green world around us and the sustainable use of our living environment, such as flora and fauna, soil, water, the environment, geo-information and remote sensing, landscape and spatial planning, man and society.


Nutrient flows in small-scale bio-energy
use in developing countries

This publication was commissioned and supported by FACT Foundation

Nutrient flows in small-scale bio-energy use in developing countries
L.T.C. Bonten and J.H.M. Wösten
Alterra Report 2304 Alterra, part of Wageningen UR Wageningen, 2012

Abstract Bonten, L.T.C. and J.H.M. Wösten, 2012. Nutrient flows in small-scale bio-energy use in developing countries. Wageningen, Alterra, Alterra Report 2301. 42 pages; 10 fig.; 21 tab.; 22 ref. This study explored the opportunities for the retention and return of nutrients in local bio-energy production using energy crops (oil palm, jatropha and cassava), fuel wood, manure, rice husks and a common pest plant (water hyacinth). For all bio-energy systems some return of nutrients is possible, but the differences between conversion technologies and between feed stocks can be large. Anaerobic digestion retains most nutrients, while combustion and gasification loses all nitrogen. Palm oil has the lowest potential for nutrient return of the energy crops; however it is the most efficient, together with cassava, regarding the required nutrient input per mega joule of bio-energy. Jatropha is the least efficient energy crop, it requires the most nutrients to produce a mega joule of energy. Keywords: bio-energy, nutrients, soil quality
ISSN 1566-7197 The pdf file is free of charge and can be downloaded via the website www.alterra.wur.nl (go to Alterra reports). Alterra does not deliver printed versions of the Alterra reports. Printed versions can be ordered via the external distributor. For ordering have a look at www.rapportbestellen.nl. © 2012 Alterra (an institute under the auspices of the Stichting Dienst Landbouwkundig Onderzoek) P.O. Box 47; 6700 AA Wageningen; The Netherlands, [email protected]
– Acquisition, duplication and transmission of this publication is permitted with clear acknowledgement of the source.
– Acquisition, duplication and transmission is not permitted for commercial purposes and/or monetary gain.
– Acquisition, duplication and transmission is not permitted of any parts of this publication for which the copyrights clearly rest
with other parties and/or are reserved. Alterra assumes no liability for any losses resulting from the use of the research results or recommendations in this report. Alterra Report 2304 Wageningen, April 2012

Contents
Summary 7
1 Introduction 9
2 Small scale bio-energy systems 11 2.1 Sources of bio-energy 11 2.2 Technologies 11
3 Bio-energy systems 13 3.1 Approach 13 3.2 Wood combustion 15 3.3 Manure combustion 17 3.4 Anaerobic digestion of manure 19 3.5 Rice husks 21 3.6 Ethanol from cassava 23 3.7 Oil palm 26 3.8 Jatropha (PPO) 29 3.9 Anaerobic digestion of aquatic pest plants (water hyacinths) 31
4 Evaluation of systems 33 4.1 Potential nutrient return 33 4.2 Energy yield and energy efficiency 35
5 Conclusions 37
References 39
Appendix 1 MonQI toolbox, monitoring resource flows in small-scale bioenergy systems 41


Alterra Report 2304 7
Summary
Currently, large mondial flows of biomass are promoted by authorities to increase the content of bio-energy in the total energy supply. Biomass exports are further stimulated by development programs on biomass production to stimulate local, rural economies. Because biomass not only contains energy but also nutrients, these biomass exports lead to exports of nutrients and consequently to depletion of soil fertility in those areas where the biomass is produced. This eventually leads to reduced crop yields or to large scale use of chemical fertilizers. Furthermore, the export of biomass can lead to reduction of the soil organic matter, because plant organic material is no longer returned to the soil. This also leads to a further deterioration of soil quality. In contrast to export of biomass for energy, local production of bio-energy might enable the retention of nutrients and organic matter within the system. In this study we explored the opportunities for the retention and return of nutrients in local bio-energy production. This study included three energy crops (oil palm, jatropha and cassava), fuel wood, manure, rice husks as a waste product and water hyacinth, a common pest plant. We found that, for all bio-energy systems some return of nutrients is possible. Yet there can be large differences between conversion technologies and between feed stocks. With anaerobic digestion almost all nutrients can normally be retained, while with combustion and gasification all nitrogen is lost to the atmosphere and also small part of phosphorus and potassium. However, feed stocks or residues that have high lignin and cellulose contents, e.g. rice husks and wood, cannot easily be digested anaerobically and need to be treated otherwise. Of the bio-energy crops, palm oil has the lowest potential for nutrient return, especially nitrogen, because residues are frequently combusted leading to losses of nitrogen. In contrast, when the required nutrient input per mega joule of bio-energy is calculated, palm oil, together with cassava, is the most efficient due to its high bio-energy (i.e. palm oil and ethanol) production. Now jatropha is the least efficient energy crop, it requires the most nutrients to produce a mega joule of energy.

8 Alterra Report 2304
Alterra Report 2304 9
1 Introduction
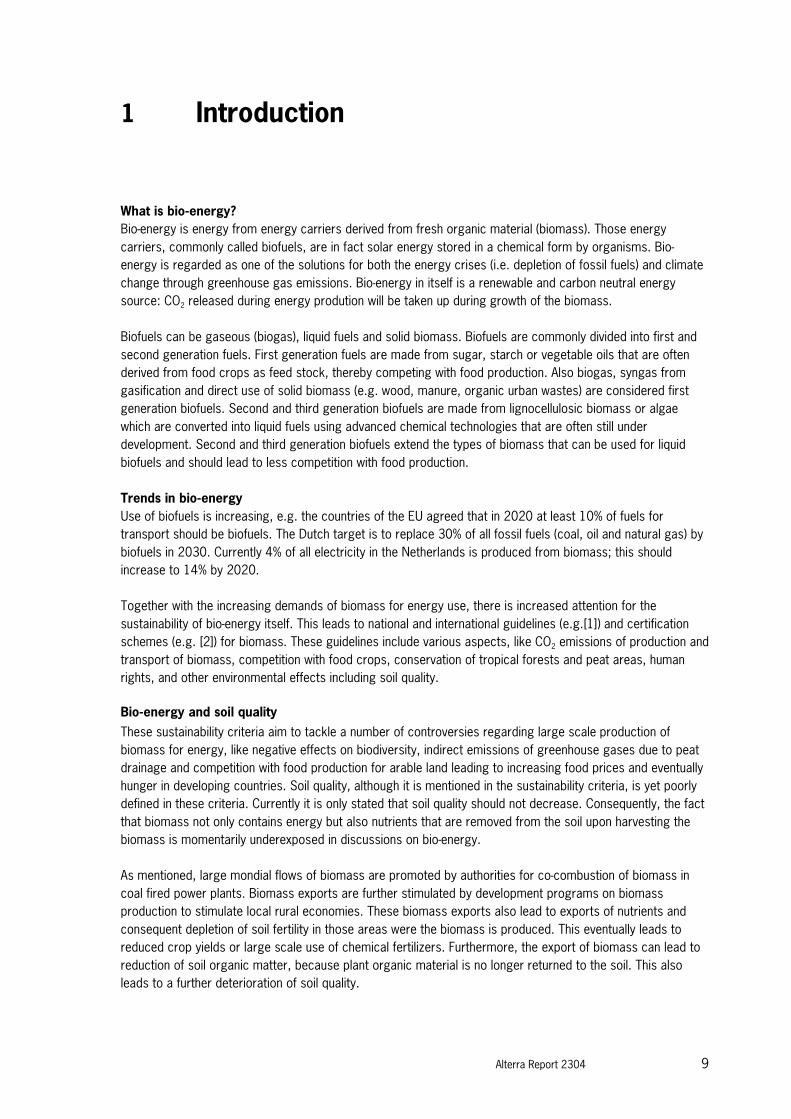
What is bio-energy? Bio-energy is energy from energy carriers derived from fresh organic material (biomass). Those energy carriers, commonly called biofuels, are in fact solar energy stored in a chemical form by organisms. Bio-energy is regarded as one of the solutions for both the energy crises (i.e. depletion of fossil fuels) and climate change through greenhouse gas emissions. Bio-energy in itself is a renewable and carbon neutral energy source: CO2 released during energy prodution will be taken up during growth of the biomass. Biofuels can be gaseous (biogas), liquid fuels and solid biomass. Biofuels are commonly divided into first and second generation fuels. First generation fuels are made from sugar, starch or vegetable oils that are often derived from food crops as feed stock, thereby competing with food production. Also biogas, syngas from gasification and direct use of solid biomass (e.g. wood, manure, organic urban wastes) are considered first generation biofuels. Second and third generation biofuels are made from lignocellulosic biomass or algae which are converted into liquid fuels using advanced chemical technologies that are often still under development. Second and third generation biofuels extend the types of biomass that can be used for liquid biofuels and should lead to less competition with food production.
Trends in bio-energy Use of biofuels is increasing, e.g. the countries of the EU agreed that in 2020 at least 10% of fuels for transport should be biofuels. The Dutch target is to replace 30% of all fossil fuels (coal, oil and natural gas) by biofuels in 2030. Currently 4% of all electricity in the Netherlands is produced from biomass; this should increase to 14% by 2020. Together with the increasing demands of biomass for energy use, there is increased attention for the sustainability of bio-energy itself. This leads to national and international guidelines (e.g.[1]) and certification schemes (e.g. [2]) for biomass. These guidelines include various aspects, like CO2 emissions of production and transport of biomass, competition with food crops, conservation of tropical forests and peat areas, human rights, and other environmental effects including soil quality. Bio-energy and soil quality These sustainability criteria aim to tackle a number of controversies regarding large scale production of biomass for energy, like negative effects on biodiversity, indirect emissions of greenhouse gases due to peat drainage and competition with food production for arable land leading to increasing food prices and eventually hunger in developing countries. Soil quality, although it is mentioned in the sustainability criteria, is yet poorly defined in these criteria. Currently it is only stated that soil quality should not decrease. Consequently, the fact that biomass not only contains energy but also nutrients that are removed from the soil upon harvesting the biomass is momentarily underexposed in discussions on bio-energy. As mentioned, large mondial flows of biomass are promoted by authorities for co-combustion of biomass in coal fired power plants. Biomass exports are further stimulated by development programs on biomass production to stimulate local rural economies. These biomass exports also lead to exports of nutrients and consequent depletion of soil fertility in those areas were the biomass is produced. This eventually leads to reduced crop yields or large scale use of chemical fertilizers. Furthermore, the export of biomass can lead to reduction of soil organic matter, because plant organic material is no longer returned to the soil. This also leads to a further deterioration of soil quality.

10 Alterra Report 2304
The importance of nutrients in energy crop production is nicely illustrated by the following two examples: i. Jatropha has been regarded as a very promising crop for bio-energy. It produces nuts with a high
vegetable oil content. The plant is toxic and inedible and does not compete with food production. Futher, jatropha can grow on very poor soils. However, a large production of oil can only be achieved with sufficient availability of nutrients [3].
ii. Littter and branches from European forest were harvested in pre-industrial times for fuel purposes. Together with the energy contained in the litter and branches also the nutrients in them were removed from the forests. The nutrient removal led to reduced growth of the forest and poor quality of the forests.
In contrast to large scale bio-energy production, local small scale use and production of bio-energy might enable the retention of the nutrients and organic matter within the system. Unfortunately, also for small scall bio-energy production nutrients are currently seldomly retained and losses at farming level are not compensated. Objectives The objective of this study is to make a system analysis of nutrients flows and losses in small-scale use and production of bio-energy in rural areas of developing countries. With this system analysis we try to identify opportunities for returning nutrients to the soil in order to maintain soil fertility. This project will analyse a number of different systems of bio-energy use on flows of the macro nutrients nitrogen (N), phosphate (P) and potassium (K). Organic matter effects will be mentioned but not quantified. The focus of this study is on small scale bio-energy production and use, this means households, local communities, small farms or enterprises.

Alterra Report 2304 11
2 Small scale bio-energy systems
2.1 Sources of bio-energy
For small scale application in developing countries, bio-energy can be produced from various sources. Bio-energy crops First of all, the bio-energy crops which are especially grown for the production of energy. These energy crops include oil containing crops like palm oil and jatropha. The oil from these crops (the so-called pure plant oil or PPO) can be directly used for heating or electricity production. Another well-known energy crop is sugar cane, from which the sugar is fermented to produce ethanol, which can be used as automotive fuel (e.g. in Brazil). A third type is woody plants, from which the wood is incinerated or turned into charcoal both used for cooking and heating. A small difference with other energy crops is that wood is hardly grown for energy reasons, but instead small wood is gathered from forests. Agricultural residues A second source of bio-energy can be agricultural or agro-industrial waste products, like rice husks, coffee grounds or crop residues. Energy from these sources can be released through gasification or incineration. Wet sources with little lignin or cellulose can also be anaerobically digested thereby producing biogas (= methane). In some areas in especially India and Ethiopia, manure is used for heating and cooking. Hereby the manure is dried and subsequently burned. An alternative use is biogas from the anaerobic digestion of wet manure. Invasive species and weeds A third source of bio-energy can be invasive plant species. Hereby plants that are foreign to a certain area and that are generally fast growing pest plants, are harvested and used for energy production. A well-studied example is the water hyacinth which is an aquatic plant from South America that has been introduced to Africa. In eutrophic lakes this plant can grow fast and can lead to clogging of water ways. 2.2 Technologies
Several technologies exist to convert plant biomass into energy or fuel. Which technology is the most suitable depends on the type of biomass source. Also each technology has its own effects on the nutrients that are contained in the source material. Below we give a short overview of the most common technologies for biomass to energy conversion. Vegetable oil Vegetable oil (PPO) can be directly achieved from milling of the oil containing plant parts. The oil can then be used for heating or for the production of electricity. The milling residues (the press cake) and other plant residues can be further processed by digestion, incineration or gasification to produce additional energy. Generally the oil itself contains very little nutrients. Almost all nutrients are contained in the residues. The fate of these nutrients depends on the technology that is used for processing these residues (see below).

12 Alterra Report 2304
Fermentation Starchy or sugar rich biomass can be fermented to produce ethanol also a liquid biofuel. Also here the ethanol itself and its predecessor the sugar solution contain very little nutrients, which are thus retained in the processing residues. Similar to PPO the fate of the nutrients depends on the methods for residue handling. Starchy biomass has to be converted into sugar before fermentation. Anaerobic digestion Anaerobic digestion is in general the most suitable for wet easily degradable biomasses. Here in an oxygen-free environment bacteria convert the biomass to methane and carbon dioxide, the so-called biogas. What remains is a digestate that contains almost all nutrients. Most organic nitrogen from the source material is mineralised and has been converted to ammonium (NH3) which is more susceptible to evaporation or leaching. Gasification and incineration Biomass which is rich in lignin and hemicellulose cannot be easily degraded by micro-organisms. Consequently, physico-chemical technologies are then used to convert biomass to energy. The two most applied technologies are gasification and incineration. Gasification converts organic materials into carbon monoxide, hydrogen, carbon dioxide and methane, by reacting the material with a small amount of oxygen at high temperatures (>700 °C), without combustion. The gas produced from gasification is called syngas and can be used for heating or electricity production. Gasification produces ashes and tars as waste products. With incineration biomass is directly combusted to produce heat. After combustion fly and bottom ashes remain; fly ashes can be emitted to the atmosphere depending on the incineration technology. Because of the high temperatures in both gasification and incineration, nitrogen is converted to gaseous forms, mainly elemental nitrogen N2, which is non-reactive and not a nutrient anymore. Phosphate and potassium are mainly retained in the ashes, although some part can be lost to the atmosphere with fly ashes. Different from the aforementioned technologies, gasification and incineration convert all organic carbon to CO2, which means that after treatment the biomass sources can no longer be used to improve or maintain the organic matter contents of the soil. Other technologies Besides the technologies that have been mentioned above several more advanced technologies have been developed or are being developed to convert biomass into energy. These include bioethanol from lignocellulose biomass, hydrothermal upgrading which converts wet biomass under high pressure and temperature to liquid biofuels and biofuels from algae. Because most of these so-called second and third generation technologies are very advanced they are not very suitable for small scale applications in developing countries. Consequently, they will not be further addressed in this study.

Alterra Report 2304 13
3 Bio-energy systems
3.1 Approach
Studied systems In this study we will describe the nutrient flows for several of the most common or most promising bio-energy systems that can be applied on a small scale in developing countries. These bio-energy systems are:
• combustion of wood • combustion of manure • anaerobic digestion of manure • gasification of rice husks • PPO from jatropha, including processing of waste products • PPO from oil palm, including processing of waste products • anaerobic digestion of water hyacinth • ethanol from cassava
Nutrient cycling In order to grow a plant takes up nutrients from the soil. Nutrient containing residues from plants (here: energy crops) can be returned to the soil thereby reducing the fertilization requirements for the crops. A fully closed cycle is however not possible due to i) losses of nutrients within the production of energy from the crops and ii) losses from the soil compartment. This study focusses on the first part, i.e. how nutrients can be retained within the energy production processes. Losses from the soil are to some extent inevitable due to natural processes like leaching of dissolved nutrients and denitrification (the transformation of nitrate to gaseous nitrogen, NO3 → N2). These are dependent on numerous factors like soil properties, climate, fertilization strategy, etc. This study won’t further discuss these losses from the soil or methods to reduce them. Organic matter cycling All soils contain to some extent decomposed plant material, the so-called soil organic matter. This soil organic matter is important for the functioning of the soil because i) it provides physical structure to the soil which prevents erosion of the soil, ii) it can retain water in the soil which prevents the soil from drying out easily and iii) it can bind nutrients which prevents leaching of nutrients out of the rooting zone. Soil organic matter has to be replenished regularly because it is broken down by micro-organisms in the soil. Now when too much of a plant’s biomass is removed and not returned to the soil, the soil organic matter contents will finally decrease. Therefore this study also looks which residues from bio-energy production can be returned to replenish soil organic matter. Evaluation of technologies The nutrient aspects of the selected bio-energy system are evaluated in several ways. First, this study compares the nutrient flows with the nutrient requirements of the bio-energy crops if applicable and with the nutrient requirement of three common food crops: rice, beans and maize. This enables to address potential return of other use of nutrients available from bio-energy systems. And, we compare the amounts of energy that are required to produce a fixed amount of energy.

14 Alterra Report 2304
Flow diagrams The following sections describe the mass and nutrient flows for the selected bio-energy systems. For each system we give a flow diagram and the nutrient contents of all mass flows. The flow diagrams contain the following boxes and arrows:
feed stock, intermediate products and residues
soil
processes
energy
non-energy products
biomass flow
potential return, inputs and losses of nutrients
Calculation of nutrient return and energy production At the end of the description of a bio-energy system the potential nutrient return and the energy production are calculated. The potential nutrient return is calculated as percentage of the nutrient requirements for growing the energy crop. For wood, manure and water hyacinths we calculated the nutrient return as percentage of the original nutrient contents. The potential nutrient for energy crops is calculated as follows:
nutrient return=yield per hectare × ∑(nutrient content of residue × relative mass of residue)
nutrient requirements per hectare× 100%
The energy production is calculated as follows: energy production per hectare=yield per hectare × ∑(energy content of product × relative mass of product) In these calculations the losses within the processes, e.g. during transport or storage, have been neglected. These losses can be substantial, but will above all depend on the care taken during the process. This makes these losses hard to quantify and for this they cannot be easily included in the calculations. The calculations therefore give the best case values for nutrient return and energy production.

Alterra Report 2304 15
3.2 Wood combustion
In developing countries wood is frequently used for heating and cooking. The wood is either used directly in simple stoves or first turned into charcoal which is used subsequently for cooking. The figure below depicts the mass flow for direct burning; nutrient losses for charcoal will be similar.
Table 1
Mass and nutrient flows for fuel wood combustion.
pool dry weight
(% of feedstock)
N (%) P (%) K (%) org. matterb
(%)
feed stocks
stems [4] - 0.11-0.16 0.011-0.016 0.06-0.17 100
branches [4] 100 0.29-0.62 0.034-0.07 0.15-0.23 100
residues
ashes [5]a 3-5 0 0.6-1.3 5.9-7.5 0
a P and K can be lost to the air with fly ashes. Here we assumed that fly ashes are 5% of total ashes. K contents in fly ashes of
wood are generally higher than in bottom ashes, P contents are generally lower [6] b this column contains the structural organic matter that can be returned to the soil to replenish the soil organic matter
The table below shows the energy produced and potential nutrient return for fuel wood combustion.
nutrient losses from the soil
Incineration Fuel wood
Ashes
emissions to atmosphere
Trees
Heat
Soil fertilization

16 Alterra Report 2304
Table 2
Energy produced and potential nutrient return for fuel wood combustion.
energy production and nutrient return
total energy produced 19 MJ/kg dry wood [5]
nutrient return (relative to nutrient
contents of feedstock)
0% N 64% P 80% K

Alterra Report 2304 17
3.3 Manure combustion
In many areas in India and Africa manure, mainly cow dung, is used as a fuel. After drying the manure is combusted in a stove.
Table 3
Mass and nutrient flows for manure combustion.
pool dry weight
(% of feedstock)
N (%) P (%) K (%) org matter (%)
feed stocks
manure 100 2.3-2.7 0.85 0.53 100
residues
ashes[7] 11a 0 7.3 4.5 0
a P and K can be lost to the air with fly ashes. Here we assumed that fly ashes are 5% of total ashes and that composition of fly and
bottom ashes are similar.
The table below shows the energy produced and the potential nutrient return for manure combustion. The nutrient return has been calculated from the average masses and nutrient contents of feedstock and residues.
Combustion
emissions to the atmosphere
(CO2, N, fly ashes)
Cattle Heat Grass
Animal products
Ashes
Manure
Soil
nutrient losses
from the soil
fertilization

18 Alterra Report 2304
Table 4
Energy produced and potential nutrient return for manure combustion.
energy production and nutrient return
total energy produced 10.5-11.3 MJ/kg dry manure [8]
nutrient return (relative to nutrient
contents of feedstock)
0% N 95% P 95% K

Alterra Report 2304 19
3.4 Anaerobic digestion of manure
As an alternative to the direct use of manure for fuel, manure can be anaerobically digested to produce biogas. This biogas consists mainly of methane and carbon dioxide. Biogas production has several advantages compared to manure combustion: • biogas is a much cleaner fuel than manure leading to a better indoor air quality when used for cooking; • most organic carbon is preserved in the digestate, which can then be used to maintain or improve soil
organic carbon levels; • most nitrogen is retained in the digestate, which can thus be used as a nitrogen fertilizer. Anaerobic digestion of manure is applied in developed countries both to reduce manure volumes and to produce biogas. Frequently other organic waste streams are co-digested together with the manure. In developing countries small scale manure digestion increases.
Table 5
Mass and nutrient flows for manure digestion.
pool dry weight
(% of feedstock)
N (%) P (%) K (%) org matter (%)
feed stocks
manure 100 2.3-2.7 0.85 0.53 100
products
biogas 30 (80 vol% CH4) 0 0 0 0
residues
digestatea 70 3.3-3.9 1.2 0.76 70
a In modern large scale anaerobic digestion systems emissions through evaporation and leaching are very small. In small scale
systems in developing countries, emissions occur but have not been quantified so far
NH3 to atmosphere
Cattle Biogas Grass
nutrient leaching
Animal products
Digestate
Manure Anaerobic digestion
Soil
nutrient losses from
the soil
fertilization

20 Alterra Report 2304
The table below gives an example calculation for the energy produced and the potential nutrient return for anaerobic manure digestion. The nutrient return has been calculated from the average masses and nutrient contents of feedstock and residues.
Table 6
Energy produced and potential nutrient return for anaerobic manure digestion.
energy contents
biogas 50 MJ/kg methane equal to 29.7 MJ/kg biogas
energy production and nutrient return
total energy produced 8.9 MJ/kg dry manure [9]
nutrient return (relative to nutrient
contents of feedstock)
100% N 100% P 100% K

Alterra Report 2304 21
3.5 Rice husks
Rice husk is a rest product produced during rice threshing in mainly Asian countries. With each 1000 kg rice harvested approximately 200 kg rice husk are produced (20%). In Asia rice husk is partly used as energy source for processes in the rice production but also as energy source for public energy as well as soil ameliorator. Due to its low density of approximately 100 kg/m3 transport of rice husk is relatively expensive. It is estimated that worldwide 38 to 57 Million tons of rice husk is available for energy production. A processing capacity of at least 100 ton rice per day is considered to be essential to turn a rice mill into an interesting source of rice husk for the production of energy. Due to its abrasive character, poor nutritive value, low bulk density and high ash content of typically 13%, only a small proportion of rice husks has been utilized for non-energy related low value applications, such as chicken litter, animal roughage, mulching and bedding materials. So far in many Asian countries, where the bulk of rice is produced and consumed, a major proportion of the husks in transported to open fields for disposal by burning.
Table 7
Mass and nutrient flows for rice husk gasification.
pool dry weight
(% of feedstock)
N (%) P (%) K (%) org. matter (%)
feed stocks
rice husk [10, 11] 100 0.7 0.049 0.166 100
residues
ashes [10, 12] 13 0 0.32-0.46 0.88-1.50 0
The table below gives an example calculation for the total energy production and potential nutrient return for rice husk gasification from one ha of rice. The nutrient return has been calculated from the average masses and nutrient contents of feedstock and residues.
emissions to the atmosphere
Rice milling Syngas Rice
plants
Rice
Ashes
Rice husks Gasification
Soil
nutrient losses from the soil
fertilization

22 Alterra Report 2304
Table 8
Energy produced and potential nutrient return for rice husk gasification.
cropping characteristics
yield [13] 4 ton raw grains/ha 0.8 ton husks/ha
fertilizer requirements [13] 50 kg N/ha 30 kg P2O5/ha 30 kg K2O/ha
energy contents
syngas [10] 13.5 MJ/kg rice husk
energy production and nutrient return
energy produced 13.5 MJ/kg rice husk 10.8 GJ/ha
nutrient return (relative to fertilizer
requirements)
0% N 15% P 25% K

Alterra Report 2304 23
3.6 Ethanol from cassava
Cassava is generally grown by poor farmers living in marginal areas with adverse climatic and soil conditions. The crop is very suitable for these conditions because of its exceptional tolerance to drought and to acid, infertile soils. It is often grown on sloping land because of its minimal requirement for land preparation, and its ability to produce reasonably good yields on eroded and degraded soils, where other crops would fail. Cassava yields well on soils of relatively low fertility where the cultivation of other crops would be uneconomical. Such growth conditions are widely available throughout the Tropics, especially in Africa. Cassava is the third largest source of carbohydrates for human consumption in the world, due to its efficient growth, year round availability, its tolerance to extreme stress and its suitability to be incorporated into traditional low input farming systems, which predominate in Africa. Recently, the cultivation of cassava for the production of ethanol has been intensified. In situations where water availability is limited (i.e. not enough for the cultivation of sugar cane), cassava is the preferred feedstock for ethanol production. The technology of producing ethanol from starch is well developed. Under optimal conditions ethanol yield from cassava is the highest of all the main ethanol crops (up to 6 t/ha). Moreover, a cassava ethanol plant requires less complex processing equipment resulting in lower investments compared to common ethanol crops like sugar cane.
Ethanol
Cassava roots
Distillation
CO2
leaves, stems
Fermentation
Saccharification
Milling Animal feed
(DDGS)
Waste water
Anaerobic digestion Biogas Digestate Soil
Solid wastes
(vinasses)
Cassava
nutrient losses from the soil
fertilizer

24 Alterra Report 2304
Table 9
Mass and nutrient flows for ethanol from cassava.
pool dry weight
(% of feedstock)
N (%) P (%) K (%) org matter
(% of feedstock)
feed stocks
tubers 100 0.42 0.10 0.71 100
intermediates
solid wastes [14] 30 1.4 0.33 2.4 30
products
ethanol [14]a 38 0 0 0 0
biogasb 24 0 0 0 0
residues
digestatec 6 7.0 1.7 11.8 6
a assuming an ethanol production of 170 l/ton fresh cassava and dry weight for cassava of 35% b assuming that 80% of the waste (waste water + vinasses) can be digested to biogas c nutrient contents calculated from nutrient contents in feed stock
In bioethanol production cassava roots are peeled off, washed and grounded to get a mix that in successive stages is put into kilns and tanks for starch saccharification, in processes similar to those used for corn bioethanol. With industrial productivity rates similar to those for corn, one ton of non-processed cassava with around 30% of starch allows producing 170 litres of bioethanol. Waste stream can be treated differently. Currently, the solid fraction of the waste streams, the so-called vinasses are dried to obtain ‘distiller dried grain with solubles (DDGS)’ which is mainly used as animal feed, while the waste water is treated by anaerobic digestion. The vinasses however can also be anaerobically digested to produce biogas or directly used as fertilizer. The waste water is commonly treated by anaerobic digestion. The table below gives an example calculation for the total energy production and potential nutrient return for ethanol from one ha of cassava. The nutrient return has been calculated from the average masses and nutrient contents of feedstock and residues. In the calculations we assume maximum energy production, which means that vinasses are also anaerobically digested.

Alterra Report 2304 25
Table 10
Energy produced and potential nutrient return for ethanol from cassava.
cropping characteristics
yield [13] 15 ton cassava tubers ≈ 5.3 ton dry matter
fertilizer requirements [13] 100 kg N/ha 60 kg P2O5/ha 115 kg K2O/ha
energy contents
ethanol 22 MJ/kg ethanol
biogas 50 MJ/kg methane ≈ 29.7 MJ/kg biogas
energy production and nutrient return
energy produced (ethanol) 8.4 MJ/kg dry feedstock 44.3 GJ/ha
energy produced (biogas) 7.1 MJ/kg dry feedstock 37.8 GJ/ha
energy produced (total) 15.5 MJ/kg dry feedstock 82.1 GJ/ha
nutrient return (relative to fertilizer
requirements)
63% N 58% P 100% K
At this moment sugar cane is the most common crop to product ethanol for fuel purposes in developing countries. Ethanol from cassava differs in several ways from ethanol from sugar cane. Regarding nutrient and organic matter recycling the most important differences are: • Ethanol production from sugar cane is older than ethanol production from cassava. Consequently
processes and techniques are more advanced in the case of sugar cane. Also nutrient recycling is very efficient in modern sugar cane production. At the same time cassava based ethanol producing countries such as Thailand are eager to learn from the sugar cane based ethanol producer Brazil.
• In cassava, fresh roots are harvested whereas the other plant material remains at the field. The traditional harvest system of sugar cane - which is still used in nearly 70% of sugarcane crops in Brazil - involves the previous burning of the sugarcane crop and the manual cut of the whole stalk sugarcane. Because of the burning, organic matter from the sugar cane leaves is not returned to the soil. Currently this system is progressively replaced by the mechanized harvest of green chopped sugarcane (without burning), due to environmental restrictions on burning practices. Recent agreements between the government and producers made for an estimate of all sugarcane to be mechanically harvested by 2020, without previously burning the sugarcane crop.

26 Alterra Report 2304
3.7 Oil palm
Among the major vegetable oils, palm oil has the lowest production costs, and is therefore expected to make a large contribution to growth in demand for edible vegetable oil with an increase in planted area of up to 12 M ha (or about 300,000 ha yr-1) over the next 40 years [15]. If all expansion takes place in Indonesia and Malaysia this would result in a 140% increase in the area under harvest from 8.4 M ha to 20.4 M ha (2050) [16]. If oil palm is used for biofuel as well as a food, however, the increase in demand could be much greater but this will depend upon mandates and incentives for inclusion of vegetable oil in biodiesel [17]. Over the past forty years, whilst the area of oil palm planted and in production in Indonesia has expanded almost exponentially from about 80,000 ha in 1965 to 4.6 M ha in 2007, yields have stagnated since the 1970s at about 17 t ha-1 fruit bunches, equivalent to 3.8 t ha-1 crude palm oil (CPO) [16]. Establishing oil palm on land carrying a small amount of biomass, discouraging oil palm on peat lands which provide essential services as reservoirs of biodiversity, water and carbon, and closing the gap between potential and present yields will improve the performance of oil palm production against the sustainability criteria proposed by RSPO [18].
Palm oil production comprises of several different steps and processes which lead consequently to a number of waste streams. In modern palm oil production most of these waste streams are used relative efficiently. Empty fruit bunches and old less-productive trees are commonly mulched and returned to the soil as fertilizer. Also the palm oil mill effluent (POME) is normally used a fertilizer. The fruit shells and fibres from the palm mill
Fruits
Oil
Steam
Palm kernel oil
Heat
Milling
Ashes
Incineration
Soil
Palm kernel cake
Oil palms
Empty fruit bunch
Fresh fruit bunch
Palm kernels
Fruit shells,fibres
Palm oil mill effluent
(POME)
fertilizer
leaves, stems
nutrient losses from the soil

Alterra Report 2304 27
are incinerated and part of the heat is used to produce steam to separate the fruits from the fruit bunches. The remaining heat can be used to produce electricity for the mill or the local community. Table 11
Mass and nutrient flows for palm oil.
pool dry weight
(% of feedstock)
N (%) P (%) K (%) org. matter (%)
feed stocks
fresh fruit bunch (FFB)a 100 0.54 0.04 0.12 100
trunks 18 0.56 0.05 1.62 18
roots 30 0.32 0.03 0.80 30
intermediates
empty fruit bunch [19] 13 0.80 0.06 0.24 13
fibre [19] 14 2.30 0.01 0.20 14
shells [19] 9 0.55 0.17 [20] 0.13 [20] 9
palm oil mill effluent [19] 23 0.11 0.005 0.02 23
palm kernel cake [19] 2 2 0.70 2 2
products
crude palm oil 34 - - - 0
kernel oil 4 - - - 0
residues
ashesb 0.9 0 1.8 4.3 0
a calculated based on nutrient contents of intermediates b dry weight is assumption. Nutrient contents calculated from contents of fibres and shell
The table below gives an example calculation for the total energy production and potential nutrient return for palm oil production from one ha of oil palm. The nutrient return has been calculated from the average masses and nutrient contents of feedstock and residues. In the calculations we assume that empty fruit bunches are used as fertilizer (the most common practice).

28 Alterra Report 2304
Table 12
Energy produced and potential nutrient return for palm oil production.
cropping characteristics
yield [19] 30 ton fresh fruit bunches (dry matter)/ha
fertilizer requirementsa 222 kg N/ha 32 kg P2O5/ha 240 kg K2O/ha
energy contents
crude palm oil 39 MJ/kg palm oil
milling residues [5] 10-18 MJ/kg fibres/shells
energy production and nutrient return
energy produced (palm oil) 13.3 MJ/kg FFB 398 GJ/ha
energy produced (heat) 3.2 MJ/kg FFB 97 GJ/ha
energy produced (total) 16.5 495 GJ/ha
nutrient return (relative to fertilizer
requirements)
44% N 91% P 91% K
a calculated from nutrient uptake and nutrient loss of 10%

Alterra Report 2304 29
3.8 Jatropha (PPO)
Jatropha (Jatropha curcas L.) is a (sub)tropical plant that produces seeds with high oil contents. Jatropha is regarded as a promising crop for the production of vegetable oil for biofuel. Most important is that jatropha can grow on marginal soil with little input of nutrients. Because of this, it can help to reclaim degraded lands and restore eroded areas or prevent erosion. Further, because the leaves and seeds are inedible, it is traditionally used in hedges to protect arable land and housing from cattle. Residues from the oil milling can be used for further biofuel production by either anaerobic digestion (fruit hulls and press cake) or gasification (fruit hulls). Despite that jatropha can grow on poor soils, more recent studies on jatropha have however shown that a high productivity requires adequate fertilisation in the case of poor soils.
Milling Oil
Anaerobic digestion
Biogas
DigestateNH3 to atmosphere
nutrient leaching
Dehulling
Seeds
Fruits
Press cakeFruit hullsfertilizer
nutrient losses from the soil
Soil
Jatrophaplants

30 Alterra Report 2304
Table 13
Energy production and nutrient flows for jatropha oil
pool dry weight
(% of feedstock)
N (%) P (%) K (%) C (%)
feed stocks
fruitsa 140 1.9 0.36 1.7 140
intermediates
seedsb 100 2.3 0.5 0.98 100
fruit hulls [3] 40 0.19-0.70 0.01-0.047 0.31-1.58 40
press cakeb 74 3.1 0.68 1.32 74
products
oil 26 - - - 0
biogas from press cakec 32 0 0 0 0
biogas from fruitshellsd 17 0 0 0 0
residues
digestatee 65 3.8 0.79 2.1 65
a calculated from nutrient contents of seeds and hulls b calculated from nutrient contents of kernels and seed shells [3] c assuming a biogas production 450 m3/ton press cake, with CH4 content of 80 vol% d assuming that biogas production from fruit hulls is similar to biogas from press cake e calculated from nutrient contents of press cake and fruit hulls
The table below shows an example calculation for the energy production and potential nutrient return from jatropha. Table 14
Energy produced and potential nutrient return for jatropha oil production
cropping characteristics
yield [21] 1.5 ton/ha dry seeds
fertilizer requirements [21] 57 kg N/ha 18 kg P2O5/ha 84 kg K2O/ha
energy contents
vegetable oil [21] 36 MJ/kg jatropha oil
biogas [21] 50 MJ/kg methane ≈ 29.7 MJ/kg biogas
energy production and nutrient return
energy produced (oil) 9.4 MJ/kg dry seeds 14.2 GJ/ha
energy produced (biogas) 14.6 MJ/kg dry seeds 21.8 GJ/ha
total energy produced 24.0 MJ/kg dry seeds 36.0 GJ/ha
nutrient return (relative to fertilizer
requirements)
65% N 98% P 29% K
Alterra Report 2304 31
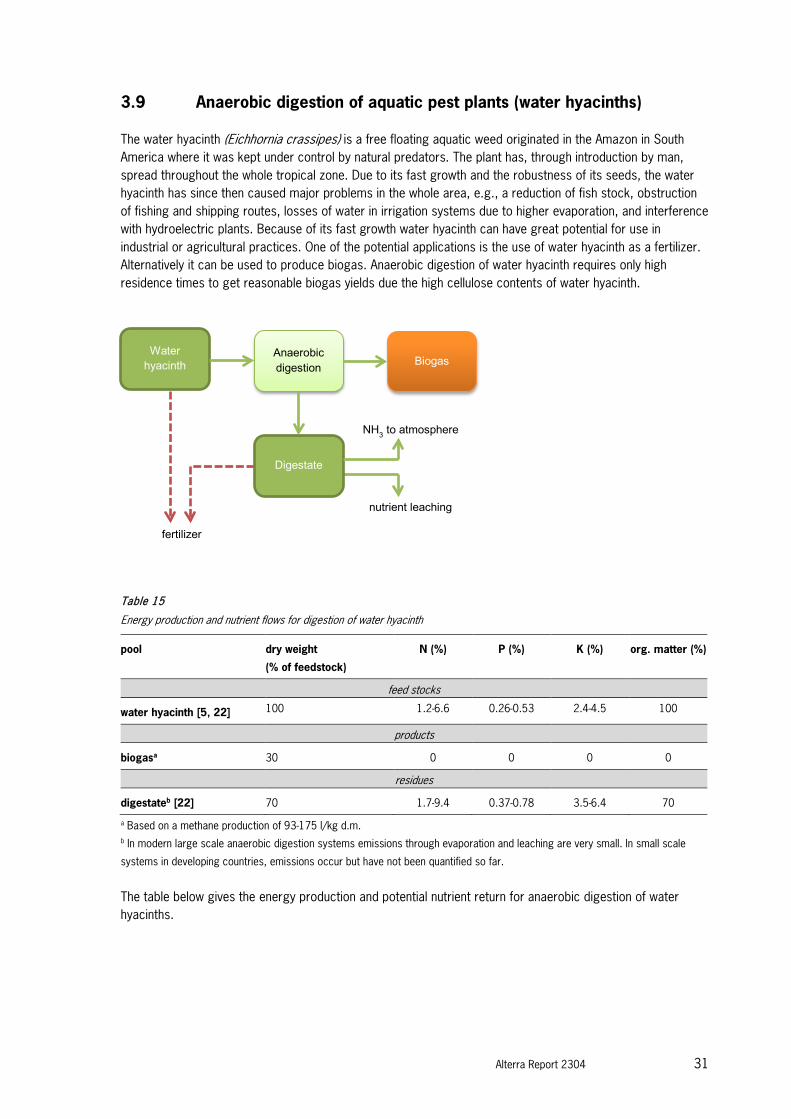
3.9 Anaerobic digestion of aquatic pest plants (water hyacinths)
The water hyacinth (Eichhornia crassipes) is a free floating aquatic weed originated in the Amazon in South America where it was kept under control by natural predators. The plant has, through introduction by man, spread throughout the whole tropical zone. Due to its fast growth and the robustness of its seeds, the water hyacinth has since then caused major problems in the whole area, e.g., a reduction of fish stock, obstruction of fishing and shipping routes, losses of water in irrigation systems due to higher evaporation, and interference with hydroelectric plants. Because of its fast growth water hyacinth can have great potential for use in industrial or agricultural practices. One of the potential applications is the use of water hyacinth as a fertilizer. Alternatively it can be used to produce biogas. Anaerobic digestion of water hyacinth requires only high residence times to get reasonable biogas yields due the high cellulose contents of water hyacinth.
Table 15
Energy production and nutrient flows for digestion of water hyacinth
pool dry weight
(% of feedstock)
N (%) P (%) K (%) org. matter (%)
feed stocks
water hyacinth [5, 22] 100 1.2-6.6 0.26-0.53 2.4-4.5 100
products
biogasa 30 0 0 0 0
residues
digestateb [22] 70 1.7-9.4 0.37-0.78 3.5-6.4 70
a Based on a methane production of 93-175 l/kg d.m. b In modern large scale anaerobic digestion systems emissions through evaporation and leaching are very small. In small scale
systems in developing countries, emissions occur but have not been quantified so far.
The table below gives the energy production and potential nutrient return for anaerobic digestion of water hyacinths.
Anaerobic digestion
Water hyacinth
NH3 to atmosphere
Biogas
fertilizer
nutrient leaching
Digestate

32 Alterra Report 2304
Table 16
Energy produced and potential nutrient return for anaerobic digestion of water hyacinth
energy contents
biogas 50 MJ/kg methane
energy production and nutrient return
total energy produced 3.7-6.9 MJ/kg
nutrient return (relative to nutrient
contents of feedstock)
100% N 100% P 100% K

Alterra Report 2304 33
4 Evaluation of systems
In this chapter we evaluate the different bio-energy systems that have been parameterised in chapter 3, on their potentials for nutrient retention and recycling and on the amounts of nutrients that are required to produce a certain amount of energy. The values in this chapter are based on the average values from the parameterisation, so for a specific situation outcomes might differ. 4.1 Potential nutrient return
The table summarizes the potential nutrient returns for the bio-energy systems that have for each system individually shown in chapter 3. The figures are based on the average nutrient contents of the returnable residues. For bio-energy crops the figures are relative to the nutrient requirements of the energy crops. For water hyacinth, manure and wood the figures are relative to the nutrient contents of the feed stocks (see tables in chapter 3).
Table 17
Potential nutrient return for bio-energy systems (%)
bio-energy system N P K
anaerobic digestion of manure 100 100 100 combustion of manure 0 94 93 combustion of wood 0 64 80 gasification of rice husks 0 15 25 ethanol from cassava 63 58 100 palm oil 44 91 91 jatropha oil 65 98 29 anaerobic digestion of water hyacinth 100 100 100
This table shows that for all systems a large fraction of nutrients can be returned to the soil. For palm oil and frequently also cassava nutrient return is already applied in many cases. Only for combustion and gasification all nitrogen is lost to the atmosphere. This is also the reason for the low nitrogen return for palm oil where a large fraction of the residues is combusted. Further for oil palm, a large fraction of the nutrients is stored in the trunks and roots, which can only be returned at the end of the palm trees life, i.e. 20-30 years after planting. For cassava, leaves and stems are left in the field after harvest of the tubers, and consequently nutrients in these are immediately returned. The low potential P return for cassava and K return for jatropha cannot be explained from the normal losses in the processes. These low returns are then most likely due to discrepancies in the used literature values for the fertilizer requirements and the nutrient contents of the residues. The low potential nutrient return for rice husks is logical as rice husks are a waste product and most nutrients are removed with main product, the rice grains themselves. This table further shows that with anaerobic digestion all nutrients can potentially be retained. As mentioned before, but losses of phosphorus and potassium are limited.

34 Alterra Report 2304
Because not all of the bio-energy systems that are discussed in this study are based on energy crops, we can alternatively compare the potential nutrient return with the nutrient requirement of common food crops. The table below gives the nutrient requirements for three common food crops.
Table 18
Nutrient requirements of three common food crops.
crop yield (ton/ha) nitrogen
(kg N/ha)
phosphorus
(kg P2O5/ha)
potassium
(kg K2O/ha)
rice [13] 4 (raw grains) 50 30 30
pigeon pea [13] 0.7 (grains) 15-20 45 20
maize [13] 6 (grains) 80 60 60
The table below gives the percentage of fertilizer requirements of one ha food crops that can be covered with the bio-energy residues of one ton of feed stock. Here, we assume that the nutrients in the residues have the same availability as in normal fertilizers.
Table 19
Percentage of fertilizer requirements of one ha of food crops that can be covered with bio-energy residues (per ton dry matter of
feed stock).
feed stock residues rice pigeon pea maize
N P K N P K N P K
wood ashes 0 3 9 0 2 14 0 8 28
manure direct application 50 65 21 139 43 32 188 195 64
manure digestate 50 65 21 139 43 32 188 195 64
manure ashes 0 61 20 0 41 30 0 184 60
rice husk gasification ashes 0 4 6 0 3 9 0 12 19
cassava digestate 8 8 28 23 5 43 32 23 85
oil palm POME, EFB, trunks, roots and ashes 7 3 24 18 2 37 24 10 73
jatropha digestate of hulls and cake 49 39 55 137 26 82 185 118 165
water hyacinth direct application 78 30 137 217 20 205 293 90 410
water hyacinth digestate 78 31 136 216 20 205 291 92 409
The fertilisation value of the different bio-energy residues can the best be compared with manure, a traditional fertilizer. Then Table 19 shows that residues from one ton of jatropha seeds are the most similar to one ton of manure, only K contents are substantially higher in jatropha residues. The residues from other energy crops have mainly lower fertilisation values than manure. Regarding other sources of bio-energy, water hyacinths have a high fertilisation value, even higher than manure, except for phosphorus.

Alterra Report 2304 35
4.2 Energy yield and energy efficiency
The table summarizes the energy yield for the different bio-energy systems per kg of feed stock and for crops also per hectare per year. In this table we have neglected the energy use of the different technologies. Especially for ethanol from cassava (distillation) and palm oil (steam treatment of fruit bunches), net energy yield will be lower.
Table 20
Energy yield for bio-energy systems.
feed stock technology energy carrier
energy yield (MJ/kg feed stock)
energy yield (GJ/ha/yr)
wood combustion heat 19 -
manure combustion heat 10.5-11.3 -
manure anaerobic digestion biogas 8.9 -
rice husk gasification syngas 13.5 10.8
cassava root fermentation ethanol 8.4 44.3
cassava root anaerobic digestion (of residues) biogas 7.1 37.8
oil palm fruit bunch oil pressing vegetable oil 13.3 398
oil palm fruit bunch incineration of milling residues (fruit shells and fibres) heat 3.2 97
Jatropha seeds oil pressing vegetable oil 9.4 14.2
Jatropha seeds anaerobic digestion (of residues) biogas 14.6 21.8
water hyacinth anaerobic digestion biogas 3.7-6.9 -
These figures show that PPO (i.e. jatropha and palm oil) give the highest energy yield per kg of feed stock. Interestingly, the energy yield from digestion of jatropha residues is higher than the energy contents of the oil itself. Palm oil has by far the highest energy yield per hectare, due to its high cropping yield. As mentioned these energy yields are the sum of the energy yields of the products and do not include the energy consumption of the processes. Especially for ethanol from cassava and palm oil net energy yields will be lower. To compare the different bio-energy systems from a nutrient perspective we calculated the amount of nutrients that are required to produce one MJ of energy. The table below gives both the nutrient requirements for systems without return of nutrients and for systems with return of nutrients. For the calculations we used average energy yields from Table 20 and the nutrient requirement and returns from Table 18 and Table 17.

36 Alterra Report 2304
Table 21
Nutrient use of bio-energy systems (g nutrient/MJ) without and with nutrient return
bio-energy system N P K
no return return no return return no return return
ethanol from cassava 0.43 0.16 0.11 0.05 0.41 0.0
palm oil + incineration of residues 0.45 0.25 0.03 0.002 0.40 0.03
jatropha oil 4.04 1.41 0.56 0.01 4.94 3.50
jatropha oil + anaer. dig. of residues 2.60 0.91 0.36 0.007 3.18 2.25
anaerobic digestion of manure 2.29 0 0.78 0 0.49 0
combustion of manure 2.81 2.81 0.96 0.05 0.60 0.04
combustion of wood 0.24 0.24 0.03 0.01 0.10 0.02
gasification of rice husks 0.93 0.93 0.24 0.21 0.46 0.35
anaerobic digestion of water hyacinth 7.36 0 0.75 0 6.42 0
This table shows that for energy crops, jatropha requires much more nutrients than oil palm and cassava. This holds even when it is considered that energy yields of cassava ethanol and palm oil are overestimated because of internal energy use. The production of biogas from jatropha residues decreases the amount of required nutrients per mega joule (i.e. more energy per nutrient), but nutrient requirements still remain high. Energy production from other sources, like manure, water hyacinth, wood and rice husks, can only be nutrient efficient when nutrients in residues can be returned.

Alterra Report 2304 37
5 Conclusions
In this study we explored the opportunities for the retention and return of nutrients in small-scale bio-energy application. This study included three energy crops (oil palm, jatropha and cassava), fuel wood, manure, rice husks as a waste product and water hyacinth a common pest plant. In general, for all bio-energy systems some return of nutrients is possible. Yet there can be large differences between conversion technologies and between feed stocks. Conversion technologies With anaerobic digestion almost all nutrients can normally be retained, while with combustion and gasification all nitrogen is lost to the atmosphere and also small part of the phosphorus and potassium. However, feed stocks or residues that have high lignin or hemicellulose contents, e.g. rice husks, rice straw and wood, cannot easily be digested anaerobically and need to be treated otherwise. Nutrient return of energy crops Of the bio-energy crops, palm oil has the lowest potentials for nutrient return, especially nitrogen, because residues are frequently combusted leading to losses of nitrogen. The calculations showed that cassava and jatropha have low potential returns of P and K, respectively. The reason however is most likely not losses in the processes but discrepancies between nutrient uptake and reported fertilizer requirements. Nutrient efficiency of bio-energy production In contrast, when the required nutrient input per mega joule of bio-energy is calculated, palm oil, together with cassava, is the most efficient due to its high bio-energy (i.e. palm oil and ethanol) production. Now jatropha is the least efficient energy crop, it requires the most nutrients to produce a mega joule of energy.

38 Alterra Report 2304

Alterra Report 2304 39
References
1. EC, Directive on the promotion of the use of energy from renewable sources, in 2009/28/EC 2009, European Parliament and European Council.
2. NEN, Netherlands Technical Agreement. Sustainability criteria for biomass for energy purposes. NTA 8080/8081, 2009, Nederlands normalisatie-instituut, Delft.
3. Jongschaap, R.E.E. et al., Claims and facts on Jatropha curcas L.. 2007, Plant Research International, Wageningen.
4. Wieggers, R., Nutrient contents in tree compartments, 2011, Alterra, part of Wageningen UR, Wageningen.
5. ECN, Phyllis, database for biomass and waste, 2011. Energy research Centre of the Netherlands, Petten.
6. Pels, J.R., Hergebruik van assen uit biomassaverbranding. Hoeveelheden en samenstelling van de assen en opties voor materiaalhergebruik. 2011. ECN, Petten.
7. Horn, H.H. et al. van, Components of dairy manure management systems. J. Dairy Science, 1994. 77: p. 2008-2030.
8. Annamalai, K., M.Y. Ibrahim and J.M. Sweeten, Experimental studies on combustion of cattle manure in a fluidized bed combuster. J. Energ. Resourc. Techn. 1987. 109: p. 49-57.
9. LfU, Biogashandbuch Bayern, in Materialienband 2007, Bayerisches Landesamt für Umwelt,Augsburg. 10. Vroonhof, J.T.W. et al., Milieuanalyse 4 alternatieve (bio)brandstoffen voor de Gelderland 13
Corncobpellets, rijstresidupellets, palmpitkorrels en eucalyptushoutpellets, 2005, CE: Delft. 11. Wen Hwei, H., Rice Hulls Rice: Production and Utilization, 1986, AVI Publishing company Inc.:
Westport Connection, CA. 12. Hashim, A.B., A. Aminuddin, and K.B. Siva, Nutrient content in rice hush ash of some Malaysian rice
varieties. Pertanika J. Trop. Agric. Sci. 1996. 19: p. 77-80. 13. Roy, R.N., et al., Plant nutrition for food security. A guide for integrated nutrient management. FAO
Fertilizer and plant nutrition bulletin 16, 2006. 14. Kuiper, L., et al., Bio-ethanol from cassava, 2007, Ecofys project PBIONL. 15. Corley, R.H.V., How much palm oil do we need? Environmental Science & Policy 2009. 12: p. 134-
139. 16. FAO. ResourceSTAT-Land. 2008. Available from: http://faostat.fao.org. 17. Fairhurst, T. and D. McLaughlin, Sustainable oil palm development on degraded land in Kalimantan.,
2009, WWF report. 18. RSPO, RSPO Principles and Criteria for Sustainable Palm Oil Production, 2007, Roundtable on
Sustainable Palm Oil. p. 53. 19. Elbersen, H.W., v.D. J.E.G., and R.R. Bakker, Oil palm by-products as a biomass source: availability
and sustainability, in 14th European Biomass Conference 2005. Paris, France. 20. Akinyele, B.J. and F.A. Akinyosoye, Effect of Volvariella volvacea cultivaton on the chemical
composition of agrowastes. African Journal of Biotechnology 2005. 4(9): p. 979. 21. FACT, The Jatropha handbook, 2010, FACT foundation: Wageningen, the Netherlands. 22. Gunnarsson, C.C. and C. Matsson Petersen, Water hyacinths as a resource in agriculture and energy
production: A literature review. Waste Management 2007. 27: p. 117-129.

40 Alterra Report 2304

Alterra Report 2304 41
Appendix 1 MonQI toolbox, monitoring resource flows in small-scale bioenergy systems
This report described the effects of small scale bio-energy systems on nutrient budgets and identified possibilities for nutrient return, both from a theoretical point of view. Non, in order to assess the ‘real-life’ effects of small scale bio-energy systems, monitoring and evaluation of these systems and of the change to these systems is necessary. Such an assessment requires an appropriate monitoring tool. The text below describes one of the most used tools for monitoring nutrient flows for small scale farming in developing countries, i.e. the MonQi toolbox. Further it shows how bio-energy systems can easily be included in this toolbox. The MonQi toolbox The MonQI (Monitoring for Quality Improvement) toolbox is a methodology and software for monitoring the management and performance of small scale farming systems in developing countries. The MonQI toolbox is based on the analysis of input-output flows from individual crop and livestock activities at a farm level. The MonQI toolbox allows for systematic evaluation of these farm management data. This information is collected by regular structured interviews with farmers.
Figure A1
Example screenshot of the MonQi toolbox
The MonQI toolbox provides detailed information on nutrient flows but also on financial performance and, optionally, on labour, pesticides, water and organic carbon use at different farm levels. Currently, the MonQI toolbox quantifies the following parameters based on inputs into the farm, outputs from the farm and flows between the different activities within the farm: • Fresh weight and dry matter flows • Nutrients (N, P, K and optionally micro nutrients) • Structural organic carbon • Water • Gross margins and cash flows

42 Alterra Report 2304
After data collection, these parameters are, where relevant, calculated and aggregated to the different levels within a farm.
Figure A2
Example output of MonQI: balance entries of the full N balance for farms in Holetta and Melkassa, Ethiopia
It should be stressed that MonQI is a monitoring tool, i.e. not a simulation model, for farm or plot level. The MonQi toolbox has been used in many studies in Africa and Asia over the past 20 years and has an extensive track record. It is used in more than 30 peer reviewed international papers and at present it is probably the most frequently used toolbox in the context of soil fertility research in sub-Saharan Africa (Schlecht et al., 2004). Use of MonQi for bio-energy systems Local bio-energy systems can easily be included in the MonQi toolbox be defined as a redistribution systems where biomass, and thus nutrients and organic carbon, enter and leave the system and change its dynamics. Additionally, energy can be added as a resource flow in the MonQi toolbox. The following relevant aspects can be then derived from a farming system analysis with MonQI: • A description of the farm in terms of size, soil quality, cropping pattern and labour availability. • The availability, quality and use of different kinds of biomass before and after the introduction of bioenergy
systems. • The effects of those systems on farm level nutrient, carbon, water and energy balances. • The effect on profitability of different activities (crops, livestock and energy) and on household income
from agriculture and other sources.
-70
-60
-50
-40
-30
-20
-10
0
10
20
30
40
Holetta Melkassa
kg N
/ha
Mineral fertilizerOrganic inputsAtmosferic depostionbiological fixationharvested productsremoved crop residuesErosionGaseous lossesLeaching

More information: www.alterra.wur.nl/uk L.T.C. Bonten and J.H.M. Wösten
Alterra Report 2304
ISSN 1566-7197
Nutrient flows in small-scale bio-energy use in developing countries
Alterra is part of the international expertise organisation Wageningen UR (University & Research centre). Our mission is ‘To explore the potential of nature to improve the quality of life’. Within Wageningen UR, nine research institutes – both specialised and applied – have joined forces with Wageningen University and Van Hall Larenstein University of Applied Sciences to help answer the most important questions in the domain of healthy food and living environment. With approximately 40 locations (in the Netherlands, Brazil and China), 6,500 members of staff and 10,000 students, Wageningen UR is one of the leading organisations in its domain worldwide. The integral approach to problems and the cooperation between the exact sciences and the technological and social disciplines are at the heart of the Wageningen Approach.
Alterra is the research institute for our green living environment. We offer a combination of practical and scientific research in a multitude of disciplines related to the green world around us and the sustainable use of our living environment, such as flora and fauna, soil, water, the environment, geo-information and remote sensing, landscape and spatial planning, man and society.