NUTRIENT DISORDERS OF SWEET POTATO - UQ eSpace520236/Nutrient_Disorders_… · Nutrient disorders...
131
NUTRIENT DISORDERS OF SWEET POTATO J.N. O'Sullivan, C.J.Asher and F.P'C. Blarney Department of Agriculture The University of Queensland Australian Centre for International Agricultural Research Canberra 1997
Transcript of NUTRIENT DISORDERS OF SWEET POTATO - UQ eSpace520236/Nutrient_Disorders_… · Nutrient disorders...

NUTRIENT DISORDERS OF SWEET POTATO
J.N. O'Sullivan, C.J.Asher and F.P'C. Blarney
Department of Agriculture The University of Queensland
Australian Centre for International Agricultural Research
Canberra 1997

The Australian Centre for International Agricultural Research (AClAR) was established
in June 1982 by an Act of the Australian Parliament. Its mandate is to help identify
agricultural problems in developing countries and to commission collaborative research
between Australian and developing country researchers in fields where Australia has a
special research competence.
Where trade names are used this constitutes neither endorsement of nor discrimination
against any product by the Centre.
ACIAR MONOGRAPH SERIES
This peer-reviewed series contains the results of original research supported by
AClAR, or material deemed relevant to ACIAR's research objectives. The series
is distributed internationally, with an emphasis on developing countries.
© Australian Centre for International Agricultural Research
GPO Box 1571, Canberra ACT 2601, Australia.
O'Sullivan, J.N., Asher, C.J. and Blamey, F.P.C. 1997. Nutrient disorders of sweet
potato. ACIAR Monograph No 48, 136p.
ISBN 1 863202102
Technical editing, design and layout by Arawang, Canberra
Cover illustrations: a sweet potato field in east Java, Indonesia; marketplace at Rabaul.
Papua New Guinea.

Foreword
Farmers in developing countries grow sweet potato for a variety of uses. In China sweet
potato is grown in large quantities as an animal feed and an industrial crop. In the Pacific,
the crop is a major staple food needed in greater quantities as the population of the region
expands. Importantly, the intensification of cropping caused by population growth is
depleting the native soil fertility and exacerbating the nutrient disorders that are the focus
of this book.
The Australian Centre for International Agricultural Research (ACIAR) had no hesitation
in supporting the research that led to this publication. The geographic focus on the Asia
and the Pacific is important to ACIAR and partner scientists in Papua New Guinea, Tonga
and Samoa were keen to participate. The scientists from the University of Queensland
have a proven track record in research on the diagnosis of plant nutrient disorders. These
are the successful ingredients of ACIAR projects.
This publication is based on a systematic approach to research involving controlled
experiments and field surveys in the collaborating Pacific Island nations. The book is a
credit to the research partners and the ACIAR Publications Unit that helped produce it. I
congratulate them all. I hope that the publication is made available to field practitioners who
can use it to diagnose nutrient disorders in farmers' fields and recommend appropriate
remedies to correct the problems. Such widespread use of the publication will be ample
reward for the authors and should greatly benefit farmers producing sweet potatoes.
Eric T. Craswell Director-General
International Board for Soil Research and Management
Bangkok, Thailand
3
About the Authors
Jane O'Sullivan is Research Officer in Plant Nutrition in the Department of Agriculture,
The University of Queensland. She holds a Bachelor of Agricultural Science degree and a
PhD from The University of Melbourne. Much of the information contained in this
volume is the result of her research over the past five years on nutrient disorders in sweet
potato and taro, and their management in the Pacific region.
Colin Asher is Professor of Agriculture at The University of Queensland, and Director of
Research for the Faculty of Natural Resources, Agriculture and Veterinary Science at the
same university. He has a long-standing involvement in soil fertility assessment,
particularly in the Asia-Pacific region, and in improved methods for diagnosing nutrient
disorders in some of the less-studied crop plants. He has been involved in the development
of visual symptom descriptions and critical tissue concentrations for nutrient deficiency
and excess in sweet potato and various other crops.
Pax Blarney is Reader in Crop Agronomy in the Department of Agriculture, The
University of Queensland. He holds Bachelor and Master of Agricultural Science degrees
and a PhD from the University of Natal, South Africa. His research on acid soil infertility
has concentrated on the role of aluminium in reducing plant root growth, focusing on the
tolerance mechanisms of plant genotypes to soluble aluminium in the root environment.
This work has emphasised the importance of aluminium reactions in plant cell walls.
4
Contents
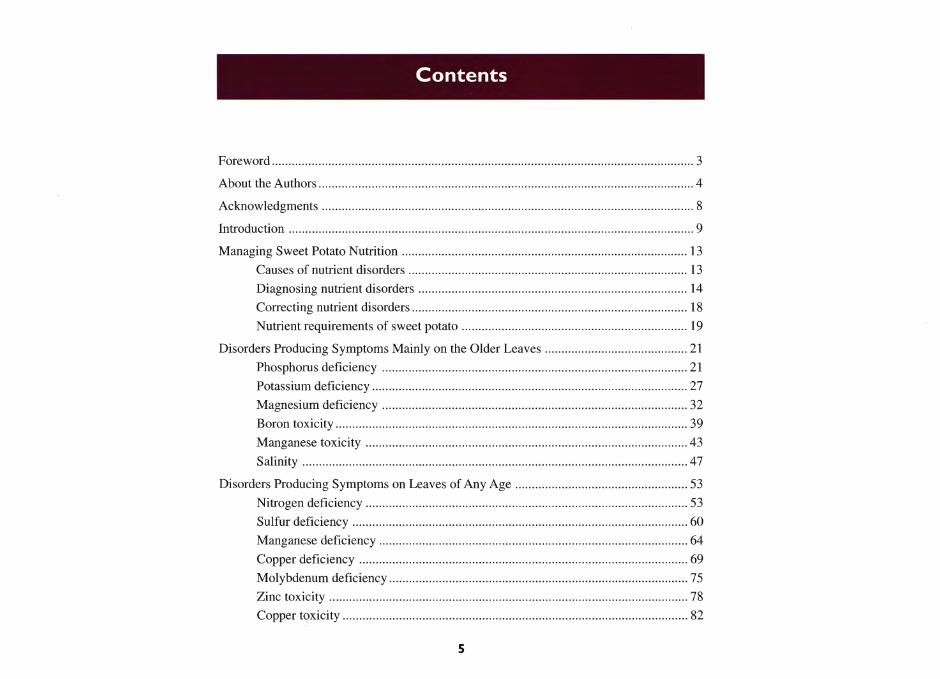
Foreword ............................................................................................................................... 3
About the Authors ................................................................................................................. 4
Acknowledgments ................................................................................................................ 8
Introduction .......................................................................................................................... 9
Managing Sweet Potato Nutrition .................... .................................................................. 13
Causes of nutrient disorders .................................................................................... 13
Diagnosing nutrient disorders ................................................................................. 14
Correcting nutrient disorders ................................................................................... 18
Nutrient requirements of sweet potato .................................................................... 19
Disorders Producing Symptoms Mainly on the Older Leaves ........................................... 21
Phosphorus deficiency ............................................................................................ 21
Potassium deficiency ............................................................................................... 27
Magnesium deficiency ............................................................................................ 32
Boron toxicity ............................................................................ .......... ..... ..... .......... 39
Manganese toxicity ................................................................................................. 43
Salinity .................................................................................................................... 47
Disorders Producing Symptoms on Leaves of Any Age .................................................... 53
Nitrogen deficiency .................................................... .......... ..... .............................. 53
Sulfur deficiency ..................................................................................................... 60
Manganese deficiency ............................................................................................. 64
Copper deficiency .................................. ..... ..... ....................................................... 69
Molybdenum deficiency .......................................................................................... 75
Zinc toxicity ............................................................................................................ 78
Copper toxicity .................................. .......... ................................. ..... ..... ..... ..... ....... 82
5

Disorders Producing Symptoms Mainly on the Younger Leaves ................ ....................... 87
Calcium deficiency .................................................................................................. 87
Iron deficiency ........................................................................................................ 93
Boron deficiency ..................................................................................................... 97
Zinc deficiency ...................................................................................................... 102
Disorders Producing No Specific Leaf Symptoms .............. .......................... .......... ......... 109
Aluminium toxicity ...................................... ................................. .... .. ....... ... ..... ... 109
Foliar Symptoms Produced by Pathogens and Pests ................................ .. .... .................. 113
References ............... ... .. ........................... ........... .... .... ................... ....... ...... ...... ................ 121
Appendix 1. Glossary, Scientific Names, Abbreviations, Conversions, and Symbols ..... 129
Appendix 2. Key to Nutrient Disorders ............. .......... ... ....... ........ ..... ..... ............. ... ......... 133
Table 1.
Table 2.
Table 3.
Table 4.
Tables Total production, production per capita and yield of sweet potato in 1993,
and the percentage change from 1985 to 1995, by region (derived from
FAD, 1996) .......................................................... ................................ ... ....... 9
Edible energy yield, and approximate composition per MJ edible portion,
of sweet potato and other major tropical staple crops .. ............................... 10
Critical nutrient concentrations for deficiency and toxicity, and the
adequate concentration ranges for sweet potato, measured in the 7th to
9th open leaf blades from the shoot tip, sampled at 28 days from planting.
Data were obtained from experiments in solution culture using
cv. Wanmun. ........... ............ ........ ............... ..... ......... ... .. .. ................. ..... ........ 17
Estimated removal of nutrients from the soil by sweet potato crops of
12 t/ha (average) and 50 tlha (high), for situations where only storage
roots are harvested, and where both roots and vines are removed. ............. 19
6

Figure 1.
Plate 1.
Plate 2.
Plate 3.
Plate 4.
Plate 5.
Plate 6.
Plate 7.
Plate 8.
Plate 9.
Plate 10.
Plate 11.
Plate 12.
Plate 13.
Plate 14.
Plate 15.
Plate 16.
Plate 17.
Plate 18.
Plate 19.
Figure Schematic relationship between nutrient concentration in the plant tissue
and dry matter yield relative to the maximum possible yield ...................... 16
Plates Phosphorus deficiency ........................... ....................................... ............... 22
Potassium deficiency .............. ..... ..... ......... ......... ............. ....... ..................... 27
Magnesium deficiency ................................................................................. 32
Boron toxicity .............................................................................................. 40
Manganese toxicity .. ......... ...... ........... ......... .............. ...... ......... ............ ........ 44
Salinity .............. .. ......................................... ................................................ 47
Nitrogen deficiency ...................................... .... ... ......................................... 55
Sulfur deficiency .. ....... ..... ............... ... .... .......... ....... ............ ... ..................... . 61
Manganese deficiency .................................................................................. 65
Copper deficiency ............ ...................................... ...................................... 69
Molybdenum deficiency .............................. ..... ........... ....... ......... ........... ..... 76
Zinc toxicity ......... ................... ............................................ ..... .................... 79
Copper toxicity ............................................. .. ... ......... ......... ..... .............. ..... 82
Calcium deficiency ...... ................................. .. ............................................. 88
Iron deficiency ... .......................................................................................... 93
Boron deficiency ................................... ............... .......... ... .............. .......... ... 98
Zinc deficiency ........................................................................... ............... 103
Aluminium toxicity ..................... ................................................................ 110
Foliar symptoms produced by pathogens ................................................... U5
7
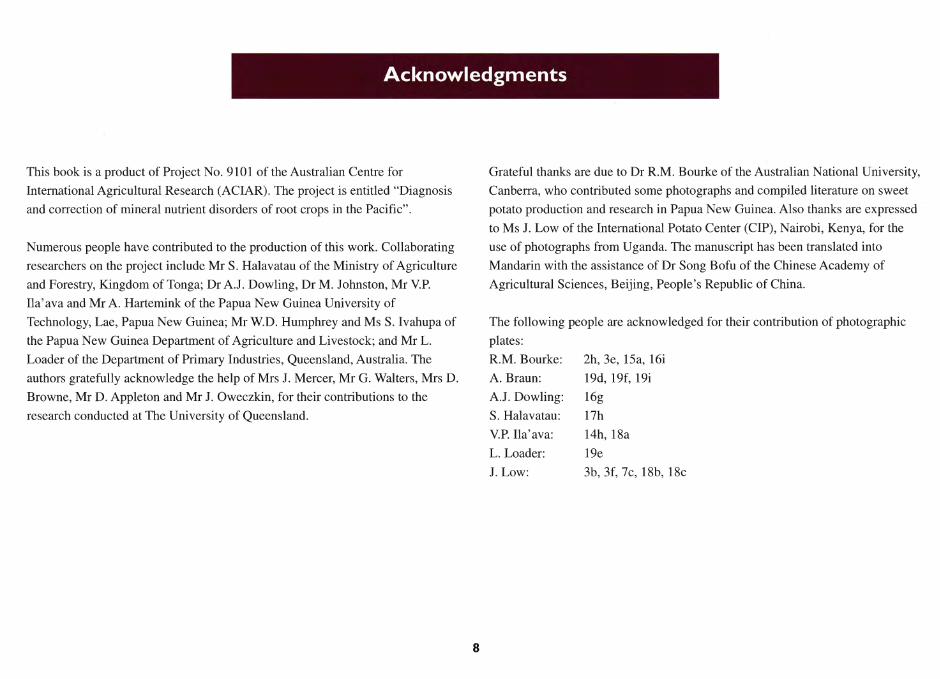
Acknowledgments
This book is a product of Project No. 9101 of the Australian Centre for
International Agricultural Research (ACIAR). The project is entitled "Diagnosis
and correction of mineral nutrient disorders of root crops in the Pacific".
Numerous people have contributed to the production of this work. Collaborating
researchers on the project include Mr S. Halavatau of the Ministry of Agriculture
and Forestry, Kingdom of Tonga; Dr A.1. Dowling, Dr M. Johnston, Mr v.P.
Ila' ava and Mr A. Hartemink of the Papua New Guinea University of
Technology, Lae, Papua New Guinea; Mr W.D. Humphrey and Ms S. Ivahupa of
the Papua New Guinea Department of Agriculture and Livestock; and Mr L.
Loader of the Department of Primary Industries, Queensland, Australia. The
authors gratefully acknowledge the help of Mrs J. Mercer, Mr G. Walters, Mrs D.
Browne, Mr D. Appleton and Mr 1. Oweczkin, for their contributions to the
research conducted at The University of Queensland.
8
Grateful thanks are due to Dr R.M. Bourke of the Australian National University,
Canberra, who contributed some photographs and compiled literature on sweet
potato production and research in Papua New Guinea. Also thanks are expressed
to Ms 1. Low of the International Potato Center (CIP), Nairobi, Kenya, for the
use of photographs from Uganda. The manuscript has been translated into
Mandarin with the assistance of Dr Song Bofu of the Chinese Academy of
Agricultural Sciences, Beijing, People's Republic of China.
The following people are acknowledged for their contribution of photographic
plates:
R.M. Bourke:
A. Braun:
AJ. Dowling:
S. Halavatau:
v.p. Ila'ava:
L. Loader:
1. Low:
2h, 3e, l5a, 16i
19d, 19f, 19i
l6g
17h
14h, l8a
1ge
3b,3f, 7c, l8b, l8c
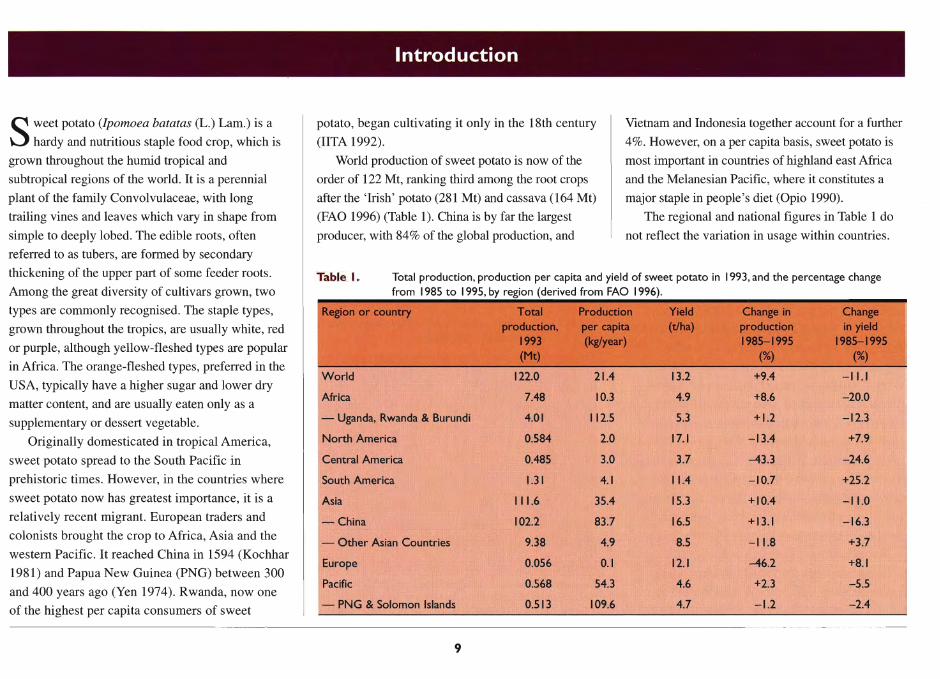
Sweet potato (Ipomoea hatatas (L.) Lam.) is a
hardy and nutritious staple food crop, which is
grown throughout the humid tropical and
subtropical regions of the world. It is a perennial
plant of the family Convolvulaceae, with long
trailing vines and leaves which vary in shape from
simple to deeply lobed. The edible roots, often
referred to as tubers, are formed by secondary
thickening of the upper part of some feeder roots.
Among the great diversity of cultivars grown, two
types are commonly recognised. The staple types,
grown throughout the tropics, are usually white, red
or purple, although yellow-fleshed types are popular
in Africa. The orange-fleshed types, preferred in the
USA, typically have a higher sugar and lower dry
matter content, and are usually eaten only as a
supplementary or dessert vegetable.
Originally domesticated in tropical America,
sweet potato spread to the South Pacific in
prehistoric times. However, in the countries where
sweet potato now has greatest importance, it is a
relatively recent migrant. European traders and
colonists brought the crop to Africa, Asia and the
western Pacific. It reached China in 1594 (Kochhar
1981) and Papua New Guinea (PNG) between 300
and 400 years ago (Yen 1974). Rwanda, now one
of the highest per capita consumers of sweet
Introduction
potato, began cultivating it only in the 18th century
(IITA 1992).
World production of sweet potato is now of the
order of 122 Mt, ranking third among the root crops
after the 'Irish' potato (281 Mt) and cassava (164 Mt)
(FAO 1996) (Table 1). China is by far the largest
producer, with 84% of the global production, and
Vietnam and Indonesia together account for a further
4%. However, on a per capita basis, sweet potato is
most important in countries of highland east Africa
and the Melanesian Pacific, where it constitutes a
major staple in people's diet (Opio 1990).
The regional and national figures in Table 1 do
not reflect the variation in usage within countries.
Table I. Total production, production per capita and yield of sweet potato in 1993, and the percentage change from 1985 to 1995, by region (derived from FAO 1996).
Region or country T oc:aI Production ptodUcdon, per capita
1993 (kgIyear) ' . (Me) .;', ....
World 122.0 21.4
Africa 7.48 10.3
- Uganda, Rwanda & Burundi 4.01 112.5
North America 0.584 2.0
Central America 0.485 3.0
South America 1.31 4.1
Asia 111.6 35.4
-China 102.2 83.7
- Other Asian Countries 9.38 4.9
Europe 0.056 0.1
Pacific 0.568 54.3
- PNG & Solomon Islands 0.5 13 109.6
9
rteld (tIha)
13.2
4.9
5.3
17.1
3.7
11.4
15.3
16.5
8.5
12.1
4.6
4.7
Change in production 1985--1995
(%)
+9.4
+8.6
+ 1.2
- 13.4
-43.3
-10.7
+ 10.4
+ 13.1
- 11.8
-46.2
+2.3
- 1.2
Change in yield
1985-1995 (%)
-I Ll
-20.0
-12.3
+7.9
-24.6
+25.2
- 11.0
-16.3
+3.7
+8.1
-5.5
- 2.4
In fact, sweet potato is the main staple food for
many communities. For example, a 1986 survey in
Rwanda found per capita sweet potato consumption
in the north-central region to be over 300 kg/year,
representing 40% of the food consumed (Woolfe
1992). Earlier studies in PNG villages recorded
adult consumption of 1.2-1.7 kg/day (approx.
400-600 kg/year), contributing over 90% by weight
of the food consumed (Sinnett 1975). Access to
imported foods in recent times has reduced this
percentage in many communities, but many PNG
Highlanders still rely on sweet potato for over half
of their dietary energy and over 30% of their protein
intake (Harvey and Heywood 1983).
Sweet potato is typically produced for food,
eaten by the grower's family or locally marketed in
an unprocessed form. However, an increasing
volume is being processed into industrial starch,
alcohol, noodles and other products, especially in
China. In some regions, sweet potato is also the
mainstay of livestock production, utilising both the
vines and undersized roots. In PNG, pigs raised on
sweet potato have traditionally been the main item of
trade and a measure of wealth, and may consume up
to 60% of the crop harvested (Harvey and Heywood
1983). In the Cafiete Valley in Peru, sweet potato
supports a modem dairy industry (Woolfe 1992).
Sweet potato is grown in a wide range of
environments, from the humid tropics to mild
temperate zones, and from sea level to 2700 m
altitude (Bourke 1985a). Like cassava, it can be
grown in semi-arid conditions, but it has greater
tolerance than cassava to the low temperatures
encountered at high altitude, and to heavy soils.
However, it is intolerant of waterlogging, and is
usually grown on ridges or mounds. Under
favourable conditions, the vines grow quickly to
cover the soil, eliminating weeds and hence
minimising the labour required after planting.
Clarke (1973) identified a number of factors
contributing to the rapid rise of sweet potato to
dominance in the agriculture of PNG, supplanting
the traditional taro and yam. Importantly, sweet
potato has a wider tolerance of soil conditions,
allowing extended rotations and cultivation of
previously marginal areas, and it requires less
labour, produces yield earlier, can be harvested over
an extended period as required for consumption, and
does not require cooking before feeding to animals.
Increasing population pressure, and the use of land
and labour for cash cropping, continue to promote
the shift to sweet potato production. Many of these
factors playa role in other countries which have
adopted sweet potato as a subsistence crop.
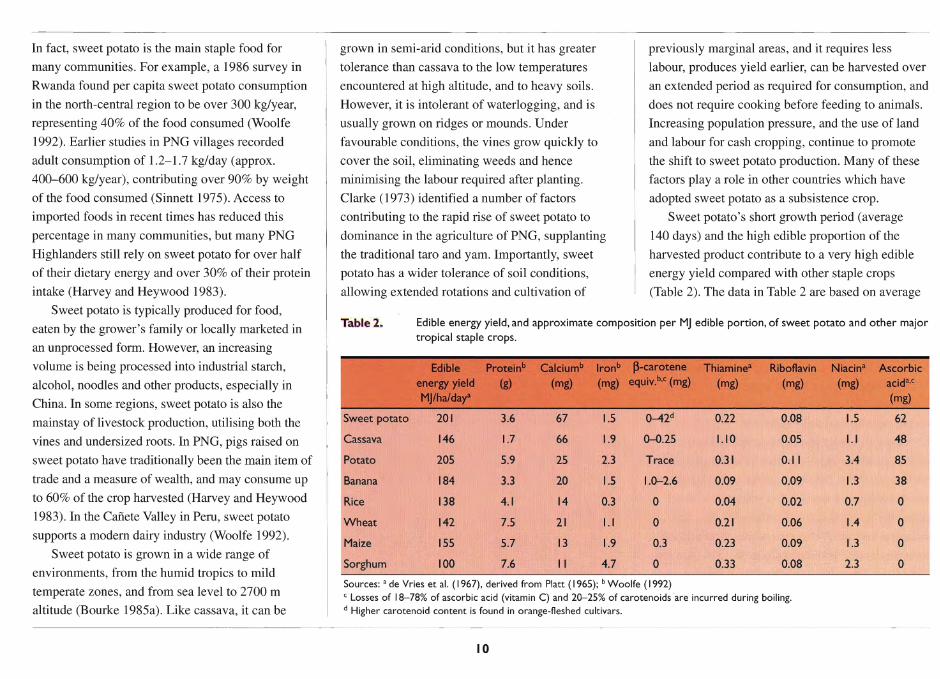
Sweet potato's short growth period (average
140 days) and the high edible proportion of the
harvested product contribute to a very high edible
energy yield compared with other staple crops
(Table 2). The data in Table 2 are based on average
Table 2. Edible energy yield, and approximate composition per MJ edible portion, of sweet potato and other major tropical staple crops.
Edible Proteinb CaJciumb lronb Jkarotene Thiaminea Riboflavin Niacin" Ascorbic energy yield (g) (mg) (mg) equiv.b,c (mg) (mg) (mg) (mg) acid"c
MJlhalday" (mg)
Sweet potato 201 3.6 67 1.5 0-42d 0.22 0.08 1.5 62
Cassava 146 1.7 66 1.9 0-0.25 1.10 0.05 1.1 48
Potato 205 5.9 25 2.3 Trace 0.31 0.11 3.4 85
Banana 184 3.3 20 1.5 1.0-2.6 0.09 0.09 1.3 38
Rice 138 4.1 14 0.3 0 0.04 0.02 0.7 0
Wheat 142 7.5 21 1.1 0 0.21 0.06 1.4 0
Maize 155 5.7 13 1.9 0.3 0.23 0.09 1.3 0
Sorghum 100 7.6 II 4.7 0 0.33 0.08 2.3 0
Sources: a de Vries et al. (1967), derived from Platt (1965); b Woolfe (1992) C Losses of 18-78% of ascorbic acid (vitamin C) and 20-25% of carotenoids are incurred during boiling.
d Higher carotenoid content is found in orange-fleshed cultivars.
10
I
yields in tropical countries, and do not take into
account differences in growth conditions. For
instance, sweet potato, cassava and sorghum are
more likely to be grown as traditional cultivars on
poor soils, without irrigation or fertilizer, than are
rice, potato or wheat. These considerations further
emphasise the high yield potential of sweet potato.
Root crops are often considered to be
nutritionally inferior to cereals (de Vries et al.
1967). However, when compared on an equal
energy basis (Table 2), sweet potato has an average
protein concentration comparable with that of rice.
Furthermore, the protein concentration in sweet
potato is highly variable, and there is potential for
significantly improving the average through both
genetic and management factors. A survey of South
Pacific crops found protein concentrations from
0.46-2.93%, equivalent to 1.0-6.1 g/MJ (Bradbury
and Holloway 1988).
Sweet potato is also a good source of calcium,
ascorbic acid (vitamin C) and ~-carotene
(provitamin A). The yellow- to orange-fleshed
cultivars contain particularly high levels of
carotenoids, and are equalled only by carrot as a
source of provitamin A (Woolfe 1992). Vitamin A
deficiency is a common and serious health problem
in many countries with rice-based diets, being the
main cause of blindness in children. Less acute
deficiency decreases children's resistance to
infectious diseases, contributing to infant mortality.
In response to this problem, efforts are being made
in some Asian countries to promote the use of
yellow-fleshed cultivars of sweet potato. There is
scope for breeding yellow-fleshed sweet potatoes
with higher dry matter and lower sugar content,
which are more acceptable to users of traditional
staple varieties.
The young leafy shoots, which are eaten as a
green vegetable in some countries, particularly in
Asia, are high in protein (approximately 20% of dry
weight), and are also a good source of ~-carotene,
thiamine (vitamin B1), riboflavin (B2), folic acid and
ascorbic acid (Villareal et a1. 1985; Woolfe 1992).
In many countries, sweet potato is viewed as a
poor man's food, with lower per capita consumption
in higher income brackets (Woolfe 1992). This view
has probably contributed to the relatively small
research effort which has been applied to the
development of sweet potato, compared with other
crops of similar importance. A large proportion of
the research effort has been directed towards
selection and breeding of improved cultivars. This
attention is justified, given both the high potential
for crop improvement and the great diversity of
cultivars available to the breeder. In PNG alone,
about 1200 accessions are maintained, and the total
number of indigenous cultivars may be as high as
5000 (Bourke 1985a). However, relatively little
attention has been given to improvements in crop
management, particularly in crop nutrition, despite
large potential gains in the short term.
II
The potential yield for sweet potato under ideal
conditions is approximately 80-100 t1ha. While
such yields are unrealistic in most practical
conditions, in intensive, high-input systems such as
are found in east Java, the best farmers consistently
produce yields of 30-50 t1ha within four months of
planting (E. van de Fliert, pers. comm. 1996). Even
in subsistence gardens, yields recorded in PNG vary
from less than 1 t1ha (Floyd et a1. 1988) to as much
as 50 t1ha (Conroy and Bridgland 1950, cited in
Bourke 1982). Yet the global average yield is only
about l3 t1ha (Table 1), and that in semi-subsistence
economies appears to average only 4-6 tlha.
This yield gap represents an enormous potential for
improving food production. This is especially true
in Africa, the Pacific and Central America, where
high pressure on land resources, through population
growth and expansion of cash cropping, necessitates
such an improvement. Yet it is disturbing to note
that yields in these areas are either declining or
almost static (Table 1).
Whilst many factors contribute to low yield
under farming conditions, nutritional problems are
worthy of attention, firstly because of their
prevalence, and secondly because of the large gains
that can be made by alleviating them.
Nutrient deficiencies almost invariably limit yields
of subsistence crops, and are common even in
fertilized crops. Mineral toxicities, particularly
those associated with acid soils, affect many areas
and may cause complete crop failure, but the
problem is often not correctly diagnosed. The
decline in yield following continuous cropping of
the same land is often largely due to depletion of
soil nutrients, as can be seen by the response of
sweet potato crops in old gardens to nutrient
additions, either in the form of organic mulches or
inorganic fertilizers (e.g. Bourke 1985b; D'Souza
and Bourke 1986a, b; Floyd et al. 1988). However,
the traditional fallow practices relied upon to renew
fertility are being compromised due to increasing
pressure on land resources (Bourke 1977a;
Halavatau et al. 1996). The challenge is to restore
sustainability in those areas where intensification
has reduced yield, and to improve yield where land
resources are limited for the expansion of
production.
Accurate diagnosis of nutritional problems is a
vital and indispensable first step to finding solutions
to them that are technically sound, affordable, and
friendly to the environment. Correction of a
nutritional disorder does not necessarily require the
use of inorganic fertilizers. In some cases, solutions
may be available using local resources and
improved management practices, including the use
of leguminous plants in the cropping cycle. Many
traditional practices add or conserve soil nutrients
(e.g. D'Souza and Bourke 1986b), and new
techniques are continually being developed.
However, expanding trade and income opportunities
make the use of fertilizers a desirable option for an
increasing number of producers. For maximum
benefit to producers, amendments will need to be
applied on the basis of an understanding of the
crop's requirements, and a recognition of which
factor or factors are most limiting to production at a
particular site.
This book is intended to aid those involved in
sweet potato production (producers, advisers and
researchers) in the diagnosis of nutritional
problems, and to provide guidance towards
correcting them. We have attempted to provide a
comprehensive coverage of the current knowledge
on sweet potato nutrition, although it is appreciated
that such detail may make the information difficult
for some farmers to access. It is hoped that this
book will provide a resource from which farm
advisers can extract information appropriate for the
environment, culture and resource availability of
local sweet potato growers.
12
The structure and use of this book
This book provides detailed, illustrated
descriptions of all nutritional disorders of sweet
potato which are likely to occur under field
conditions. With each description, some information
is given on the occurrence and management of the
disorder. Mention is also made of other disorders
which may present similar symptoms, and of
diagnostic tests which may be applied to confirm a
tentative diagnosis based on visible symptoms. The
section on managing sweet potato nutrition may
help in interpreting symptoms and in deciding what
further steps to take. A glossary of specialist terms
has also been included (Appendix 1).
To help the reader to locate relevant information
quickly, disorders have been grouped according to
where on the plant the symptoms are most likely to
be seen. At the back of the book (Appendix 2) is a
key to nutritional disorders based on their visible
symptoms, which serves as a quick reference to the
information on each disorder. The reader may wish
to consult the key first.
Plant nutrients are the chemical elements which
are essential components of plant tissue. For
healthy growth, plants require an adequate supply of
each of these elements. The most abundant elements
in plants, carbon (C), oxygen (0) and hydrogen (H),
are obtained from the air and water. The others,
referred to as the mineral nutrients, are supplied by
the mineral and organic components of the soil.
They are divided into two groups, according to their
abundance in plants. The macronutrients, nitrogen
(N), potassium (K), phosphorus (P), calcium (Ca),
magnesium (Mg) and sulfur (S), comprise from 0.1
to 6 % of dry plant material. The micronutrients,
including iron (Fe), chlorine (Cl), boron (B),
manganese (Mn), zinc (Zn), copper (Cu) and
molybdenum (Mo), have requirements in the order
of 0.1-100 mg per kg dry weight.
A deficiency of anyone nutrient results in a
reduced growth rate and yield of the crop. The
problem can only be corrected by increasing the
supply of that nutrient. No amount of N or P
fertilizer, for instance, can compensate for a
deficiency of B. Therefore, it is important to
diagnose a nutritional disorder correctly, in order to
treat it efficiently.
It is also important to recognise that supplying a
nutrient in excess of the crop's requirement is of no
Managing Sweet Potato Nutrition
benefit to the crop. It is an unnecessary expense, and
may cause environmental pollution when excess
nutrients leach into streams and groundwater
supplies.
Many mineral nutrients (including B, Cl, Mn
and Cu) are toxic to plants if they are present at high
concentrations. Some other elements, which are not
essential nutrients for sweet potato, may also cause
toxicity. These include aluminium (AI), a problem
in acid soils, and sodium (Na), in saline soils.
Causes of nutrient disorders
The supply of a mineral nutrient to the plant is
determined not only by its total abundance in the
soil, but also by the proportion of the total which is
in an available form at any time, and by the plant's
ability to capture this available component.
Usually only a small proportion of the total
nutrient is available for uptake. Availability of many
essential nutrients is affected by soil pH. At high pH
(alkaline soil), the solubility of P, and of many
micronutrients (e.g. Fe, Mn, Zn and Cu) is greatly
reduced, and the crop may experience deficiencies
of these nutrients. At low pH (acid soil), the
solubility of some elements, particularly P and Mo,
is reduced, while that of Al and Mn may be
13
increased to toxic levels. Disorders such as Al
toxicity, which inhibit root development, reduce the
plant's ability to capture nutrients and water, and
may induce symptoms of secondary disorders such
as Mg deficiency or water stress. It is important to
recognise the primary agent in such cases.
Deficiencies of macro nutrients, particularly N, P
and K, are often associated with fertility decline
following sequential cropping. These elements are
taken up in such large quantities by the crop that the
soil's reserves become depleted after a number of
crops have been produced. Increasing cropping
intensity results in an increasing dependence on
external supplies of these nutrients. In low-intensity
agriculture, supplies may be replenished during a
bush fallow, by allowing time for weathering of
mineral particles, by redistributing nutrients into the
crop's root zone from below, and by capture of
wind-borne nutrients from sea spray. Nutrients
accumulated by plants during the fallow become
available to the crop as the plant material
decomposes, or when it is burnt. Burning makes
many nutrients immediately available to the
following crop, but it also makes those nutrients
easily lost by leaching. Burning also decreases the
soil's ability to continue supplying nutrients, as
there is less organic material to decompose. Some

nutrients, particularly Nand S, are lost into the
atmosphere during burning.
Deficiencies of micronutrients are usually
associated with low natural abundance in the soil, or
unfavourable soil conditions causing insolubility of
these nutrients. In the case of low abundance,
correction usually requires the application of only a
few kilograms per hectare of the deficient nutrient,
which may be effective for a number of years. Such
inputs are likely to be cost-effective, even when the
application of N or P fertilizers is not. The
management is more difficult when the deficiency is
due to adverse soil conditions, such as the very high
pH in coralline soils. Applying the nutrient as a
foliar spray is one way to avoid it being fixed in
such soils. Increasing the organic matter content of
the soil is also beneficial.
Diagnosing nutrient disorders
Plants respond to a deficiency of any nutrient
firstly by decreasing their growth rate. Specific
symptoms which may allow the deficient nutrient to
be identified, usually occur only at relatively severe
levels of deficiency. Nevertheless, such symptoms
are often the first thing to alert the grower that there
is a problem, and they are very useful for diagnosis.
Since plant species differ in sensitivity to particular
nutrient stresses, observation of symptoms on other
crops in the same area should indicate to producers
and advisers that the problem may also be affecting
sweet potato, even if symptoms are not evident on
sweet potato crops. Chemical analysis of the plant
tissue provides a second diagnostic tool, which,
when available, can be very valuable for confirming
a tentative diagnosis based on visible symptoms, or
identifying a suspected problem when symptoms are
not visible.
If a soil is low in several nutrients, the plant
usually shows deficiency symptoms of the element
which is most limiting to growth. If that nutrient is
supplied, the growth rate will increase until it is
limited by the next most scarce nutrient, and a new
set of symptoms may develop. It is difficult to
establish from plant symptoms or tissue
composition which nutrients are likely to be
deficient other than the one most limiting. Soil tests
may provide some guidance, but they need to be
calibrated for each crop and soil type before they
can be interpreted with confidence.
One of the simplest and most reliable methods
of discovering all the nutrients which are deficient
in a soil is through small pot trials. In nutrient
omission pot trials, each pot receives an adequate
supply of all the mineral nutrients (control, or 'All'
treatment), or all minus one. Plants are grown for a
short period (usually 4-6 weeks), and the dry
weight of tops is compared with that of the 'All'
treatment. Any nutrient whose absence results in a
significant decrease in weight is regarded as
deficient. Usually an indicator plant such as maize is
used, which offers rapid and uniform establishment
14
from seed, and well characterised responses to
nutrient deficiencies. However, nutrient levels
which are deficient for one species may be adequate
for another. In recent studies, sweet potato tip
cuttings have been used successfully in nutrient pot
trials (Dowling et al. 1995, 1996).
If a nutrient deficiency is suspected, the best
way of confirming it is by observing a positive
response to fertilizer containing that nutrient. When
testing a fertilizer response, it is important to have
an untreated area for comparison. Usually a narrow
test strip in the middle of the field is treated with
fertilizer. Alternatively, fertilizer may be applied to
the whole field, with the exception of a central strip,
which would remain unfertilized. Fertilizers often
contain more than one nutrient, an it is important to
establish which nutrient is causing the response. For
example, Nand S deficiencies both produce similar
symptoms in the crop. They can be differentiated by
applying sulfate of ammonia (containing both Nand
S) to one strip and urea (containing only N) to
another. If the crop greens up in both strips, the
problem is N deficiency, but if it only responds to
the sulfate of ammonia, it is S deficiency.
Another useful technique for confirming
deficiencies of micronutrients is leaf painting. By
carefully painting half of an affected leaf with a
dilute solution of the suspected nutrient, the
response can be seen by comparing the colour or
expansion of the painted half with the unpainted
half. Leaf painting has been used successfully to
------------------------- - ---------------------------------------------------------------------------------------------------
diagnose deficiencies of Fe, Mn and Zn in sweet
potato.
Interpreting visible symptoms
Due to the different role played by each nutrient
in the plant, each nutritional disorder tends to
produce its own characteristic symptoms. Visible
symptoms provide a useful diagnostic tool which is
not dependent on costly laboratory equipment or
time-consuming chemical analyses. However, some
disorders produce rather similar symptoms or no
symptoms at all, and the effects of insect pests and
diseases may produce symptoms similar to those of
nutritional disorders. Environmental conditions (e.g.
moisture supply, temperature, light) may affect the
appearance and severity of nutrient disorders.
Cultivars may also differ in their expression of
symptoms. Sweet potato, in particular, shows
enormous diversity in the appearance of cultivars,
and this is reflected in the range of symptoms they
display. Nevertheless, there are distinct patterns, and
a careful observer can usually reduce the number of
possible causes to a few, if not to a single suspect.
Tentative diagnoses can then be confirmed by
applying fertilizer test strips, by soil tests, leaf
painting or plant tissue analyses.
Visible symptoms often take the form of
chlorosis, the reduction of green colour (chlorophyll
pigment) in the leaves. Chlorotic tissue may be light
green, yellow or whitish. Tissue furthermost from
the veins is often the most severely affected, as it is
last in the supply line. Hence, chlorosis patterns are
frequently described as interveinal, if the tissue on
and adjacent to the veins retains a darker colour than
the remainder of the leaf. To what degree the minor
veins retain their colour in addition to the major
veins, and the distance over which the colour
change is graduated, are additional features which
aid diagnosis. If the chlorosis affects the whole leaf
blade uniformly, it is referred to as 'general'. 'Vein
clearing', the case when the veins become paler than
the rest of the blade, is more often a symptom of
viral infection than of a nutritional disorder.
Necrosis is the death of tissue. It may occur
following chlorosis as part of a progressive
degradation, or it may arise in localised zones of the
leaf due to a critical disfunction. The location, shape
and size of necrotic lesions are useful discriminators,
as are the colour and texture of the dead tissue.
Other symptoms include changes in the
occurrence and intensity of secondary pigmentation
(red or purple colours), changes in the shape or
dimensions of plant parts such as thickening,
cupping or curling of the leaf blade, size reduction
of the blade, deformities causing irregularly shaped
or incomplete leaf blades, or shortening of
internodes on the stem.
In addition to the appearance of a particular
symptom, the position or location of that symptom on
the plant must be noted. Nutrients are absorbed by
the root system, and distributed among the various
15
plant parts. Some of these nutrients may be
redistributed to younger parts of the plant during
times of shortage either readily (e.g. K, P), more
slowly (e.g. S) or hardly at all (e.g. B, Ca). Thus,
deficiencies of K and P are likely to be observed first
on older leaves, that of S on both older and younger
leaves, and those of B and Ca on the younger leaves.
Elements taken up in excess of plant requirements
continue to be accumulated during the life of a leaf.
Thus, there will be a tendency for toxicity symptoms
to appear first on the older leaves where
accumulation has been occurring for the longest time.
In many locations, sweet potato flowers
sparingly or not at all. An unusually prolific or early
production of flowers is usually a sign that the crop
is under nutritional stress. However, as a number of
nutrient deficiencies can cause increased flowering,
this symptom is of little use in diagnosing the
particular deficiency.
Interpreting tissue analyses
Chemical analysis of plant tissue is also an
important technique in the diagnosis of nutritional
disorders. In annual crops, tissue analysis is most
often used in 'trouble-shooting' rather than in the
recommendation of fertilizer rates. However, if the
tissue samples are collected early in crop growth
and analyses are completed quickly, a corrective
fertilizer application may be possible within the
same season.

The interpretation of tissue analyses is based on
established relationships between crop yield and
nutrient concentrations in plant tissue (Fig. 1).
Critical concentrations are those which separate the
sufficient (healthy) range from the deficient or toxic
range. For practical purposes, critical concentrations
are defined as those concentrations associated with
90% of maximum yield (Ulrich and Hills 1973).
Between these concentrations is the range of
concentrations required for healthy growth.
Figure I.
I I I
I I I
I CrItIcal I concentration I for deficiency
CrItIcal I concentration I
for toXicity I Nutrient concentration in plant tissue
Schematic relationship between nutrient concentration in the plant tissue and dry matter yield relative to the maximum possible yield.
The relationship between crop yield and
concentration of a particular nutrient in plant tissue
may be determined by means of nutrient solution
culture experiments, glasshouse pot experiments, or
field experiments. Generally, field experiments are
considered the best (Bates 1971), but are
considerably more expensive than solution culture
and pot experiments. They also depend on the
availability of sites which are deficient in each of
the nutrients to be studied. The values given in this
publication have been derived from solution culture
experiments (O'Sullivan et al. 1996a). Where
possible, their reliability has been validated under
field conditions.
A certain part of the plant rather than the whole
plant, is usually collected for analysis. Leaves are
usually considered the most satisfactory parts (Bates
1971). Because leaves continue to accumulate some
nutrients with age, it is important that nutrient
concentrations in leaves of the same physiological
age are compared. In many annual crops, the blade
of the youngest fully expanded leaf is selected as the
'index' tissue for analysis. However, sweet potato
leaves may continue to expand throughout much of
their life, so their physiological maturity cannot be
judged easily on the basis of full expansion. The
many studies referred to in this book have selected
different leaves or parts of the vine for analysis,
which makes the information difficult to compare.
In our research, the blades of the 7th to 9th youngest
leaves have been selected as the index tissue (Table 3).
16
They were selected as being sufficiently responsive
to disorders of both mobile and immobile nutrients,
and having less variable nutrient concentrations than
younger leaves (O'Sullivan et al. 1996b).
Apart from the physiological age of the leaf, as
indicated by its position on the plant, tissue
composition may vary with the age or stage of
development of the crop. For instance, some
researchers have found the critical concentration for
N deficiency to decline with crop age. Caution
should therefore be exercised in applying the critical
concentrations established for young plants to tissue
taken from older crops. With regard to the values
given in Table 3, it should be noted that the sweet
potato plants grew more rapidly under experimental
conditions than could be expected in the field, and
that these plants may be equivalent to crops from 6
to 10 weeks of age, depending on the temperature
and water supply experienced by the crop. In any
case, they represent crops prior to the stage of rapid
growth of the storage roots. From the point of view
of applying corrective measures to the crop on the
basis of the diagnosis, it is preferable to sample the
crop at the earliest stage possible. However, in many
instances, symptoms of a disorder may not appear
until advanced stages of crop development. In such
cases, tissue analysis will still be valuable, but
discrepancies arising from plant age should be
borne in mind when interpreting the results.
Environmental conditions may further affect the
concentrations of nutrients found in leaves. The
concept of critical nutrient concentration requires
that the nutrient of interest is the only factor limiting
growth when the plant material is sampled. It has
been shown that water stress can change the nutrient
concentrations in leaves, and that plants take some
time to recover normal concentrations after
restoration of adequate water supply (Reuter and
Robinson 1986). For example, to establish the P
status of Stylosanthes humilis, Fisher (1980)
recommended that a period of several weeks without
water stress should precede the sampling of tissue.
This is not practical in many situations, but users
should be mindful of this potential source of error.
To collect leaf samples, the blades are removed
without the petiole, and should be dried as soon as
possible after sampling, using gentle heat
(e.g. 60--70°C for 48 hours) or microwaving. If
samples must be stored for more than a few hours
before drying, it is preferable to keep them cool
(e.g. in an ice box) to minimise the weight loss due
to respiration of the living tissue. It is important to
sample leaves that have not been contaminated with
soil. If the leaves are dusty, they may be gently
rinsed and blotted dry, but extended immersion in
water and rubbing should be avoided. Only distilled
or deionised water should be used.
When sampling a crop, it is best to take a
composite sample of leaves from several plants which
are equally affected by the symptom of concern
(Reuter and Robinson 1986). If the crop is not
uniformly affected, several samples could be taken,
each from small, uniform areas of the crop, from the
most to the least affected. The symptoms observed,
and the level of severity, should be recorded for each
sample, and the samples clearly labelled.
Soil analysis
The total amount of a nutrient in the soil does
not generally reflect the quantity available for
uptake by plant roots. Thus, chemical methods have
been developed, and continue to be developed, to
estimate the quantity of a nutrient that is available to
the plant. In addition to the requirement that the
method provide a good estimate of nutrient
availability in a defined range of soil types, soil
analysis methods must be rapid, accurate, and
reproducible before being accepted for routine use
in soil testing laboratories.
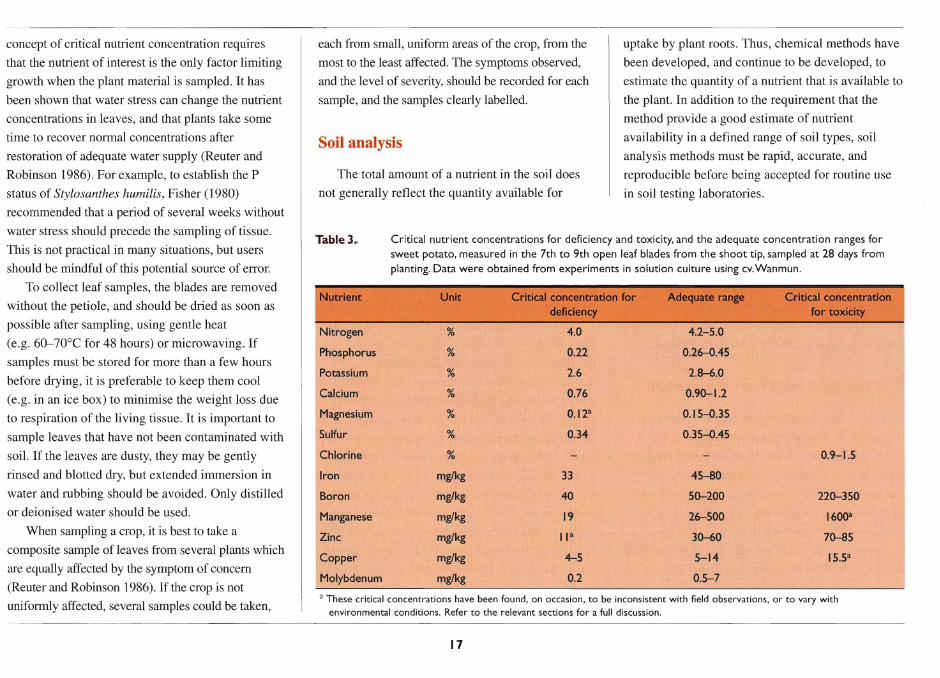
Table 3. Critical nutrient concentrations for deficiency and toxicity, and the adequate concentration ranges for sweet potato, measured in the 7th to 9th open leaf blades from the shoot tip, sampled at 28 days from planting. Data were obtained from experiments in solution culture using cv.Wanmun.
Nutrient Unit Critical concentration for Adequate range Critical concentration deficiency for toxicity
Nitrogen % 4.0 4.2-5.0
Phosphorus % 0.22 0.26-0.45
Potassium % 2.6 2.8-6.0
Calcium % 0.76 0.90-1.2
MagneSium % 0.12" 0.15-0.35
Sulfur % 0.34 0.35-0.45
Chlorine % 0.9-1.5
Iron mg/kg 33 45-80
Boron mg/kg 40 50-200 220-350
Manganese mg/kg 19 26-500 1600"
Zinc mg/kg II" 30-60 70-85
Copper mg/kg 4-5 5- 14 15.5"
Molybdenum mg/kg 0.2 0.5-7
a These critical concentrations have been found, on occasion, to be inconsistent with field observations. or to vary with
environmental conditions. Refer to the relevant sections for a full discussion.
17
The results of soil analyses are interpreted on the
basis of previously-established relationships
between crop yield and soil test. These relationships
may be established by means of glasshouse pot
experiments or field experiments. In either case,
they are specific to both the soil type and the crop
species (and to some extent, the cultivar) used in the
experiments, and can be applied to other crops or
soils only with a degree of caution and uncertainty.
One advantage of soil analyses is the fact that
they can be conducted, and fertilizers applied, before
a crop is planted. Disadvantages of soil analyses
include the difficulty of obtaining methods suited to
varied soil types, problems in sampling due to soil
variation across a field, and problems in estimating
the likely effects of environmental conditions in the
forthcoming season (Melsted and Peck 1973).
Correcting nutrient disorders
Once a nutritional problem has been correctly
diagnosed, it is usually possible to rectify it, if not
for the present crop, then at least for future crops at
the same site. Whether or not a corrective measure
can improve yields in an existing crop will depend
on the nature of the problem and on the age of the
crop when the diagnosis is made.
Nutrient deficiencies are alleviated by increasing
the supply of the deficient nutrient. Applying
inorganic fertilizers is one way of doing this.
Another may be to add organic material such as
animal manure, if it contains an appropriate balance
of the required nutrients. Other approaches aim to
change the soil properties, in order to increase the
availability of nutrients already present or to reduce
the supply of elements causing a toxicity. The pH of
acid soils may be increased by adding lime (CaC03)
or dolomite (CaC03.MgC03). Gypsum
(CaS04.2H20) may be used to correct problems of
soil surface crusting and poor permeability in saline
and sodic soils. In soils prone to waterlogging,
improved drainage may be necessary to reduce
denitrification, to reduce the production of toxic
forms of Mn, or simply to ensure that the roots
receive enough oxygen to function well. Sweet
potato roots are very sensitive to low oxygen supply.
Increasing the organic matter content of the soil
has a number of beneficial effects. The gradual
decomposition of this material provides a steady
supply of plant-available nutrients. The organic
particles may also provide a suitable substrate on
which soil nutrients can be held in an available
form. Organic matter increases the soil's ability to
resist acidification. It also increases water retention
so that the soil takes longer to dry out, and gives the
soil an open texture so that more air can get to the
roots. Organic matter is increased by leaving crop or
fallow residue on the field, without burning, or by
bringing plant material from another site. If the need
for field sanitation prevents leaving the crop
residue, then options may be to compost it and
return it later, or to use it to mulch another crop
18
which is not at risk from the pest. Often sweet
potato vines are removed and used to feed stock.
Returning the animal manure to the field replaces
some of the nutrients, but it will not maintain the
organic matter content of the soil unless
supplemented by plant material from fallow or
green manure crops.
Plant species, and even cultivars within species,
differ in their sensitivity to low nutrient levels in the
soil. They may vary in their nutrient uptake or in
tissue requirements for a particular nutrient. For
some crop species, agricultural scientists have
developed cultivars resistant to particular nutrient
problems, such as sunflower cultivars tolerant of
low B supply (Blamey et al. 1984), and barley
cultivars resistant to B toxicity. In sweet potato, a
great diversity of cultivars exist, and there is
evidence of regional adaptations conferring
tolerance to low N (Jones and Bouwkamp 1992),
and possibly to low B (D'Souza and Bourke 1986a).
Researchers have identified lines which are tolerant
of Al (e.g. Munn and McCollum 1976; Sangalang
and Bouwkamp 1988; Ritchey et al. 1991) or of
salinity and B toxicity (Chavez et al. 1995). It is
likely that variation exists in the requirements for
other nutrients also, which may be used in the future
for selection and breeding of cultivars to overcome
particular nutritional problems.
The approach taken to crop nutrition will depend
on the grower's context. Where fertilizers and water
are readily available and relatively inexpensive,

growers may aim to maximise the crop's potential by
eliminating any nutritional stress. Where fertilizers
are unavailable or too expensive, the aim may be to
optimise use of resources in the agroecosystem, in
order to gain an adequate and sustainable reward for
the grower's labour. At whatever level of operation,
it is important to recognise the limitations of the
resource base. A traditional cropping system may
become unsustainable through intensification,
whether by increasing the number of crop cycles
between fallows, or shortening the fallow period.
However, intensification is frequently paralleled by a
shift from subsistence to cash cropping. At some
point in this progression, the purchase of inputs,
including fertilizers, may become profitable. Grower
advisers should remain aware of the options, even if
some are not currently cost-effective.
Nutrient requirements of sweet potato
Sweet potato is regarded as being tolerant of
poor fertility, as it may produce adequate yields on
soils too poor for many other crops. However, the
yield obtained on poor soil will be only a fraction of
the potential yield for the cultivar. Often large
increases in yield can result from a modest increase
in nutrient supply.
Most of the nutrients taken up by a sweet potato
crop are removed from the site when the crop is
harvested. Depending on the extent of nutrient
reserves in the soil, this loss may be incurred only
once or several times before yields of subsequent
crops suffer from nutrient deficiency. The amount of
nutrients removed by the crop depends on the yield,
and on whether the vines are removed from the field
as well as the roots . Table 4 gives approximate rates
of nutrient removal for crops yielding 12 tlha of
storage roots (about the global average) and 50 tlha
(a high yield) . In an intensive farming system, those
nutrients for which the soil has limited reserves may
be supplemented by fertilizers . In addition to crop
removal, nutrient losses through leaching, soil
erosion and fixation will affect the actual fertilizer
requirement. In less intensive systems, the rate of
cropping that is sustainable will depend on the time
required for soil reserves to be mobilised, or organic
material to decompose, to replenish the plant
available nutrient pools in the soil.
Table 4. Estimated removal of nutrients from the soil by sweet potato crops of 12 tlha (average) and 50 tlha (high). for situations where only storage roots are harvested. and where both roots and vines are removed.
Roots and Vlnesb
Nitrogen 26 52 215
Phosphorus 6 9 38
Potassium 60 90 250 376
Calcium 3.6 16 15 65
Magnesium 3 6.5 12.5 27
Sulfur 1.8 4.3 7.5 18
Chlorine 10 18 43 75
Iron 0.060 0.160 0.250 0.670
Boron 0.024 0.074 0.100 0.310
Manganese 0.024 0.175 0.100 0.730
Zinc 0.036 0.062 0. 150 0.260
Copper 0.018 0.037 0.075 0. 155
Molybdenum 0.004 0.006 0.015 0.023
'Concentrations of nutrients in sweet potato roots and tops vary considerably. Quantities of nutrients removed have been based on representative concentrations from a number of sources (including Scott and Bouwkamp 1974; Bradbury and Holloway 1988; Woolfe 1992; Spence and Ahmad 1976; Diem 1962; Hill 1989; and the authors' own data), converted to fresh weight basis assuming 70% moisture in the storage roots and 86% moisture in the vines.
bA vine:root weight ratio of 0.6 was assumed. Actual ratios may vary in the approximate range OJ-I.4.
19

Disorders Producing Symptoms Mainly on the Older Leaves
Phosphorus deficiency
The phosphorus (P) availability to plants may be
limited by its low abundance in the soil, but also,
and very commonly, by its adsorption onto various
soil minerals. In acidic soils, P may be adsorbed by
Fe or Al oxides, and various clay minerals. Many of
the most fertile and productive soils in tropical
zones are derived from volcanic material containing
allophane minerals, which have a large P-fixing
capacity. Phosphorus deficiency is often the major
limitation to crop growth on these soils, particularly
where previous cropping has caused a depletion of
soil organic matter and increased acidification.
Phosphorus deficiency is also common on highly
weathered tropical soils and siliceous sands; in fact,
few soils are naturally well endowed with this
nutrient.
In calcareous soils, P may be adsorbed by
calcium carbonate, or precipitated as calcium
phosphate (Tisdale et al. 1993). The ability of sweet
potato to take up P may also be reduced by high pH.
Sweet potato was found to grow poorly in solution
culture maintained at pH 8.0 (Ila' ava 1997). This
was largely attributed to poor P uptake despite
continuous monitoring and maintenance of Pin
solution.
Sweet potato has been reported to be relatively
tolerant of low soil P status (de Geus 1967). A
number of fertilizer trials in the USA have shown
little or no yield responses of sweet potato to the
application of P fertilizers (Bouwkamp 1985; Jones
and Bouwkamp 1992). In these trials, it appears that
residual P from previous crops was sufficient to
supply the needs of the sweet potato crop.
Sweet potato's efficiency in obtaining soil Pis
due in part to its association with vesicular
arbuscular mycorrhizae (VAM). These ubiquitous
soil fungi invade the plant roots and feed on its
sugars, and in return they assist with the capture of
P from soils with low P availability. Mycorrhizal
infection has been shown to increase sweet potato
growth and yield in a number of studies (e.g.
Paterson et al. 1987; Kandasamy et al. 1988;
Mulongoy et al. 1988; Khasa et al. 1992; Paula et al.
1992, 1993; Dowling et al. 1994). Floyd et al.
(1988) found that the extent of mycorrhizal
infection was positively correlated with yield, and
negatively correlated with the crop response to P
fertilizer, over a range of soils in the Highlands of
PNG. The effect is greatest under low P fertility
(Negeve and Roncadori 1985), and VAM may have
no benefit or even a negative effect on crops which
are well supplied with P.
21
Although sweet potato may yield relatively well
under low P conditions, P deficiency is still a very
common cause of reduced yields. Goodbody and
Humphreys (1986) found significant positive
correlations between sweet potato yield and
available P in each of three soil types surveyed in
Simbu province of PNG. Also in Highland PNG,
Floyd et al. (1988) obtained a three-fold increase in
yield in response to P fertilizers, when K was also
supplied. Recent field trials have demonstrated a
large positive response of sweet potato to P fertilizer
on a number of volcanic ash soils in Tonga
(Halavatau et al. 1996) and andisols in PNG
(Dowling et al. 1994). Crop surveys in Uganda
showed P deficiency to be the most severe problem
of sweet potato on heavily cropped and acidified
soils in the Kabale region (E. Carey and J. Low,
pers. comm. 1996).
It is clear from many such examples that wider
use of P fertilizers will play an important role in
improving sweet potato production, as it has for
other crops. However, it is also evident that rates of
P fertilizers recommended for other crops may be
excessive and wasteful when used on sweet potato.
I Symptoms of phosphorus deficiency
Mild to moderate P deficiency may be difficult
to recognise in the field. Growth may be reduced to
less than one half that of well nourished plants,
without the appearance of any identifiable
symptoms of P deficiency (Plate la) . Mild P
deficiency is often associated with a darker than
normal, bluish green colour of the foliage. Unlike N
deficiency, young to mature leaves remain dark
green at all levels of severity. Obvious symptoms on
the older leaves are associated with severe stunting
(Plate Ib).
The first sign of P deficiency is usually the
premature senescence of older leaves. In most (but
not all) cultivars, yellowing is preceded by the
appearance of purple anthocyanin pigments,
producing a range of autumnal colours in the
senescing leaves (Plate Ic). Yellowing may spread
from discrete interveinal patches, which typically
become cleared of anthocyanin pigment (Plate Id),
or may be more general, but often affecting one half
of the blade more than the other (Plate Ie). In this
case, the chlorotic areas may appear orange or red
due to the overlying anthocyanin pigments. Necrotic
lesions subsequently develop in the chlorotic zones
(Plate If), and the necroses spread as irregular
patches until the leaf blade is entirely brown and
dry. In some cultivars (e.g. Markham, Plate Ig) no
yellow or purple phase precedes the necrotic
lesions, which appear on green tissue. However, as
in other cultivars, those parts of the leaf blade which
are not yet necrotic tum yellow in the final stages of
senescence (Plate Ih).
Some cultivars may develop purple
pigmentation on the upper surface of the youngest
leaves, particularly on the veins (Plate Ii). This may
resemble N deficiency, although in P deficiency it is
less common among cultivars, and is less strongly
veinal.
Possible confusion with other symptoms
The appearance of red pigmentation on the veins
of young leaves may resemble N deficiency.
However, in the case of P deficiency, there is no
general chlorosis of the plant. Potassium and Mg
deficiencies also cause chlorosis on older leaves, but
in P deficiency chlorosis usually does not retain a
distinct interveinal pattern, as is more typical of K
or Mg deficiencies.
Sweet potato feathery mottle virus (SPFMV)
may also induce chlorotic spots surrounded by
purple tissue on older leaves. Lesions caused by the
virus are randomly scattered over the leaf blade, and
are not restricted to the oldest leaves on the vine.
The symptoms do not progress to cause necrotic
lesions or orange and red colours on the senescing
leaves, as seen in P deficiency.
22
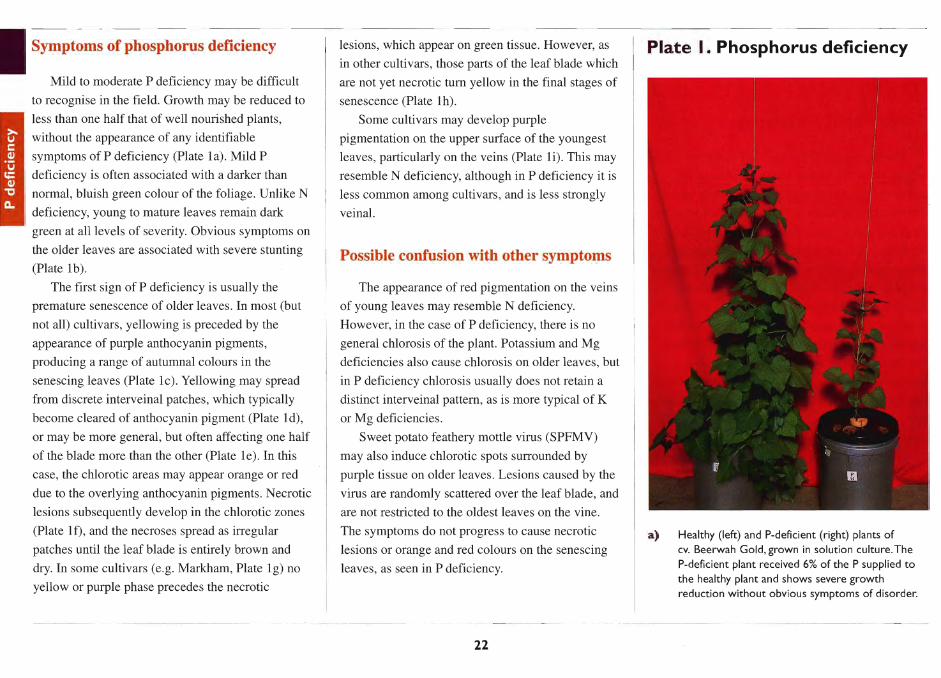
Plate I. Phosphorus deficiency
a) Healthy (left) and P-deficient (right) plants of cv. Beerwah Gold, grown in solution culture. The P-deficient plant received 6% of the P supplied to the healthy plant and shows severe growth reduction without obvious symptoms of disorder.
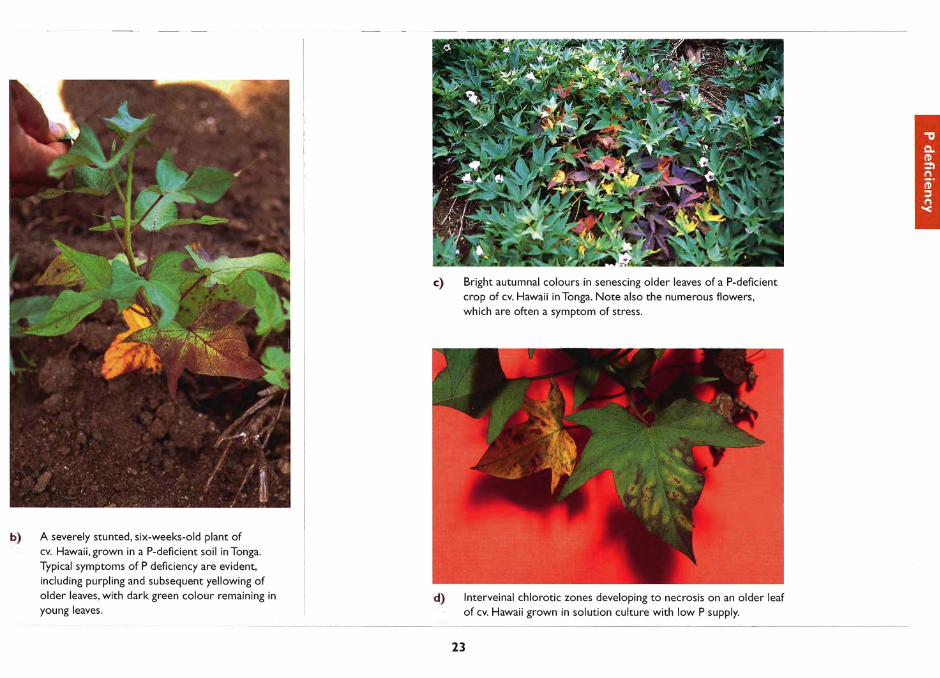
b) A severely stunted, six-weeks-old plant of cv. Hawaii, grown in a P-deficient soil in Tonga.
Typical symptoms of P deficiency are evident, including purpling and subsequent yellowing of older leaves, with dark green colour remaining in
young leaves.
c) Bright autumnal colours in senescing older leaves of a P-deficient crop of cv. Hawaii in Tonga. Note also the numerous flowers, which are often a symptom of stress.
d) Interveinal chlorotic zones developing to necrosis on an older leaf of cv. Hawaii grown in solution culture with low P supply.
23
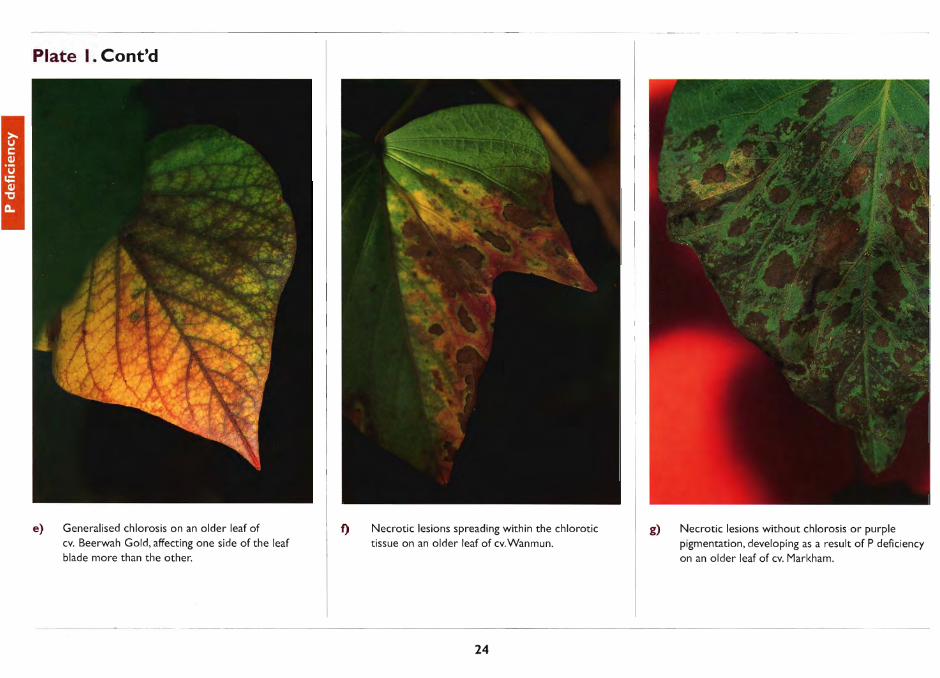
Plate I. Cont'd
e) Generalised chlorosis on an older leaf of
cv. Beerwah Gold, affecting one side of the leaf blade more than the other.
f) Necrotic lesions spreading within the chlorotic tissue on an older leaf of cv.Wanmun.
24
g) Necrotic lesions without chlorosis or purple pigmentation, developing as a result of P deficiency on an older leaf of cv. Markham.

h) Yellowing and extensive necrosis on a senescing leaf due to P deficiency in cv. Markham.
i) Purple pigmentation on the young leaves of a P-deficient plant of cv. Markham. Healthy plants of this cultivar have no purple pigmentation.
25
Diagnostic soil and plant tissue tests
In solution culture experiments, a critical
concentration of 0.22% P has been estimated in the
blades of the 7th to 9th youngest leaves.
Concentrations between 0.26 and 0.45% P were
associated with maximal growth (Table 3). These
concentrations concur with those of Leonard et al.
(1949) and Weir and Cresswell (1993).
Little work has yet been done to calibrate soil tests
for predicting yield response of sweet potato to
applied P. Bingham (1962) suggested that available P
levels in the range 5-7 mglkg (Olsen's method)
correspond to the threshold for deficiency in crops
with a low P requirement, such as sweet potato.
Goodbody and Humphreys (1986) obtained positive
regressions between available P and sweet potato
yield, on soils ranging from 0.6 to 5 mglkg available P
(Olsen's method). Fox et al. (1974) gave
0.001 ppm (0.3/-.IM) as the minimum soil solution
concentration of P associated with 95% of maximum
yield of sweet potato, and Nishimoto et al. (1977)
found that a soil solution concentration of
0.003 ppm (O.l/-.lM) corresponded to a yield 70% of
the optimum. It should be noted that these
measurements include only part of the P in soil
organic matter, which may represent a considerable
proportion of the P available to the crop in some soils.
Measurements of phosphate binding capacity, in
addition to plant-available P, have been used to
estimate the quantity of P fertilizer required on

phosphate-fixing soils. Phosphate binding can be
estimated using phosphate sorption isotherms (Fox
and Kamprath 1970), or phosphate retention
(Saunders 1974). These methods have been
described by Rayment and Higginson (1992).
Correction of phosphorus deficiency
Phosphorus deficiency can be corrected by
broadcast, band or spot application of soluble P
sources, such as single or triple superphosphate,
ammonium phosphate, or mixed fertilizers
(containing N, P and K, with or without other
nutrients). Band or spot application of P fertilizers is
recommended on strongly P-fixing soils.
Rock phosphate is a relatively cheap alternative
to more soluble fertilizers. Rock phosphate should
be well incorporated into the soil, and is usually
only effective on acidic soils, due to its very low
solubility at neutral to high pH. On an acid lateritic
soil, Kabeerathumma et a1. (1986) found rock
phosphate to be equally effective as superphosphate
on the first sweet potato crop, and to have a greater
residual effect.
Single superphosphate (10% P) also contains S
and Ca, and is recommended in soils where these
nutrients are also low. Triple superphosphate (TSP,
24% P) also contains Ca, but not S.
A sweet potato crop will remove about 8-40 kg
P/ha from the soil depending on yield (Table 4), but
on P-fixing soils, much higher rates of application
(> 1 00 kg P/ha) may be needed in the first year of
application. In subsequent years, lower rates may
suffice to maintain an adequate supply of P to the
crop.
Traditional subsistence methods of cultivating
sweet potato, including the incorporation of
substantial amounts of organic matter and using
large, healthy runners for planting, add significant
amounts of P, as well as other nutrients .
Decomposition of organic matter provides a steady
supply of plant-available P even on highly P-fixing
soils. An important part of the response of sweet
potato crops to organic matter additions is due to
improved P nutrition (Floyd et al. 1988).
26

Potassium deficiency
Root crops have a high requirement for
potassium (K) compared with cereals, as the content
of K in the harvested roots is high (see Table 4). A 20
t/ha sweet potato crop removes approximately 100
kg Kfha in the storage roots, and considerably more
is removed if both roots and vines are harvested
(Table 4). Even soils which are naturally high in K
may become depleted after several successive crops.
On various soils in PNG which had been
continuously cropped with sweet potato for several
years, large yield increases were obtained by the
application of either inorganic K fertilizer or organic
composts high in K (Bourke 1985b; D'Souza and
Bourke 1986a, b; Floyd et al. 1988).
In contrast to N or P deficiencies, K deficiency
tends to have a much greater effect on storage root
yield than on the growth of the tops (Edmond and
Sefick 1938; Bourke 1985b). Thus, correction of an
apparently mild deficiency may result in large yield
increases.
Symptoms of potassium deficiency
As with other major nutrients, K deficiency can
cause substantial growth reduction before specific
symptoms develop (Plate 2a). In the field,
symptoms often develop after two to three months,
when the expanding storage roots begin to place
increased demand on K supplies. Yellowing appears
on the oldest leaves, while the youngest leaves
retain a normal colour, size and texture (Plate 2b). If
young leaves are normally purple, this pigmentation
may be reduced in K deficient plants (Plate 2a).
The oldest leaves develop a yellow chlorosis in
marginal and interveinal zones (Plate 2c). Brown
necrotic lesions develop within the chlorotic zones
(Plate 2d) and eventually spread to cover the entire
leaf blade. Cultivars vary in the extent to which
lesions spread predominantly from the margins to
interveinal zones, are initiated in interveinal regions
nearer the midrib, or spread with relatively little
regard for veinal distribution. Necrosis associated
with K deficiency is usually dark in colour, and the
necrotic areas become dry and brittle.
The yellowing and necrosis may be preceded by
a light green interveinal mottle affecting mature to
older leaves, and often most obvious on the leaves of
axillary shoots. This may be the earliest, or only sign
of the disorder, but depending on cultivar and
conditions, it may not develop. Initially, leaves of
intermediate age may be more affected than the older
leaves (Plate 2e). Minor veins retain their green
colour, finely dividing the chlorotic tissue. In some
cases, the interveinal tissue may become necrotic,
either remaining as isolated pits (Plate 2f) or
coalescing to form small, irregular lesions (Plate 2g).
Potassium deficient crops tend to produce small,
thin storage roots of poor quality (Plate 2h).
Orange-fleshed varieties usually have a paler-than
normal flesh colour.
27
Plate 2. Potassium deficiency
a} Growth response of sweet potato cv.Wanmun to
K supply in a solution culture experiment. Plants from left to right received 100%, 14% and 1.7% of the optimum K supply. Note that yellowing of the oldest leaves is apparent only on the more severely deficient plant (right).

Plate 2. Cont'd
b) A K-deficient crop of cv. Foketi grown in Tonga on an old volcanic ash soil low in K.
28
c) Yellow chlorosis spreading from margins and interveinal patches of an older leaf of cv.Wanmun, and early the development of necrotic lesions.

d) The spread of chlorosis and necrosis on senescing older leaves of cv. Wanmun.
e) Light green interveinal chlorosis on a leaf of intermediate age, cv.Wanmun.
29
f) Small necrotic lesions following interveinal chlorosis on a mature leaf of cv. Markham.

Plate 2. Cont'd
g) Irregular necrotic patches developing from the joining of small interveinal lesions on mature leaves of cv. Beerwah Gold.
h) Slender, under-sized storage roots from a K-deficient crop of mixed cultivars, on the Nembi Plateau, PNG.The garden had been cropped with sweet potato for a number of years. (Photo: R.M. Bourke)
30
Possible confusion with other symptoms
The appearance of an interveinal chlorotic
mottle or small necrotic pits in interveinal tissue of
leaves of intermediate age may resemble symptoms
of Mn deficiency. However, in the case of Mn
deficiency, the green zones around veins are broader
and more diffuse. The absence of symptoms on the
youngest leaves, and the occurrence of necrotic
lesions on the oldest leaves indicate K deficiency.
Interveinal patches of necrosis surrounded by
chlorotic zones are also symptomatic of Mg
deficiency. Mg-deficient crops are generally pale in
colour, and the pattern of interveinal chlorosis is
usually more regular, with the major veins
remaining green for their entire length.
Diagnostic soil and plant tissue tests
The determination of a critical concentration for
K in sweet potato leaves is complicated by the fact
that sweet potato has some capacity to substitute Na
for part of its K requirement. In the presence of
sufficient Na, a critical concentration of 2.6% K has
been determined in the 7th to 9th youngest leaf
blades (Table 3). In solution culture experiments
with very low Na concentrations, the critical
concentration for K was found to be approximately
4.0% (0 ' Sullivan et al. 1997a; Ivahupa 1997).
The maximum substitution effect seems to be
achieved at relatively low Na concentrations
(Ivahupa 1997), which would be found in most
soils. Therefore, a critical concentration of 2.6%
would apply in most field situations. This appears to
be consistent with field observations of the response
of crops to K fertilizer.
Soil exchangeable K measurements are
frequently used to predict the K status of crops, but
they do not reflect the soil's reserves of potentially
available K, which may be released over a period of
time. Crop responses to K fertilization are generally
expected at exchangeable K values in the range
0.2-0.6 cmol( + )/kg soil, although this relationship
depends on the soil texture and total cation
exchange capacity (CEC): sandy soils may respond
only in the range 0.05-0.25 cmol( + )/kg (Landon
1991). In the Highlands ofPNG, Goodbody and
Humphreys (1986) found a positive correlation
between sweet potato yield and exchangeable K
over a range of 0.2-1.0 cmol( + )/kg soil.
Correction of potassium deficiency
Since sweet potato crops remove a considerable
amount of K from the soil (approximately 8 kg Kin
storage roots plus vines per 1 t of roots), continuous
cropping without fertilization can lead to the
exhaustion of soil K reserves. Potassium deficiency
occurs most commonly on sandy soils, which have a
low CEC, and on oxisols and ultisols with low base
status. Some volcanic ash soils have large K
reserves, while others may have a low CEC, and
therefore low available K and a poor ability to retain
added K.
Potassium can be added to the soil either in the
form of inorganic fertilizer or in organic mulches
and composts. Recommendations for fertilizer
additions range from 80 to 200 kg K/ha (de Geus
1967). Organic mulches are much more bulky than
inorganic fertilizers, therefore requiring more
labour, but the efficiency of nutrient use by the crop
may be higher (Floyd et al. 1988). D'Souza and
Bourke (l986b) recommended an application of
coffee pulp compost at 20 t/ha in the Nembi Plateau
ofPNG.
Split applications of K, before planting and after
4 weeks of growth, are often used (Hill 1989), with
the fertilizer banded along the row. However, Fujise
and Tsuno (1967) recommended ploughing in K
fertilizer to a depth of 40 cm, noting that it is the
deeper roots which most actively provide K for
tuber growth in the late stages of crop development.
Such deep placement is rarely practised, other than
by the burial of compost under mounds in some
traditional production systems.
Excessive application of K may lead to Mg or
Ca deficiency, due to depression of the uptake of
these elements (Spear et al. 1978). On sandy soils in
particular, Mg and Ca applications may be
necessary in addition to K to maintain a favourable
balance (Landon 1991).
31

Magnesium deficiency
Magnesium (Mg) deficiency may result either
from low Mg content in the soil or from an
overabundance of K or Ca which inhibit Mg uptake
by the crop (Leonard et al. 1948). Therefore, the
disorder is most likely to occur on sandy soils with
low CEC, on volcanic ash soils of high K status, or
on some calcareous soils. Overfertilization with K
may also induce Mg deficiency. In strongly acidic
soils, Mg deficiency may be induced by the
presence of toxic concentrations of Al in the root
environment, which inhibit Mg uptake by the plant
(see Aluminium toxicity).
Symptoms of magnesium deficiency
A Mg-deficient crop will tend to have a pale
overall colour. The earliest specific symptom of Mg
deficiency is an interveinal chlorosis of older leaves
(Plate 3a). Typically, the main veins retain a
relatively broad margin of dark green tissue, but the
minor veins are less well defined, resulting in radial
bands of pale tissue between the main veins (Plates
3b & c). However, in some cultivars the chlorosis is
more mottled, composed of isolated patches, or the
veins retain little green margin, and appear as a
green network on a generally pale leaf (Plate 3d).
Chlorosis first appears on the oldest leaves, but may
spread to quite young leaves (Plate 3e). It may be
accompanied by upward or downward curling of the
leaf margins (Plates 3d & a), or a wilty drooping of
the leaf blades (Plate 3d).
Purple or red-brown pigment may appear on
older leaves in conjunction with chlorosis. Most
commonly, pigmentation affects the upper surface
of interveinal patches near the leaf tip and margins
(Plate 3f), but in some cultivars the veins under the
leaf may become red (Plate 3g).
Chlorosis generally progresses to yellowing and
necrosis of the oldest leaves. Leaves may become
entirely yellow and wilted before browning off
(Plate 3h), or necrosis may develop on interveinal and
marginal tissue without prior necrosis (Plate 3i). Most
commonly, localised yellowing precedes necrotic
lesions, which spread from interveinal zones (Plate 3j).
The vines of Mg-deficient plants may become
thin and twining, with lengthened internodes, a
response similar to etiolation (Plate 3k).
Lengthening of vines in response to Mg deficiency
was also reported by Edmond and Sefick (1938).
Possible confusion with other symptoms
Potassium deficiency may also produce
interveinal necrotic lesions surrounded by chlorosis
in oldest leaves. However, in the case of Mg
deficiency, necrosis is usually in a more regular
pattern around the leaf, confined to interveinal and
marginal zones. In addition, the senescing leaves are
generally wilted, and the necrotic tissue is usually
paler and remains soft.
32
Plate 3. Magnesium deficiency
a) Healthy (left) and Mg-deficient (right) plants of cv. Beerwah Gold,grown in solution culture, showing growth reduction accompanied by chlorosis, downward curling and some red pigmentation of the older leaves.

b) Symptoms of Mg deficiency in cv. Kisozi in the Kabale district of Uganda. Interveinal chlorosis begins on recently mature leaves and increases in intensity with leaf age. Some
brown pigmentation is also present on the older, chlorotic leaves. (Photo:J . Low)
33
c) Interveinal chlorosis caused by Mg deficiency in
cv. Hawaii, showing a broad margin of dark green tissue flanking the midvein and main veins, but little definition of the minor veins.
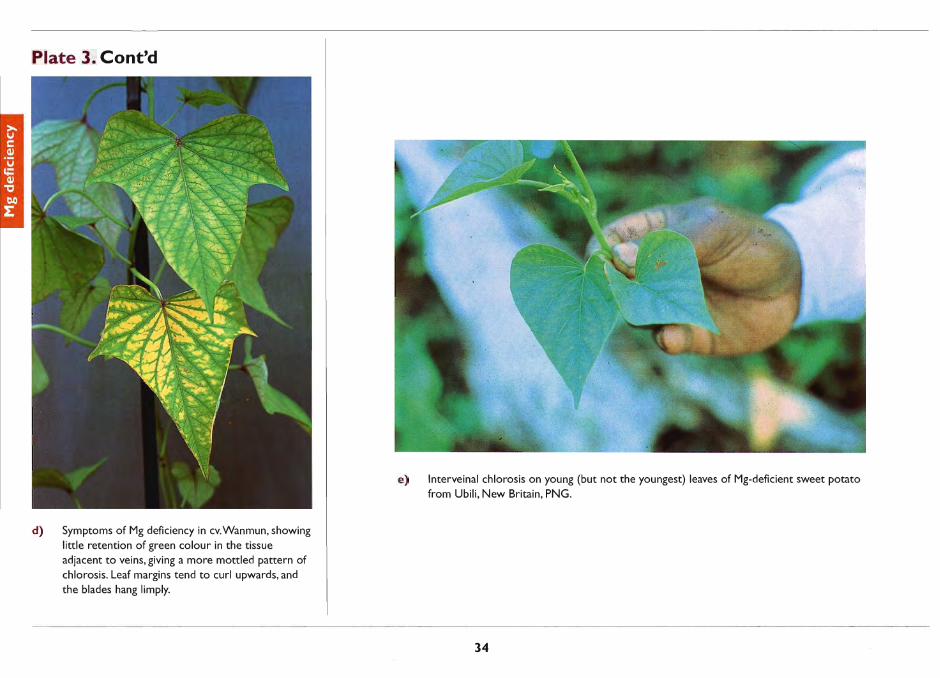
Plate 3. Cont'd
d) Symptoms of Mg deficiency in cV.Wanmun, showing little retention of green colour in the tissue adjacent to veins, giving a more mottled pattern of chlorosis. Leaf margins tend to curl upwards, and the blades hang limply.
e) Interveinal chlorosis on young (but not the youngest) leaves of Mg-deficient sweet potato from Ubili, New Britain, PNG.
34
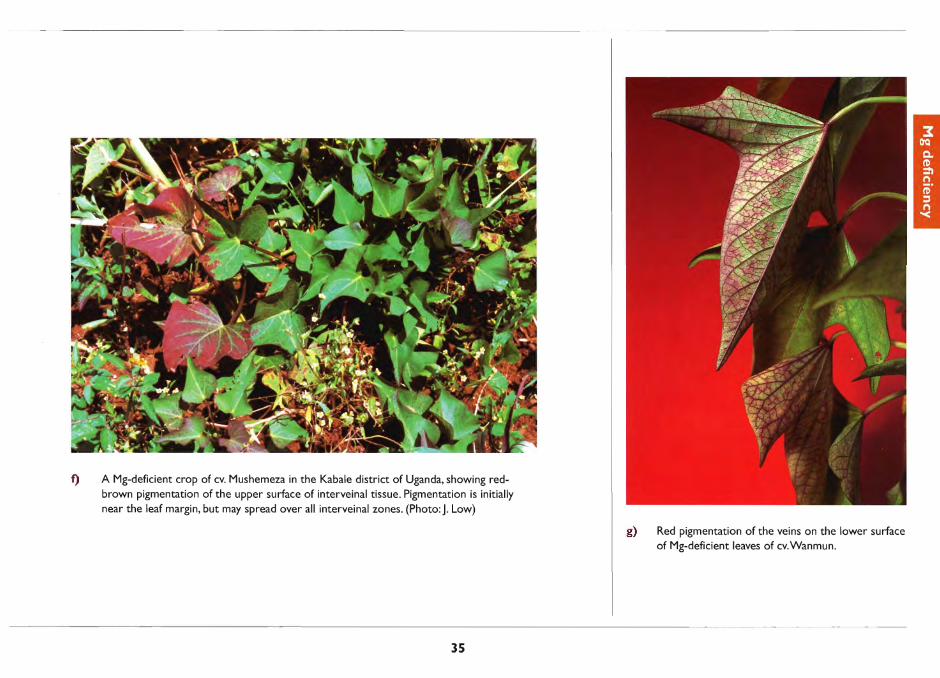
f) A Mg-deficient crop of cv. Mushemeza in the Kabale district of Uganda, showing redbrown pigmentation of the upper surface of interveinal tissue. Pigmentation is initially near the leaf margin, but may spread over all interveinal zones. (Photo:J. Low)
35
g) Red pigmentation of the veins on the lower surface of Mg-deficient leaves of cv.Wanmun.
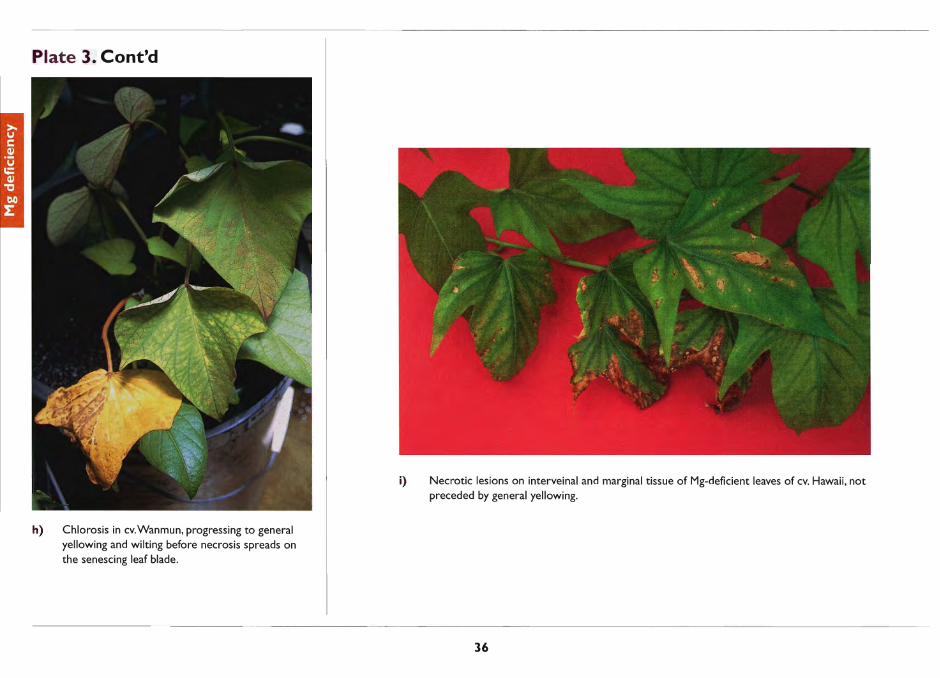
Plate 3. Cont'd
h) Chlorosis in cv.Wanmun, progressing to general yellowing and wilting before necrosis spreads on the senescing leaf blade.
i) Necrotic lesions on interveinal and marginal tissue of Mg-deficient leaves of cv. Hawaii, not preceded by general yellowing.
36
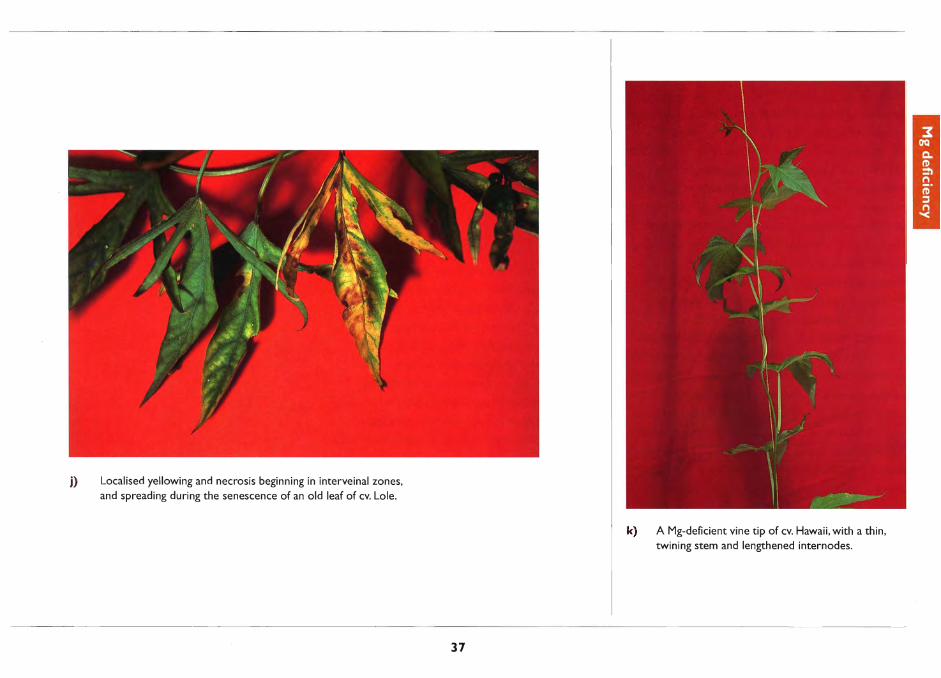
j) Localised yellowing and necrosis beginning in interveinal zones, and spreading during the senescence of an old leaf of cv. Lole.
37
k) A Mg-deficient vine tip of cv. Hawaii, with a thin, twining stem and lengthened internodes.
Diagnostic soil and plant tissue tests
The critical concentration for Mg in sweet potato
leaves is not yet well defined, as various sources of
information are not in good agreement. In particular,
estimates based on solution- or sand-culture
experiments tend to be lower than those observed in
the field. Differences between the experimental
results are probably mostly attributable to the
selection of different tissues for analysis. In solution
culture experiments, a critical concentration (leaf
blades 7-9 at 4 weeks) of 0.12% Mg was estimated
for Mg deficiency, while healthy plants were
observed to contain 0.15-0.35% Mg (Table 3).
Bolle-Jones and Ismunadji (1963) induced Mg
deficiency in sand culture, and reported a
concentration of 0.06% Mg in Mg-deficient plants
(all leaf blades at 8 weeks), and 0.14-0.22% Mg in
the leaves of non-deficient plants. Also using sand
culture, Spence and Ahmad (1967) reported a
concentration of 0.16% Mg (whole shoot to 9th leaf
at 10 weeks) in plants showing early symptoms of
Mg deficiency, while plants receiving adequate Mg
supply contained from 0.37% to 0.94% Mg.
However, symptoms observed in field crops in
Uganda and Australia have been associated with
concentrations in the index leaves of 0.29-0.37%
Mg (authors' data), and in USA 0.40% Mg has been
reported in an Mg-deficient crop (from Reuter and
Robinson 1986).
Soil tests have not been calibrated for sweet
potato response to Mg. For other field crops, neutral
1 M ammonium acetate-exchangeable Mg levels of
greater than 80-160 cmol( + )/kg are generally
considered adequate. European standards
recommend consideration of soil test K levels also,
with a K:Mg ratio of less than 5, on a weight-of
element basis, being desirable (Doll and Lucas
1973).
Correction of magnesium deficiency
Magnesium deficiency may be corrected by
incorporation of dolomitic lime or magnesium oxide
into acid soils (20-50 kg Mg/ha), or by band
application of kieserite or fertilizer-grade
magnesium sulfate (10-40 kg Mg/ha). As
magnesium sulfate is the most soluble of these
sources, it is the preferred source where it is
necessary to correct an observed Mg deficiency in
an established crop, although it is often more
expensive than other sources. If top-dressing of the
established crop is difficult, magnesium sulfate may
be applied as a foliar spray or by fertigation.
38
Boron toxicity
Boron (B) toxicity is most likely to arise on
saline and alkaline soils, following over-fertilization
with B fertilizer, or following the application of
irrigation water high in B. Chavez et al. (1995)
reported that a combination of salinity and B
toxicity was the main cause of low yields of
irrigated sweet potato in southern coastal Peru.
Sweet potato appears to be only moderately
tolerant of B toxicity, but this assessment was made
according to the appearance of symptoms on sand
cultured plants, and may not reflect yield reduction
(Landon 1991).
Symptoms of boron toxicity
Boron toxicity causes conspicuous necrotic
lesions in the interveinal areas of older leaves
(Plate 4a), leading to premature senescence and
shedding of the leaves. Affected leaves are usually
cupped downwards, or curled under at the tip. In
solution culture, symptoms may be evident on plants
suffering only a minor reduction in growth due to B
toxicity, but in the field root damage may result in
severe stunting and poor survival of cuttings.
In some cultivars, initial symptoms may be the
development of a pale green to whitish interveinal
chlorosis (Plate 4b), but in other cultivars necrotic
spots may be preceded by only a localised chlorosis,
with the surrounding tissue remaining green
(Plate 4c). Necrotic spots may be light brown
(Plate 4b), dark brown (Plates 4c & d), or have a
dark outline (Plate 4e). The necrotic tissue is brittle,
and in some instances may drop out, leaving 'shot
holes' .
Lesions are usually concentrated near the leaf
margins and in interveinal tissue midway between
main veins, but may appear initially to be more
scattered (Plate 4c). They may spread and coalesce
to occupy most of the interveinal and marginal
tissue (Plates 4d & e). However, in cultivars with
deeply divided leaf blades, the distribution may be
less regular (Plate 4f).
Leaf senescence proceeds rapidly, with the
remaining live tissue turning yellow, and necrosis
spreading from the initial lesions over the entire
blade (Plates4g & e).
Chavez et al. (1995) found considerable
variation in tolerance to B toxicity among cultivars
of sweet potato, but noted that the severity of
foliage damage was not related to the root yield of
the cultivar.
Possible confusion with other symptoms
Salinity may induce symptoms of necrotic
lesions in interveinal tissue, similar to those caused
by B toxicity. However, the necrotic lesions in the
case of salinity are usually a dark, steel-grey colour
and first appear on the margins of older leaves,
although as symptoms spread to younger leaves,
39
they become less marginal and more interveinal.
Plants suffering from B toxicity may develop
interveinal chlorosis well in advance of necrotic
lesions. With salinity, chlorosis is uncommon except
immediately surrounding the necrotic lesions.
In the early stages of symptom development in
some cultivars, B toxicity may induce interveinal
chlorosis similar to that of Mg deficiency. The
appearance on older leaves of discrete necrotic spots
would distinguish B toxicity from Mg deficiency.
Necrotic lesions, if produced with little preceding
chlorosis, may be mistaken for those caused by fungal
pathogens, such as Alternaria spp., Cercospora
bataticola and Phyllosticta batalas. Fungal lesions
may be recognised by their random distribution on the
leaf blade, not showing a regular interveinal pattern.
While fungal lesions may be more common on older
leaves, they do not show a consistent decrease in
severity from the oldest to younger leaves.
Diagnostic soil and plant tissue tests
The critical concentration for B toxicity in the
7th to 9th youngest leaf blades of sweet potato has
been found to lie between 220 and 350 mg B/kg
(Table 3). Concentrations of 400-800 mg B/kg
were associated with 30-50% growth reductions,
while concentrations from 1200 to more than
2000 mg B/kg were found in severely affected
plants. Index leaves from healthy plants usually
contain 50-200 mg B/kg.
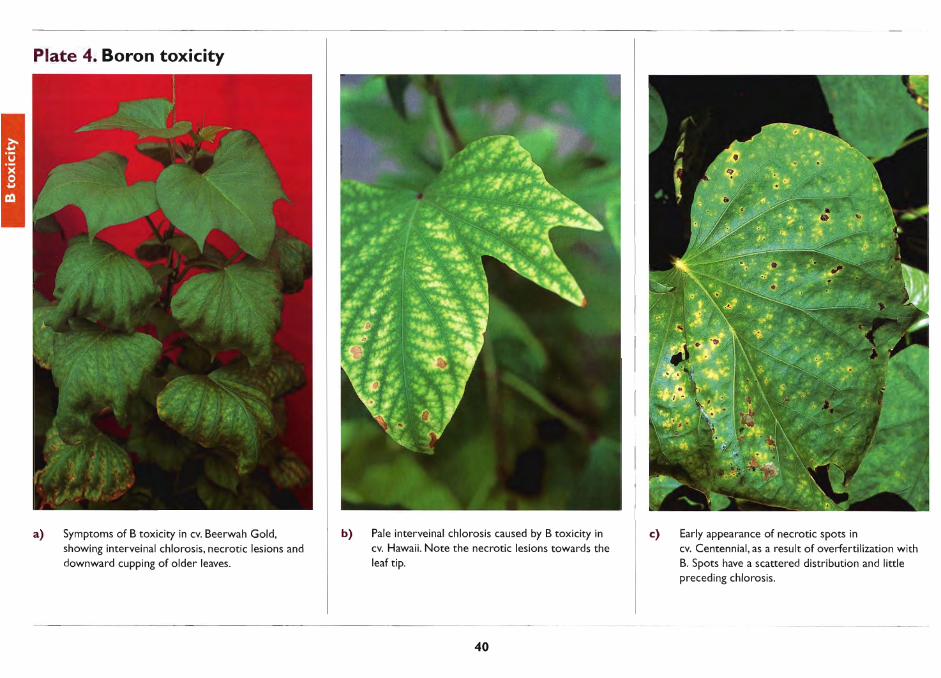
Plate 4. Boron toxicity
a) Symptoms of B toxicity in cv. Beerwah Gold, showing interveinal chlorosis, necrotic lesions and downward cupping of older leaves.
b) Pale interveinal chlorosis caused by B toxicity in cv. Hawaii. Note the necrotic lesions towards the leaf tip.
40
c) Early appearance of necrotic spots in cv. Centennial, as a result of overfertilization with B. Spots have a scattered distribution and little preceding chlorosis.
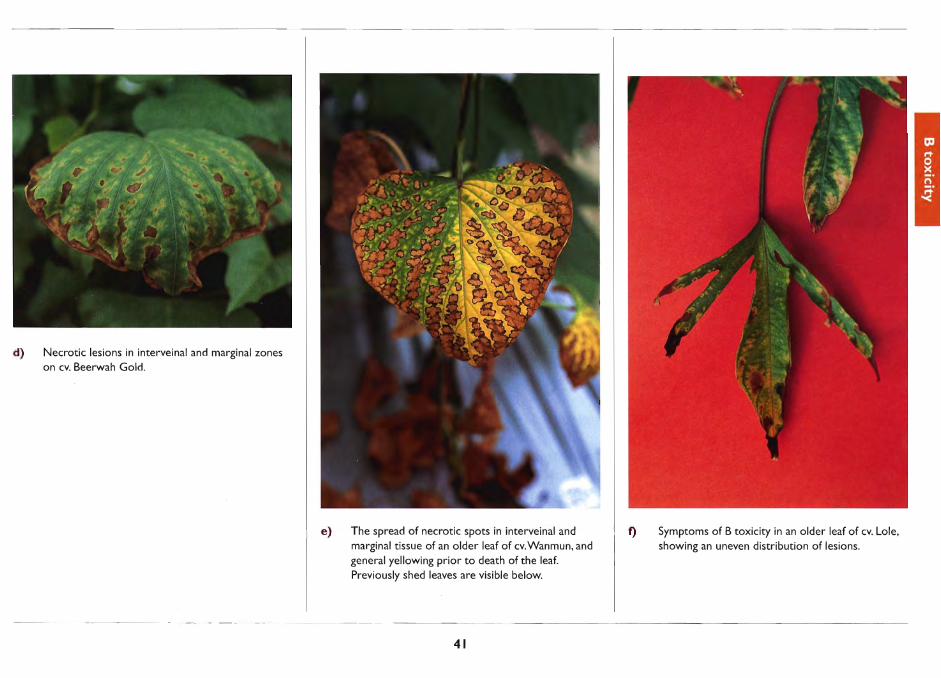
d) Necrotic lesions in interveinal and marginal zones on cv. Beerwah Gold.
e) The spread of necrotic spots in interveinal and marginal tissue of an older leaf of cv.Wanmun, and general yellowing prior to death of the leaf. Previously shed leaves are visible below.
41
f) Symptoms of B toxicity in an older leaf of cv. Lole, showing an uneven distribution of lesions.
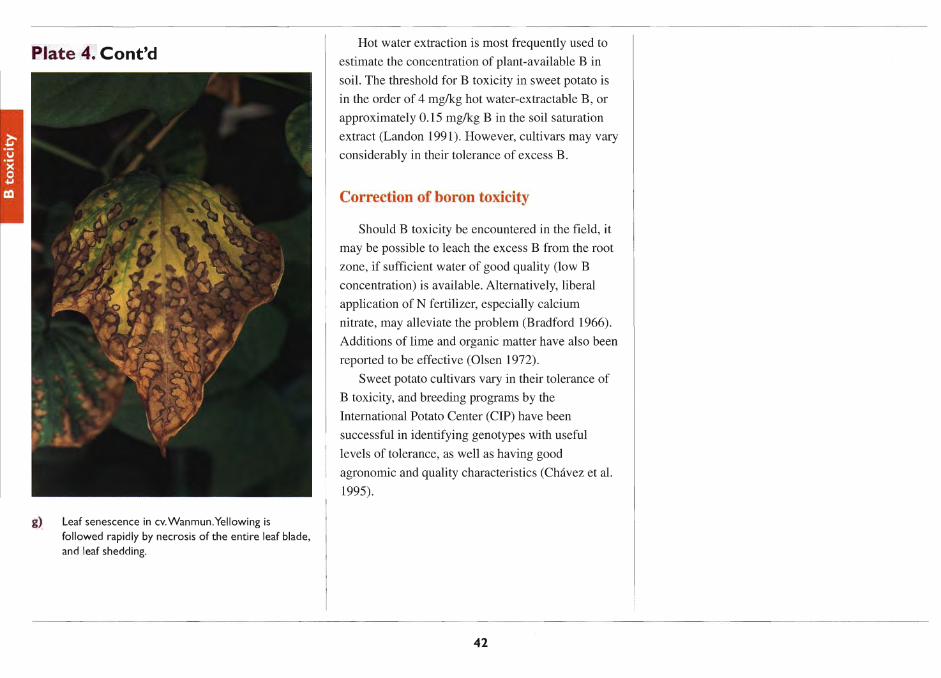
Plate 4. Cont'd
g) Leaf senescence in cv.Wanmun.Yeliowing is
followed rapidly by necrosis of the entire leaf blade, and leaf shedding.
Hot water extraction is most frequently used to
estimate the concentration of plant-available B in
soil. The threshold for B toxicity in sweet potato is
in the order of 4 mg/kg hot water-extractable B, or
approximately 0.15 mg/kg B in the soil saturation
extract (Landon 1991). However, cultivars may vary
considerably in their tolerance of excess B.
Correction of boron toxicity
Should B toxicity be encountered in the field, it
may be possible to leach the excess B from the root
zone, if sufficient water of good quality (low B
concentration) is available. Alternatively, liberal
application of N fertilizer, especially calcium
nitrate, may alleviate the problem (Bradford 1966).
Additions of lime and organic matter have also been
reported to be effective (Olsen 1972).
Sweet potato cultivars vary in their tolerance of
B toxicity, and breeding programs by the
International Potato Center (CIP) have been
successful in identifying genotypes with useful
levels of tolerance, as well as having good
agronomic and quality characteristics (Chavez et al.
1995).
42
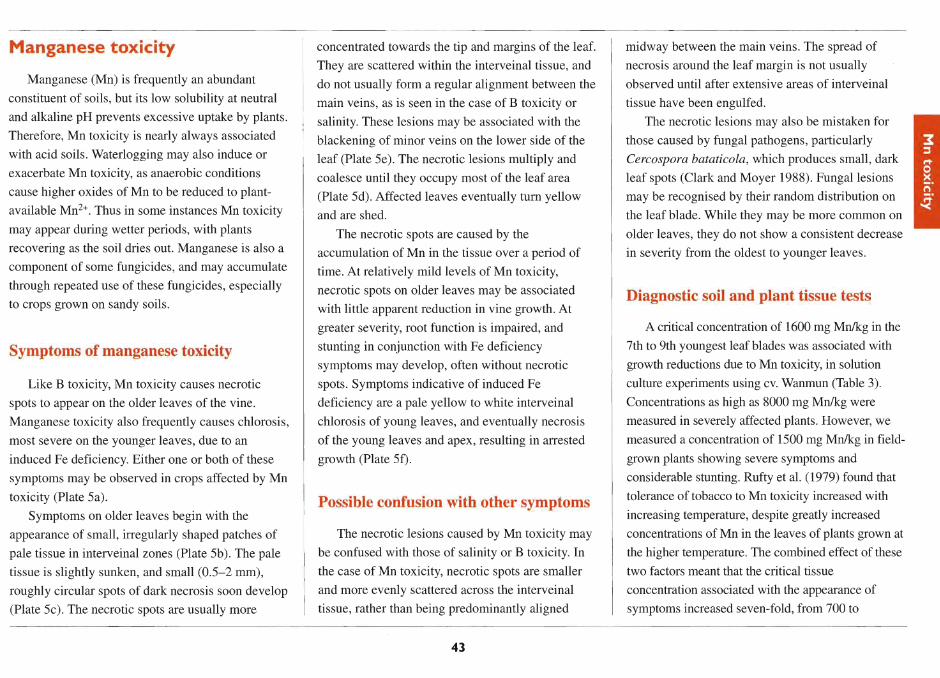
Manganese toxicity
Manganese (Mn) is frequently an abundant
constituent of soils, but its low solubility at neutral
and alkaline pH prevents excessive uptake by plants.
Therefore, Mn toxicity is nearly always associated
with acid soils. Waterlogging may also induce or
exacerbate Mn toxicity, as anaerobic conditions
cause higher oxides of Mn to be reduced to plant
available Mn2+. Thus in some instances Mn toxicity
may appear during wetter periods, with plants
recovering as the soil dries out. Manganese is also a
component of some fungicides , and may accumulate
through repeated use of these fungicides, especially
to crops grown on sandy soils.
Symptoms of manganese toxicity
Like B toxicity, Mn toxicity causes necrotic
spots to appear on the older leaves of the vine.
Manganese toxicity also frequently causes chlorosis,
most severe on the younger leaves, due to an
induced Fe deficiency. Either one or both of these
symptoms may be observed in crops affected by Mn
toxicity (Plate Sa).
Symptoms on older leaves begin with the
appearance of small, irregularly shaped patches of
pale tissue in interveinal zones (Plate Sb). The pale
tissue is slightly sunken, and small (0.S-2 mm),
roughly circular spots of dark necrosis soon develop
(Plate Sc). The necrotic spots are usually more
concentrated towards the tip and margins of the leaf.
They are scattered within the interveinal tissue, and
do not usually form a regular alignment between the
main veins, as is seen in the case of B toxicity or
salinity. These lesions may be associated with the
blackening of minor veins on the lower side of the
leaf (Plate Se). The necrotic lesions multiply and
coalesce until they occupy most of the leaf area
(Plate Sd). Affected leaves eventually tum yellow
and are shed.
The necrotic spots are caused by the
accumulation of Mn in the tissue over a period of
time. At relatively mild levels of Mn toxicity,
necrotic spots on older leaves may be associated
with little apparent reduction in vine growth. At
greater severity, root function is impaired, and
stunting in conjunction with Fe deficiency
symptoms may develop, often without necrotic
spots. Symptoms indicative of induced Fe
deficiency are a pale yellow to white interveinal
chlorosis of young leaves, and eventually necrosis
of the young leaves and apex, resulting in arrested
growth (Plate Sf).
Possible confusion with other symptoms
The necrotic lesions caused by Mn toxicity may
be confused with those of salinity or B toxicity. In
the case of Mn toxicity, necrotic spots are smaller
and more evenly scattered across the interveinal
tissue, rather than being predominantly aligned
43
midway between the main veins. The spread of
necrosis around the leaf margin is not usually
observed until after extensive areas of interveinal
tissue have been engulfed.
The necrotic lesions may also be mistaken for
those caused by fungal pathogens, particularly
Cercospora bataticola, which produces small, dark
leaf spots (Clark and Moyer 1988). Fungal lesions
may be recognised by their random distribution on
the leaf blade. While they may be more common on
older leaves, they do not show a consistent decrease
in severity from the oldest to younger leaves.
Diagnostic soil and plant tissue tests
A critical concentration of 1600 mg Mn/kg in the
7th to 9th youngest leaf blades was associated with
growth reductions due to Mn toxicity, in solution
culture experiments using cv. Wanmun (Table 3).
Concentrations as high as 8000 mg Mn/kg were
measured in severely affected plants. However, we
measured a concentration of IS00 mg Mn/kg in field
grown plants showing severe symptoms and
considerable stunting. Rufty et al. (1979) found that
tolerance of tobacco to Mn toxicity increased with
increasing temperature, despite greatly increased
concentrations of Mn in the leaves of plants grown at
the higher temperature. The combined effect of these
two factors meant that the critical tissue
concentration associated with the appearance of
symptoms increased seven-fold, from 700 to
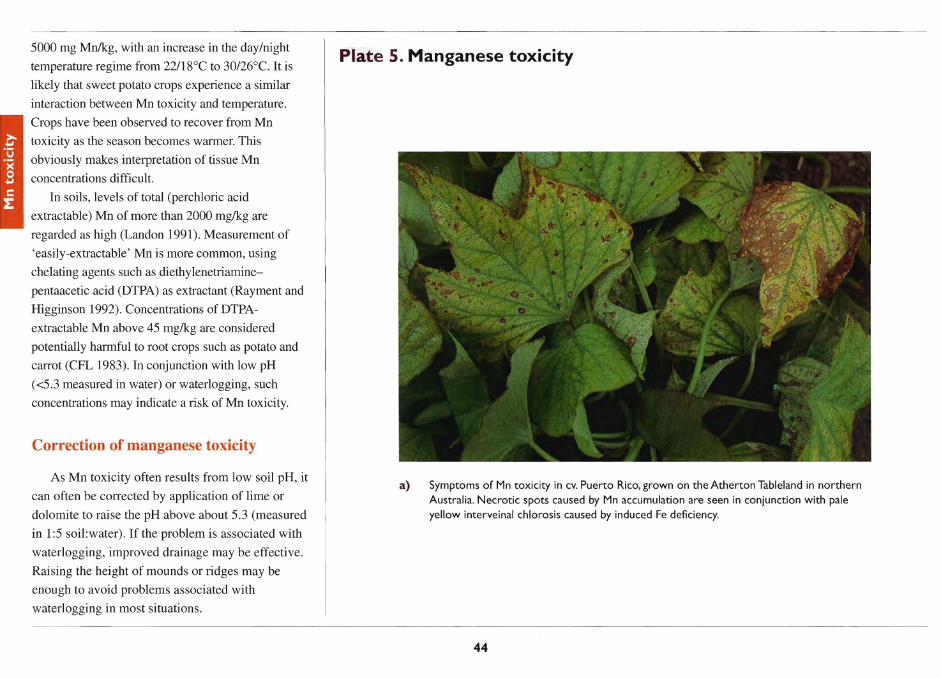
5000 mg Mnlkg, with an increase in the day/night
temperature regime from 22/18°C to 30/26°C. It is
likely that sweet potato crops experience a similar
interaction between Mn toxicity and temperature.
Crops have been observed to recover from Mn
toxicity as the season becomes warmer. This
obviously makes interpretation of tissue Mn
concentrations difficult.
Iri soils, levels of total (perchloric acid
extractable) Mn of more than 2000 mg/kg are
regarded as high (Landon 1991). Measurement of
'easily-extractable' Mn is more common, using
chelating agents such as diethylenetriamine
pentaacetic acid (DTPA) as extractant (Rayment and
Higginson 1992). Concentrations ofDTPA
extractable Mn above 45 mglkg are considered
potentially harmful to root crops such as potato and
carrot (CFL 1983). In conjunction with low pH
«5.3 measured in water) or waterlogging, such
concentrations may indicate a risk of Mn toxicity.
Correction of manganese toxicity
As Mn toxicity often results from low soil pH, it
can often be corrected by application of lime or
dolomite to raise the pH above about 5.3 (measured
in 1:5 soil:water). If the problem is associated with
waterlogging, improved drainage may be effective.
Raising the height of mounds or ridges may be
enough to avoid problems associated with
waterlogging in most situations.
Plate 5. Manganese toxicity
a) Symptoms of Mn toxicity in cv. Puerto Rico, grown on the Atherton Tableland in northern Australia. Necrotic spots caused by Mn accumulation are seen in conjunction with pale yellow interveinal chlorosis caused by induced Fe defiCiency.
44
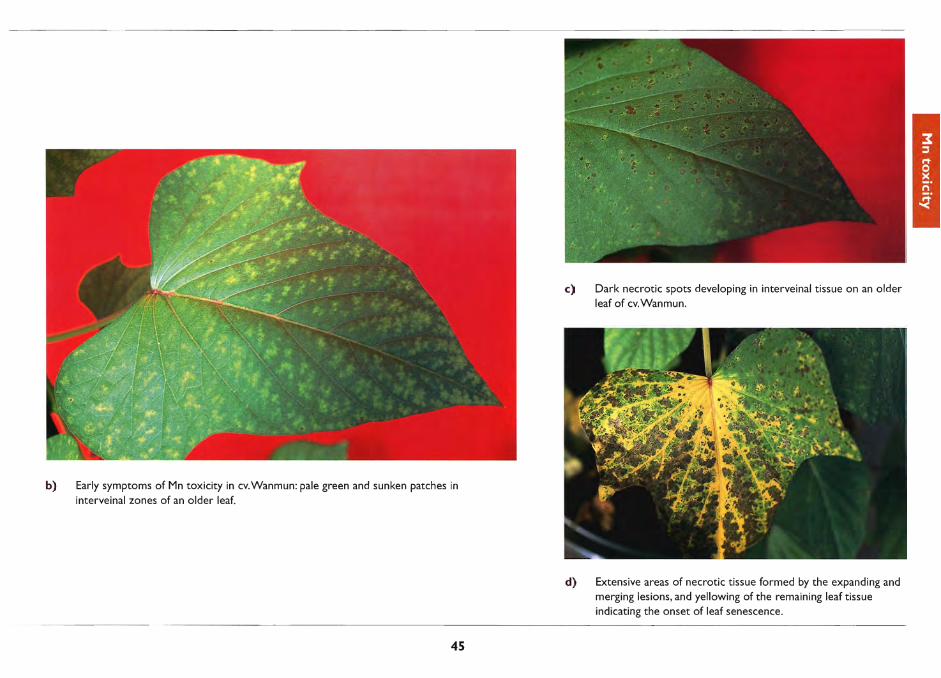
b) Early symptoms of Mn toxicity in cv.Wanmun: pale green and sunken patches in interveinal zones of an older leaf.
45
c) Dark necrotic spots developing in interveinal tissue on an older leaf of cv.Wanmun.
d) Extensive areas of necrotic tissue formed by the expanding and merging lesions, and yellowing of the remaining leaf tissue indicating the onset of leaf senescence.
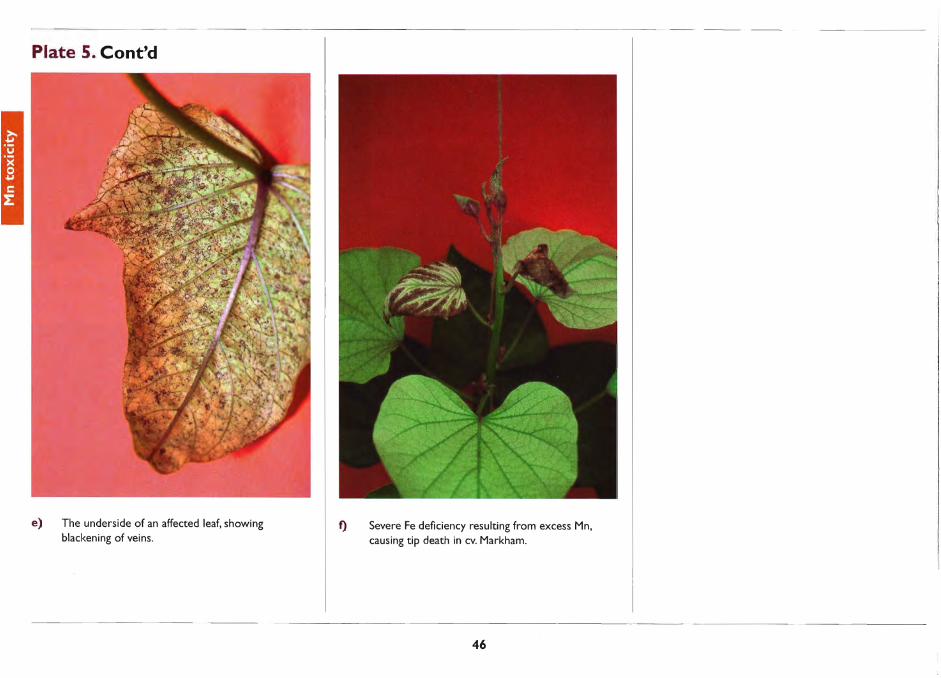
Plate 5. Cont'd
e) The underside of an affected leaf, showing blackening of veins.
f) Severe Fe deficiency resulting from excess Mn, causing tip death in cv. Markham.
46
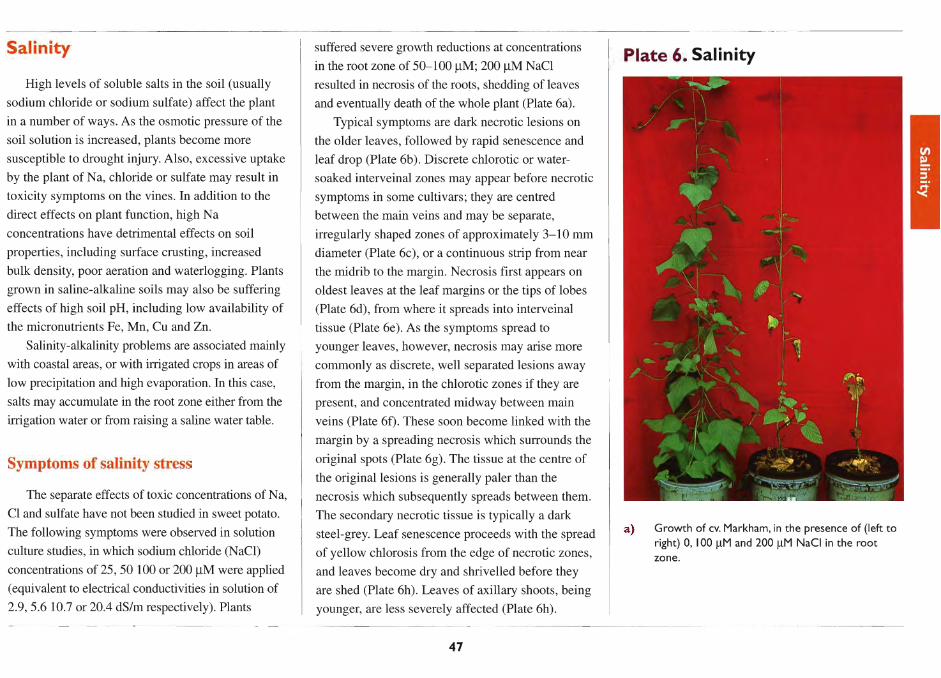
Salinity
High levels of soluble salts in the soil (usually
sodium chloride or sodium sulfate) affect the plant
in a number of ways. As the osmotic pressure of the
soil solution is increased, plants become more
susceptible to drought injury. Also, excessive uptake
by the plant of Na, chloride or sulfate may result in
toxicity symptoms on the vines. In addition to the
direct effects on plant function, high Na
concentrations have detrimental effects on soil
properties, including surface crusting, increased
bulk density, poor aeration and waterlogging. Plants
grown in saline-alkaline soils may also be suffering
effects of high soil pH, including low availability of
the micronutrients Fe, Mn, Cu and Zn.
Salinity-alkalinity problems are associated mainly
with coastal areas, or with irrigated crops in areas of
low precipitation and high evaporation. In this case,
salts may accumulate in the root zone either from the
irrigation water or from raising a saline water table.
Symptoms of salinity stress
The separate effects of toxic concentrations of N a,
CI and sulfate have not been studied in sweet potato.
The following symptoms were observed in solution
culture studies, in which sodium chloride (NaCI)
concentrations of 25,50 100 or 200 /-lM were applied
(equivalent to electrical conductivities in solution of
2.9, 5.6 10.7 or 20.4 dS/m respectively). Plants
suffered severe growth reductions at concentrations
in the root zone of 50-100 /-lM; 200 /-lM NaCl
resulted in necrosis of the roots, shedding of leaves
and eventually death of the whole plant (Plate 6a).
Typical symptoms are dark necrotic lesions on
the older leaves, followed by rapid senescence and
leaf drop (Plate 6b). Discrete chlorotic or water
soaked interveinal zones may appear before necrotic
symptoms in some cultivars; they are centred
between the main veins and may be separate,
irregularly shaped zones of approximately 3-10 mm
diameter (Plate 6c), or a continuous strip from near
the midrib to the margin. Necrosis first appears on
oldest leaves at the leaf margins or the tips of lobes
(Plate 6d), from where it spreads into interveinal
tissue (Plate 6e). As the symptoms spread to
younger leaves, however, necrosis may arise more
commonly as discrete, well separated lesions away
from the margin, in the chlorotic zones if they are
present, and concentrated midway between main
veins (Plate 6f). These soon become linked with the
margin by a spreading necrosis which surrounds the
original spots (Plate 6g). The tissue at the centre of
the original lesions is generally paler than the
necrosis which subsequently spreads between them.
The secondary necrotic tissue is typically a dark
steel-grey. Leaf senescence proceeds with the spread
of yellow chlorosis from the edge of necrotic zones,
and leaves become dry and shrivelled before they
are shed (Plate 6h). Leaves of axillary shoots, being
younger, are less severely affected (Plate 6h).
47
Plate 6. Salinity
a) Growth of cv. Markham, in the presence of (left to right) 0, 100 I-lM and 200 I-lM NaCI in the root zone.
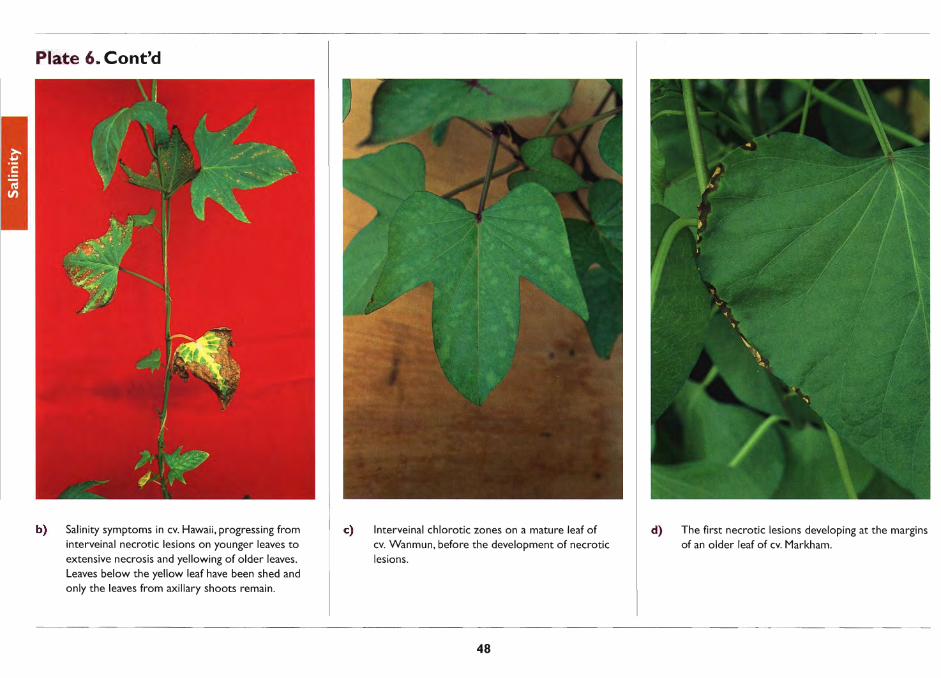
Plate 6. Cont'd
b) Salinity symptoms in cv. Hawaii, progressing from interveinal necrotic lesions on younger leaves to extensive necrosis and yellowing of older leaves.
Leaves below the yellow leaf have been shed and only the leaves from axillary shoots remain.
c) Interveinal chlorotic zones on a mature leaf of cv. Wanmun, before the development of necrotic lesions.
48
d) The first necrotic lesions developing at the margins of an older leaf of cv. Markham.
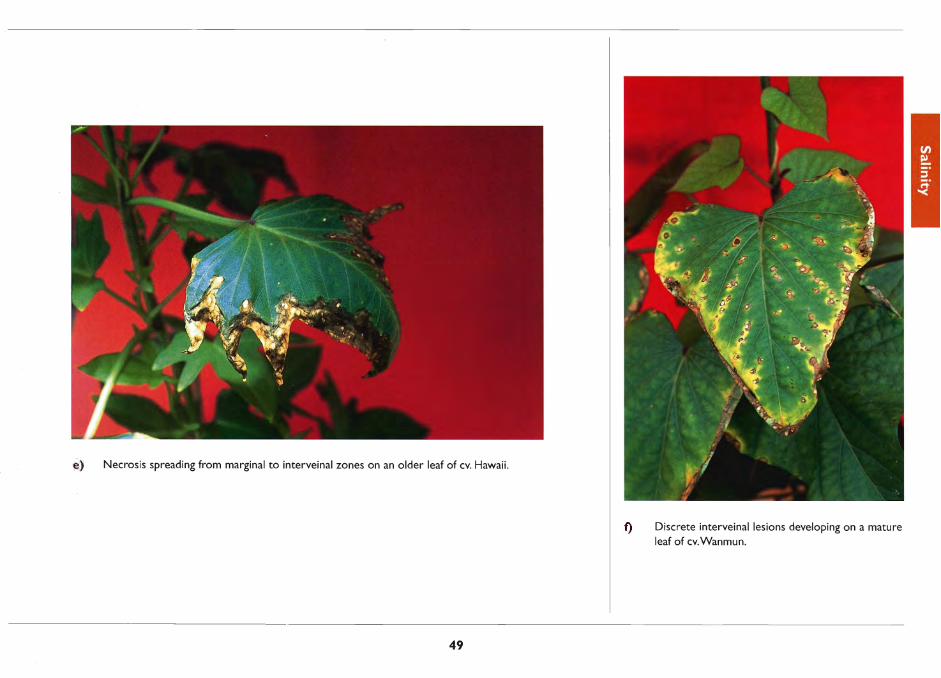
e) Necrosis spreading from marginal to interveinal zones on an older leaf of cv. Hawaii.
49
1) Discrete interveinal lesions developing on a mature leaf of cv.Wanmun.
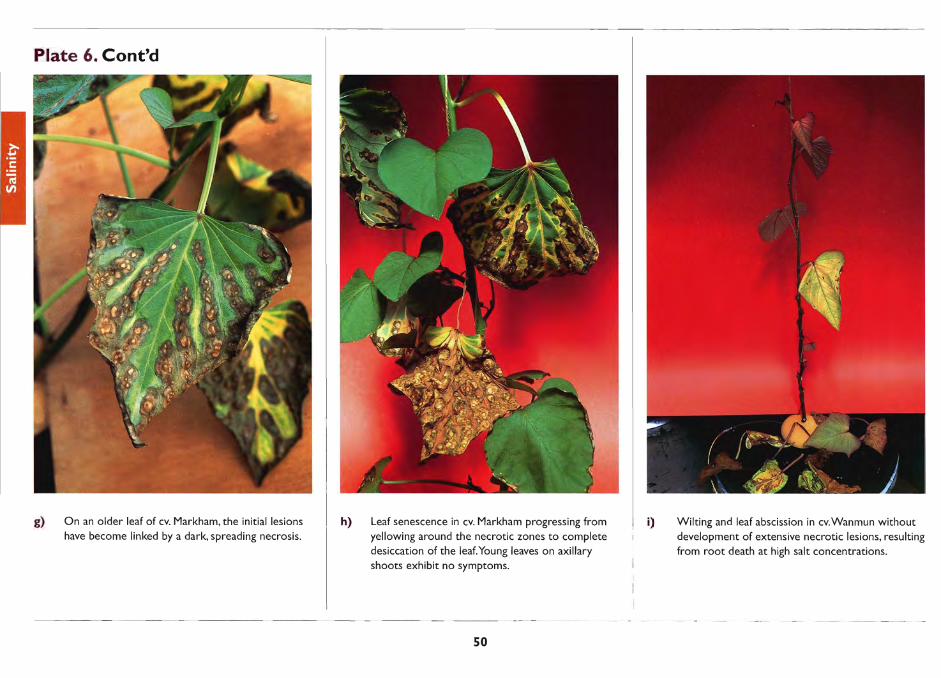
Plate 6. Cont'd
g) On an older leaf of cv. Markham, the initial lesions have become linked by a dark, spreading necrosis.
h) Leaf senescence in cv. Markham progressing from yellowing around the necrotic zones to complete desiccation of the leaf.Young leaves on axillary shoots exhibit no symptoms.
50
i) Wilting and leaf abscission in cv.Wanmun without
development of extensive necrotic lesions, resulting from root death at high salt concentrations.
In severe cases in which the roots are
extensively damaged, the plant becomes slightly
wilted and generally chlorotic, and older leaves may
be shed before the development of extensive
necrosis (Plate 6i). Necrosis of stem tissue may lead
to the death of the shoot tip.
Salinity appears to have a greater effect on the
development of storage roots than on the vines. Greig
and Smith (1962) studied effects of chloride salts of
Na, K, Ca and Mg, and found that all produced
similar symptoms on the vines, and that vine growth
was correlated with the osmotic concentration in the
culture solution. However, only Na treatments
significantly reduced storage root yield. At levels of
NaCI which had little or no effect on top growth, root
yield was considerably reduced. Sodium-affected
storage roots were smaller and thinner than those of
healthy plants, but NaCI did not reduce the number of
storage roots per plant (Greig and Smith 1961).
Possible confusion with other symptoms
Boron toxicity also produces necrotic lesions on
older leaves. Necrotic lesions resulting from B
toxicity usually remain discrete, or expand and fuse,
while secondary necrosis does not spread until after
the leaf has turned yellow, at an advanced stage of
senescence. Those resulting from salinity are usually
rapidly engulfed by a dark grey secondary necrosis,
which spreads from the margin into interveinal tissue
without being preceded by chlorosis.
Diagnostic soil and plant tissue tests
In the case of N aCl salinity, the chloride
concentration in the leaf tissue appears to correlate
more closely with growth response, and to be less
variable among cultivars, than the Na concentration.
This suggests that Cl is the more toxic element to
sweet potato, so the response obtained is that of Cl
toxicity. A critical concentration for CI toxicity of
1.5% (15,000 mg Cl/kg) was determined in 7th to 9th
youngest leaf blades in solution culture experiments
(Table 3). In a soil-based experiment, a lower critical
concentration, of approximately 0.9%, appeared to
apply (J. Yauwo, pers. comm. 1996). This may be
due to the effect of salinity on plant water uptake,
which became limiting in the soil-based culture.
Electrical conductivity of the soil saturation
extract (ECe) is the most commonly quoted measure
of soil salinity. Crop species vary widely in their salt
tolerance, with an ECe of 4 dS/m corresponding to
50% yield reduction in sensitive crops, and over
10 dS/m for highly tolerant crops. Sweet potato is
regarded as moderately tolerant of salinity, suffering
a 50% yield reduction at 6 mS cm- i . The threshold
for response of sweet potato to salinity is
approximately 2.5 dS/m (Bernstein 1964).
51
Soil measurements of both exchangeable Na, and
exchangeable Na percentage (ESP = 100 x
Exchangeable NaiCation Exchange Capacity) are
used to assess soil sodicity.
While a number of factors affect the amount of
Na required to cause dispersion in a particular soil, as
a rough guide soils with exchangeable Na greater
than 1 cmol(+)/kg soil, or an ESP ~15 may be
regarded as potentially sodic (Landon 1991). In such
soils, sweet potato crops may suffer from both Na
toxicity, and the deterioration of soil permeability and
structure caused by high Na.
Correction of salinity stress
Appropriate measures to overcome the
detrimental effect of salt accumulation depend on a
proper understanding of the complex of problems
present at the site. Improved drainage and more
efficient water delivery systems (minimising the
volume of water required to maintain the crop) may
slow salination of irrigated land so that seasonal rains
may leach sufficient salt to maintain fertility. The
application of gypsum may reduce the deleterious
effects ofNa on soil structure. Some benefit may be
gained by leaching the salts with non-saline water to
which gypsum has been added, or after application of
gypsum to the soil. Provision should be made for the
safe disposal of saline leachate.

The most practical solution in many instances
may be to select salt-tolerant cultivars for use on
affected areas. CIP researchers have hacl some
success in selecting cultivars tolerant of salinity in
coastal Peru (Chavez et al. 1995) and Bangladesh
(International Potato Center 1995).
52

I
Disorders Producing Symptoms on Leaves of Any Age
Nitrogen deficiency
Nitrogen (N) is one of the most abundant
elements in plants and animals, as it is a major
component of proteins. The amount of N required
by a crop is large compared with the natural N
reserves in most soils, and thus most crops respond
positively to additional N, whether from animal
manures or inorganic fertilizers. However, this
pattern does not always hold for sweet potato. In
some studies, N application was reported to reduce
sweet potato yields (e.g. de Geus 1967; Bourke
1977b; Navarro and Padda 1983; D'Souza and
Bourke 1986a). More commonly, the pattern is for
low rates of N to increase yield to some extent, but
higher rates to cause a yield decline.
The reason for this confusing response is that N
supply has a strong influence on the distribution of
dry matter within the plant, particularly affecting
root growth relative to top growth. When N supply
is high, plants tend to grow more tops relative to
roots. In the case of sweet potato, high N may cause
luxuriant growth of the vines at the expense of
storage root yield.
Cultivars vary greatly in the level of N required
to maximise yield, and in their tendency to reduce
yield at higher levels of N. In particular, negative
responses to N are more common in cultivars
developed in low-fertility areas where soil
amendments are not traditionally used. Jones and
Bouwkamp (1992) reported that an application of
60 kg N/ha increased yields of three USA cultivars
but decreased the yields of three African cultivars.
Watanabe (1979) classified cultivars into those
which readily produce luxuriant vine growth,
frequently resulting in reduced yield of storage
roots, and those which do not, these being better
adapted to fertile soils and high N inputs.
There is a common belief in developing
countries that N fertilizers are bad for sweet potato.
This is unfortunate because N deficiency is very
common. Large responses to N are often obtained
on soils which have been heavily cropped in the
past, or those subject to heavy leaching (Bourke
1977b, 1985b; Halavatau et al. 1996). The response
to N may be poor, however, if deficiencies of other
nutrients such as K are not also corrected (Bourke
1977b, 1985a). Sweet potato tends to respond better
to composts of plant materials which contain high K
relative to N, than to animal manures, which are
lower in K (Bourke 1982; D' Souza and Bourke
1986b). However, this depends on the balance of
nutrients present in the soil.
53
Improved N nutrition of the crop also leads to
higher protein concentrations in the tubers
(Constantin et al. 1974; Kimber 1976; Purcell et al.
1982), and this may be of considerable significance
in communities which obtain much of their protein
from sweet potato (Heywood and Nakikus 1982). In
the Kaintiba District of PNG, for instance, the mean
protein concentration in tubers sampled, at 0.62%,
was less than half the average for the South Pacific
region (Bradbury and Holloway 1988), suggesting
that these crops were N deficient. The protein intake
of PNG Highlanders is typically suboptimal unless
supplemented by imported foodstuffs (Heywood
and Nakikus 1982; Harvey and Heywood 1983).
Sweet potato has been shown to form root
associations with the nitrogen fixing soil bacterium
Azospirillum brasilense (Hill et al. 1983; Hill and
Bacon 1984). Inoculation of crops with the
bacterium increased the root yield and the N
concentration in leaf tissue when no N fertilizer was
applied (Crossman and Hill 1987; Mortley and Hill
1990). The prevalence of such symbiotic
associations in the various regions and
environments in which sweet potato is grown, and
its significance for yield of subsistence crops, have
not yet been investigated.
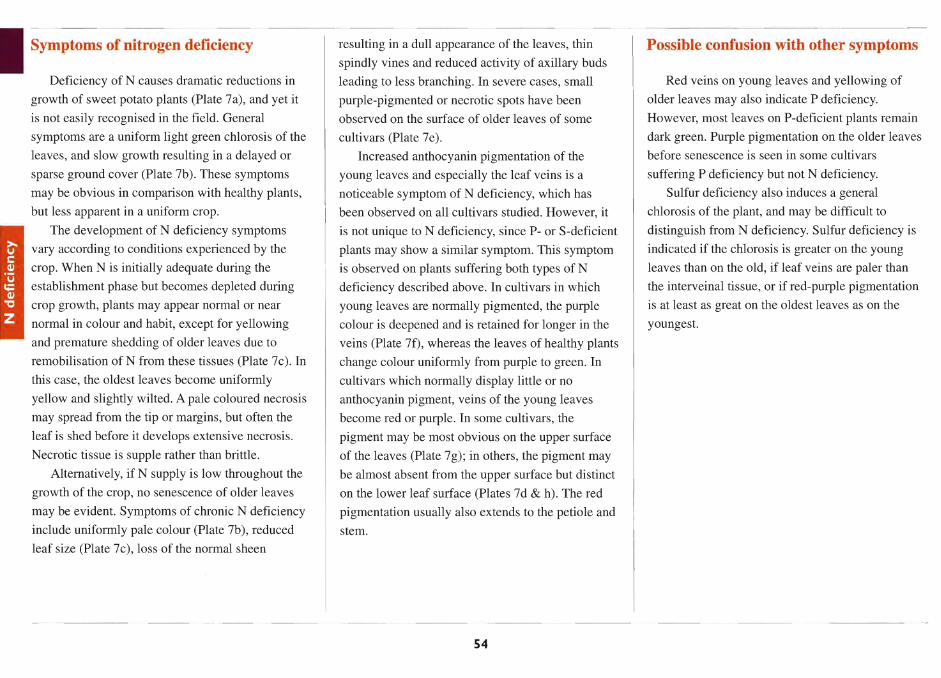
I Symptoms of nitrogen deficiency
Deficiency of N causes dramatic reductions in
growth of sweet potato plants (Plate 7a), and yet it
is not easily recognised in the field. General
symptoms are a uniform light green chlorosis of the
leaves, and slow growth resulting in a delayed or
sparse ground cover (Plate 7b). These symptoms
may be obvious in comparison with healthy plants,
but less apparent in a uniform crop.
The development of N deficiency symptoms
vary according to conditions experienced by the
crop. When N is initially adequate during the
establishment phase but becomes depleted during
crop growth, plants may appear normal or near
normal in colour and habit, except for yellowing
and premature shedding of older leaves due to
remobilisation ofN from these tissues (Plate 7c). In this case, the oldest leaves become uniformly
yellow and slightly wilted. A pale coloured necrosis
may spread from the tip or margins, but often the
leaf is shed before it develops extensive necrosis.
Necrotic tissue is supple rather than brittle.
Alternatively, if N supply is low throughout the
growth of the crop, no senescence of older leaves
may be evident. Symptoms of chronic N deficiency
include uniformly pale colour (Plate 7b), reduced
leaf size (Plate 7 c), loss of the normal sheen
resulting in a dull appearance of the leaves, thin
spindly vines and reduced activity of axillary buds
leading to less branching. In severe cases, small
purple-pigmented or necrotic spots have been
observed on the surface of older leaves of some
cultivars (Plate 7e).
Increased anthocyanin pigmentation of the
young leaves and especially the leaf veins is a
noticeable symptom of N deficiency, which has
been observed on all cultivars studied. However, it
is not unique to N deficiency, since P- or S-deficient
plants may show a similar symptom. This symptom
is observed on plants suffering both types of N
deficiency described above. In cultivars in which
young leaves are normally pigmented, the purple
colour is deepened and is retained for longer in the
veins (Plate 7f), whereas the leaves of healthy plants
change colour uniformly from purple to green. In cultivars which normally display little or no
anthocyanin pigment, veins of the young leaves
become red or purple. In some cultivars, the
pigment may be most obvious on the upper surface
of the leaves (Plate 7 g); in others, the pigment may
be almost absent from the upper surface but distinct
on the lower leaf surface (Plates 7d & h). The red
pigmentation usually also extends to the petiole and
stem.
54
Possible confusion with other symptoms
Red veins on young leaves and yellowing of
older leaves may also indicate P deficiency.
However, most leaves on P-deficient plants remain
dark green. Purple pigmentation on the older leaves
before senescence is seen in some cultivars
suffering P deficiency but not N deficiency.
Sulfur deficiency also induces a general
chlorosis of the plant, and may be difficult to
distinguish from N deficiency. Sulfur deficiency is
indicated if the chlorosis is greater on the young
leaves than on the old, if leaf veins are paler than
the interveinal tissue, or if red-purple pigmentation
is at least as great on the oldest leaves as on the
youngest.

Plate 7. Nitrogen deficiency
a) Healthy (left) and N-deficient (right) plants of cv. Beerwah Gold, showing growth reduction, lack of branching, and small, pale green leaves.
b) A N-deficient plot (front) of cv. Markham compared with an area fertilized with N (rear), in a fertilizer trial at Lae, PNG.
55
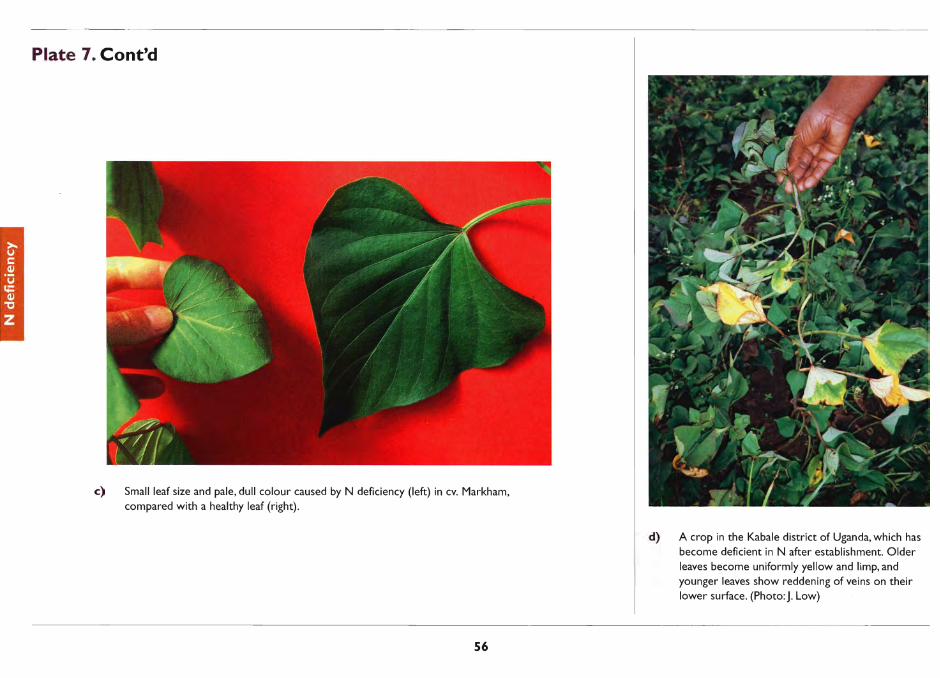
Plate 7. Cont'd
c) Small leaf size and pale. dull colour caused by N deficiency (left) in cv. Markham. compared with a healthy leaf (right).
56
d) A crop in the Kabale district of Uganda. which has become deficient in N after establishment. Older leaves become uniformly yellow and limp. and younger leaves show reddening of veins on their lower surface. (Photo:J. Low)
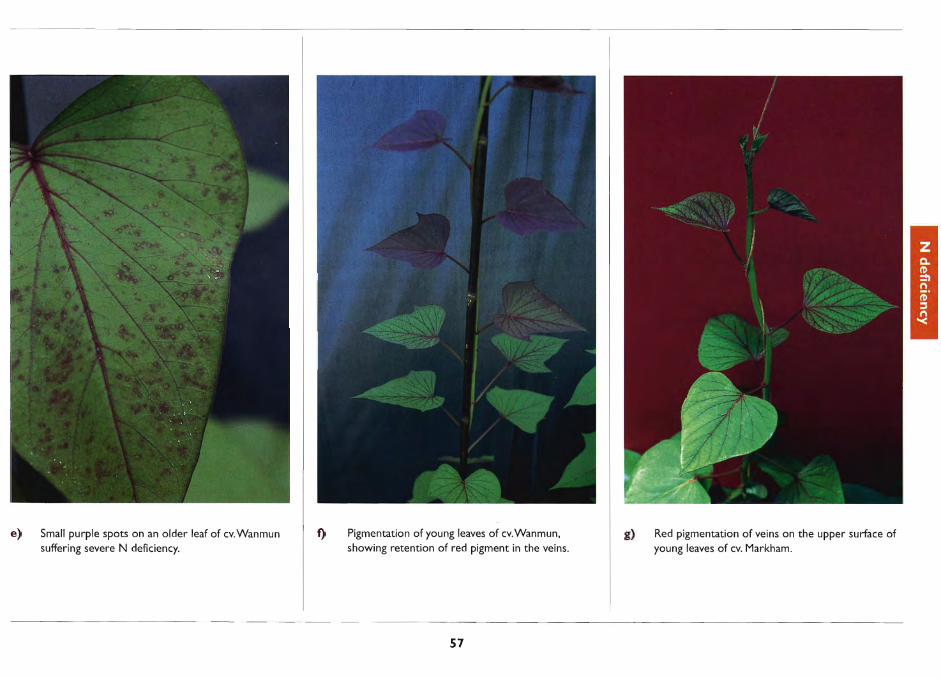
e) Small purple spots on an older leaf of cv.Wanmun suffering severe N deficiency.
f) Pigmentation of young leaves of cv. Wanmun, showing retention of red pigment in the veins.
57
g) Red pigmentation of veins on the upper surface of young leaves of cv. Markham.

Plate 7. Cont'd
h) Red pigmentation visible only on the lower surface of veins in cv. Hawaii.
Diagnostic soil and plant tissue tests
A critical concentration of 4.0% N was
determined for the 7th to 9th youngest leaf blades of
sweet potato, on the basis of vine growth in solution
culture over 28 days (Table 3). This agrees closely
with the critical concentration in field-grown plants
in Tonga, sampled at two months from planting, and
corresponding to 90% of maximum yield
(S. Halavatan, pers. comm.). The N concentration in
leaves tends to decline with plant age (Spence and
Ahmad 1967; Scott and Bouwkamp 1974), and it is
likely that the critical concentration varies with the
age of the crop. Leonard et al. (1949) found N
concentrations in the first five expanded leaf blades,
necessary for good yield, to be 4.7-5.0% N in early
stages, or 3.0-3.8% N at harvest. Using a similar
leaf sample taken at 10 weeks, Mascianica et al.
(1985) gave a critical concentration of 4.9% N.
Jackson (1972) found that yield responded linearly
to N concentration, up to a maximum of 4.2%, in
the 5th-6th youngest leaf blade sampled at 10
weeks. Walker and Woodson (1987), however,
found no significant difference in leaf blade N
concentration with age of sampling from 44 to 97
days. They determined a critical concentration
associated with 95% of maximum marketable root
yield of 3.0-3.2% N in the fifth leaf blade from the
apex.
These differing estimations of critical N
concentration may be due in part to cultivar
58
differences in response to N. Villareal et al. (1979)
found that cultivars differed in the relationship
between crop age and protein concentration in sweet
potato shoot tips: some showed a steady decline in
protein concentration from 40 to 120 days, while
others maintained their protein concentration
throughout the growing season.
The concentration of nitrate-N in the petiole is
often used to assess the N status of crops. Lorenz
(1965) quoted nitrate-N concentrations in the petiole
of the sixth leaf of sweet potato in mid season, as
1500, 2500 and 3500 mg/kg for deficient,
intermediate and sufficient N status, respectively.
However, Walker and Woodson (1987) found that,
while petiole nitrate-N concentration was sensitive
to N supply, it was highly variable among cultivars
and with age of sampling, and was a poor predictor
of root yield.
In the field, fertilizer test strips may be used to
confirm a deficiency of N, and to distinguish N
from S deficiency. For example, urea (containing
only N) and sulfate of ammonia (containing both N
and S) can be applied to separate strips of one or
two ridges, at a rate of about 50 kg N/ha (e.g. 1 kg
N for a 2 m x 10 m strip). If plants green up equally
with either sulfate of ammonia or urea, it would be
appropriate to conclude that they were suffering
from N deficiency; if only the sulfate of ammonia
produces a response, the problem would be S
deficiency.
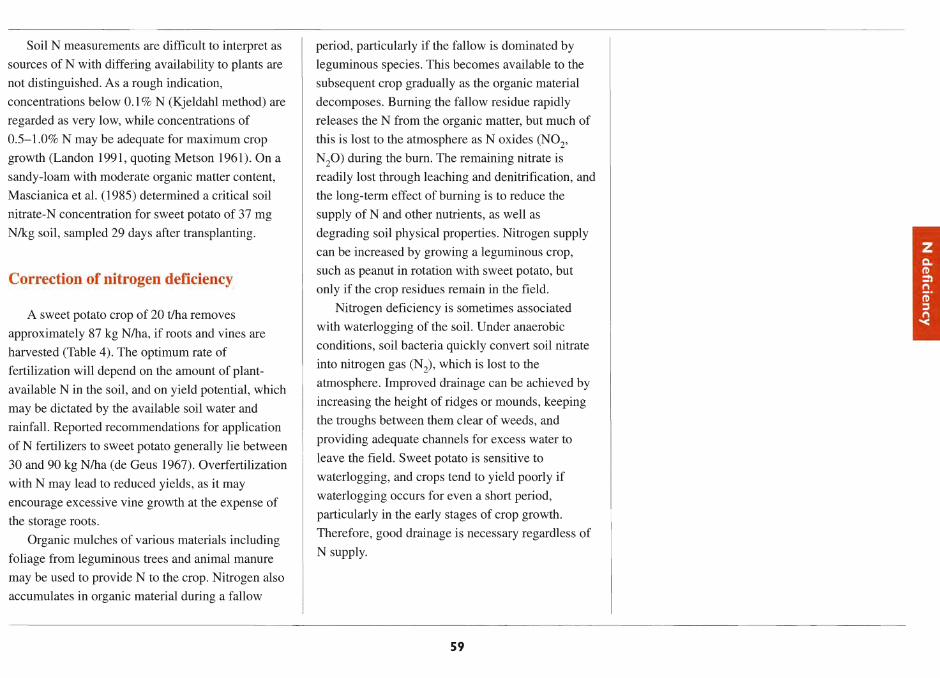
Soil N measurements are difficult to interpret as
sources of N with differing availability to plants are
not distinguished. As a rough indication,
concentrations below 0.1 % N (Kjeldahl method) are
regarded as very low, while concentrations of
0.5-l.0% N may be adequate for maximum crop
growth (Landon 1991, quoting Metson 1961). On a
sandy-loam with moderate organic matter content,
Mascianica et al. (1985) determined a critical soil
nitrate-N concentration for sweet potato of 37 mg
N/kg soil, sampled 29 days after transplanting.
Correction of nitrogen deficiency
A sweet potato crop of 20 t/ha removes
approximately 87 kg N/ha, if roots and vines are
harvested (Table 4). The optimum rate of
fertilization will depend on the amount of plant
available N in the soil, and on yield potential, which
may be dictated by the available soil water and
rainfall. Reported recommendations for application
of N fertilizers to sweet potato generally lie between
30 and 90 kg N/ha (de Geus 1967). Overfertilization
with N may lead to reduced yields, as it may
encourage excessive vine growth at the expense of
the storage roots.
Organic mulches of various materials including
foliage from leguminous trees and animal manure
may be used to provide N to the crop. Nitrogen also
accumulates in organic material during a fallow
period, particularly if the fallow is dominated by
leguminous species. This becomes available to the
subsequent crop gradually as the organic material
decomposes. Burning the fallow residue rapidly
releases the N from the organic matter, but much of
this is lost to the atmosphere as N oxides (N02,
N20) during the bum. The remaining nitrate is
readily lost through leaching and denitrification, and
the long-term effect of burning is to reduce the
supply of N and other nutrients, as well as
degrading soil physical properties. Nitrogen supply
can be increased by growing a leguminous crop,
such as peanut in rotation with sweet potato, but
only if the crop residues remain in the field.
Nitrogen deficiency is sometimes associated
with waterlogging of the soil. Under anaerobic
conditions, soil bacteria quickly convert soil nitrate
into nitrogen gas (N2), which is lost to the
atmosphere. Improved drainage can be achieved by
increasing the height of ridges or mounds, keeping
the troughs between them clear of weeds, and
providing adequate channels for excess water to
leave the field. Sweet potato is sensitive to
waterlogging, and crops tend to yield poorly if
waterlogging occurs for even a short period,
particularly in the early stages of crop growth.
Therefore, good drainage is necessary regardless of
N supply.
59
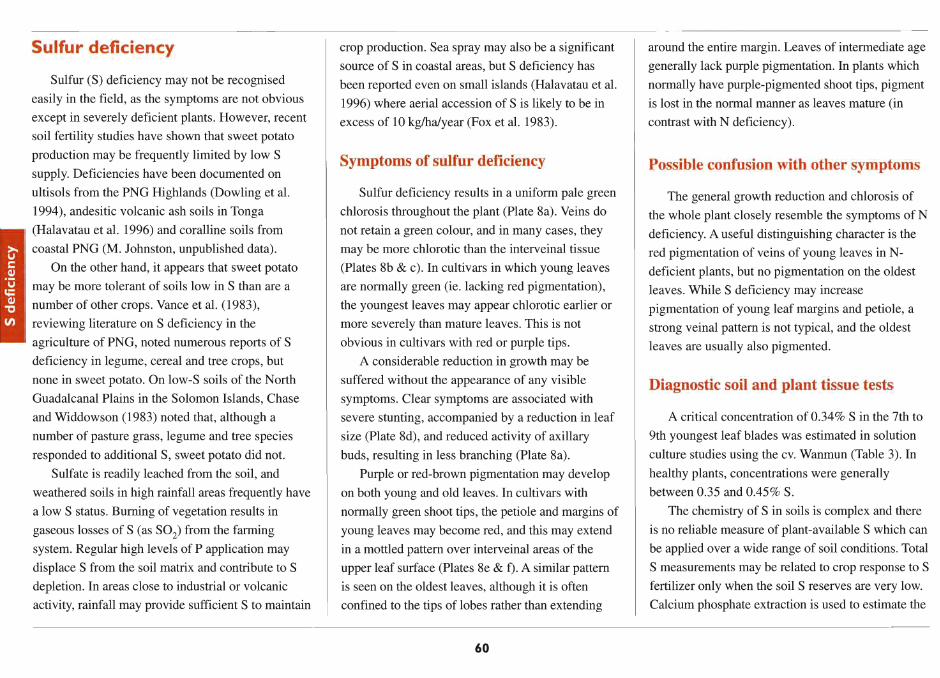
Sulfur deficiency
Sulfur (S) deficiency may not be recognised
easily in the field, as the symptoms are not obvious
except in severely deficient plants. However, recent
soil fertility studies have shown that sweet potato
production may be frequently limited by low S
supply. Deficiencies have been documented on
ultisols from the PNG Highlands (Dowling et al.
1994), andesitic volcanic ash soils in Tonga
(Halavatau et al. 1996) and coralline soils from
coastal PNG (M. Johnston, unpublished data).
On the other hand, it appears that sweet potato
may be more tolerant of soils low in S than are a
number of other crops. Vance et al. (1983),
reviewing literature on S deficiency in the
agriculture of PNG, noted numerous reports of S
deficiency in legume, cereal and tree crops, but
none in sweet potato. On low-S soils of the North
Guadalcanal Plains in the Solomon Islands, Chase
and Widdowson (1983) noted that, although a
number of pasture grass, legume and tree species
responded to additional S, sweet potato did not.
Sulfate is readily leached from the soil, and
weathered soils in high rainfall areas frequently have
a low S status. Burning of vegetation results in
gaseous losses of S (as S02) from the farming
system. Regular high levels of P application may
displace S from the soil matrix and contribute to S
depletion. In areas close to industrial or volcanic
activity, rainfall may provide sufficient S to maintain
crop production. Sea spray may also be a significant
source of S in coastal areas, but S deficiency has
been reported even on small islands (Halavatau et al.
1996) where aerial accession of S is likely to be in
excess of 10 kg/ha/year (Fox et al. 1983).
Symptoms of sulfur deficiency
Sulfur deficiency results in a uniform pale green
chlorosis throughout the plant (Plate 8a). Veins do
not retain a green colour, and in many cases, they
may be more chlorotic than the interveinal tissue
(Plates 8b & c). In cultivars in which young leaves
are normally green (ie. lacking red pigmentation),
the youngest leaves may appear chlorotic earlier or
more severely than mature leaves. This is not
obvious in cultivars with red or purple tips.
A considerable reduction in growth may be
suffered without the appearance of any visible
symptoms. Clear symptoms are associated with
severe stunting, accompanied by a reduction in leaf
size (Plate 8d), and reduced activity of axillary
buds, resulting in less branching (Plate 8a).
Purple or red-brown pigmentation may develop
on both young and old leaves. In cultivars with
normally green shoot tips, the petiole and margins of
young leaves may become red, and this may extend
in a mottled pattern over interveinal areas of the
upper leaf surface (Plates 8e & f). A similar pattern
is seen on the oldest leaves, although it is often
confined to the tips of lobes rather than extending
60
around the entire margin. Leaves of intermediate age
generally lack purple pigmentation. In plants which
normally have purple-pigmented shoot tips, pigment
is lost in the normal manner as leaves mature (in
contrast with N deficiency).
Possible confusion with other symptoms
The general growth reduction and chlorosis of
the whole plant closely resemble the symptoms of N
deficiency. A useful distinguishing character is the
red pigmentation of veins of young leaves in N
deficient plants, but no pigmentation on the oldest
leaves. While S deficiency may increase
pigmentation of young leaf margins and petiole, a
strong veinal pattern is not typical, and the oldest
leaves are usually also pigmented.
Diagnostic soil and plant tissue tests
A critical concentration of 0.34% S in the 7th to
9th youngest leaf blades was estimated in solution
culture studies using the cv. Wanmun (Table 3). In
healthy plants, concentrations were generally
between 0.35 and 0.45% S.
The chemistry of S in soils is complex and there
is no reliable measure of plant-available S which can
be applied over a wide range of soil conditions. Total
S measurements may be related to crop response to S
fertilizer only when the soil S reserves are very low.
Calcium phosphate extraction is used to estimate the
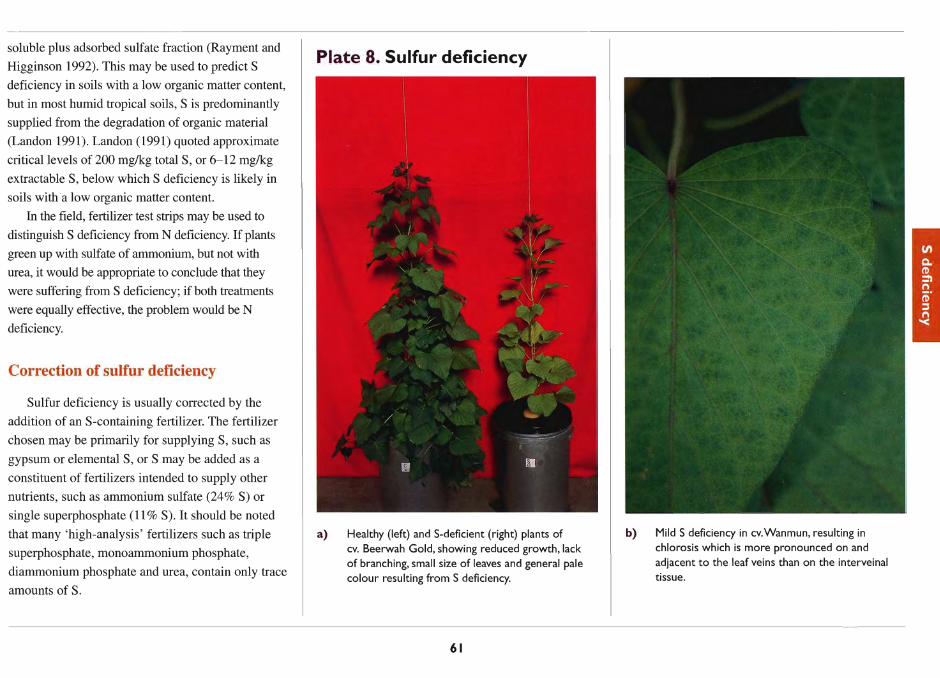
soluble plus adsorbed sulfate fraction (Rayment and
Higginson 1992). This may be used to predict S
deficiency in soils with a low organic matter content,
but in most humid tropical soils, S is predominantly
supplied from the degradation of organic material
(Landon 1991). Landon (1991) quoted approximate
critical levels of 200 mg/kg total S, or 6-12 mg/kg
extractable S, below which S deficiency is likely in
soils with a low organic matter content.
In the field, fertilizer test strips may be used to
distinguish S deficiency from N deficiency. If plants
green up with sulfate of ammonium, but not with
urea, it would be appropriate to conclude that they
were suffering from S deficiency; if both treatments
were equally effective, the problem would be N
deficiency.
Correction of sulfur deficiency
Sulfur deficiency is usually corrected by the
addition of an S-containing fertilizer. The fertilizer
chosen may be primarily for supplying S, such as
gypsum or elemental S, or S may be added as a
constituent of fertilizers intended to supply other
nutrients, such as ammonium sulfate (24% S) or
single superphosphate (11 % S). It should be noted
that many 'high-analysis' fertilizers such as triple
superphosphate, mono ammonium phosphate,
diammonium phosphate and urea, contain only trace
amounts of S.
Plate 8. Sulfur deficiency
a) Healthy (left) and S-deficient (right) plants of cv. Beerwah Gold, showing reduced growth, lack of branching, small size of leaves and general pale colour resulting from S deficiency.
61
b) Mild S deficiency in cv.Wanmun, resulting in chlorosis which is more pronounced on and adjacent to the leaf veins than on the interveinal tissue.

Plate 8. Cont'd
c) Mild S deficiency in cv. Hawaii, in which the veins appear paler than the surrounding tissue.
d) Chlorosis and reduced leaf size in S-deficient cv. Hawaii (L), compared with healthy leaves (R).
62
e) Chlorosis is accompanied by purple pigmentation of the petioles and margins of young leaves of cv. Beerwah Gold.
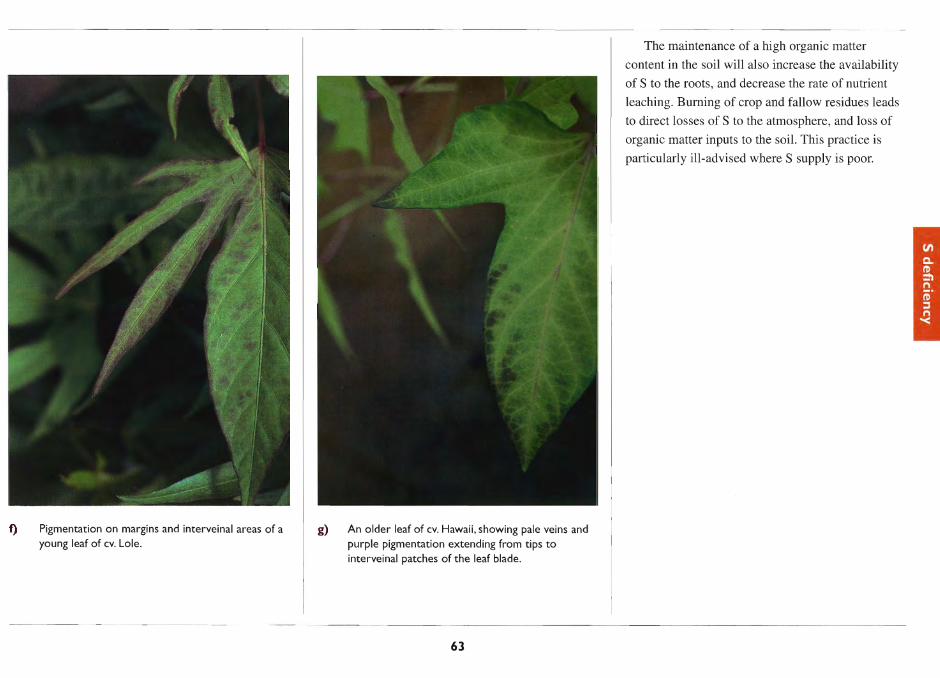
f) Pigmentation on margins and interveinal areas of a young leaf of cv. Lole.
g) An older leaf of cv. Hawaii, showing pale veins and purple pigmentation extending from tips to interveinal patches of the leaf blade.
63
The maintenance of a high organic matter
content in the soil will also increase the availability
of S to the roots, and decrease the rate of nutrient
leaching. Burning of crop and fallow residues leads
to direct losses of S to the atmosphere, and loss of
organic matter inputs to the soil. This practice is
particularly ill-advised where S supply is poor.
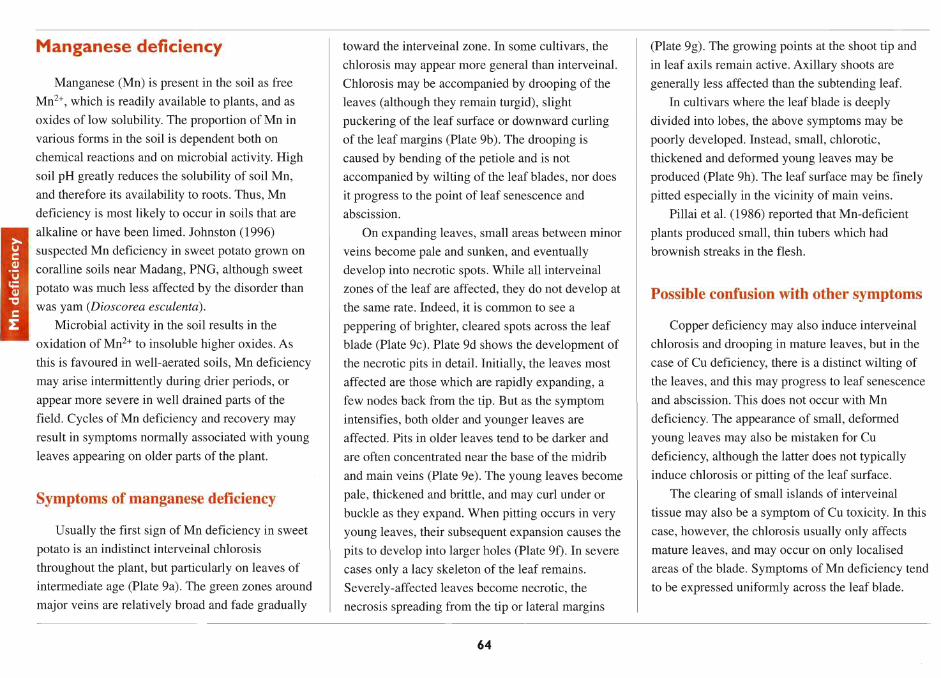
Manganese deficiency
Manganese (Mn) is present in the soil as free
Mn2+, which is readily available to plants, and as
oxides of low solubility. The proportion of Mn in
various forms in the soil is dependent both on
chemical reactions and on microbial activity. High
soil pH greatly reduces the solubility of soil Mn,
and therefore its availability to roots. Thus, Mn
deficiency is most likely to occur in soils that are
alkaline or have been limed. Johnston (1996)
suspected Mn deficiency in sweet potato grown on
coralline soils near Madang, PNG, although sweet
potato was much less affected by the disorder than
was yam (Dioscorea esculenta).
Microbial activity in the soil results in the
oxidation of Mn2+ to insoluble higher oxides. As
this is favoured in well-aerated soils, Mn deficiency
may arise intermittently during drier periods, or
appear more severe in well drained parts of the
field. Cycles of Mn deficiency and recovery may
result in symptoms normally associated with young
leaves appearing on older parts of the plant.
Symptoms of manganese deficiency
Usually the first sign of Mn deficiency in sweet
potato is an indistinct interveinal chlorosis
throughout the plant, but particularly on leaves of
intermediate age (Plate 9a). The green zones around
major veins are relatively broad and fade gradually
toward the interveinal zone. In some cultivars, the
chlorosis may appear more general than interveinal.
Chlorosis may be accompanied by drooping of the
leaves (although they remain turgid), slight
puckering of the leaf surface or downward curling
of the leaf margins (Plate 9b). The drooping is
caused by bending of the petiole and is not
accompanied by wilting of the leaf blades, nor does
it progress to the point of leaf senescence and
abscission.
On expanding leaves, small areas between minor
veins become pale and sunken, and eventually
develop into necrotic spots. While all interveinal
zones of the leaf are affected, they do not develop at
the same rate. Indeed, it is common to see a
peppering of brighter, cleared spots across the leaf
blade (Plate 9c). Plate 9d shows the development of
the necrotic pits in detail. Initially, the leaves most
affected are those which are rapidly expanding, a
few nodes back from the tip. But as the symptom
intensifies, both older and younger leaves are
affected. Pits in older leaves tend to be darker and
are often concentrated near the base of the midrib
and main veins (Plate ge). The young leaves become
pale, thickened and brittle, and may curl under or
buckle as they expand. When pitting occurs in very
young leaves, their subsequent expansion causes the
pits to develop into larger holes (Plate 9f). In severe
cases only a lacy skeleton of the leaf remains.
Severely-affected leaves become necrotic, the
necrosis spreading from the tip or lateral margins
64
(Plate 9g). The growing points at the shoot tip and
in leafaxils remain active. Axillary shoots are
generally less affected than the subtending leaf.
In cultivars where the leaf blade is deeply
divided into lobes, the above symptoms may be
poorly developed. Instead, small, chlorotic,
thickened and deformed young leaves may be
produced (Plate 9h). The leaf surface may be finely
pitted especially in the vicinity of main veins.
Pillai et al. (1986) reported that Mn-deficient
plants produced small, thin tubers which had
brownish streaks in the flesh.
Possible confusion with other symptoms
Copper deficiency may also induce interveinal
chlorosis and drooping in mature leaves, but in the
case of Cu deficiency, there is a distinct wilting of
the leaves, and this may progress to leaf senescence
and abscission. This does not occur with Mn
deficiency. The appearance of small, deformed
young leaves may also be mistaken for Cu
deficiency, although the latter does not typically
induce chlorosis or pitting of the leaf surface.
The clearing of small islands of interveinal
tissue may also be a symptom of Cu toxicity. In this
case, however, the chlorosis usually only affects
mature leaves, and may occur on only localised
areas of the blade. Symptoms of Mn deficiency tend
to be expressed uniformly across the leaf blade.
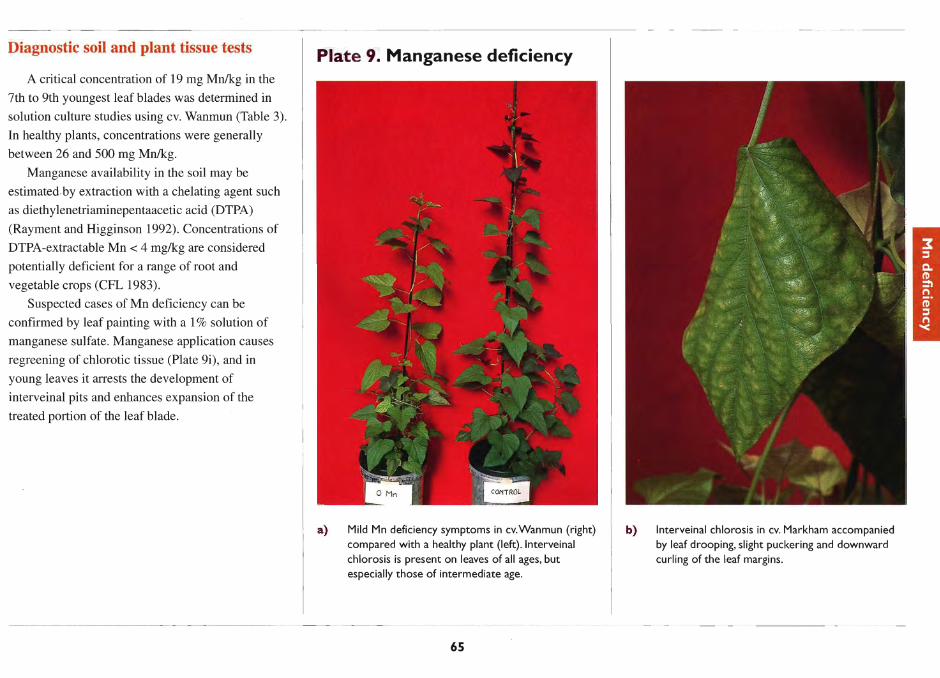
Diagnostic soil and plant tissue tests
A critical concentration of 19 mg Mnlkg in the
7th to 9th youngest leaf blades was determined in
solution culture studies using cv. Wanmun (Table 3).
In healthy plants, concentrations were generally
between 26 and 500 mg Mnlkg.
Manganese availability in the soil may be
estimated by extraction with a chelating agent such
as diethylenetriaminepentaacetic acid (DTPA)
(Rayment and Higginson 1992). Concentrations of
DTPA-extractable Mn < 4 mg/kg are considered
potentially deficient for a range of root and
vegetable crops (CFL 1983).
Suspected cases of Mn deficiency can be
confirmed by leaf painting with a 1 % solution of
manganese sulfate. Manganese application causes
regreening of chlorotic tissue (Plate 9i), and in
young leaves it arrests the development of
interveinal pits and enhances expansion of the
treated portion of the leaf blade.
Plate 9. Manganese deficiency
a) Mild Mn deficiency symptoms in cv.Wanmun (right) compared with a healthy plant (left). Interveinal chlorosis is present on leaves of all ages, but especially those of intermediate age.
65
b) Interveinal chlorosis in cv. Markham accompanied
by leaf drooping, slight puckering and downward curling of the leaf margins.

Plate 9. Cont'd
c) An expanding leaf of cv.Wanmun, in the early stages of the development of interveinal pits, seen as bright spots on the leaf.
d) Detail of the development of necrotic pits in a young, expanding leaf of cv.Wanmun.
66
e) Necrotic pits in a mature leaf of cv.Wanmun.
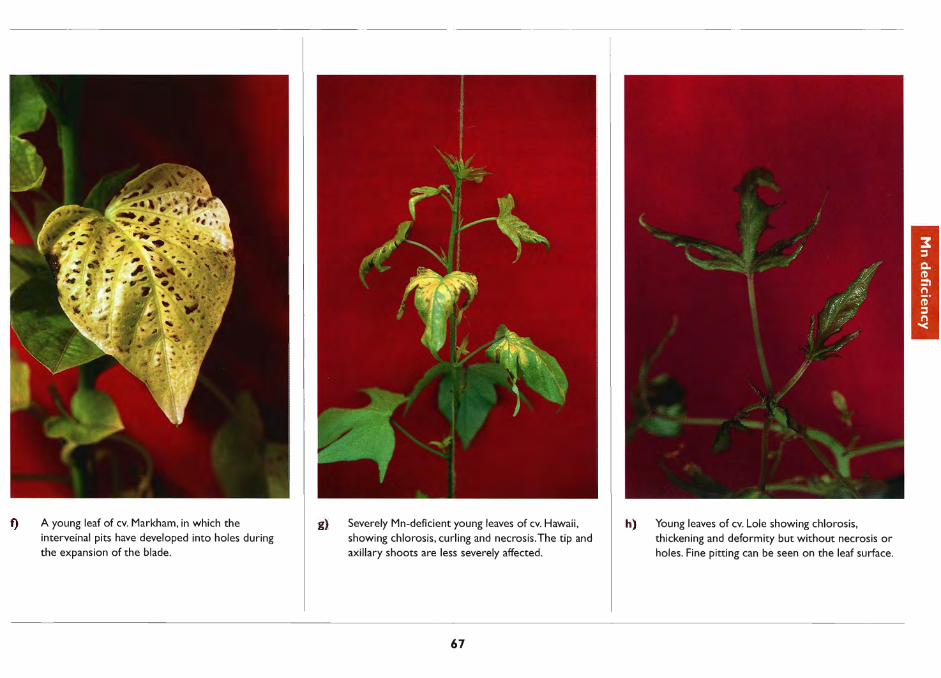
f) A young leaf of cv. Markham, in which the interveinal pits have developed into holes during the expansion of the blade.
g) Severely Mn-deficient young leaves of cv. Hawaii, showing chlorosis, curling and necrosis. The tip and axillary shoots are less severely affected.
67
h) Young leaves of cv. Lole showing chlorosis, thickening and deformity but without necrosis or holes. Fine pitting can be seen on the leaf surface.
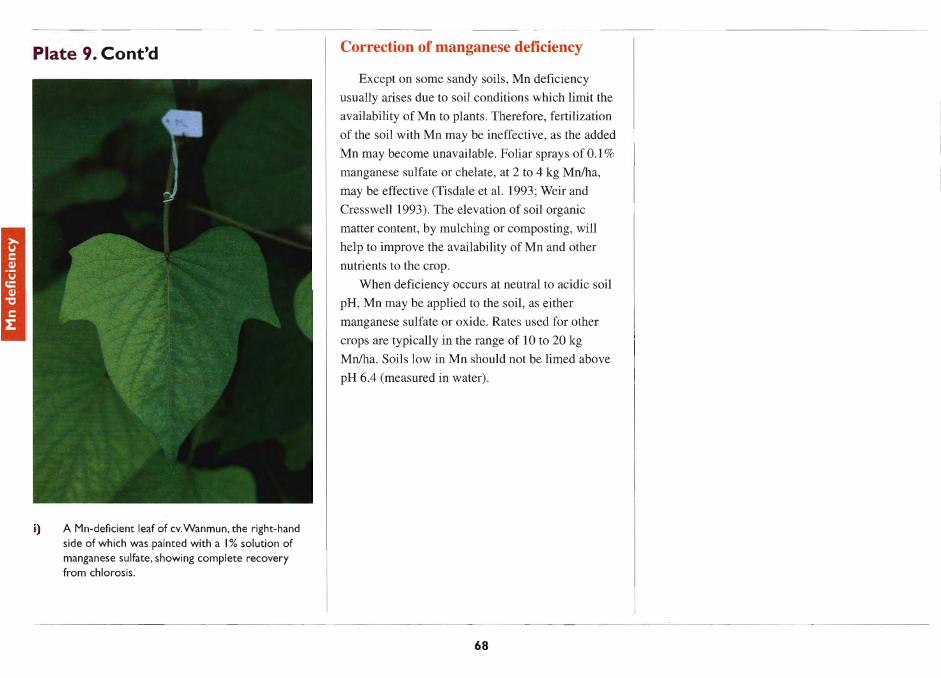
Plate 9. Cont'd
i) A Mn-deficient leaf of cv.Wanmun, the right-hand
side of which was painted with a I % solution of manganese sulfate, showing complete recovery from chlorosis.
Correction of manganese deficiency
Except on some sandy soils, Mn deficiency
usually arises due to soil conditions which limit the
availability of Mn to plants. Therefore, fertilization
of the soil with Mn may be ineffective, as the added
Mn may become unavailable. Foliar sprays of 0.1 %
manganese sulfate or chelate, at 2 to 4 kg Mn/ha,
may be effective (Tisdale et al. 1993; Weir and
Cresswell 1993). The elevation of soil organic
matter content, by mulching or composting, will
help to improve the availability of Mn and other
nutrients to the crop.
When deficiency occurs at neutral to acidic soil
pH, Mn may be applied to the soil, as either
manganese sulfate or oxide. Rates used for other
crops are typically in the range of 10 to 20 kg
Mn/ha. Soils low in Mn should not be limed above
pH 6.4 (measured in water).
68
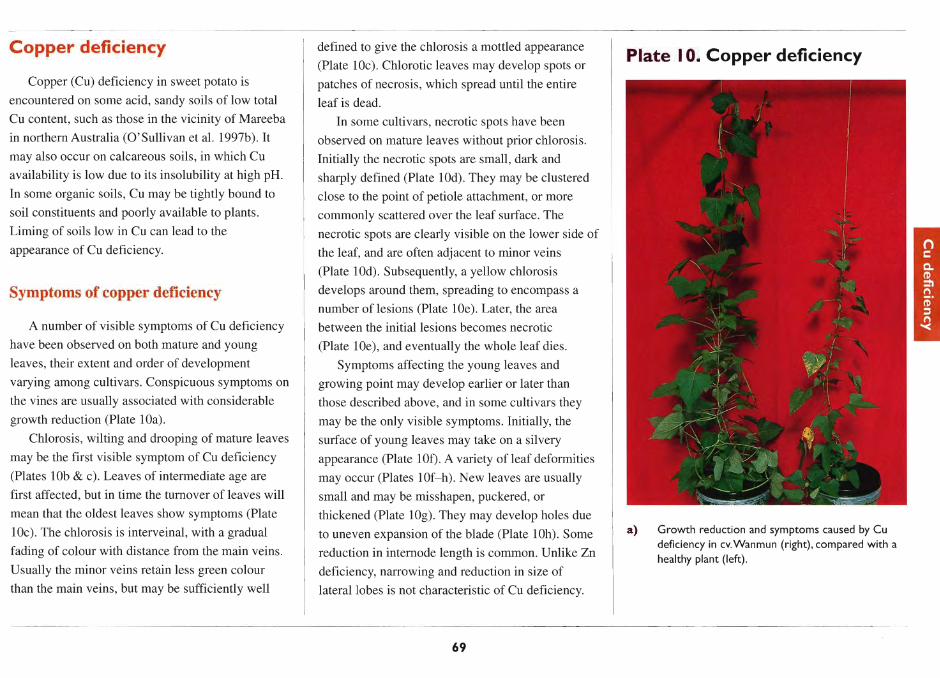
Copper deficiency
Copper (Cu) deficiency in sweet potato is
encountered on some acid, sandy soils of low total
Cu content, such as those in the vicinity of Mareeba
in northern Australia (O 'Sullivan et al. 1997b). It
may also occur on calcareous soils, in which Cu
availability is low due to its insolubility at high pH.
In some organic soils, Cu may be tightly bound to
soil constituents and poorly available to plants.
Liming of soils low in Cu can lead to the
appearance of Cu deficiency.
Symptoms of copper deficiency
A number of visible symptoms of Cu deficiency
have been observed on both mature and young
leaves, their extent and order of development
varying among cultivars. Conspicuous symptoms on
the vines are usually associated with considerable
growth reduction (Plate lOa).
Chlorosis, wilting and drooping of mature leaves
may be the first visible symptom of Cu deficiency
(Plates lOb & c). Leaves of intermediate age are
first affected, but in time the turnover of leaves will
mean that the oldest leaves show symptoms (Plate
lOc). The chlorosis is interveinal, with a gradual
fading of colour with distance from the main veins.
Usually the minor veins retain less green colour
than the main veins, but may be sufficiently well
defined to give the chlorosis a mottled appearance
(Plate lOc). Chlorotic leaves may develop spots or
patches of necrosis, which spread until the entire
leaf is dead.
In some cultivars, necrotic spots have been
observed on mature leaves without prior chlorosis.
Initially the necrotic spots are small, dark and
sharply defined (Plate lOd). They may be clustered
close to the point of petiole attachment, or more
commonly scattered over the leaf surface. The
necrotic spots are clearly visible on the lower side of
the leaf, and are often adjacent to minor veins
(Plate lOd). Subsequently, a yellow chlorosis
develops around them, spreading to encompass a
number of lesions (Plate lOe). Later, the area
between the initial lesions becomes necrotic
(Plate lOe), and eventually the whole leaf dies.
Symptoms affecting the young leaves and
growing point may develop earlier or later than
those described above, and in some cultivars they
may be the only visible symptoms. Initially, the
surface of young leaves may take on a silvery
appearance (Plate 10f). A variety of leaf deformities
may occur (Plates lOf-h). New leaves are usually
small and may be misshapen, puckered, or
thickened (Plate 109). They may develop holes due
to uneven expansion of the blade (Plate lOh). Some
reduction in internode length is common. Unlike Zn
deficiency, narrowing and reduction in size of
lateral lobes is not characteristic of Cu deficiency.
69
Plate I O. Copper deficiency
a) Growth reduction and symptoms caused by Cu deficiency in cv.Wanmun (right), compared with a healthy plant (left).
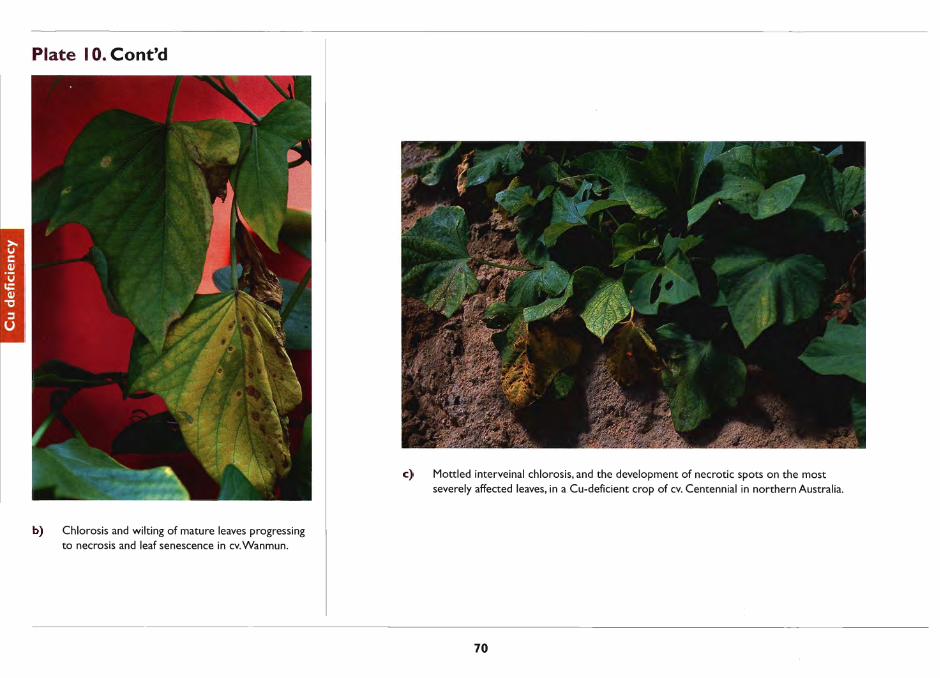
Plate I O. Cont'd
b) Chlorosis and wilting of mature leaves progressing to necrosis and leaf senescence in cv.Wanmun.
c) Mottled interveinal chlorosis, and the development of necrotic spots on the most severely affected leaves, in a Cu-deficient crop of cv. Centennial in northern Australia.
70
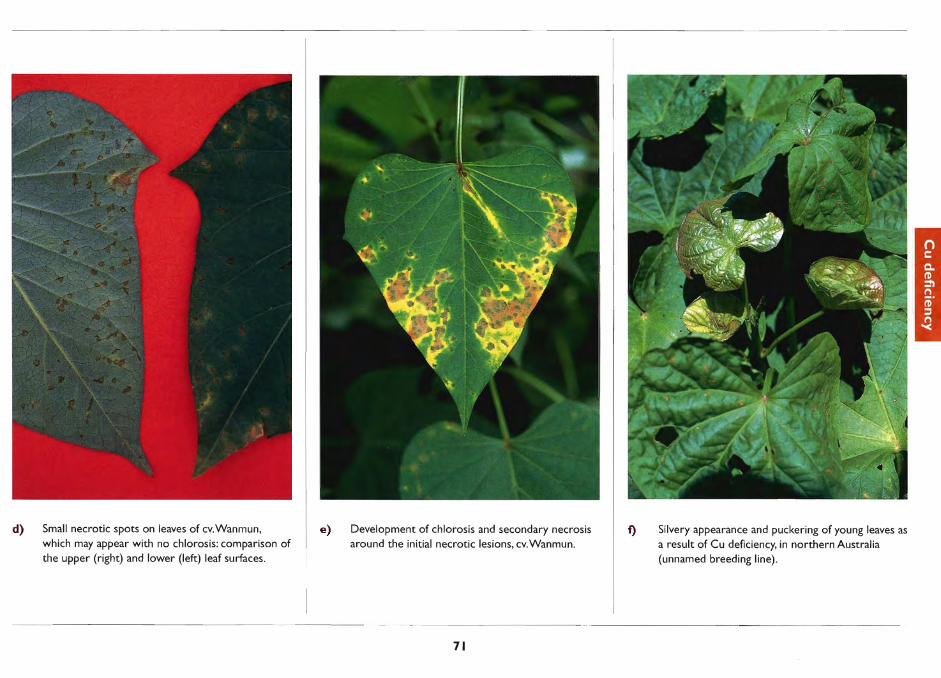
d) Small necrotic spots on leaves of cv.Wanmun, which may appear with no chlorosis: comparison of the upper (right) and lower (left) leaf surfaces.
e) Development of chlorosis and secondary necrosis around the initial necrotic lesions, cv. Wanmun.
71
f) Silvery appearance and puckering of young leaves as a result of Cu deficiency, in northern Australia (unnamed breeding line).
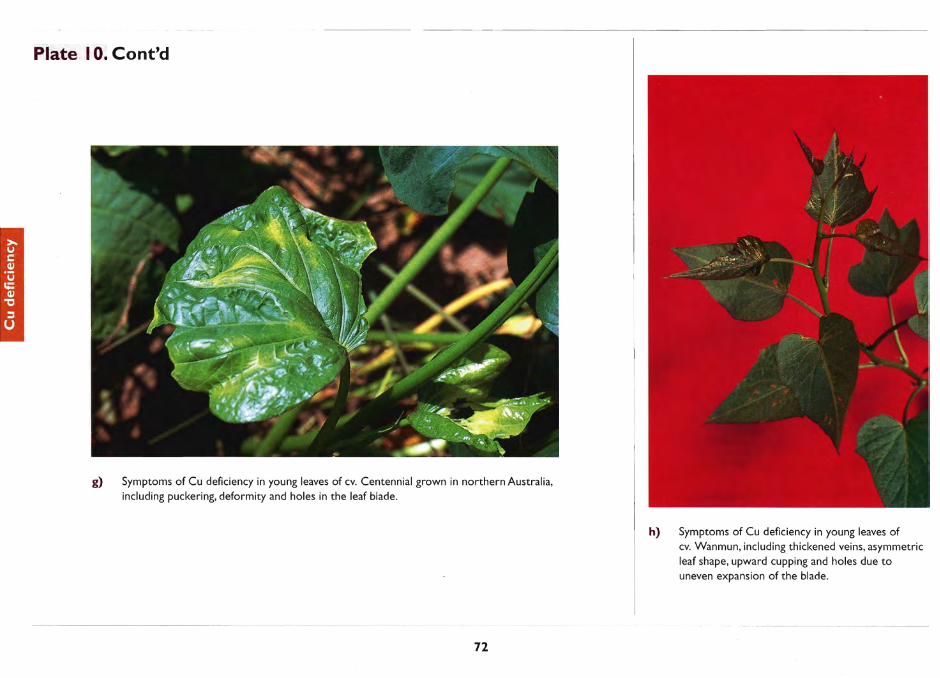
Plate I O. Cont'd
g) Symptoms of Cu deficiency in young leaves of cv. Centennial grown in northern Australia, including puckering, deformity and holes in the leaf blade.
72
h) Symptoms of Cu deficiency in young leaves of cv. Wanmun, including thickened veins, asymmetric leaf shape, upward cupping and holes due to uneven expansion of the blade.
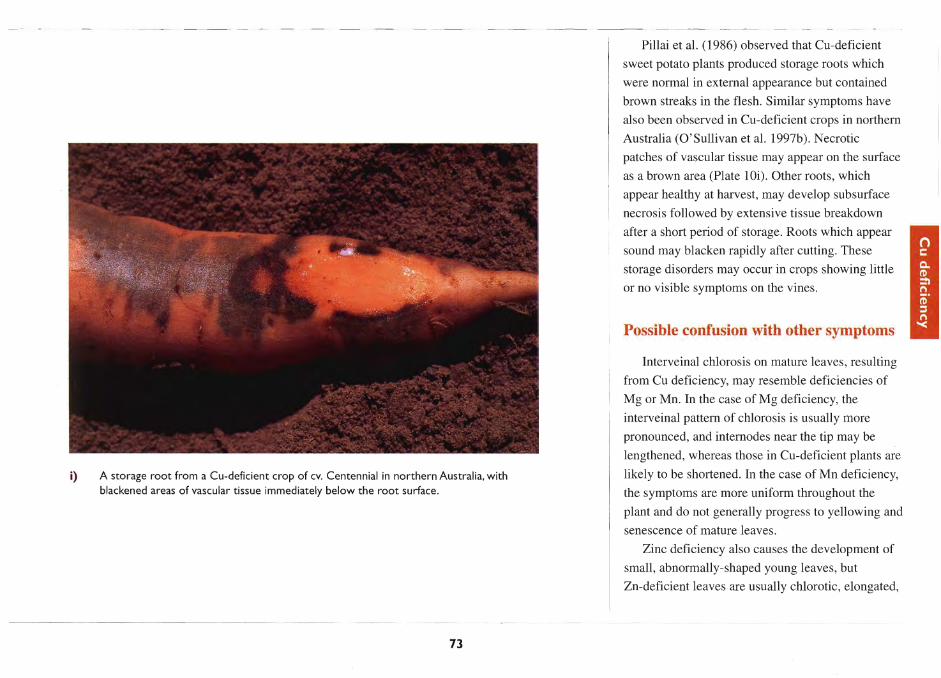
i) A storage root from a Cu-deficient crop of cv. Centennial in northern Australia, with blackened areas of vascular tissue immediately below the root surface.
73
Pillai et al. (1986) observed that eu-deficient
sweet potato plants produced storage roots which
were nonnal in external appearance but contained
brown streaks in the flesh. Similar symptoms have
also been observed in eu-deficient crops in northern
Australia (O'Sullivan et al. 1997b). Necrotic
patches of vascular tissue may appear on the surface
as a brown area (Plate lOi). Other roots, which
appear healthy at harvest, may develop subsurface
necrosis followed by extensive tissue breakdown
after a short period of storage. Roots which appear
sound may blacken rapidly after cutting. These
storage disorders may occur in crops showing little
or no visible symptoms on the vines.
Possible confusion with other symptoms
Interveinal chlorosis on mature leaves, resulting
from eu deficiency, may resemble deficiencies of
Mg or Mn. In the case of Mg deficiency, the
interveinal pattern of chlorosis is usually more
pronounced, and internodes near the tip may be
lengthened, whereas those in eu-deficient plants are
likely to be shortened. In the case of Mn deficiency,
the symptoms are more uniform throughout the
plant and do not generally progress to yellowing and
senescence of mature leaves.
Zinc deficiency also causes the development of
small, abnormally-shaped young leaves, but
Zn-deficient leaves are usually chlorotic, elongated,

with reduced laterallobing. They are usually not
asymmetrical or puckered, as is often the case with
Cu deficiency. Aphide may also cause puckering of
young leaves.
Diagnostic soil and plant tissue tests
The critical concentration for Cu deficiency was
found to be in the range 4-5 mg Cu/kg in the 7th to
9th youngest leaf blades (Table 3). Concentrations
below 2 mg Cu/kg have been recorded in crops
showing symptoms of Cu deficiency in northern
Australia (O'Sullivan et al. 1997b).
Soil extraction using EDTA with ammonium
bicarbonate has been recommended for evaluation
of Cu status, particularly in alkaline, calcareous
soils . Using this test, a critical concentration of
0.3-0.4 mg Cu/kg was determined for wheat (Best
et al. 1985). Soil tests have not been calibrated for
Cu deficiency in sweet potato.
A quick and inexpensive diagnostic test may be
made by painting the surface of a young leaf with a
dilute solution containing Cu (e.g. 0.25 %
CuS04.5H20 + 0.25% Ca(OH)2). If Cu deficiency is
the cause of the observed symptoms, the treated leaf
will show reduced symptoms and increased
expansion of the lamina over the following week. It
is important to clearly label the leaf so that it can be
identified on later inspection.
The result is most obviously seen if only one
half of the leaf is painted, so it can be compared
with the untreated half. A small amount of
agricultural wetting agent or mild detergent may
assist to ensure even wetting of the leaf surface, but
this is not essential with sweet potato, as the foliage
wets relatively easily.
Correction of copper deficiency
Copper may be applied to the soil or as a foliar
spray. On alkaline or organic soils, foliar sprays may
be more effective due to the rapid fixing of soil
applied Cu, but in general, soil application is
considered preferable (Reuther and Labanauskas
1966). Rates of application for sweet potato crops
have not been optimised. For other crops, soil
applications of copper sulfate at 1 kg Cu/ha on acid,
sandy soils with low organic matter content, to 7 kg
Cu/ha on alkaline, peaty or heavy-textured soils have
been used. Overfertilization with Cu can lead to Cu
toxicity, so the minimum effective dose should be
sought. A single application of Cu may be effective
for up to 10 years (Weir and Cresswell 1993).
For foliar application, rates as low as 0.25 kg
Culha have been sufficient for wheat. Spray mixtures
of 0.5% copper sulfate plus 0.5% hydrated lime
(Asher and Lee 1975) or 0.5% copper oxychloride
(Weir and Cresswell 1993) have been recommended
for ginger and vegetable crops, respectively. Copper
sulfate alone may cause leaf bum.
74
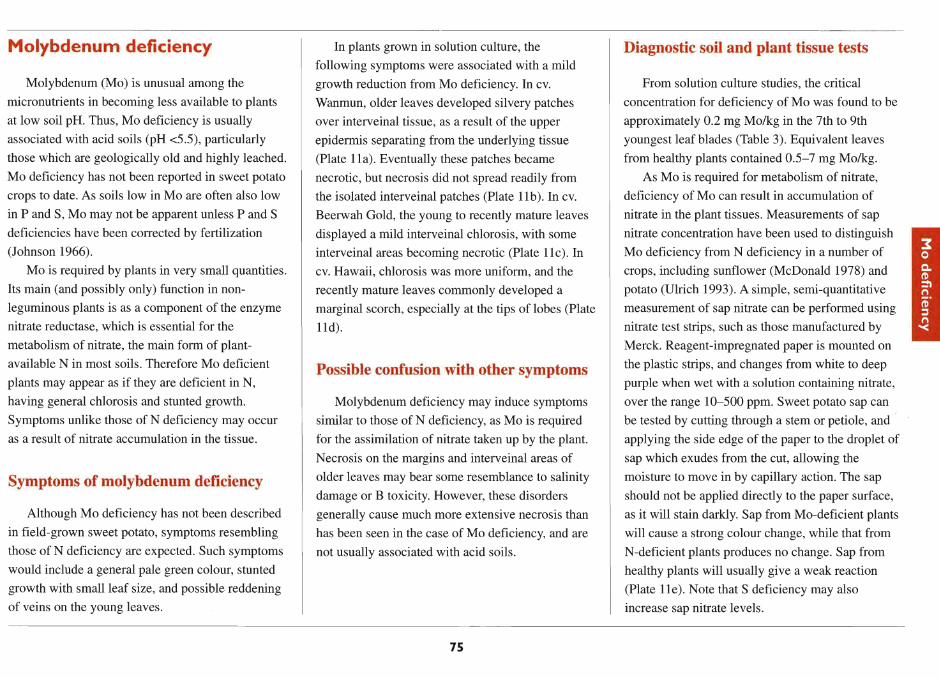
------------------------------------------------------------- ------------------------------------------------------ - ---------
Molybdenum deficiency
Molybdenum (Mo) is unusual among the
micronutrients in becoming less available to plants
at low soil pH. Thus, Mo deficiency is usually
associated with acid soils (pH <5.5), particularly
those which are geologically old and highly leached.
Mo deficiency has not been reported in sweet potato
crops to date. As soils low in Mo are often also low
in P and S, Mo may not be apparent unless P and S
deficiencies have been corrected by fertilization
(Johnson 1966).
Mo is required by plants in very small quantities.
Its main (and possibly only) function in non
leguminous plants is as a component of the enzyme
nitrate reductase, which is essential for the
metabolism of nitrate, the main form of plant
available N in most soils. Therefore Mo deficient
plants may appear as if they are deficient in N,
having general chlorosis and stunted growth.
Symptoms unlike those of N deficiency may occur
as a result of nitrate accumulation in the tissue.
Symptoms of molybdenum deficiency
Although Mo deficiency has not been described
in field-grown sweet potato, symptoms resembling
those of N deficiency are expected. Such symptoms
would include a general pale green colour, stunted
growth with small leaf size, and possible reddening
of veins on the young leaves.
In plants grown in solution culture, the
following symptoms were associated with a mild
growth reduction from Mo deficiency. In cv.
Wanmun, older leaves developed silvery patches
over interveinal tissue, as a result of the upper
epidermis separating from the underlying tissue
(Plate 11a). Eventually these patches became
necrotic, but necrosis did not spread readily from
the isolated interveinal patches (Plate 11 b). In cv.
Beerwah Gold, the young to recently mature leaves
displayed a mild interveinal chlorosis, with some
interveinal areas becoming necrotic (Plate 11c). In
cv. Hawaii, chlorosis was more uniform, and the
recently mature leaves commonly developed a
marginal scorch, especially at the tips of lobes (Plate
lId).
Possible confusion with other symptoms
Molybdenum deficiency may induce symptoms
similar to those of N deficiency, as Mo is required
for the assimilation of nitrate taken up by the plant.
Necrosis on the margins and interveinal areas of
older leaves may bear some resemblance to salinity
damage or B toxicity. However, these disorders
generally cause much more extensive necrosis than
has been seen in the case of Mo deficiency, and are
not usually associated with acid soils.
75
Diagnostic soil and plant tissue tests
From solution culture studies, the critical
concentration for deficiency of Mo was found to be
approximately 0.2 mg Mo/kg in the 7th to 9th
youngest leaf blades (Table 3). Equivalent leaves
from healthy plants contained 0.5-7 mg Mo/kg.
As Mo is required for metabolism of nitrate,
deficiency of Mo can result in accumulation of
nitrate in the plant tissues. Measurements of sap
nitrate concentration have been used to distinguish
Mo deficiency from N deficiency in a number of
crops, including sunflower (McDonald 1978) and
potato (Ulrich 1993). A simple, semi-quantitative
measurement of sap nitrate can be performed using
nitrate test strips, such as those manufactured by
Merck. Reagent-impregnated paper is mounted on
the plastic strips, and changes from white to deep
purple when wet with a solution containing nitrate,
over the range 10-500 ppm. Sweet potato sap can
be tested by cutting through a stem or petiole, and
applying the side edge of the paper to the droplet of
sap which exudes from the cut, allowing the
moisture to move in by capillary action. The sap
should not be applied directly to the paper surface,
as it will stain darkly. Sap from Mo-deficient plants
will cause a strong colour change, while that from
N-deficient plants produces no change. Sap from
healthy plants will usually give a weak reaction
(Plate lIe). Note that S deficiency may also
increase sap nitrate levels.

Plate I I. Molybdenum deficiency
a) Silvery interveinal patches on mature leaves of cv. Wanmun. resulting from Mo deficiency.
b) Necrosis developing in the affected interveinal areas on a leaf of cv.Wanmun.
76
c) Interveinal chlorosis and necrotic patches on a mature leaf of cv. Beerwah Gold.
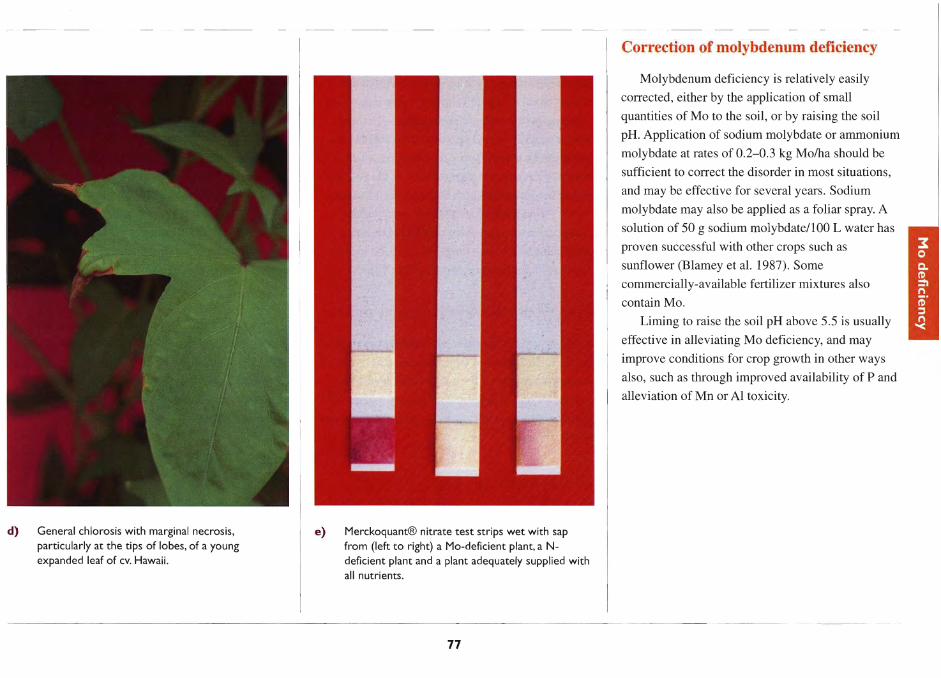
d) General chlorosis with marginal necrosis, particularly at the tips of lobes, of a young expanded leaf of cv. Hawaii.
e) Merckoquant® nitrate test strips wet with sap from (left to right) a Mo-deficient plant, a Ndeficient plant and a plant adequately supplied with all nutrients.
77
Correction of molybdenum deficiency
Molybdenum deficiency is relatively easily
corrected, either by the application of small
quantities of Mo to the soil, or by raising the soil
pH. Application of sodium molybdate or ammonium
molybdate at rates of 0.2-0.3 kg Mo/ha should be
sufficient to correct the disorder in most situations,
and may be effective for several years. Sodium
molybdate may also be applied as a foliar spray. A
solution of 50 g sodium molybdatellOO L water has
proven successful with other crops such as
sunflower (Blarney et al. 1987). Some
commercially-available fertilizer mixtures also
contain Mo.
Liming to raise the soil pH above 5.5 is usually
effective in alleviating Mo deficiency, and may
improve conditions for crop growth in other ways
also, such as through improved availability of P and
alleviation of Mn or Al toxicity.
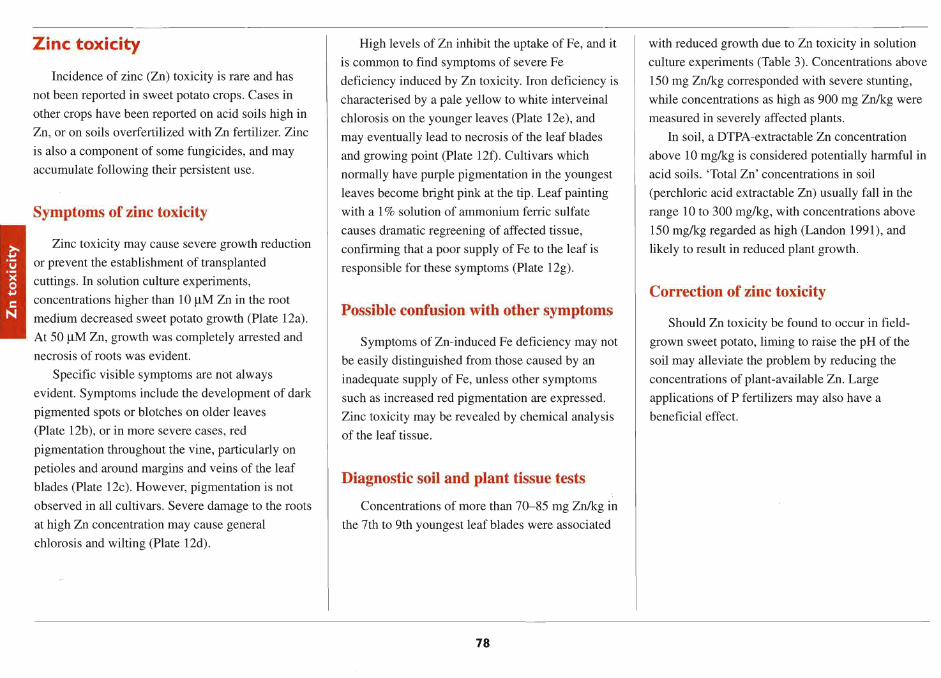
Zinc toxicity
Incidence of zinc (Zn) toxicity is rare and has
not been reported in sweet potato crops. Cases in
other crops have been reported on acid soils high in
Zn, or on soils overfertilized with Zn fertilizer. Zinc
is also a component of some fungicides, and may
accumulate following their persistent use.
Symptoms of zinc toxicity
Zinc toxicity may cause severe growth reduction
or prevent the establishment of transplanted
cuttings. In solution culture experiments,
concentrations higher than 10 )lM Zn in the root
medium decreased sweet potato growth (Plate 12a).
At 50 )lM Zn, growth was completely arrested and
necrosis of roots was evident.
Specific visible symptoms are not always
evident. Symptoms include the development of dark
pigmented spots or blotches on older leaves
(Plate 12b), or in more severe cases, red
pigmentation throughout the vine, particularly on
petioles and around margins and veins of the leaf
blades (Plate 12c). However, pigmentation is not
observed in all cultivars. Severe damage to the roots
at high Zn concentration may cause general
chlorosis and wilting (Plate 12d).
High levels of Zn inhibit the uptake of Fe, and it
is common to find symptoms of severe Fe
deficiency induced by Zn toxicity. Iron deficiency is
characterised by a pale yellow to white interveinal
chlorosis on the younger leaves (Plate 12e), and
may eventually lead to necrosis of the leaf blades
and growing point (Plate 12f). Cultivars which
normally have purple pigmentation in the youngest
leaves become bright pink at the tip. Leaf painting
with a 1 % solution of ammonium ferric sulfate
causes dramatic regreening of affected tissue,
confirming that a poor supply of Fe to the leaf is
responsible for these symptoms (Plate 12g).
Possible confusion with other symptoms
Symptoms of Zn-induced Fe deficiency may not
be easily distinguished from those caused by an
inadequate supply of Fe, unless other symptoms
such as increased red pigmentation are expressed.
Zinc toxicity may be revealed by chemical analysis
of the leaf tissue.
Diagnostic soil and plant tissue tests
Concentrations of more than 70-85 mg Zn/kg in
the 7th to 9th youngest leaf blades were associated
78
with reduced growth due to Zn toxicity in solution
culture experiments (Table 3). Concentrations above
150 mg Zn/kg corresponded with severe stunting,
while concentrations as high as 900 mg Zn/kg were
measured in severely affected plants.
In soil, a DTPA-extractable Zn concentration
above 10 mg/kg is considered potentially harmful in
acid soils. 'Total Zn' concentrations in soil
(perchloric acid extractable Zn) usually fall in the
range 10 to 300 mg/kg, with concentrations above
150 mg/kg regarded as high (Landon 1991), and
likely to result in reduced plant growth.
Correction of zinc toxicity
Should Zn toxicity be found to occur in field
grown sweet potato, liming to raise the pH of the
soil may alleviate the problem by reducing the
concentrations of plant-available Zn. Large
applications of P fertilizers may also have a
beneficial effect.
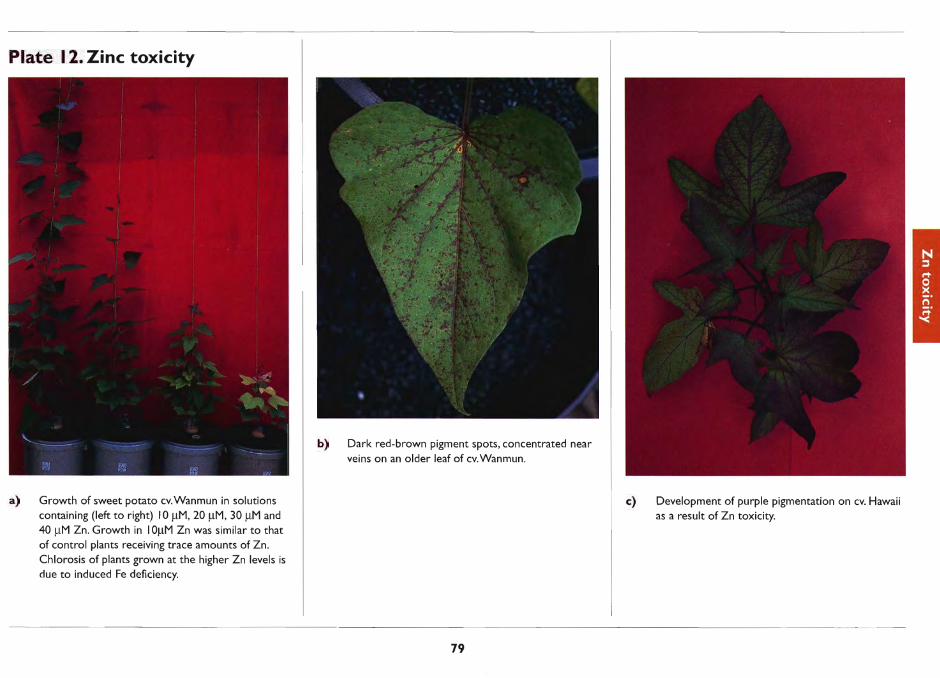
Plate 12. Zinc toxicity
a) Growth of sweet potato cv.Wanmun in solutions containing (left to right) 10 J.lM. 20 J.lM. 30 J.lM and 40 J.lM Zn. Growth in 10J.lM Zn was similar to that of control plants receiving trace amounts of Zn. Chlorosis of plants grown at the higher Zn levels is due to induced Fe deficiency.
b) Dark red-brown pigment spots. concentrated near veins on an older leaf of cv. Wanmun.
79
c) Development of purple pigmentation on cv. Hawaii as a result of Zn toxicity.
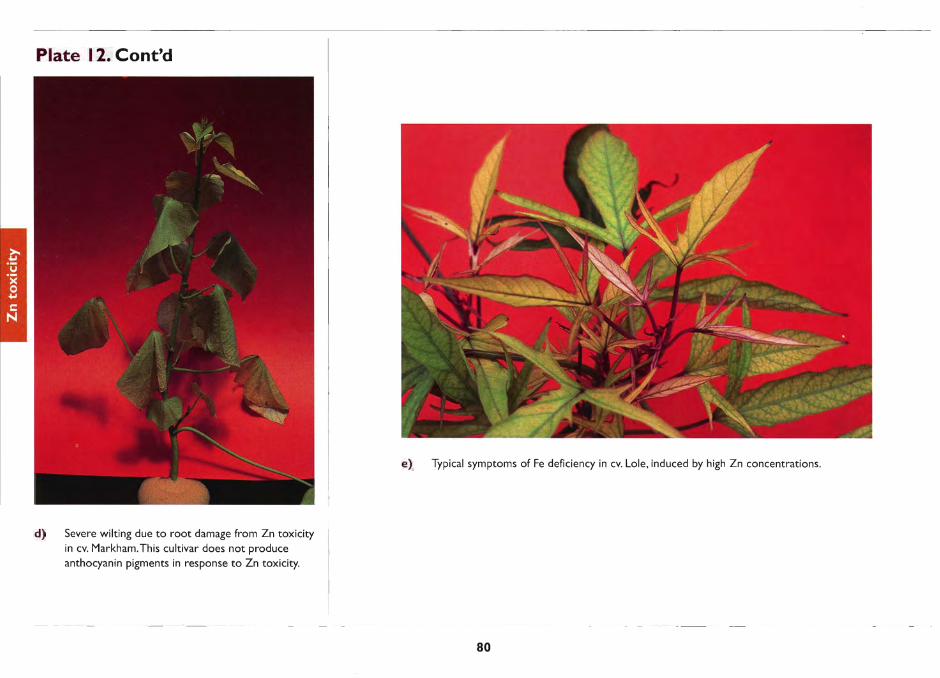
Plate I 2. Cont'd
d) Severe wilting due to root damage from Zn toxicity in cv. Markham.This cultivar does not produce anthocyanin pigments in response to Zn toxicity.
e) Typical symptoms of Fe deficiency in cv. Lole, induced by high Zn concentrations.
80
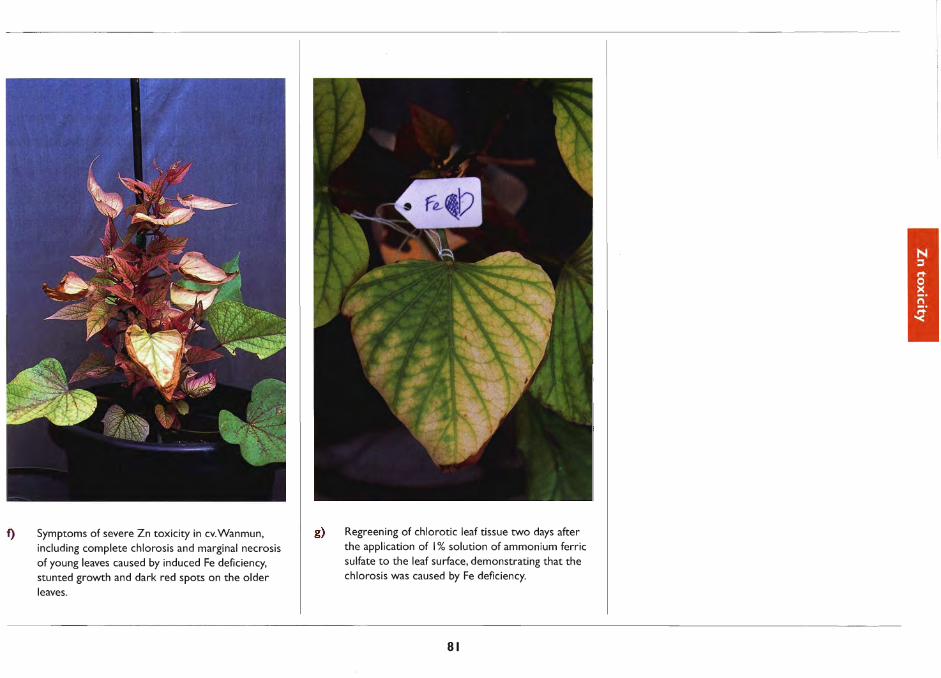
1) Symptoms of severe Zn toxicity in cV.Wanmun, including complete chlorosis and marginal necrosis of young leaves caused by induced Fe deficiency, stunted growth and dark red spots on the older
leaves.
g) Regreening of chlorotic leaf tissue two days after the application of I % solution of ammonium ferric sulfate to the leaf surface, demonstrating that the chlorosis was caused by Fe deficiency.
81

Copper toxicity
Toxic levels of copper (Cu) rarely occur
naturally in soils. However, Cu may accumulate due
to application of sewage sludge, pig slurries or mine
slag, or more commonly through persistent use of
Cu-containing fungicides or fertilizers (Tiller and
Merry 1981). Mild symptoms of Cu toxicity have
been observed on sweet potato in northern Australia
on land with a history of heavy fungicide use
(O'Sullivan et al. 1997b).
Symptoms of copper toxicity
Excess Cu is highly toxic to sweet potato
(Plate 13a), concentrations as low as 5 flM in the
root zone being sufficient to cause significant growth
reduction. Concentrations above 20 flM prevent root
growth and result in the death of the transplanted
cutting. Root damage may cause severe wilting, and
death of the shoot tip (Plate 13b). Unlike Zn toxicity,
there is little or no general chlorosis of the leaves,
nor increased red pigmentation.
Moderate levels of Cu toxicity may be
accompanied by a pale green to white interveinal
chlorosis on mature leaves (Plates 13c-e). Often the
symptom appears on only a few leaves on the vine,
with both younger and older leaves lacking chlorosis
(Plate 13a). Small interveinal areas become pale and
slightly sunken, while the tissue around both major
and minor veins retains normal coloration. The effect
may vary from a faint mottle (Plate 13c) to a
striking, sharply defined pattern (Plate 13e). The
symptom is often unevenly distributed across the
blade, affecting one region, such as the leaf tip or a
lobe, more than others (Plate 13d).
Like toxicities of Mn and Zn, Cu toxicity may
also induce symptoms of Fe deficiency, seen as a
conspicuous pale yellow interveinal chlorosis on the
younger leaves (Plate 13a).
Possible confusion with other symptoms
The interveinal chlorosis may be confused with
the pitting caused by Mn deficiency. In the case of
Cu toxicity, it is most intense on mature rather than
on younger leaves and is not accompanied by a
general chlorosis of the leaf blade. Symptoms of Mn
deficiency typically affect the entire blade
uniformly, while those of Cu toxicity may be
localised or unevenly distributed.
It may be difficult to distinguish between severe
Cu toxicity and Zn toxicity, although the latter more
frequently causes increased red pigmentation on the
vines. Some knowledge of the site history and a
chemical analysis of leaf tissue may be necessary to
confirm the diagnosis.
82
Plate 13. Copper toxicity
a) Growth of sweet potato cv.Wanmun in solutions
containing (left to right) trace, 8 /-lM and 12 /-lM Cu.
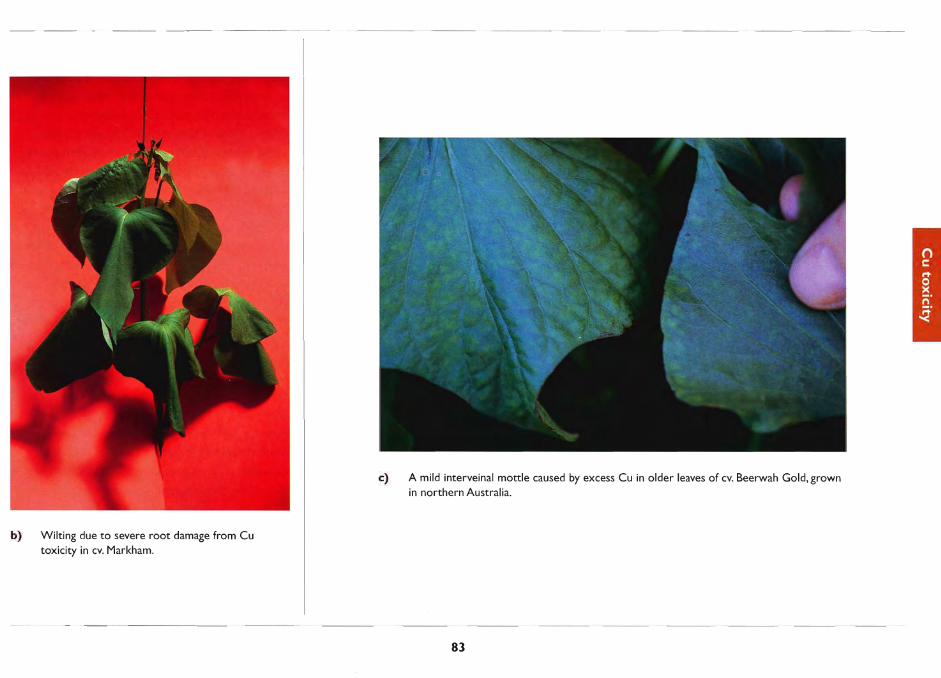
b) Wilting due to severe root damage from Cu toxicity in CV. Markham.
c) A mild interveinal mottle caused by excess Cu in older leaves of cv. Beerwah Gold,grown in northern Australia.
83
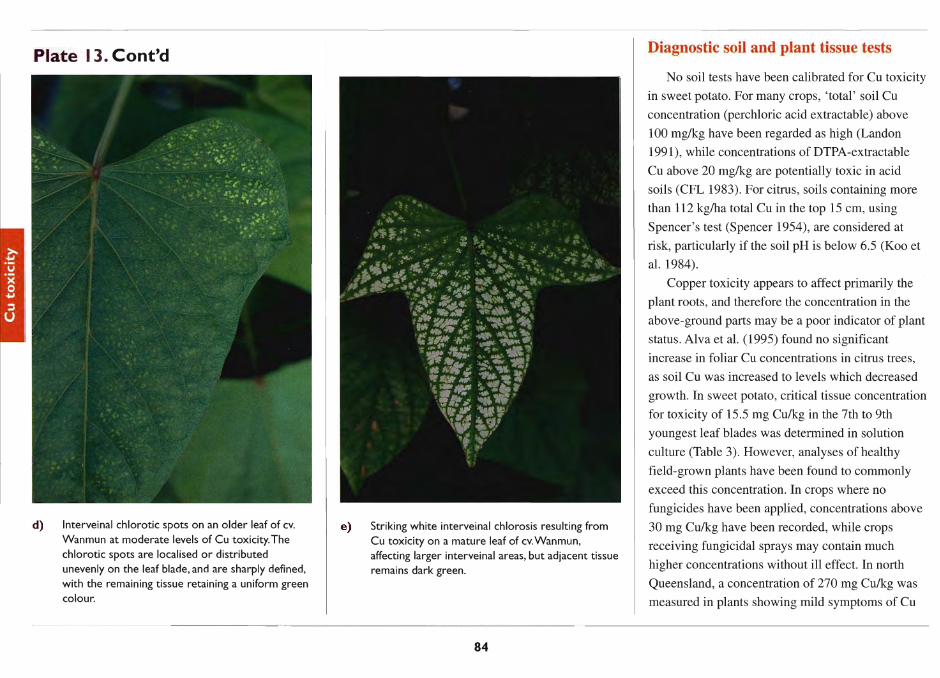
Plate 13. Cont'd
d) Interveinal chlorotic spots on an older leaf of cv. Wanmun at moderate levels of Cu toxicity.The chlorotic spots are localised or distributed unevenly on the leaf blade, and are sharply defined, with the remaining tissue retaining a uniform green colour.
e) Striking white interveinal chlorosis resulting from Cu toxicity on a mature leaf of cv.Wanmun, affecting larger interveinal areas, but adjacent tissue remains dark green.
84
Diagnostic soil and plant tissue tests
No soil tests have been calibrated for Cu toxicity
in sweet potato. For many crops, 'total' soil Cu
concentration (perchloric acid extractable) above
100 mg/kg have been regarded as high (Landon
1991), while concentrations of DTPA-extractable
Cu above 20 mg/kg are potentially toxic in acid
soils (CFL 1983). For citrus, soils containing more
than 112 kg/ha total Cu in the top 15 cm, using
Spencer's test (Spencer 1954), are considered at
risk, particularly if the soil pH is below 6.5 (Koo et
al. 1984).
Copper toxicity appears to affect primarily the
plant roots, and therefore the concentration in the
above-ground parts may be a poor indicator of plant
status. Alva et al. (1995) found no significant
increase in foliar Cu concentrations in citrus trees,
as soil Cu was increased to levels which decreased
growth. In sweet potato, critical tissue concentration
for toxicity of 15.5 mg Cu/kg in the 7th to 9th
youngest leaf blades was determined in solution
culture (Table 3). However, analyses of healthy
field-grown plants have been found to commonly
exceed this concentration. In crops where no
fungicides have been applied, concentrations above
30 mg Cu/kg have been recorded, while crops
receiving fungicidal sprays may contain much
higher concentrations without ill effect. In north
Queensland, a concentration of 270 mg Cu/kg was
measured in plants showing mild symptoms of Cu

toxicity, while over 800 mg Cu/kg was measured in
leaves of an apparently healthy crop. These high
concentrations are probably achieved by direct
adsorption of Cu onto the leaf surfaces from
fungicidal spray, and reflect the recent spraying
history of the crop. In contrast, toxicity is more
likely to result from accumulated spray residues in
the soil, and depends on the extended history of the
site, combined with the ability of the soil to fix Cu.
Correction of copper toxicity
As Cu toxicity usually results from excessive
application of Cu, prevention rather than correction
should be stressed. Heavy applications of P
fertilizers may reduce the availability of excess Cu
to the plants. Liming may be beneficial, as Cu
becomes less available to plants at high pH.
Maintaining the soil pH above 6.5 has been
recommended for amelioration of Cu toxicity in
citrus (Koo et al. 1984).
85
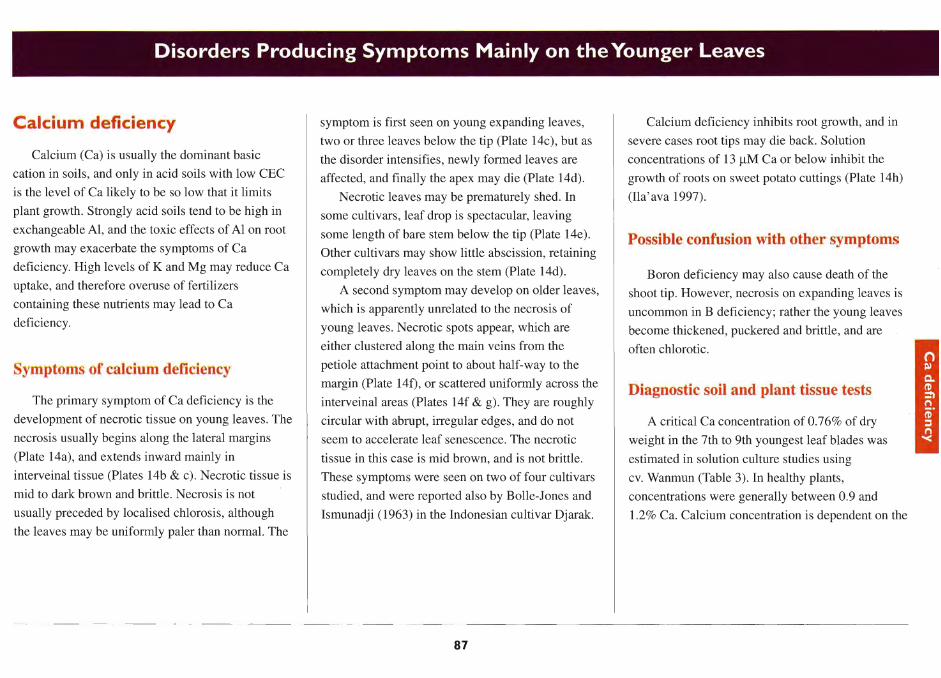
Disorders Producing Symptoms Mainly on the Younger Leaves
Calcium deficiency
Calcium (Ca) is usually the dominant basic
cation in soils, and only in acid soils with low CEC
is the level of Ca likely to be so low that it limits
plant growth. Strongly acid soils tend to be high in
exchangeable AI, and the toxic effects of Al on root
growth may exacerbate the symptoms of Ca
deficiency. High levels of K and Mg may reduce Ca
uptake, and therefore overuse of fertilizers
containing these nutrients may lead to Ca
deficiency.
Symptoms of calcium deficiency
The primary symptom of Ca deficiency is the
development of necrotic tissue on young leaves. The
necrosis usually begins along the lateral margins
(Plate 14a), and extends inward mainly in
interveinal tissue (Plates 14b & c). Necrotic tissue is
mid to dark brown and brittle. Necrosis is not
usually preceded by localised chlorosis, although
the leaves may be uniformly paler than normal. The
symptom is first seen on young expanding leaves,
two or three leaves below the tip (Plate 14c), but as
the disorder intensifies, newly formed leaves are
affected, and finally the apex may die (Plate 14d).
Necrotic leaves may be prematurely shed. In
some cultivars, leaf drop is spectacular, leaving
some length of bare stem below the tip (Plate 14e).
Other cultivars may show little abscission, retaining
completely dry leaves on the stem (Plate 14d).
A second symptom may develop on older leaves,
which is apparently unrelated to the necrosis of
young leaves. Necrotic spots appear, which are
either clustered along the main veins from the
petiole attachment point to about half-way to the
margin (Plate 14f), or scattered uniformly across the
interveinal areas (Plates 14f & g). They are roughly
circular with abrupt, irregular edges, and do not
seem to accelerate leaf senescence. The necrotic
tissue in this case is mid brown, and is not brittle.
These symptoms were seen on two of four cultivars
studied, and were reported also by Bolle-Jones and
Ismunadji (1963) in the Indonesian cultivar Djarak.
87
Calcium deficiency inhibits root growth, and in
severe cases root tips may die back. Solution
concentrations of 13 ~M Ca or below inhibit the
growth of roots on sweet potato cuttings (Plate 14h)
(Ila' ava 1997).
Possible confusion with other symptoms
Boron deficiency may also cause death of the
shoot tip. However, necrosis on expanding leaves is
uncommon in B deficiency; rather the young leaves
become thickened, puckered and brittle, and are
often chlorotic.
Diagnostic soil and plant tissue tests
A critical Ca concentration of 0.76% of dry
weight in the 7th to 9th youngest leaf blades was
estimated in solution culture studies using
cv. Wanmun (Table 3). In healthy plants,
concentrations were generally between 0.9 and
1.2% Ca. Calcium concentration is dependent on the
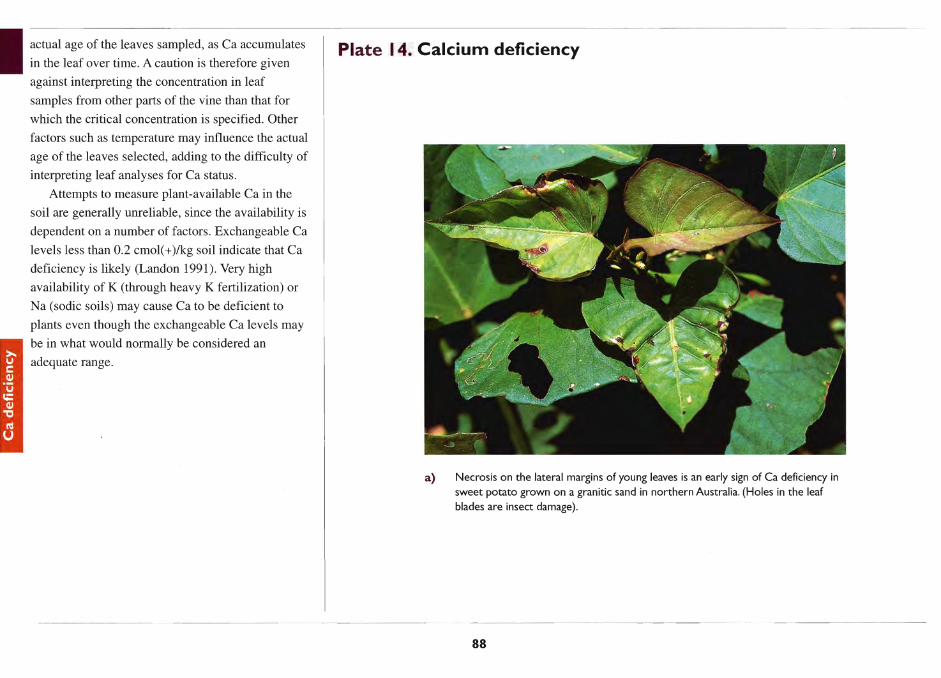
I actual age of the leaves sampled, as Ca accumulates
in the leaf over time. A caution is therefore given
against interpreting the concentration in leaf
samples from other parts of the vine than that for
which the critical concentration is specified. Other
factors such as temperature may influence the actual
age of the leaves selected, adding to the difficulty of
interpreting leaf analyses for Ca status.
Attempts to measure plant-available Ca in the
soil are generally unreliable, since the availability is
dependent on a number of factors. Exchangeable Ca
levels less than 0.2 cmol( + )/kg soil indicate that Ca
deficiency is likely (Landon 1991). Very high
availability of K (through heavy K fertilization) or
Na (sodic soils) may cause Ca to be deficient to
plants even though the exchangeable Ca levels may
be in what would normally be considered an
adequate range.
Plate 14. Calcium deficiency
a) Necrosis on the lateral margins of young leaves is an early sign of Ca deficiency in sweet potato grown on a granitic sand in northern Australia. (Holes in the leaf blades are insect damage).
88

b) Necrosis spreading from the lateral margins of a young leaf of cv. Hawaii. Older leaves have been shed.
c) Young leaves of cv. Wanmun, showing the development of necrosis on expanding leaves below the tip.
89
d) Severe Ca deficiency resulting in death of the growing point in cv.Wanmun. Note retention of dead leaves on the stem.
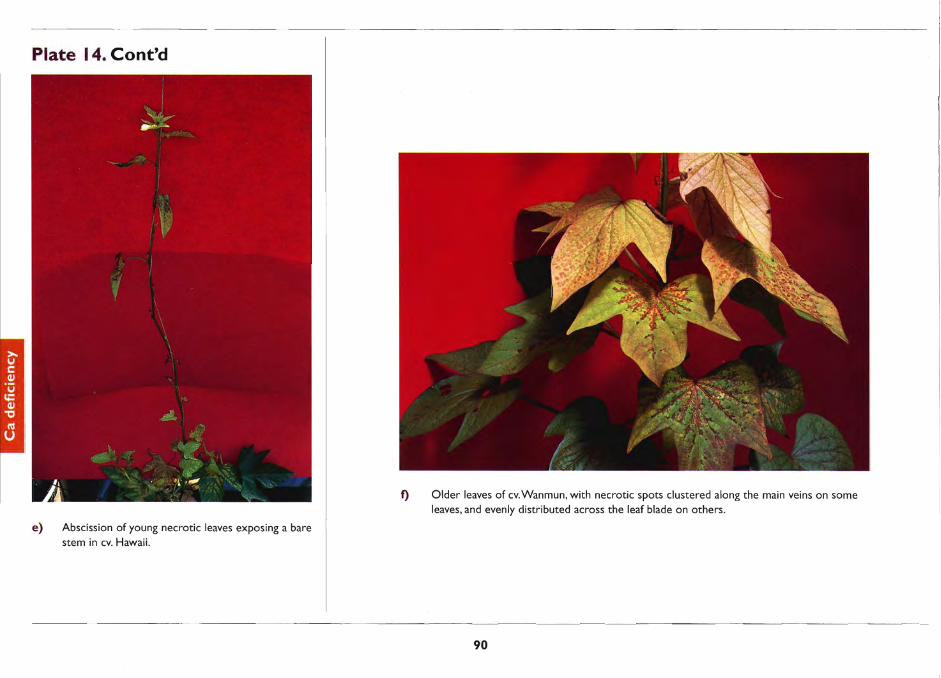
Plate 14. Cont'd
e) Abscission of young necrotic leaves exposing a bare stem in cv. Hawaii.
f) Older leaves of cV.Wanmun, with necrotic spots clustered along the main veins on some leaves, and evenly distributed across the leaf blade on others.
90

g) An older leaf of CY. Markham, with necrotic spots spread across the leaf blade.
h) Rooting of sweet potato CY. Hawaii tip cuttings, in nutrient solutions containing, from left to right, 4, 13,41,144,397 and 1328 f..lM Ca. (Photo:Y.P. lIa'aya)
91

Correction of calcium deficiency
Addition of lime (40% Ca) has the dual effect of
providing Ca and raising the soil pH. Lime is poorly
soluble, and consequently has low mobility in the
soil, so it should be broadcast and incorporated
thoroughly into the soil before planting the crop. If
Ca deficiency is not associated with soil acidity,
gypsum (22% Ca) may be used. It is usually also
incorporated into the soil, although it is more soluble
than lime. Single and triple superphosphate also
contain Ca (23% and 16% Ca respectively) and may
be suitable sources where both P and Ca are in short
supply.
Applications of Ca (particularly as gypsum) may
intensify deficiencies of Mg or K. It may be
necessary to add these nutrients in conjunction with
Ca, so that a suitable cation balance is maintained.
92
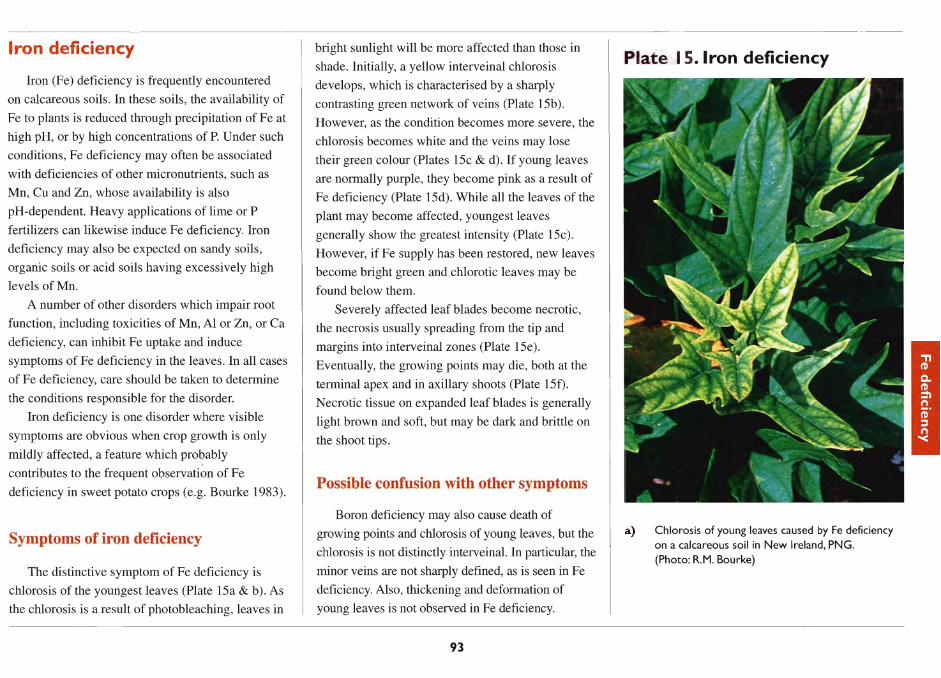
Iron deficiency
Iron (Fe) deficiency is frequently encountered
on calcareous soils . In these soils, the availability of
Fe to plants is reduced through precipitation of Fe at
high pH, or by high concentrations of P. Under such
conditions, Fe deficiency may often be associated
with deficiencies of other micronutrients, such as
Mn, Cu and Zn, whose availability is also
pH-dependent. Heavy applications of lime or P
fertilizers can likewise induce Fe deficiency. Iron
deficiency may also be expected on sandy soils,
organic soils or acid soils having excessively high
levels of Mn.
A number of other disorders which impair root
function , including toxicities of Mn, Al or Zn, or Ca
deficiency, can inhibit Fe uptake and induce
symptoms of Fe deficiency in the leaves. In all cases
of Fe deficiency, care should be taken to determine
the conditions responsible for the disorder.
Iron deficiency is one disorder where visible
symptoms are obvious when crop growth is only
mildly affected, a feature which probably
contributes to the frequent observation of Fe
deficiency in sweet potato crops (e.g. Bourke 1983).
Symptoms of iron deficiency
The distinctive symptom of Fe deficiency is
chlorosis of the youngest leaves (Plate 15a & b). As
the chlorosis is a result of photobleaching, leaves in
bright sunlight will be more affected than those in
shade. Initially, a yellow interveinal chlorosis
develops, which is characterised by a sharply
contrasting green network of veins (Plate 15b).
However, as the condition becomes more severe, the
chlorosis becomes white and the veins may lose
their green colour (Plates 15c & d). If young leaves
are normally purple, they become pink as a result of
Fe deficiency (Plate 15d). While all the leaves of the
plant may become affected, youngest leaves
generally show the greatest intensity (Plate 15c).
However, if Fe supply has been restored, new leaves
become bright green and chlorotic leaves may be
found below them.
Severely affected leaf blades become necrotic,
the necrosis usually spreading from the tip and
margins into interveinal zones (Plate 15e).
Eventually, the growing points may die, both at the
terminal apex and in axillary shoots (Plate l5f).
Necrotic tissue on expanded leaf blades is generally
light brown and soft, but may be dark and brittle on
the shoot tips.
Possible confusion with other symptoms
Boron deficiency may also cause death of
growing points and chlorosis of young leaves, but the
chlorosis is not distinctly interveinal. In particular, the
minor veins are not sharply defined, as is seen in Fe
deficiency. Also, thickening and deformation of
young leaves is not observed in Fe deficiency.
93
Plate 15. Iron deficiency
a) Chlorosis of young leaves caused by Fe deficiency on a calcareous soil in New Ireland, PNG.
(Photo: R.M. Bourke)
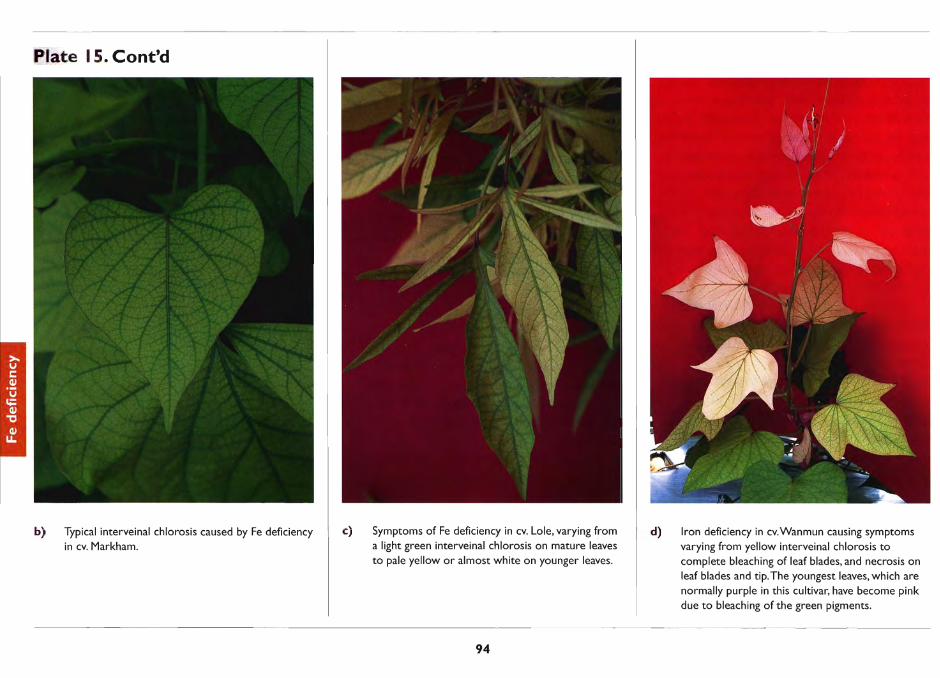
Plate 15. Cont'd
b) Typical interveinal chlorosis caused by Fe deficiency in cv. Markham.
c) Symptoms of Fe deficiency in cv. Lole. varying from a light green interveinal chlorosis on mature leaves to pale yellow or almost white on younger leaves.
94
d) Iron deficiency in cv.Wanmun causing symptoms
varying from yellow interveinal chlorosis to complete bleaching of leaf blades. and necrosis on leaf blades and tip. The youngest leaves. which are normally purple in this cultivar. have become pink due to bleaching of the green pigments.
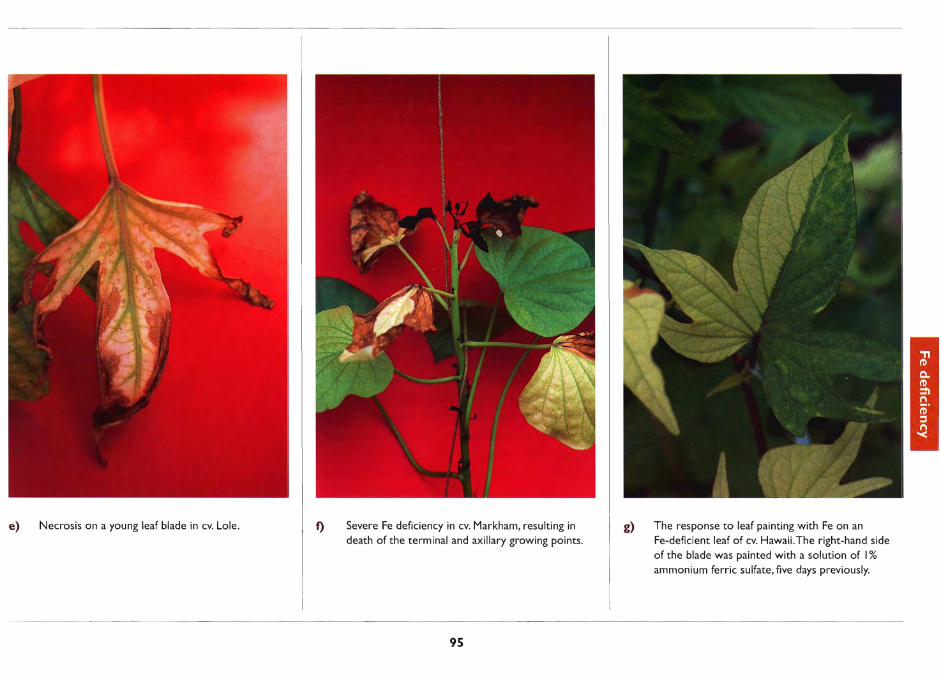
e) Necrosis on a young leaf blade in cv. Lole. f) Severe Fe deficiency in cv. Markham, resulting in death of the terminal and axillary growing points.
95
g) The response to leaf painting with Fe on an Fe-deficient leaf of cv. Hawaii. The right-hand side of the blade was painted with a solution of 1% ammonium ferric sulfate, five days previously.
Iron deficiency may be induced by a number of
disorders which adversely affect root function.
These include Ca deficiency and toxicities of Mn,
Zn or Cu. Correction depends on identifying the
primary cause in these cases.
Diagnostic soil and plant tissue tests
A critical concentration of 33 mg Fe/kg in the
7th to 9th youngest leaf blades was estimated in
solution culture studies using cv. Wanmun (Table 3).
In healthy plants, concentrations were generally
between 45 and 500 mg Fe/kg. This is consistent
with the findings of Spence and Ahmad (1967) who
reported 35 mg Fe/kg dry weight in young shoots of
plants which showed mild symptoms of Fe
deficiency without growth reduction, and 28 mg
Fe/kg in a similar sample from plants showing
severe chlorosis.
Due to the large number of factors which affect
the availability of soil Fe to plants, soil
measurements are not generally reliable for
diagnosing Fe deficiency.
Diagnosis can be confirmed by painting a
chlorotic leaf with a 1 % solution of ammonium
ferric sulfate, which will cause regreening after a
few days. It is important to clearly label the painted
leaf so that it can be identified on later inspection.
By painting only one half of the leaf, the other half
may be used for comparison of the response
(Plate 15g). Including a small amount of an
agricultural wetting agent or mild detergent in the
solution may aid the uniform wetting of the leaf
surface, but it is not essential for sweet potato
leaves, which wet relatively easily.
Correction of iron deficiency
On soils of high pH, application of Fe
compounds as a fertilizer to the soil is likely to give
a poor response, as the added Fe will be precipitated
and become unavailable to plants. Treatment of an
Fe deficient crop is best achieved by a foliar spray
of chelated Fe or 1-2% ammonium ferric sulfate
solution. Burying small pieces of scrap iron, such as
nails and steel food cans, in the mound at planting,
can also be effective in reducing Fe deficiency.
Soaking cans in sea water before burying
accelerates rusting and has been successful in
increasing their effectiveness as an Fe supplement
on calcareous atoll soils (Cable 1992).
If Fe deficiency occurs on an acid soil, it may be
a secondary effect of another nutritional disorder,
such as Mn toxicity or Ca deficiency. In this case,
liming may alleviate the Fe deficiency by
eliminating the underlying problem.
96
Boron deficiency
Sweet potato seems to be more susceptible to
boron (B) deficiency than many other crops. Boron
deficiency has long been recognised as a significant
problem of commercial sweet potato crops in the
USA, particularly in relation to poor root quality
(Willis 1943; Nusbaum 1946; Miller and Nielsen
1970). Cases have been recorded in many other
countries, in a range of environments, including
highly weathered ultisols in the Highlands of PNG
(Bourke 1983), on granitic sands in northern
Australia (O'Sullivan et al. 1997b) and on river flats
in Malawi (1. Mkumbira, pers. comm. 1995). Boron
deficiency is most likely on soils derived from acid
igneous rocks and freshwater sediments, which are
naturally low in B, or in acid, sandy soils in high
rainfall areas, from which B has been leached
(Bradford 1966). Dry or cold conditions, which
restrict root development and the movement of
water from roots to tops, seem to exacerbate B
deficiency. Recovery may occur following rain or
warmer weather.
Symptoms of boron deficiency
Boron deficiency affects actively growing tissue,
both of the shoots and roots. The first sign is usually
a thickening of young leaves. The leaves and stem
near the shoot tip are brittle and break easily when
bent. Other symptoms are variable, depending on
the cultivar and growing conditions. Young leaves
are usually paler than the older leaves (Plate 16a),
but the extent and pattern of chlorosis is variable: it
may be uniform (Plates 16a & b), or diffusely
interveinal, fading gradually with distance from the
main veins (Plates 16d & h). In other cases it may be
a less distinct interveinal mottle (Plate 16c). Leaves
may become puckered (slightly raised in interveinal
zones) and the tip and lateral lobes may curl under
(Plates 16b, c & e). Petioles may twist. Internodes
may be shortened, producing a compact habit
around the apex (Plate 16c). In severe cases, the leaf
veins may appear callused or overgrown with rough,
whitish or pink tissue (Plate 16d). Deeply lobed
cultivars may display reduced development of the
lateral lobes (Plate 16d).
At greater severity, B deficiency causes death of
the growing points (Plate 16e) The dominant tip is
usually the first affected, but the axillary buds also
become necrotic.
Fibrous roots of B-deficient sweet potato plants
become short, stumpy and highly branched (Plate
16t), producing the coralline structures typical of B
deficiency in many plant species.
Storage roots are often short and blunt-ended
(Plate 16g), and may split and overgrow, producing
cankers and deformities (Plate 16h) (Willis 1943;
von Stieglitz and Chippendale 1955). The skin may
be rough and may wrinkle towards the ends. The cut
root exudes less white sap than normal, and the
flesh may be mottled or corky in places (Plate 16i).
97
Orange-fleshed roots are generally paler than
normal. The flavour is less sweet, or even bitter.
Nusbaum (1946) reported irregular thickening of
roots, resulting in dumbbell and spindle shapes.
Other disorders reported to be associated with B
deficiency are 'internal brown spot' (Nusbaum
1946) and 'sweet potato blister' (Miller and Nielsen
1970). Internal brown spot is characterised by the
occurrence of brown necrotic areas in the flesh,
irregularly distributed but more prevalent in the
cambial zone, close to the surface of the root. Sweet
potato blister refers to raised dark spots which
develop on the skin of some cultivars following a
period of storage, and may be sparsely scattered or
numerous, covering a large proportion of the root
surface.
Storage root development may be greatly
reduced or completely inhibited by severe B
deficiency (Pillai et al. 1986)
Possible confusion with other symptoms
Calcium deficiency may also result in the death
of shoot and root tips. However, in the case of Ca
deficiency, young leaves below the shoot tip are not
thickened but develop a necrosis which spreads
from the lateral margins.
Mites may also cause thickening and deformities
on young leaves. They generally do not cause tip
death, and may have a more scattered or patchy
occurrence in the crop.
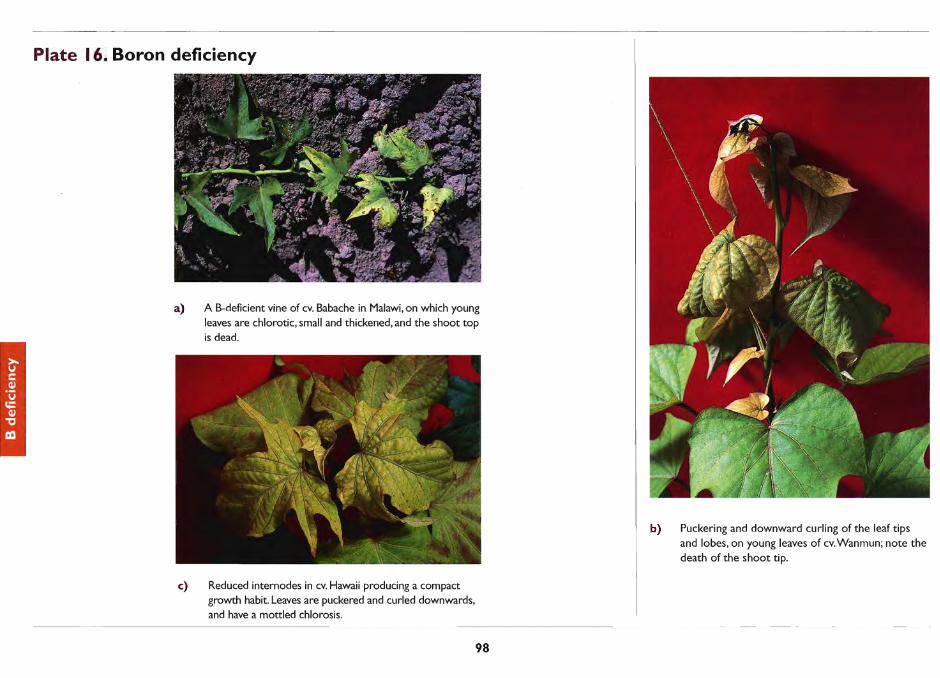
Plate 16. Boron deficiency
a) A B-deficient vine of cv. Babache in Malawi, on which young leaves are chlorotic, small and thickened, and the shoot top is dead.
c) Reduced internodes in cv. Hawaii producing a compact growth habit. Leaves are puckered and curled downwards, and have a mottled chlorosis.
98
b) Puckering and downward curling of the leaf tips and lobes, on young leaves of cv.Wanmun; note the death of the shoot tip.
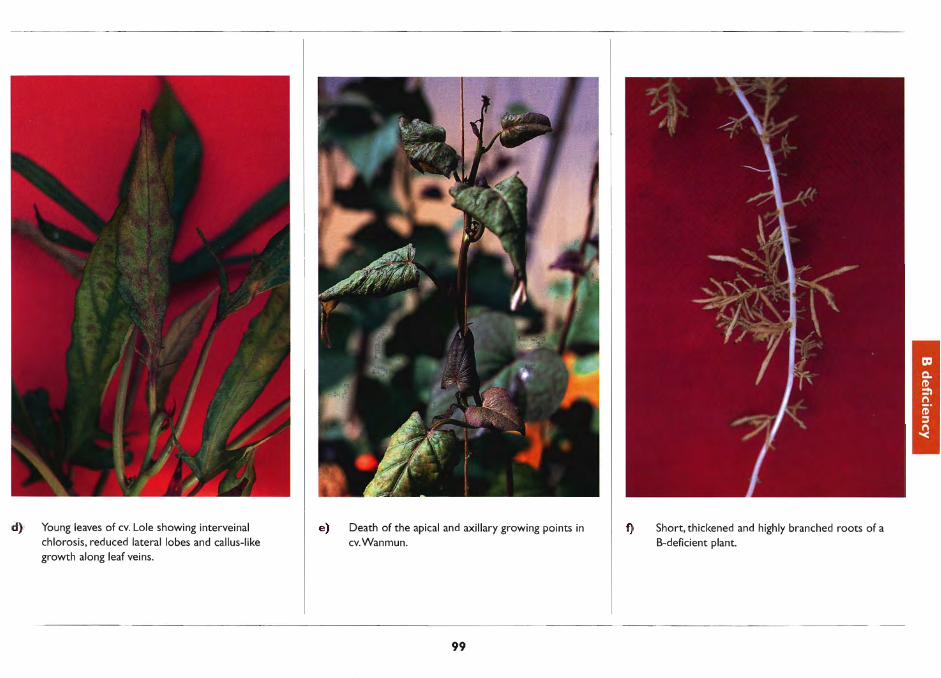
d) Young leaves of cv. Lole showing interveinal chlorosis, reduced lateral lobes and callus-like growth along leaf veins.
e) Death of the apical and axillary growing points in cv.Wanmun.
99
f) Short, thickened and highly branched roots of a B-deficient plant.
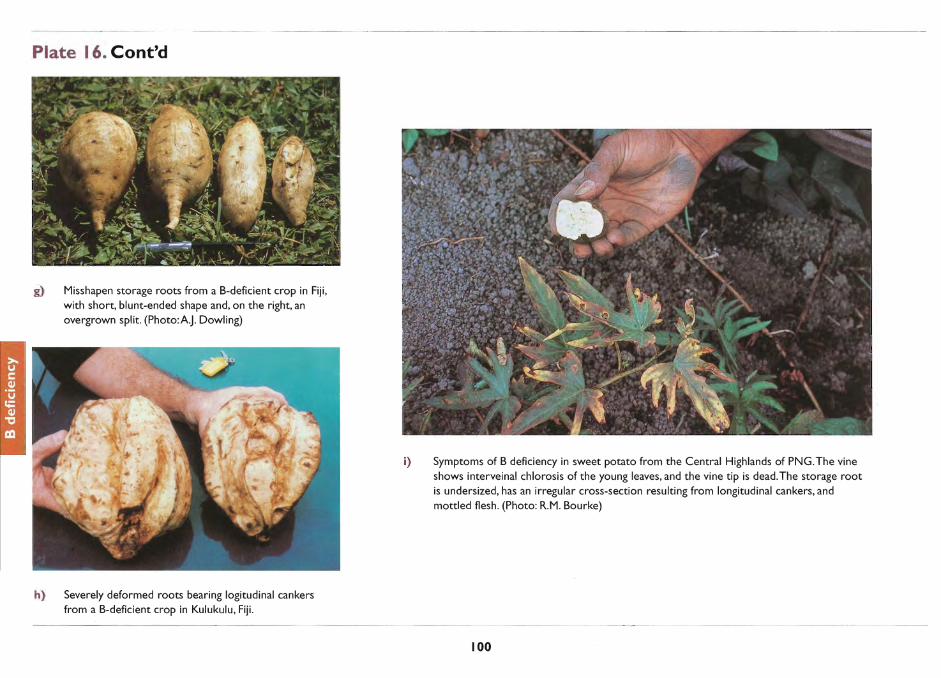
Plate 16. Cont'd
g) Misshapen storage roots from a B-deficient crop in Fiji, with short, blunt-ended shape and, on the right, an overgrown split. (Photo:A.J. Dowling)
h) Severely deformed roots bearing logitudinal cankers from a B-deficient crop in Kulukulu, Fiji.
i) Symptoms of B deficiency in sweet potato from the Central Highlands of PNG.The vine shows interveinal chlorosis of the young leaves, and the vine tip is dead. The storage root is undersized, has an irregular cross-section resulting from longitudinal cankers, and mottled flesh. (Photo: R.M. Bourke)
100

Diagnostic soil and plant tissue tests
A critical concentration of 40 mg B/kg in the 7th
to 9th youngest leaf blades was determined in
solution culture studies using cv. Wanmun (Table 3).
This seems to coincide well with field observations
on a wide range of cultivars.
With regard to soil analyses, the relationship
between hot water extractable Band B deficiency is
modified by a number of factors including soil
texture, pH and available Ca. There is no published
information on soil B in relation to B deficiency in
sweet potato. Critical concentrations quoted in the
literature for a wide range of crops mostly lie in the
range 0.3--0.5 mg/kg hot water extractable B, but
may be up to 1 mg/kg for susceptible species such
as beet, and may be higher in alkaline soils than in
acid soils (Bradford 1966).
Correction of boron deficiency
Boron deficiency can be corrected by fertilising
with borax or other borates (e.g. 'Solubor') applied
to the soil before planting. Recommended rates are
1-1.5 kg B/ha on sandy, acid soils, or up to 4 kg
B/ha on clayey, alkaline soils (von Stieglitz and
Chippendale 1955). Overfertilization may result in
B toxicity, so it is best to aim for the lowest
effective rate, which may be further reduced on
subsequent crops.
Foliar application of B is often recommended for
other crops, but appears to give a poor response in
sweet potato. Boron is not transported within the
plant from vines to roots, and while the tops may
appear healthy after foliar spraying, symptoms
persist on the storage roots.
101
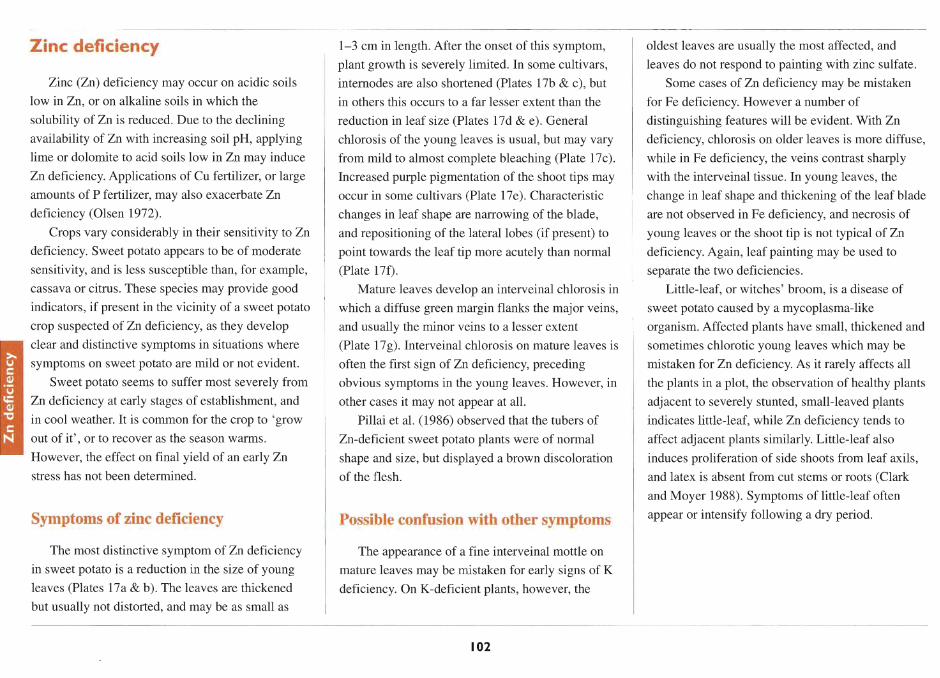
Zinc deficiency
Zinc (Zn) deficiency may occur on acidic soils
low in Zn, or on alkaline soils in which the
solubility of Zn is reduced. Due to the declining
availability of Zn with increasing soil pH, applying
lime or dolomite to acid soils low in Zn may induce
Zn deficiency. Applications of Cu fertilizer, or large
amounts of P fertilizer, may also exacerbate Zn
deficiency (Olsen 1972).
Crops vary considerably in their sensitivity to Zn
deficiency. Sweet potato appears to be of moderate
sensitivity, and is less susceptible than, for example,
cassava or citrus. These species may provide good
indicators, if present in the vicinity of a sweet potato
crop suspected of Zn deficiency, as they develop
clear and distinctive symptoms in situations where
symptoms on sweet potato are mild or not evident.
Sweet potato seems to suffer most severely from
Zn deficiency at early stages of establishment, and
in cool weather. It is common for the crop to 'grow
out of it' , or to recover as the season warms.
However, the effect on final yield of an early Zn
stress has not been determined.
Symptoms of zinc deficiency
The most distinctive symptom of Zn deficiency
in sweet potato is a reduction in the size of young
leaves (Plates 17a & b). The leaves are thickened
but usually not distorted, and may be as small as
1-3 cm in length. After the onset of this symptom,
plant growth is severely limited. In some cultivars,
internodes are also shortened (Plates 17b & c), but
in others this occurs to a far lesser extent than the
reduction in leaf size (Plates 17d & e). General
chlorosis of the young leaves is usual, but may vary
from mild to almost complete bleaching (Plate 17c).
Increased purple pigmentation of the shoot tips may
occur in some cultivars (Plate 17e). Characteristic
changes in leaf shape are narrowing of the blade,
and repositioning of the lateral lobes (if present) to
point towards the leaf tip more acutely than normal
(Plate 17f).
Mature leaves develop an interveinal chlorosis in
which a diffuse green margin flanks the major veins,
and usually the minor veins to a lesser extent
(Plate 17g). Interveinal chlorosis on mature leaves is
often the first sign of Zn deficiency, preceding
obvious symptoms in the young leaves. However, in
other cases it may not appear at all.
Pillai et al. (1986) observed that the tubers of
Zn-deficient sweet potato plants were of normal
shape and size, but displayed a brown discoloration
of the flesh.
Possible confusion with other symptoms
The appearance of a fine interveinal mottle on
mature leaves may be mistaken for early signs of K
deficiency. On K-deficient plants, however, the
102
oldest leaves are usually the most affected, and
leaves do not respond to painting with zinc sulfate.
Some cases of Zn deficiency may be mistaken
for Fe deficiency. However a number of
distinguishing features will be evident. With Zn
deficiency, chlorosis on older leaves is more diffuse,
while in Fe deficiency, the veins contrast sharply
with the interveinal tissue. In young leaves, the
change in leaf shape and thickening of the leaf blade
are not observed in Fe deficiency, and necrosis of
young leaves or the shoot tip is not typical of Zn
deficiency. Again, leaf painting may be used to
separate the two deficiencies.
Little-leaf, or witches' broom, is a disease of
sweet potato caused by a mycoplasma-like
organism. Affected plants have small, thickened and
sometimes chlorotic young leaves which may be
mistaken for Zn deficiency. As it rarely affects all
the plants in a plot, the observation of healthy plants
adjacent to severely stunted, small-leaved plants
indicates little-leaf, while Zn deficiency tends to
affect adjacent plants similarly. Little-leaf also
induces proliferation of side shoots from leafaxils,
and latex is absent from cut stems or roots (Clark
and Moyer 1988). Symptoms of little-leaf often
appear or intensify following a dry period.
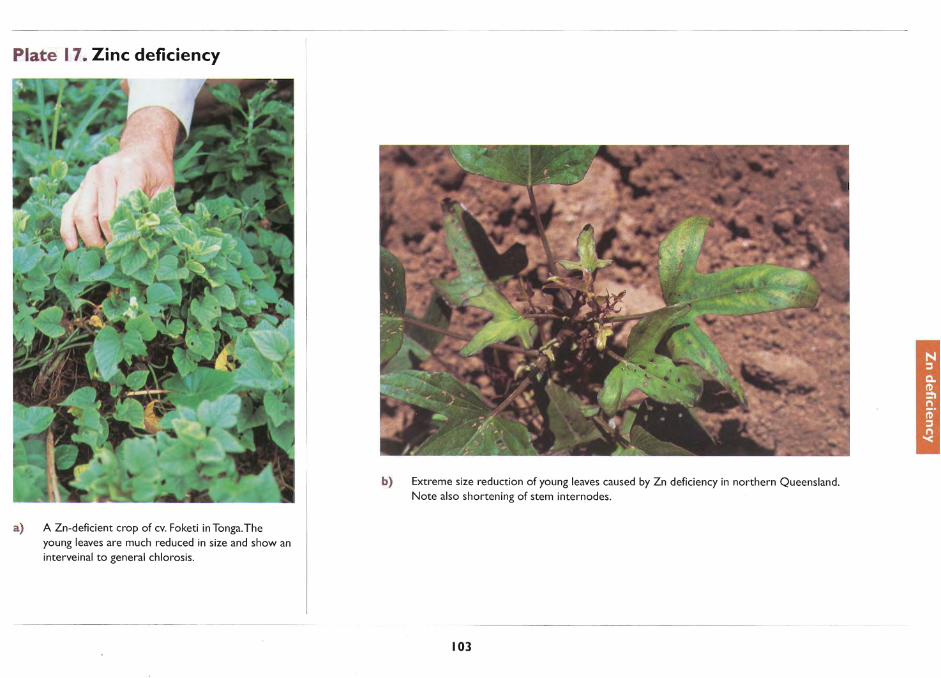
Plate 17. Zinc deficiency
a) A Zn-deficient crop of cv. Foketi in Tonga.The young leaves are much reduced in size and show an interveinal to general chlorosis.
b) Extreme size reduction of young leaves caused by Zn deficiency in northern Queensland. Note also shortening of stem internodes.
103
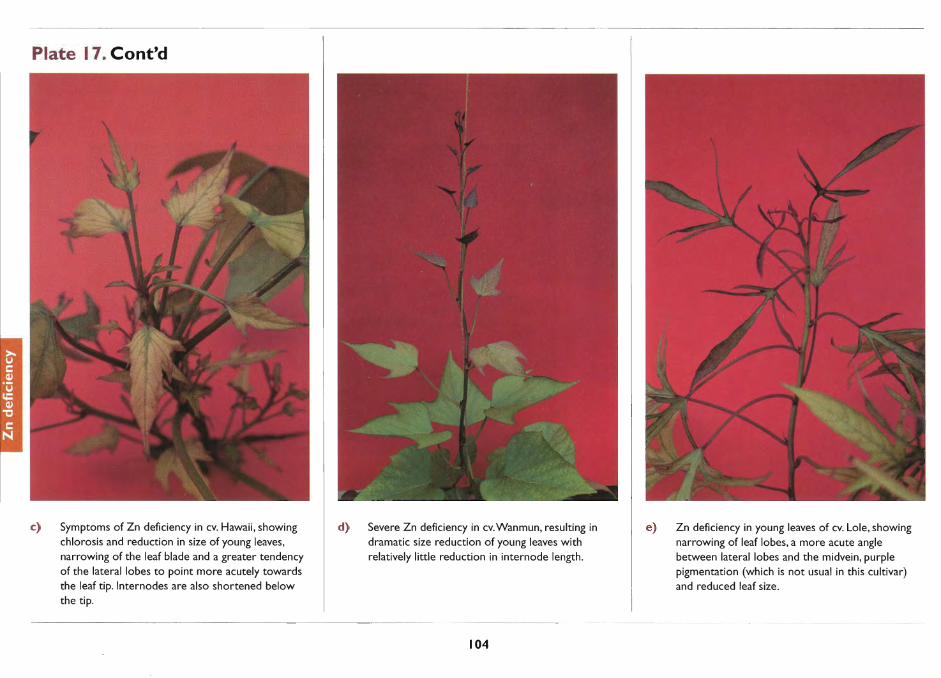
Plate I 7. Cont'd
c) Symptoms of Zn deficiency in cv. Hawaii, showing chlorosis and reduction in size of young leaves, narrowing of the leaf blade and a greater tendency of the lateral lobes to point more acutely towards the leaf tip. Internodes are also shortened below the tip.
d) Severe Zn deficiency in cv.Wanmun, resulting in dramatic size reduction of young leaves with relatively little reduction in internode length.
104
e) Zn deficiency in young leaves of cv. Lole, showing narrowing of leaf lobes, a more acute angle between lateral lobes and the midvein, purple pigmentation (which is not usual in this cultivar) and reduced leaf size.
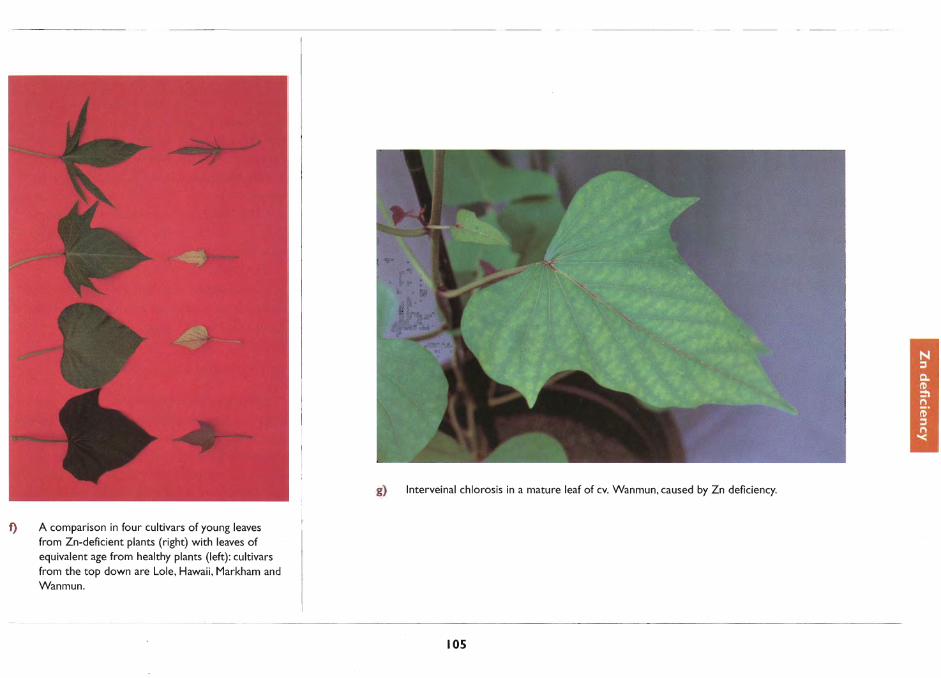
f) A comparison in four cultivars of young leaves from Zn-deficient plants (right) with leaves of equivalent age from healthy plants (left): cultivars from the top down are Lole, Hawaii, Markham and Wanmun.
g) Interveinal chlorosis in a mature leaf of cv. Wanmun, caused by Zn deficiency.
105
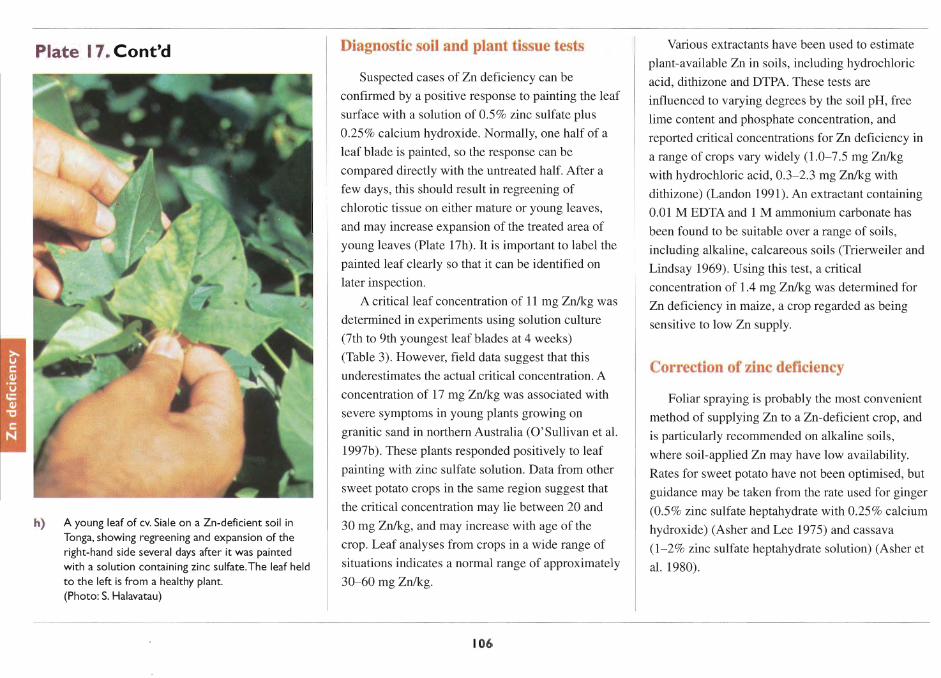
Plate I 7. Cont'd
h) A young leaf of cv. Siale on a Zn-deficient soil in Tonga, showing regreening and expansion of the right-hand side several days after it was painted with a solution containing zinc sulfate. The leaf held to the left is from a healthy plant. (Photo: S. Halavatau)
Diagnostic soil and plant tissue tests
Suspected cases of Zn deficiency can be
confirmed by a positive response to painting the leaf
surface with a solution of 0.5% zinc sulfate plus
0.25% calcium hydroxide. Normally, one half of a
leaf blade is painted, so the response can be
compared directly with the untreated half. After a
few days, this should result in regreening of
chlorotic tissue on either mature or young leaves,
and may increase expansion of the treated area of
young leaves (Plate 17h). It is important to label the
painted leaf clearly so that it can be identified on
later inspection.
A critical leaf concentration of 11 mg Zn/kg was
determined in experiments using solution culture
(7th to 9th youngest leaf blades at 4 weeks)
(Table 3). However, field data suggest that this
underestimates the actual critical concentration. A
concentration of 17 mg Zn/kg was associated with
severe symptoms in young plants growing on
granitic sand in northern Australia (0' Sullivan et al.
1997b). These plants responded positively to leaf
painting with zinc sulfate solution. Data from other
sweet potato crops in the same region suggest that
the critical concentration may lie between 20 and
30 mg Zn/kg, and may increase with age of the
crop. Leaf analyses from crops in a wide range of
situations indicates a normal range of approximately
30-60 mg Zn/kg.
106
Various extractants have been used to estimate
plant-available Zn in soils, including hydrochloric
acid, dithizone and DTPA. These tests are
influenced to varying degrees by the soil pH, free
lime content and phosphate concentration, and
reported critical concentrations for Zn deficiency in
a range of crops vary widely (1.0-7.5 mg Zn/kg
with hydrochloric acid, 0.3-2.3 mg Zn/kg with
dithizone) (Landon 1991). An extractant containing
0.01 M EDTA and 1 M ammonium carbonate has
been found to be suitable over a range of soils,
including alkaline, calcareous soils (Trierweiler and
Lindsay 1969). Using this test, a critical
concentration of 1.4 mg Zn/kg was determined for
Zn deficiency in maize, a crop regarded as being
sensitive to low Zn supply.
Correction of zinc deficiency
Foliar spraying is probably the most convenient
method of supplying Zn to a Zn-deficient crop, and
is particularly recommended on alkaline soils,
where soil-applied Zn may have low availability.
Rates for sweet potato have not been optimised, but
guidance may be taken from the rate used for ginger
(0.5% zinc sulfate heptahydrate with 0.25% calcium
hydroxide) (Asher and Lee 1975) and cassava
(1-2% zinc sulfate heptahydrate solution) (Asher et
al. 1980).

On neutral and acid soils where Zn deficiency is
known to occur, soil application at or before
planting is likely to be more effective than foliar
sprays after crop establishment (Weir and Cresswell
1993). Soil application rates of 3-10 kg ZnJha as
zinc sulfate heptahydrate (23% Zn) or zinc oxide
(60- 80% Zn) are typical for vegetable crops. The
lesser amount may suffice on light-textured acidic
soils, whereas clayey or alkaline soils may require
the higher amount. Zinc oxide should be broadcast
and incorporated into the soil before planting. Zinc
sulfate heptahydrate is more soluble, and band
application at the time of planting is acceptable.
Zinc applications may be effective for several years.
Prevention of Zn deficiency during
establishment of cassava has been achieved by
dipping the cuttings in 2-4% zinc sulfate solution
for 15 minutes prior to planting (Asher et al. 1980).
A similar strategy may be effective with sweet
potato cuttings.
Burying small pieces of scrap galvanised iron in
the mound or ridge may provide an effective source
of Zn to the crop. This is a particularly useful
strategy where Zn fertilizers are not available or are
poorly effective due to high alkalinity of the soil.
Maintenance of a high soil organic matter
content increases the availability of Zn to plants
(Chapman 1966).
107
Disorders Producing No Specific Leaf Symptoms
Aluminium toxicity
Aluminium (AI) toxicity is the most common
cause of growth reduction on strongly acid soils.
Aluminium is the most abundant metal in the earth's
crust, but its solubility at neutral to alkaline pH is
very low. However, below about pH 5.0 (measured
in water), Al solubility increases rapidly and may
reach toxic concentrations. Solution culture
experiments have shown that sweet potato will grow
normally at pH values as low as 4.0 in the absence
of Al (Ila'ava et al. 1996). Therefore, in the field,
sweet potato crops probably encounter problems of
Al toxicity before suffering any direct effects of low
pH.
Sweet potato is considered to be moderately
tolerant of AI. In solution culture experiments, some
cultivars showed no reduction in root growth at
25 I-lM AI, while 50 I-lM Al caused an average of
40% root growth reduction (Ila'ava et al. 1996).
Aluminium-sensitive species may suffer severe root
growth reduction at concentrations of 10 I-lM Al or
less (Blamey et al. 1986). Sweet potato was found
to be more tolerant of soil acidity than taro, yam,
tobacco, maize, green bean or soybean, but less
tolerant than cassava (Abruna et al. 1979; Abruna
Rodriguez et al. 1982).
Symptoms of aluminium toxicity
The primary effect of Al toxicity is to reduce
root development (Plate 18a). Roots appear short
and thickened, with short laterals, and may be
discoloured yellow to brown. Root hair
development is suppressed. Where the Al
concentration increases with soil depth, the
downward extension of the roots may be restricted,
resulting in a very shallow root system.
In addition to poor growth and stunted
appearance (Plate 18b), a number of symptoms may
appear in the tops as a result of poor root
development, depending on which secondary factor
is most limiting. Symptoms of water stress are
common. As Al in the soil solution inhibits the
uptake of Ca and Mg by roots, symptoms of Ca or
Mg deficiency may develop. In addition, the
solubility of P is reduced in the presence of high
concentrations of AI, so that P deficiency is often
associated with Al toxicity (Plate 18c).
Possible confusion with other symptoms
As mentioned above, Al toxicity is often
associated with the expression of other nutritional
disorders, such as a deficiency of Ca, Mg or P.
109
Carefully uprooting plants may reveal a root system
of limited extent, and brown in appearance.
Diagnostic soil and plant tissue tests
Aluminium toxicity is best diagnosed by testing
the soil. Soils with a pH below 5.0 (measured in 1:5
soil:water) are at risk of Al toxicity, and in soils
below pH 4.5 (other than organic soils), Al is likely
to severely reduce sweet potato production.
Tests for exchangeable Al and Al saturation may
be useful. Abruna et al. (1979) found that Al
saturation correlated well with the response of sweet
potato yields to liming on several tropical oxisols
and ultisols, with the greatest beneficial effect of
lime on those soils with greater than 60% Al
saturation. Liming a soil with 35% Al saturation
resulted in only a 10% yield increase. Ila'ava et ai.
(1996) demonstrated that the tolerance of sweet
potato to solution Al is greatly increased in the
presence of high concentrations of Ca, and it may be
necessary to take Ca availability into account when
using soil tests to predict crop response to AI.
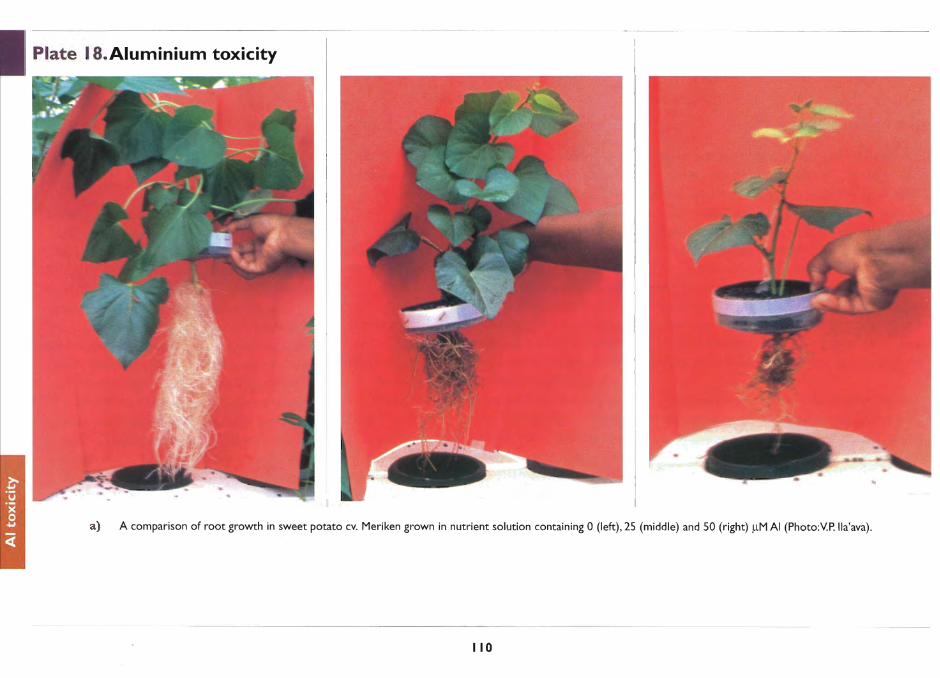
I Plate IS.Aluminium toxicity
a) A comparison of root growth in sweet potato cv. Meriken grown in nutrient solution containing 0 (left), 25 (middle) and 50 (right) 11M AI (Photo:Y.P. Ila'ava).
110

b) Severely stunted sweet potato plants on an acid soil in Kabale, Uganda. (Photo:J. Low)
c) Stunting accompanied by symptoms of severe P deficiency on sweet potato grown on an acid soil in Kabale, Uganda. (Photo: J. Low)
III
Correction of aluminium toxicity
Correction requires elevation of the soil pH, through the incorporation of lime or dolomite into
the soil. In addition, maintenance of high soil
organic matter levels through the return of crop
residues, cover cropping, or mulching will help as
components in the organic matter are capable of
binding free Al into non-toxic complexes. Organic
matter also helps to slow the rate of acidification of
the soil, which may result from sequential cropping.
Choosing nitrate fertilizers instead of urea or
ammonium fertilizers may also reduce acidification.
Phosphate forms insoluble complexes with AI.
Some of the beneficial effect of adding P fertilizers
to acidic volcanic ash soils appears to result from
decreasing solution Al concentrations.
Sweet potato cultivars have been shown to vary
in their tolerance to high concentrations of Al
(Munn and McCollum 1976; Sangalang and
Bouwkamp 1988; Ritchey et al. 1991; Ila'ava et al.
1996), and there is scope for the selection of
cultivars which yield well under acid soil
conditions. A rapid selection technique, measuring
root length of cuttings grown for a few days in a
solution containing AI, correlated well with Al
tolerance in the field (Ritchey et al. 1991).
Sangalang and Bouwkamp (1988), in a study
involving 379 sweet potato genotypes, found that
AI-tolerant clones yielded less than AI-sensitive
ones in nonstressed conditions. In contrast, Ritchey
et al. (1991) found differences in Al tolerance
among a selection of high-yielding genotypes,
suggesting that it is possible to breed for some
degree of tolerance without loss of yield potential.
112
Foliar Symptoms Produced by Pathogens and Pests
A number of pathogenic agents, including
viruses, fungi and mycoplasma-like organisms, may
cause abnormalities on the foliage of sweet potato,
which could be confused with symptoms of
nutritional disorders. It is not intended in this
section to give a full description of all such
disorders, but only to help users to determine
whether the symptoms they observe are due to a
nutritional disorder or a pathogenic agent. Clark and
Moyer (1988) have provided a detailed description
of pathogenic diseases of sweet potato.
Viruses
Sweet potato feathery mottle virus (SPFMV) is a
widespread and serious pathogen of sweet potato,
which is transmitted by aphids. Yield losses of
12-25% have been reported due to SPFMV alone,
and losses up to 90% have been attributed to co
infection by SPFMV and a whitefly-transmitted
virus (Pan 1996). SPFMV typically produces pale
green chlorotic spots (2- 8 mm) mainly on older
leaves, which may be bordered by a zone of purple
pigmentation (Plate 19a and b). In some cases,
purpling may spread over most of the leaf blade, the
chlorotic spots appearing as islands in it. SPFMV
may also cause vein clearing, or 'feathering', but a
number of other viruses also produce this symptom.
Disorders of the storage root including 'russet crack'
and 'internal cork' are also induced by some strains
of SPFMV in susceptible cultivars (Clark and
Moyer 1988; Skoglund and Smit 1994).
While P deficiency in sweet potato may also
induce purpling of leaves with cleared chlorotic
spots, the two disorders should be easily
distinguished. Lesions caused by SPFMV are
randomly scattered over the leaf blade, and are not
restricted to the oldest leaves on the vine.
Symptoms of SPFMV do not progress to cause
necrotic lesions, or general chlorosis with the
appearance of orange and red leaf colours, as seen
in P deficiency.
A number of other viruses of sweet potato have
been described, including sweet potato mild mottle
virus (SPMMV), sweet potato chlorotic stunt virus
(SPCSV) and sweet potato caulimovirus (SPCV),
each of which has a limited geographic range (Clark
and Moyer 1988). Several are transmitted by the
whitefly Bemisia tabaci. Symptoms include
stunting, mottled chlorosis, vein clearing and leaf
distortion.
113
Mycoplasma-like organisms
Sweet potato little-leaf disease (also known as
witches' broom and ishuku-byo) is caused by a
mycoplasma-like organism, which invades the
vascular system of the plant. Symptoms often
become more apparent after a dry spell. It causes a
marked reduction in leaf size and a general or
mottled chlorosis of the leaves, together with
increased branching producing a dense, bushy habit.
Cut stems and roots exude no latex sap. It is usually
easily recognised, as it will not affect all the plants
in a field simultaneously, so that stunted, small
leafed plants appear conspicuously beside healthy
plants (Plate 19c). In contrast, disorders such as Zn
deficiency, which also cause reduction in leaf size,
will tend to affect nearby plants to a similar extent.
Little-leaf disease may be transmitted by several
species of leafhopper. It has a long incubation
period in sweet potato before symptoms appear, and
so is easily transferred in planting material, either in
infected vines or in the eggs of infected leafhoppers.
It is best controlled by removing and destroying
affected plants as they appear, and by choosing
planting material from crops with a minimal
incidence of the disease.
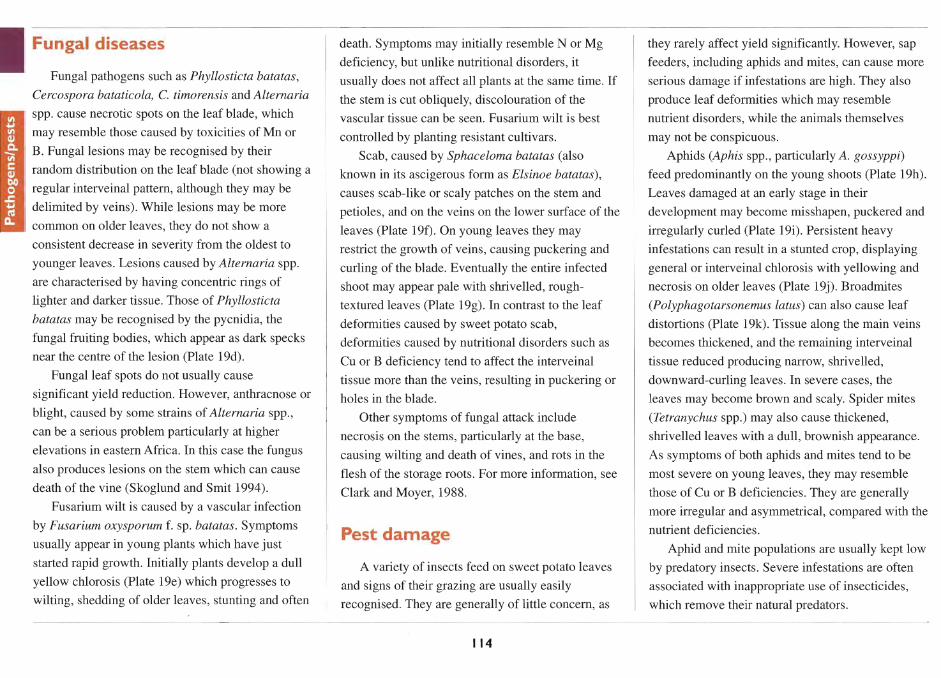
I Fungal diseases
Fungal pathogens such as Phyllosticta batatas,
Cercospora bataticola, C. timorensis and Alternaria
spp. cause necrotic spots on the leaf blade, which
may resemble those caused by toxicities of Mn or
B. Fungal lesions may be recognised by their
random distribution on the leaf blade (not showing a
regular interveinal pattern, although they may be
delimited by veins). While lesions may be more
common on older leaves, they do not show a
consistent decrease in severity from the oldest to
younger leaves. Lesions caused by Alternaria spp.
are characterised by having concentric rings of
lighter and darker tissue. Those of Phyllosticta
batatas may be recognised by the pycnidia, the
fungal fruiting bodies, which appear as dark specks
near the centre of the lesion (Plate 19d).
Fungal leaf spots do not usually cause
significant yield reduction. However, anthracnose or
blight, caused by some strains of Alternaria spp.,
can be a serious problem particularly at higher
elevations in eastern Africa. In this case the fungus
also produces lesions on the stem which can cause
death of the vine (Skoglund and Smit 1994).
Fusarium wilt is caused by a vascular infection
by Fusarium oxysporum f. sp. batatas. Symptoms
usually appear in young plants which have just
started rapid growth. Initially plants develop a dull
yellow chlorosis (Plate 1ge) which progresses to
wilting, shedding of older leaves, stunting and often
death. Symptoms may initially resemble N or Mg
deficiency, but unlike nutritional disorders, it
usually does not affect all plants at the same time. If
the stem is cut obliquely, discolouration of the
vascular tissue can be seen. Fusarium wilt is best
controlled by planting resistant cultivars.
Scab, caused by Sphaceloma batatas (also
known in its ascigerous form as Elsinoe batatas),
causes scab-like or scaly patches on the stem and
petioles, and on the veins on the lower surface of the
leaves (Plate 19f). On young leaves they may
restrict the growth of veins, causing puckering and
curling of the blade. Eventually the entire infected
shoot may appear pale with shrivelled, rough
textured leaves (Plate 199). In contrast to the leaf
deformities caused by sweet potato scab,
deformities caused by nutritional disorders such as
Cu or B deficiency tend to affect the interveinal
tissue more than the veins, resulting in puckering or
holes in the blade.
Other symptoms of fungal attack include
necrosis on the stems, particularly at the base,
causing wilting and death of vines, and rots in the
flesh of the storage roots. For more information, see
Clark and Moyer, 1988.
Pest damage
A variety of insects feed on sweet potato leaves
and signs of their grazing are usually easily
recognised. They are generally of little concern, as
114
they rarely affect yield significantly. However, sap
feeders, including aphids and mites, can cause more
serious damage if infestations are high. They also
produce leaf deformities which may resemble
nutrient disorders, while the animals themselves
may not be conspicuous.
Aphids (Aphis spp., particularly A. gossyppi)
feed predominantly on the young shoots (Plate 19h).
Leaves damaged at an early stage in their
development may become misshapen, puckered and
irregularly curled (Plate 19i). Persistent heavy
infestations can result in a stunted crop, displaying
general or interveinal chlorosis with yellowing and
necrosis on older leaves (Plate 19j). Broadmites
(Polyphagotarsonemus latus) can also cause leaf
distortions (Plate 19k). Tissue along the main veins
becomes thickened, and the remaining interveinal
tissue reduced producing narrow, shrivelled,
downward-curling leaves. In severe cases, the
leaves may become brown and scaly. Spider mites
(Tetranychus spp.) may also cause thickened,
shrivelled leaves with a dull, brownish appearance.
As symptoms of both aphids and mites tend to be
most severe on young leaves, they may resemble
those of Cu or B deficiencies. They are generally
more irregular and asymmetrical, compared with the
nutrient deficiencies.
Aphid and mite populations are usually kept low
by predatory insects. Severe infestations are often
associated with inappropriate use of insecticides,
which remove their natural predators.
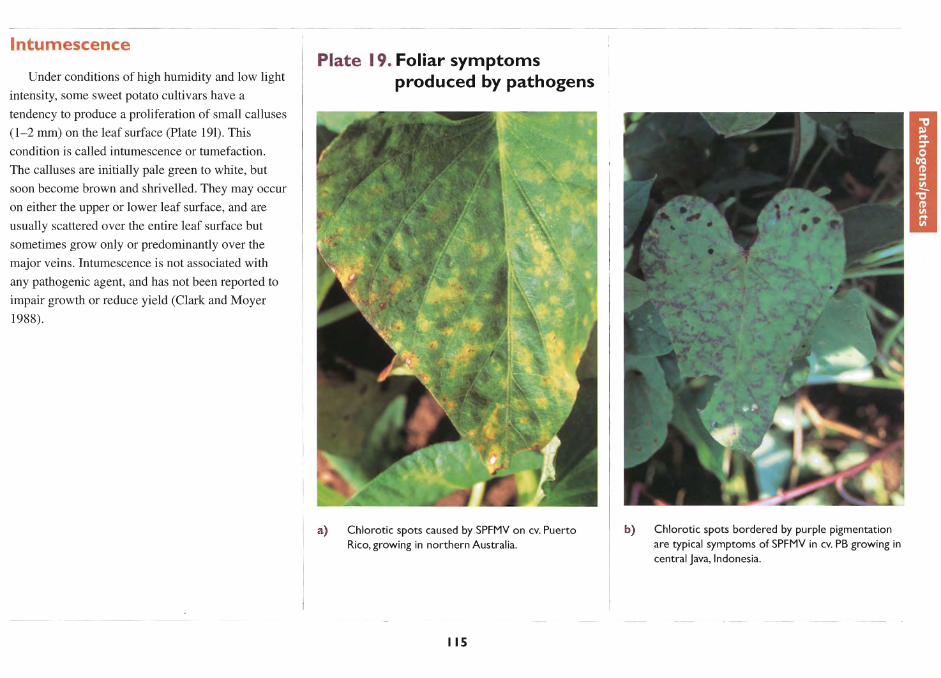
Intumescence
Under conditions of high humidity and low light
intensity, some sweet potato cultivars have a
tendency to produce a proliferation of small calluses
(1-2 mrn) on the leaf surface (Plate 191). This
condition is called intumescence or tumefaction.
The calluses are initially pale green to white, but
soon become brown and shrivelled. They may occur
on either the upper or lower leaf surface, and are
usually scattered over the entire leaf surface but
sometimes grow only or predominantly over the
major veins. Intumescence is not associated with
any pathogenic agent, and has not been reported to
impair growth or reduce yield (Clark and Moyer
1988).
Plate 19. Foliar symptoms produced by pathogens
a) Chlorotic spots caused by SPFMV on cv. Puerto Rico, growing in northern Australia.
115
b) Chlorotic spots bordered by purple pigmentation are typical symptoms of SPFMV in cv. PB growing in central Java, Indonesia.
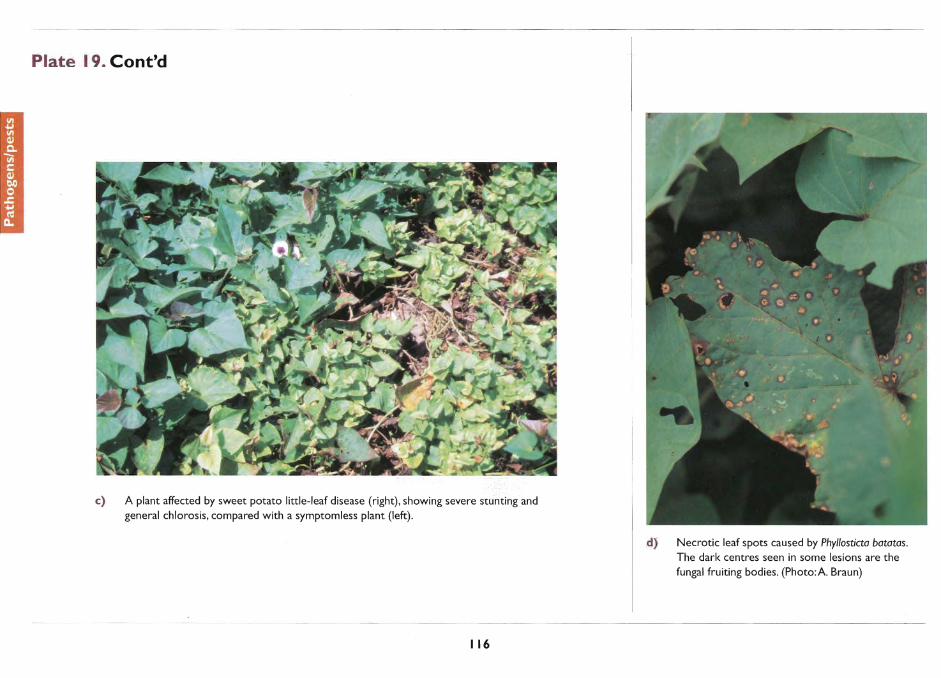
Plate 19. Cont'd
c) A plant affected by sweet potato little-leaf disease (right), showing severe stunting and general chlorosis, compared with a symptomless plant (left).
116
d) Necrotic leaf spots caused by Phyllosticta batatas. The dark centres seen in some lesions are the fungal fruiting bodies. (Photo: A Braun)
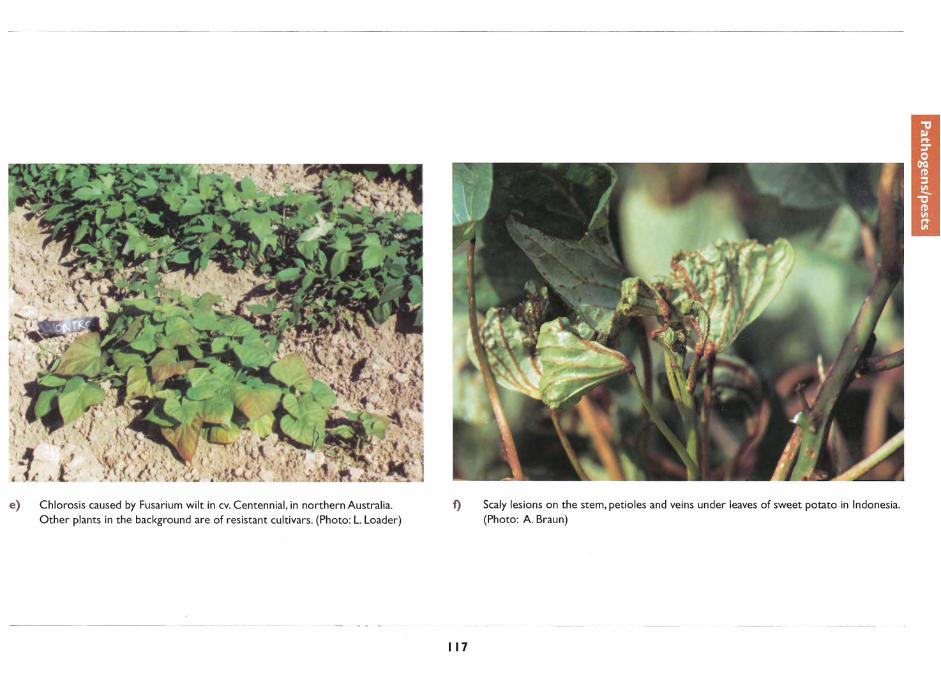
e) Chlorosis caused by Fusarium wilt in cv. Centennial, in northern Australia. Other plants in the background are of resistant cultivars. (Photo: L. Loader)
f)
117
Scaly lesions on the stem, petioles and veins under leaves of sweet potato in Indonesia. (Photo: A. Braun)
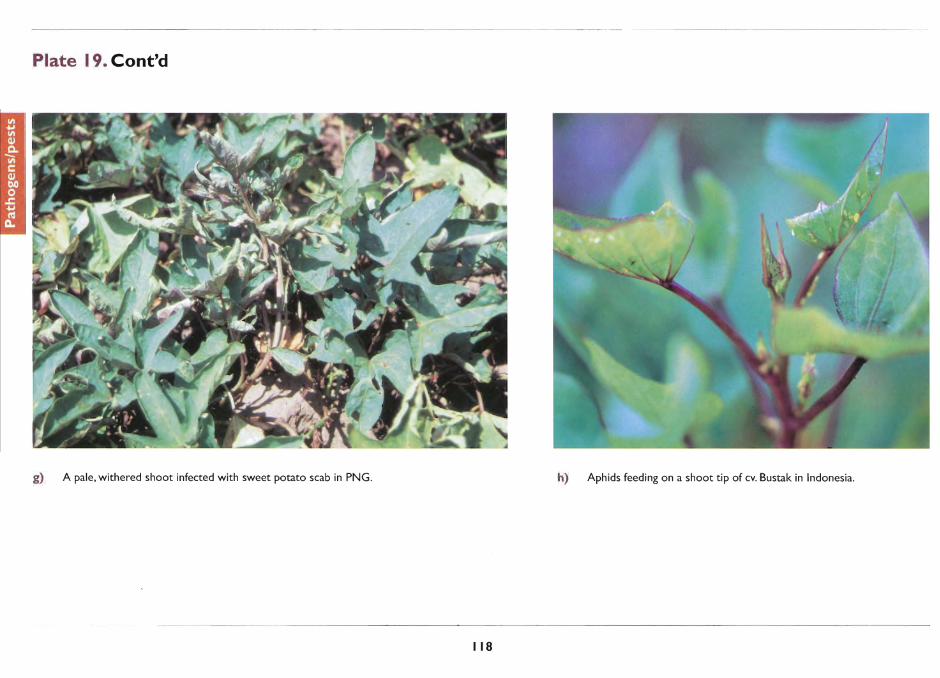
Plate 19. Cont'd
g) A pale, withered shoot infected with sweet potato scab in PNG. h) Aphids feeding on a shoot tip of cv. Bustak in Indonesia.
118
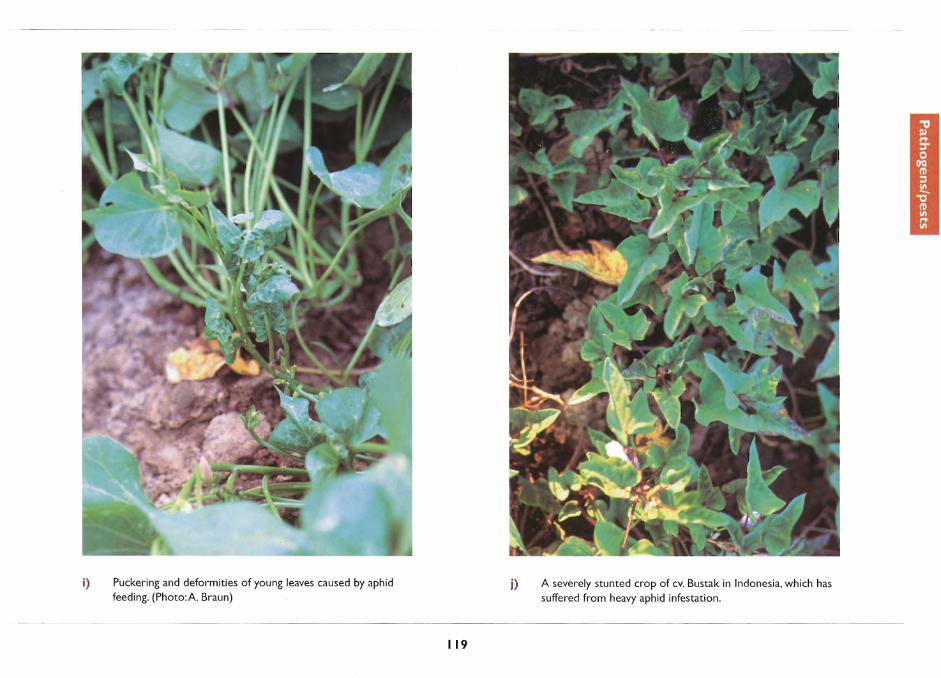
i) Puckering and deformities of young leaves caused by aphid feeding. (Photo:A. Braun)
119
j) A severely stunted crop of cv. Bustak in Indonesia, which has suffered from heavy aphid infestation.

Plate 19. Cont'd
k) Leaf distortions and thickening caused by broadmites on cy. Beerwah Gold.
I)
120
Intumescence on the lower surface of a leaf of cy. Beerwah
Gold, grown in humid conditions in a greenhouse.

I
Abruna, F, Vincente-Chandler, J., Rodriguez, J.,
Badillo, J. and Silva, S. 1979. Crop response to
soil acidity factors in ultisols and oxisols in
Puerto Rico. V. Sweet potato. Journal of the
Agricultural University of Puerto Rico, 63,
250-267.
Abruna-Rodriguez, F, Vincente-Chandler, J.,
Rivera, E. and Rodriguez, 1. 1982. Effect of soil
acidity factors on yields and foliar composition
of tropical root crops. Soil Science Society of
America Journal, 46, 1004-1007.
Alva, A.K., Graham, J.H. and Anderson, C.A. 1995.
Soil pH and copper effects on young 'Hamlin'
orange trees. Soil Science Society of America
Journal, 59, 481-487.
Asher, c.1., Edwards, D.G. and Howeler, R.H.
1980. Nutritional disorders of cassava.
Department of Agriculture, University of
Queensland, St. Lucia.
Asher, C.J. and Lee, M.T. 1975. Nutritional
disorders in ginger. Department of Agriculture,
University of Queensland, St. Lucia.
Bates, T.E. 1971. Factors affecting critical nutrient
concentrations in plants and their evaluation: A
review. Soil Science, 112, 116-130.
References
Bernstein, L. 1964. Salt tolerance of plants.
Agricultural Information Bulletin 283, USDA,
Washington DC.
Best, E.K., Manning, G.K. and Grundon, N.J. 1985.
The ability of several soil extractants to identify
copper-responsive wheat soils. Australian Journal
of Experimental Agriculture, 25, 863-868.
Bingham, FT. 1962. Chemical tests for available
phosphorus. Soil Science, 94, 87-95.
Blarney, FP'C., Grundon, N.J., Asher, C.J. and
Edwards, D.G. 1986. Aluminium toxicity in
sorghum and sunflower. In: Foale, M.A., and
Henzell, R.G., ed., Proceedings of the 1st
Australian Sorghum Conference. pp 6.11-6.18.
Blarney, FP.C., Edwards, D.G. and Asher, C.J.
1987. Nutritional Disorders of Sunflower.
Department of Agriculture, University of
Queensland, St Lucia. 72 p.
Blarney, FP.C., Vermeulen, W.J. and Chapman, J.
1984. Inheritance of boron status in sunflower.
Crop Science, 24, 43-46.
Bolle-Jones, E.W. and Ismunadji, M. 1963. Mineral
deficiency symptoms of the sweet potato.
Empire Journal of Experimental Agriculture, 31,
60-64.
121
Bourke, R.M. 1977a. A long term rotation trial in
New Britain, Papua New Guinea. In: Leaky,
c.L.A., ed., Proceedings of the Third Symposium
of the International Society for Tropical Root
Crops, Ibadan, Nigeria. pp 382-388.
- 1977b. Sweet potato (Ipomoea hatatas) fertilizer
trials on the Gazelle Peninsula of New Britain:
1954-1976. Papua New Guinea Agriculture
Journal, 28, 73-95.
- 1982. Sweet potato in Papua New Guinea. In:
Villareal, R.L. and Griggs, T.D., ed., Sweet
Potato: Proceedings of the First International
Symposium. Asian Vegetable Research and
Development Centre, Shanhua, Taiwan. pp 45-57.
- 1983. Crop micronutrient deficiencies in Papua
New Guinea. Technical Report 83/3, Department
of Primary Industry, Papua New Guinea.
- 1985a. Sweet potato production and research
in Papua New Guinea. Papua New Guinea
Journal of Agriculture, Forestry and Fisheries,
33,89-108.
- 1985b. Influence of nitrogen and potassium
fertilizer on growth of sweet potato (Ipomoea
hatatas) in Papua New Guinea. Field Crops
Research, 12, 363-375.
Bouwkamp, J.C. 1985. Production requirements. In:
Bouwkamp, J.c., ed., Sweet Potato Products: A
Natural Resource for the Tropics. Boca Raton,
Florida, CRC Press, 9-33.
Bradbury, lH. and Holloway, W.D. 1988.
Chemistry of tropical root crops: significance for
nutrition and agriculture in the Pacific. ACIAR
Monograph 6, Australian Centre for
International Agricultural Research.
Bradford, G.R. 1966. Boron. In: Chapman, H.D.,
ed., Diagnostic criteria for plants and soils.
Riverside, University of California, 33-61.
Cable, W.l 1992. Common nutrient deficiency
symptoms of crops of Tokelau and other coral
soils and their correction. Journal of South
Pacific Agriculture, 1(2),43-52.
CFL 1983. Soil Analysis Service Interpretation
Charts. Consolidated Fertilizers Limited,
Morningside, Queensland, Australia.
Chapman, H.D. 1966. Zinc. In: Chapman, H.D., ed.,
Diagnostic criteria for plants and soils. Dept of
Soils and Plant Nutrition, University of
California Citrus Research Centre and
Agricultural Experiment Station, Riverside,
California.
Chase, L.D.C. and Widdowson, J.P. 1983. Sulfur in
the agriculture of Pacific High Islands. In: Blair,
G.J. and Till, A.R., ed., Sulfur in South East
Asian and South Pacific agriculture.
Commonwealth of Australia. 206-217.
Chavez, R., Mendoza, H. and Espinoza, l 1995.
Breeding sweetpotato for adaptation to arid and
saline soils. International Potato Center (CIP)
Circular, August 1995, 2-7.
Clark, c.A. and Moyer, J.w. 1988. Compendium of
Sweet Potato Diseases. St. Paul, MN, USA,
American Phytopathological Society Press.
Clarke, W.c. 1973. A change of subsistence staple
in prehistoric New Guinea. In: Leaky, C.L.A.,
ed., Proceedings of the Third Symposium of the
International Society for Tropical Root Crops,
UTA, Ibadan Nigeria. 159-163.
Conroy, W.R. and Bridgland, L.A. 1950. Native
agriculture in Papua New Guinea. In: Hipsley,
E.H. and Clements, FW., ed., Report of the New
Guinea Nutrition Survey Expedition. Dept.
External Territories, Canberra, Australia. 72-91.
Constantin, R.J., Hernandez, T.P. and Jones, L.G.
1974. Effects of irrigation and nitrogen
fertilization on quality of sweet potatoes. Journal
of the American Society for Horticultural
Science, 99, 308.
Crossman, S.M. and Hill, W.A. 1987. Inoculation of
sweet potato with Azospirillum. HortScience, 22,
420-422.
122
de Geus, J.G. 1967. Fertilizer Guide for Tropical
and Subtropical Farming. Centre d'Etude de
l' Azote, Zurich.
de Vries, C.A., Ferwerda, J.D. and Flack, M. 1967.
Choice of food crops in relation to actual and
potential production in the tropics. Netherlands
Journal of Agricultural Science, 15,241-248.
Diem, K. ed., 1962. Documenta Geigy Scientific
Tables, Sixth Edition. Geigy Pharmaceuticals, St
Leonards, NSW, Australia.
Doll, E.C. and Lucas, R.E. 1973. Testing soils for
potassium, calcium and magnesium. In: Walsh,
L.M. and Beaton, J.D. ed., Soil Testing and Plant
Analysis, revised edition. Madison, USA, Soil
Science Society of America, Inc., 133-151.
Dowling, A.J., Blarney, FP.C. and Hoa, T. 1995.
Limitations to sweet potato growth in small
volumes of soil imposed by water and nutrient
stress, acidity and salinity. Papua New Guinea
Journal of Agriculture, Forestry and Fisheries,
38,3-10.
Dowling, A.J., Blarney, FP.C., O'Sullivan, IN.,
Asher, C.J. and Johnston, M. 1996. Pot
experimentation to study nutrient responses of
sweet potato in Papua New Guinea. In:
Craswel1, E.T. Asher, C.J. and O'Sullivan, J.N.,
ed., ACIAR Proceedings No. 65 : Mineral
nutrient disorders of root crops in the Pacific,
44-48.
Dowling, AJ., Konabe, B. and Tigat, R. 1994.
Nutritional assessment of steeply sloping soils
from Aiyura in the Eastern Highlands of Papua
New Guinea. Papua New Guinea Journal of
Agriculture, Forestry and Fisheries, 37(2), 23-29.
D'Souza, E. and Bourke, R.M. 1986a.
Intensification of subsistence agriculture on the
Nembi Plateau, Papua New Guinea 1. General
introduction and inorganic fertilizer trials. Papua
New Guinea Journal of Agriculture, Forestry and
Fisheries, 34, 19-28.
- 1986b. Intensification of subsistence agriculture
on the Nembi Plateau, Papua New Guinea 2.
Organic fertilizer trials. Papua New Guinea
Journal of Agriculture, Forestry and Fisheries,
34,29-39.
Edmond, lB. and Sefick, HJ. 1938. A description
of certain nutrient deficiency symptoms of the
Porto Rico sweetpotato. Proceedings of the
American Society for Horticultural Science, 36,
544-549.
FAO 1996. FAO Production Yearbook, 1995, Vol.
49, FAO Statistics Series No. 117. Rome, Food
and Agriculture Organization of the United
Nations.
Fisher, MJ. 1980. The influence of water stress on
nitrogen and phosphorus uptake and
concentration in Townsville stylo (Stylosanthes
humilis). Australian Journal of Experimental
Agriculture and Animal Husbandry, 20,l75-180.
Floyd, C.N., Lefroy, R.D.B. and D'Souza, EJ.
1988. Soil fertility and sweet potato production
on volcanic ash soils in the highlands of Papua
New Guinea. Field Crops Research, 19, 1-25.
Fox, R.L., Asghar, M. and Cable, WJ. 1983. Sulfate
accretions in soils of the tropics. In: Blair, G.J.
and Till, A.R., ed., Sulfur in South East Asian
and South Pacific agriculture. Commonwealth of
Australia. 39-53.
Fox, R.L., Hashimoto, R.K., Thompson, lR. and de
la Pen a, R.S. 1974. Comparative external
phosphorus requirements of plants growing in
the tropics. Tenth International Congress on Soil
Science (Moscow), 4, 232-239.
Fox, R.L. and Kamprath, EJ. 1970. Phosphate
sorption isotherms in evaluating the phosphate
requirements of soil. Soil Science Society of
America Proceedings, 34, 902-907.
Fujise, K. and Tsuno, Y. 1967. Effect of potassium on
the dry matter production of sweet potato. In:
Proceedings of the International Symposium on
Tropical Root Crops, Trinidad, Vol. I, pp 11-20--33.
Goodbody, S. and Humphreys, G.S. 1986. Soil
chemical status and the prediction of sweet
potato yields. Tropical Agriculture (Trinidad),
63,209-211.
123
Greig, lK. and Smith, FW 1961. Sweetpotato
growth, cation accumulation and carotene
content as affected by cation level in the growth
medium. Proceedings of the American Society
for Horticultural Science, 77, 463--472.
- 1962. Salinity effects on sweetpotato growth.
Agronomy Journal, 54, 309-313.
Halavatau, S., Asher, CJ. and Bell, L.c. 1996. Soil
fertility and sweet potato research in Tonga
Nitrogen and Phosphorus. In: Craswell, E.T.,
Asher, CJ. and O'Sullivan, J.N., ed., ACIAR
Proceedings No. 65: Mineral nutrient disorders
of root crops in the Pacific, 58-64.
Harvey, P.W. and Heywood, P.F 1983. Twenty-five
years of dietary changes in Simbu Province,
Papua New Guinea. Ecology of Food Nutrition,
13,27-35.
Heywood, P.F and Nikikus, M. 1982. Protein,
energy and nutrition in Papua New Guinea. In:
Bourke, R.M. and Kesavan, V. ed., Proceedings
of the Second Papua New Guinea Food Crops
Conference, Department of Primary Industry,
Port Moresby, 303-324.
Hill, WA. 1989. Sweet Potato. In: Plucknett, D.L.
and Spence, H.B ., ed., Detecting Mineral
Nutrient Deficiencies in Tropical and Temperate
Crops. Westview Tropical Agriculture Series,
No.7, l79-188, Westview Press, USA.
Hill, w.A. and Bacon, P. 1984. Fertilizer N use
efficiency and associative N2-fixation of sweet
potato. In: Proceedings of the Sixth Symposium
of the International Society for Tropical Root
Crops, International Potato Center (CIP), Lima,
Peru, 535-542.
Hill, W.A., Bacon-Hill, P., Crossman, S.M. and
Stevens, e. 1983. Characterization of N2-fixing
bacteria associated with sweet potato roots.
Canadian Journal of Microbiology, 29, 860-862.
Ila' ava, VP. 1997. Effects of soil acidity factors on
the growth of sweet potato cultivars. PhD thesis,
The University of Queensland, Australia.
Ila'ava, VP., Blarney, EP.e. and Asher, C.I. 1996.
Sensitivity of sweet potato lines to Ca and Al
stress in solution culture. In: Craswell, E.T.
Asher, C.J. and O'Sullivan, J.N. ed., ACIAR
Proceedings No. 65: Mineral nutrient disorders
of root crops in the Pacific, 53-57.
UTA (International Institute of Tropical Agriculture)
1992. Working with farmers in Cameroon and
Rwanda: new strategies to improve staple food
crops. UTA, Ibadan, Nigeria.
International Potato Center 1995. Program Report:
1993-1994. Lima, Peru, CIP, 50 p.
I vahupa, S. 1997. Sodium substitution of potassium
in tropical root crops. MAgrSc thesis, The
University of Queensland, Australia.
Jackson, D.e. 1972. Some preliminary results of
fertilizer trials with sweet potatoes (Ipomoea
hatatas Poir). Crop Production, 1,35-37.
Johnson, e.M. 1966. Molybdenum. In: Chapman,
H.D., ed., Diagnostic criteria for plants and soils.
Dept of Soils and Plant Nutrition, University of
California Citrus Research Centre and
Agricultural Experiment Station, Riverside,
California.
Johnston, M. 1996. Nutrient disorders of root crops
growing on raised coral reef landforms near
Madang, Papua New Guinea. In: Craswell, E.T.
Asher, C.I. and O'Sullivan, IN., ed., ACIAR
Proceedings No. 65: Mineral nutrient disorders
of root crops in the Pacific, 127-129.
Jones, A. and Bouwkamp, J.e. 1992. Fifty years of
cooperative sweetpotato research 1939-1989.
Southern Cooperative Series, Bulletin No. 369,
Louisiana Agricultural Experiment Station,
Baton Rouge, USA.
Jones, L.G., Constantin, R.I., Cannon, J.M., Martin,
w.J. and Hernandez, T.P. 1997. Effects of soil
amendment and fertilizer applications on sweet
potato growth, production, and quality.
Louisiana State University Agricultural
Experiment Station Bulletin, No. 704.
Jones, L.G., Constantin, R.J. and Hernandez, T.P.
1979. The response of sweetpotatoes to fertilizer
phosphorus and potassium as related to levels of
124
these elements available in the soil. Louisiana
State University Agricultural Experiment Station
Bulletin, No. 722.
Kabeerathumma, S., Mohankumar, B. and Potty,
VP. 1986. Efficacy of rock phosphate as a
source of phosphorus to sweet potato. Journal of
the Indian Society for Soil Science, 34, 806-
809.
Kandasamy, D., Palanisamy, D. and Oblisami, G.
1988. Screening of germplasm of sweet potato
for VA-mycorrhizal fungal occurrence and
response of the crop to the inoculation of VAM
fungi and Azospirillum. Journal of Root Crops,
14,37-42.
Khasa, P., Furlan, V and Fortin, J.A. 1992.
Response of some tropical plant species to
endomycorrhizal fungi under field conditions.
Tropical Agriculture, 69, 279-283.
Kimber, A.I. 1976. Some factors influencing the
protein content of sweet potato. In: Willson, K.
and Bourke, R.M., ed., Proceedings of the 1975
Papua New Guinea Food Crops Conference,
Department of Primary Industry, Port Moresby,
63-74.
Kochhar, S.L. 1981. Tropical Crops: a textbook of
economic botany. Macmillan, 228-230.
Koo, R.I.C., Anderson, e.A., Stewart, I., Tucker,
D.P.H., Calvert, D.V and Wutscher, H.K. 1984.

Recommended fertilizers and nutritional sprays
for citrus. Bulletin 536D, Institute of Food and
Agricultural Science, University of Florida,
Gainesville FL, USA.
Landon, R.I. 1991. ed., Booker tropical soil manual:
a handbook for soil survey and agricultural land
evaluation in the tropics and subtropics. Booker
Tate Ltd, Longman, London.
Leonard, O.A., Anderson, W.S. and Gieger, M.
1948. Effect of nutrient level on the growth and
chemical composition of sweetpotatoes in sand
culture. Plant Physiology, 23, 223-235.
- 1949. Field studies on the mineral nutrition of
the sweetpotato. Proceedings of the American
Society for Horticultural Science, 53, 387-392.
Lorenz, O.A. 1965. Better vegetable yields and quality
with plant analysis. Plant Food Review, 11,2-4.
McDonald, W.I. 1978. Molybdenum-if it's short
yields will suffer. Sunflower, 2, 22.
Mascianica, M.P., Bellinder, R.R., Graves, B.,
Morse, RD. and Talleyrand, H. 1985.
Forecasting of N fertilization requirements for
sweet potatoes. Journal of the American Society
for Horticultural Science, 110, 358-361.
Melsted, S.w. and Peck, T.R. 1973. The principles
of soil testing. In: Walsh, L.M. and Beaton, J.D.,
ed., Soil testing and pfant analysis. Soil Science
Society of America, Madison, 13-21.
Metson, A.J. 1961. Methods of chemical analysis
for soil survey samples. New Zealand DSIR Soil
Bureau Bulletin 12. Government Printer,
Wellington, NZ.
Miller, C.H. and Nielsen, L.W. 1970. Sweet potato
blister, a disease associated with boron
deficiency. Journal of the American Society for
Horticultural Science, 95, 685-686.
Mortley, D.G. and Hill, w.A. 1990. Sweetpotato
growth and nitrogen content following nitrogen
application and inoculation with Azospirillum.
HortScience, 25, 758-759.
Mulongoy, K., Callens, A. and Okogun, J.A. 1988.
Differences in mycorrhizal infection and P
uptake of sweet potato cultivars (Ipomoea
batatas L.) during their early growth in three
soils. Biology and Fertility of Soils, 7, 7-10.
Munn, D.A. and McCollum, RE. 1976. Solution
culture evaluation of sweet potato cultivar
tolerance to aluminium. Agronomy Journal, 68,
989-991.
Navarro, A.A. and Padda, D.S. 1983. Effects of
sulfur, phosphorous and nitrogen application on
the growth and yield of sweet potatoes grown on
Fredensborg clay loam. Journal of the
Agricultural University of Puerto Rico, 67, 108.
Negeve, J.M. and Roncadori, RW. 1985. The
interaction of vesicular-arbuscular mycorrhizae
125
and soil phosphorus fertility on growth of sweet
potato (Ipomoea batatas). Field Crops Research,
12,181-185.
Nishimoto, RK., Fox, RL. and Parvin, P.E. 1977.
Response of vegetable crops to phosphorus
concentration in soil solution. Journal of the
American Society for Horticultural Science, 102,
705.
Norman, M.J.T., Pearson, D.J. and Searle, P'G.E.
1984. The Ecology of Tropical Food Crops.
Cambridge University Press.
Nusbaum, C.J. 1946. Internal brown spot, a boron
deficiency disease of sweet potato.
Phytopathology, 36, 164-167.
Olsen, S.R. 1972. Micronutrient interactions. In: J.1.
Mortvedt, P.M. Giordano and W.L. Lindsay ed.,
Micronutrients in Agriculture. Soil Science
Society of America Inc., Madison, Wisconsin,
USA, 243-264.
Opio, F. 1990. An assessment of root crop
production and development in the South Pacific
islands. The case of Cook Islands, Kiribati,
Solomon Islands, Tonga, Tuvalu, Vanuatu and
Western Samoa. (FAO Root Crop Project RAS/
86/034.)
O'Sullivan, J.N., Asher, C.I., Halavatau, S., Blarney,
F.P.c. and Yapa, L.G.G. 1997a. Nutrient
disorders of sweet potato and taro: advances in
diagnosis and correction in the Pacific. In:
Akoroda, M.O. ed., Proceedings of the Sixth
Triennial Symposium of the International
Society for Tropical Root Crops-Africa
Branch, Lilongwe Malawi, October 1995.
International Institute for Tropical Agriculture.
O'Sullivan, IN., Blarney, FP.C. and Asher, C.I.
1996a. Diagnostic criteria for nutritional
disorders of sweet potato: I. Methods and visible
symptoms. In: Craswell, E.T. Asher, C.I. and
O'Sullivan, J.N., ed., ACIAR Proceedings No.
65: Mineral nutrient disorders of root crops in
the Pacific, 28-38.
- 1996b. Diagnostic criteria for nutritional
disorders of sweet potato: II. Critical nutrient
concentrations in leaves. In: Craswell, E.T.
Asher, C.I. and O'Sullivan, J.N., ed., ACIAR
Proceedings No. 65: Mineral nutrient disorders
of root crops in the Pacific, 39-43.
0' Sullivan, J., Loader, L., Asher, c., and Blarney, P.
1997b. Troubleshooting nutritional problems in
a new industry: sweet potato in North
Queensland. In: Imrie, B.C., Bray, .A., Wood,
I.M. and Fletcher, R.I. eds. New Crops, New
Products-New Opportunities for Australian
Agriculture. Proceedings of the First Australian
New Crops Conference (Gatton 8-11 July 1996).
RIRDC Research Paper No 97121, Rural
Industries Research and Development
Corporation, Australia. Vol.2, pp 143-148
Pan, G. 1996. Importance of sweet potato feathery
mottle virus disease in Queensland. Master of
Applied Science thesis, The University of
Queensland, Australia.
Paterson, D.R., Taber, RA., Earhard, D.R. and
Cushman, K.E. 1987. Response of 'Jewel' ,
'Topaz' , and 'Cordner' Ipomoea hatatas
cultivars to endomycorrhizal fungi in
greenhouse and field experiments. HortScience,
22, 1107.
Paula, M.A., Siqueira, lO. and Dobereiner, J. 1993.
Occurrence of vesicular-arbuscular mycorrhizal
fungi and diazotrophic bacteria associated with
sweet potato. Revista Brasileira de Ciencia do
Solo, 17,349-356.
Paula, M.A., Urquiaga, S., Siqueira, lO. and
Dobereiner, J. 1992. Synergistic effects of
vesicular-arbuscular mycorrhizal fungi and
diazotrophic bacteria on nutrition and growth of
sweet potato (Ipomoea hatatas). Biology and
Fertility of Soils, 14, 61-66.
Pillai, N.G., Mohankumar, B., Kabeerathumma, S.
and Nair, P.G. 1986. Deficiency symptoms of
micronutrients in sweet potato (Ipomoea hatatas
L.). Journal of Root Crops, 12(2),91-95.
Platt, B.S. 1965. Tables ofrepresentative values of
foods commonly used in tropical countries.
Medical Research Council Special Report
Series, London, No. 302.
126
Purcell, A.E., Walter, WM., Nicholaides, 1.1.,
Collins, WW and Chancy, H. 1982. Nitrogen,
potassium, sulfur fertilization, and protein content
of sweet potato roots. Journal of the American
Society for Horticultural Science, 107,425-427.
Rayment, G.E. and Higginson, FR. 1992. Australian
laboratory handbook of soil and water chemical
methods. Inkata Press, Australia.
Reuter, D.J. and Robinson, J.B. ed. 1986. Plant
Analysis. An interpretation manual. Inkata Press,
Melbourne.
Reuther, W. and Labanauskas, C.L. 1966. Copper.
In: Chapman, H.D., ed. , Diagnostic criteria for
plants and soils. Dept of Soils and Plant
Nutrition, University of California Citrus
Research Centre and Agricultural Experiment
Station, Riverside, California, 157-179.
Ritchey, K.D., Wright, R.I., Baligar, v.c. and
Murrmann, R.P. 1991. Evaluating sweet potato
tolerance to aluminium toxicity: comparison of
rapid test method and field results. In: Wright,
R.I., Baligar, v.c. and Murrmann, R.P. ed.,
Developments in Plant and Soil Sciences Vol.
45: Plant-soil interactions at low pH. Kluwer
Acad. Publ. , Dordrecht, 939-945.
Rufty, T.W, Miner, G.S. and Raper, C.D. Jr 1979.
Temperature effects on growth and manganese
tolerance in tobacco. Agronomy Journal , 71,
638-644.
Sangalang, J.B. and Bouwkamp, J.C. 1988.
Selection of sweet potato for tolerance to
aluminium toxicity: screening procedures and
field tests. Journal of the American Society for
Horticultural Science, 113(2),227-281.
Saunders, WM.H. 1974. Effect of superphosphate
topdressing on phosphate and sulphate retention.
New Zealand Soil News, 22, 15-22.
Scott, L.E. and Bouwkamp, J.e. 1974. Seasonal
mineral accumulation by the sweet potato.
HortScience, 9, 233-235.
Sinnett, P.P. 1975. The people of Murapin. Institute
of Medical Research Monograph Series No.4.
E.W Classey Ltd., Faringdon, axon.
Skoglund, L.G. and Smit, N.EJ.M. 1994. Major
diseases and pests of sweetpotato in Eastern
Africa. International Potato Center (CIP), Lima,
Peru. 67 p.
Spear, S.N., Edwards, D.G. and Asher, CJ. 1978.
Response of cassava, sunflower and maize to
potassium concentration in solution. III.
Interactions between potassium, calcium and
magnesium. Field Crops Research, 1, 347-361.
Spence, J.A. and Ahmad, N. 1967. Plant nutrient
deficiencies and related tissue composition of
the sweet potato. Agronomy Journal, 59, 59-62.
Spencer, WE 1954. A rapid test for possible
excesses of copper insandy soils. University of
Florida Agricultural Experiment Station
Bulletin, No. 544.
Tiller, K.G. and Merry, R.H. 1981. Copper pollution
of agricultural soils. In: Loneragan, J.E et al.
ed., Copper in soils and plants. Academic Press,
North Ryde, NSW, Australia. 119-137.
Tisdale, S.L., Nelson, WL. and Beaton, J.D. 1993.
Soil fertility and fertilizers, 5th Edition.
Macmillan, New York, 189 p.
Trierweiler, J.P. and Lindsay, WL. 1969. EDTA
ammonium carbonate soil test for zinc. Soil
Science Society of America Proceedings, 33,
49-54.
Ulrich, A. 1993. Potato. In: Bennett, W.E ed.,
Nutrient deficiencies and toxicities in crop
plants. APS Press, St. Paul, Minnesota, USA,
149-156.
Ulrich, A. and Hills, EJ. 1973. Plant analysis as an
aid in fertilizing sugar crops: Part I. Sugar beets.
In: Walsh, L.M. and Beaton, J.D. ed., Soil
testing and plant analysis. Soil Science Society
of America, Madison, 271-288.
Vance, P.N., George, S. and Wohuinangu, J. 1983.
Sulfur in the agriculture of Papua New Guinea.
In: Blair, G.J. and Till, A.R ed., Sulfur in South
East Asian and South Pacific agriculture.
Commonwealth of Australia. 180-190.
Villareal, RL., Tsou, S.e.S., Lin, S.K. and Chiu,
S.C. 1979. Use of sweet potato (Ipomoea
batatas) leaf tips as vegetables. II. Evaluation of
yield and nutritive quality. Experimental
Agriculture, 15, 117-122.
127
Villareal, RL., Tsou, S.C., Lo, H.P. and Chiu, s.e.
1985. Sweet potato vine tips as vegetables. In:
Bouwkamp, J.e. ed., Sweet Potato Products: a
natural resource for the Tropics. CRC Press,
Boca Raton, Florida. 175-183.
von Stieglitz, e.R. and Chippendale, P. 1955.
Nutritional Disorders of Plants. Queensland
Department of Agriculture and Stock.
Walker, D.W. and Woodson, W.R 1987. Nitrogen
rate and cultivar effects on nitrogen and nitrate
concentrations of sweet potato leaf tissue.
Communications in Soil Science and Plant
Analysis, 18,529-541.
Watanabe, K. 1979. Agronomic studies on the
mechanism of excessive vegetation growth in
sweet potato (Ipomoea batatas). Journal of the
Central Agriculture Experiment Station, 29, 1.
Weir, RG. and Cresswell, G.C. 1993. Plant Nutrient
Disorders 3. Vegetable Crops. NSW Agriculture;
Inkata Press, Australia.
Willis, L.G. 1943. Apply borax to improve quality
of sweet potatoes. North Carolina Agricultural
Experiment Station Special Circular 1, 1943.
Woolfe, J.A. 1992. Sweet potato: an untapped food
resource. Cambridge University Press.
Yen, D.E. 1974. The sweet potato and Oceania. An
essay in ethnobotany. Bishop Museum Bulletin
236, Honolulu.
-
Appendix I. Glossary, Scientific Names,Abbreviations, Conversions, and Symbols
acidic
(of a solution or soil) containing more free hydrogen
ions than free hydroxyl ions, a characteristic which
affects the behaviour of many of the chemical
species contained in it (see soil pH)
alkaline
(of a solution or soil) containing fewer free
hydrogen ions than free hydroxyl ions, a
characteristic which affects the behaviour of many
of the chemical species contained in it (see soil pH)
anion
a soluble chemical unit (atom or molecule) which
carries a net negative electrical charge
anthocyanin
a red pigment sometimes present in plant tissues. In
combination with varying levels of green and
yellow photosynthetic pigments, it may produce
colours from pale pink to bright orange or dark
purple
apex
(adj. apical) The shoot or root tip
apical menstem
the tissue in a shoot or root tip which gives rise to
new leaves or roots
axil
the acute angle formed by the junction of the stem
with a leaf petiole, from where lateral shoots arise
axillary bud
the dormant or undeveloped shoot tip in a leaf axil
cation
a soluble chemical unit (atom or molecule) which
carries a net positive electrical charge
cation-exchange capacity
the capacity of a soil to loosely bind cations,
determined by the surface area and charge density
of particles (e.g. clay, organic matter) contained in a
given weight of soil
chlorophyll
the green pigment in plant tissue, which transfers
light energy into chemical reactions
chlorosis
(adj . chlorotic) Loss of green pigmentation,
resulting in a paler than normal colour, either light
green, yellow or whitish
dolomite
a mixture of calcium carbonate and magnesium
carbonate
129
exchangeable cation
a cation which is loosely bound to a negatively
charged site on the surface of a soil particle, and
which may be displaced into solution by another
cation which takes its place at the particle surface
fertigation
the application of nutrients by adding them to
irrigation water
gypsum
naturally occurring calcium sulfate
internode
the length of stem between two nodes
interveinal
relating to those parts of the leaf blade which lie
between the veins
lamina
the leaf blade
latex
the milky sap which exudes from cut surfaces of
some species of plants, including sweet potato
leaf blade
the broad, flat part of the leaf which provides most
of the photosynthetic surface of the plant
lesion
localised injury (usually necrotic) of the plant tissue
lime
naturally occurring calcium carbonate
major / main veins
thick veins on the leaf blade which branch directly
from the midvein or from the point of attachment to
the petiole, and radiate outwards to the marginal
vein
marginal vein
the leaf vein which runs just inside the margin of the
blade and parallel to it
midvein / midrib
the main vein bisecting the leaf blade, from the
petiole to the tip
minor veins
secondary and tertiary branches of the major veins
mottle
an uneven or blotchy appearance
mycorrhizae
soil fungi which form an intimate association with
plant roots, often to mutual benefit
necrosis
(adj . necrotic) Death, affecting any section ofthe
plant tissue, not the entire plant
node
the point on a stem where a leaf is attached
petiole
the leaf stalk which supports the leaf blade. Both the
petiole and the blade make up the leaf
photosynthesis
(adj. photosynthetic) The process by which plants
utilise light energy to synthesise organic material
senescence
(v. senesce) The processes leading up to death of a
plant part, such as a leaf, or the whole plant
soil pH
a measure of the acidity or alkalinity of a soil. Soil
pH may be measured by mixing soil in water
(e.g. 1:5 soil:water), or in a solution (e.g. 0.002 M
CaC12). Measured in water, a pH of 6.5-7.5 denotes
a neutral soil. Acid soils have pH<6.5, with soils
having pH<5 being very acid. Alkaline soils have
pH> 7.5. The presence of undissolved lime or coral
may raise the pH up to 8.2; a higher pH indicates
the presence of sodium salts
storage roots
the starchy, edible roots of sweet potato, sometimes
referred to as tubers
130
Scientific names for plant species mentioned
barley Hordeum vulgare
beet Beta vulgaris
cassava Manihot esculenta
citrus Citrus spp.
ginger Zingiber officinale
green bean Phaseolus vulgaris
malZe Zea mays
peanut Arachis hypogaea
potato Solanum tuberosum
soybean Glycine max
sugar beet Beta vulgaris
sunflower Helianthus annuus
sweet potato Ipomoea batatas
taro Colocasia esculenta
tobacco Nicotiana tabacum
wheat Triticum aestivum
yam Dioscorea spp.
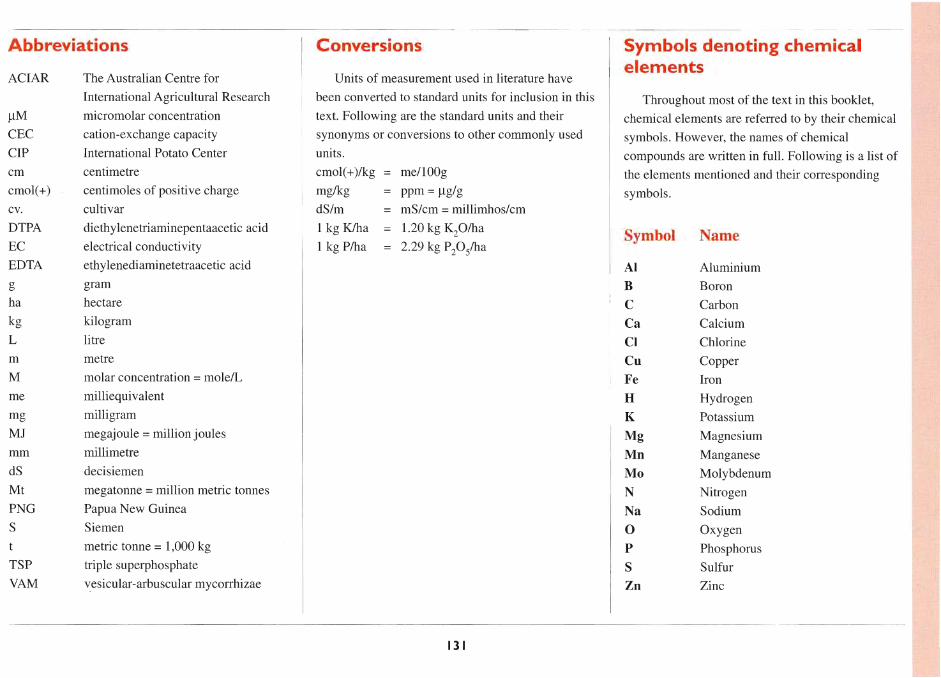
Abbreviations
ACIAR
)lM
CEC
CIP
cm
cmol(+)
cv.
DTPA
EC
EDTA
g
ha
kg
L
m
M
me
mg
MJ
mm
dS
Mt
PNG
S
TSP
VAM
The Australian Centre for
International Agricultural Research
micromolar concentration
cation-exchange capacity
International Potato Center
centimetre
centimoles of positive charge
cultivar
die thy lenetriaminepentaacetic acid
electrical conductivity
ethylenediaminetetraacetic acid
gram
hectare
kilogram
litre
metre
molar concentration = molelL
milliequivalent
milligram
megajoule = million joules
millimetre
decisiemen
megatonne = million metric tonnes
Papua New Guinea
Siemen
metric tonne = 1,000 kg
triple superphosphate
vesicular-arbuscular mycorrhizae
Conversions
Units of measurement used in literature have
been converted to standard units for inclusion in this
text. Following are the standard units and their
synonyms or conversions to other commonly used
units.
cmol( + )/kg
mg/kg
dS/m
1 kg Klha
1 kg Plha
me/lOOg
ppm = )lg/g
mS/cm = millimhos/cm
1.20 kg ~Olha
2.29 kg Ppsfha
131
Symbols denoting chemical elements
Throughout most of the text in this booklet,
chemical elements are referred to by their chemical
symbols. However, the names of chemical
compounds are written in full. Following is a list of
the elements mentioned and their corresponding
symbols.
Symbol Name
Al Aluminium
B Boron
C Carbon
Ca Calcium
CI Chlorine
Cll Copper
Fe Iron
H Hydrogen
K Potassium
Mg Magnesium
Mn Manganese
Mo Molybdenum
N Nitrogen
Na Sodium
0 Oxygen
P Phosphorus
S Sulfur
Zn Zinc
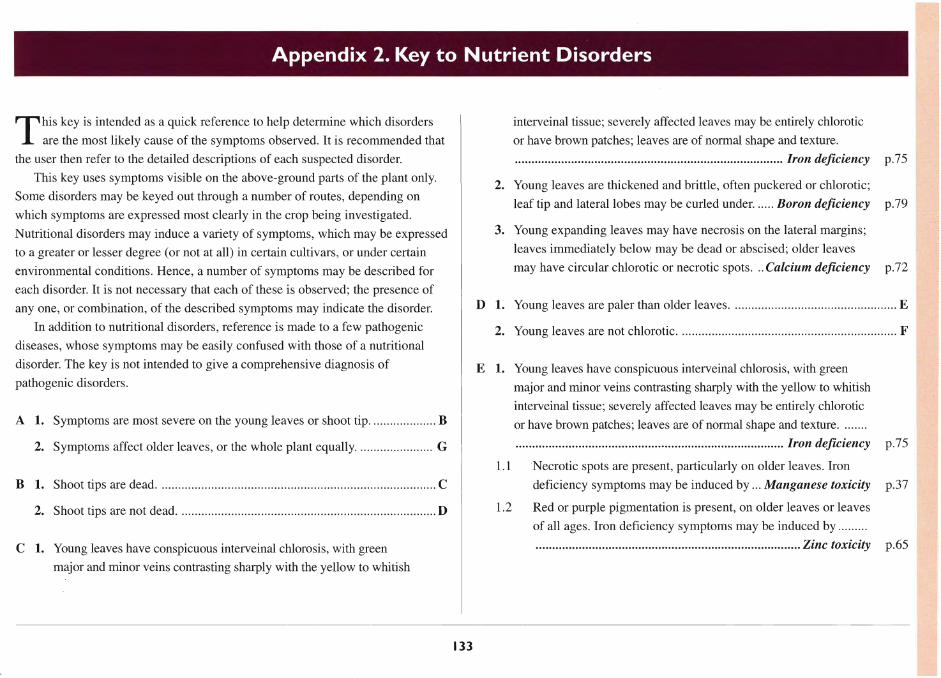
Appendix 2. Key to Nutrient Disorders
T his key is intended as a quick reference to help determine which disorders
are the most likely cause of the symptoms observed. It is recommended that
the user then refer to the detailed descriptions of each suspected disorder.
This key uses symptoms visible on the above-ground parts of the plant only.
Some disorders may be keyed out through a number of routes, depending on
which symptoms are expressed most clearly in the crop being investigated.
Nutritional disorders may induce a variety of symptoms, which may be expressed
to a greater or lesser degree (or not at all) in certain cultivars, or under certain
environmental conditions. Hence, a number of symptoms may be described for
each disorder. It is not necessary that each of these is observed; the presence of
anyone, or combination, of the described symptoms may indicate the disorder.
In addition to nutritional disorders, reference is made to a few pathogenic
diseases, whose symptoms may be easily confused with those of a nutritional
disorder. The key is not intended to give a comprehensive diagnosis of
pathogenic disorders.
A 1. Symptoms are most severe on the young leaves or shoot tip .................... B
2. Symptoms affect older leaves, or the whole plant equally .......... ............. G
B 1. Shoot tips are dead ..... ............... ... .......... ..... ..... ........................... .............. C
2. Shoot tips are not dead ...... ............. ................................................ ........... D
C 1. Young leaves have conspicuous interveinal chlorosis, with green
major and minor veins contrasting sharply with the yellow to whitish
133
interveinal tissue; severely affected leaves may be entirely chlorotic
or have brown patches; leaves are of normal shape and texture .
................................................................................. Iron deficiency p.75
2. Young leaves are thickened and brittle, often puckered or chlorotic;
leaf tip and lateral lobes may be curled under ...... Boron deficiency p.79
3. Young expanding leaves may have necrosis on the lateral margins;
leaves immediately below may be dead or abscised; older leaves
may have circular chlorotic or necrotic spots . .. Calcium deficiency p.72
D 1. Young leaves are paler than older leaves ........................................ .......... E
2. Young leaves are not chlorotic . .... ........ ... ... .......................... ............... ...... F
E 1. Young leaves have conspicuous interveinal chlorosis, with green
major and minor veins contrasting sharply with the yellow to whitish
interveinal tissue; severely affected leaves may be entirely chlorotic
or have brown patches; leaves are of normal shape and texture ....... .
................................................................................. Iron deficiency p.75
1.1 Necrotic spots are present, particularly on older leaves. Iron
deficiency symptoms may be induced by ... Manganese toxicity p.37
1.2 Red or purple pigmentation is present, on older leaves or leaves
of all ages. Iron deficiency symptoms may be induced by ........ .
................................................................................ Zinc toxicity p.65
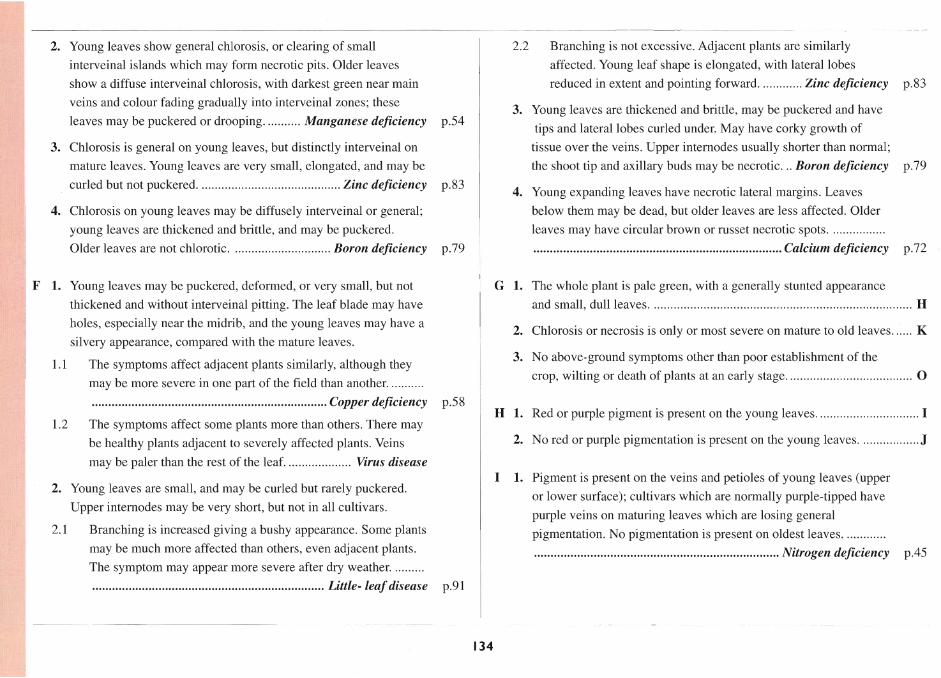
2. Young leaves show general chlorosis, or clearing of small
interveinal islands which may form necrotic pits. Older leaves
show a diffuse interveinal chlorosis, with darkest green near main
veins and colour fading gradually into interveinal zones; these
leaves may be puckered or drooping ........... Manganese deficiency p.54
3. Chlorosis is general on young leaves, but distinctly interveinal on
mature leaves. Young leaves are very small, elongated, and may be
curled but not puckered ........... .......... ...................... Zinc deficiency p.83
4. Chlorosis on young leaves may be diffusely interveinal or general;
young leaves are thickened and brittle, and may be puckered.
Older leaves are not chlorotic ............... ...... ..... .... Boron deficiency
F 1. Young leaves may be puckered, deformed, or very small, but not
thickened and without interveinal pitting. The leaf blade may have
holes, especially near the midrib, and the young leaves may have a
silvery appearance, compared with the mature leaves.
1.1
1.2
The symptoms affect adjacent plants similarly, although they
may be more severe in one part of the field than another . ...... ... .
....................................................................... Copper deficiency
The symptoms affect some plants more than others. There may
be healthy plants adjacent to severely affected plants. Veins
may be paler than the rest of the leaf. ................... Virus disease
2. Young leaves are small, and may be curled but rarely puckered.
2.1
Upper internodes may be very short, but not in all cultivars.
Branching is increased giving a bushy appearance. Some plants
may be much more affected than others, even adjacent plants.
The symptom may appear more severe after dry weather ......... .
p.79
p.58
...................................................................... Little-leaf disease p.91
G
H
I
134
2.2 Branching is not excessive. Adjacent plants are similarly
affected. Young leaf shape is elongated, with lateral lobes
reduced in extent and pointing forward ............. Zinc deficiency p.83
3. Young leaves are thickened and brittle, may be puckered and have
tips and lateral lobes curled under. May have corky growth of
tissue over the veins. Upper internodes usually shorter than normal;
the shoot tip and axillary buds may be necrotic ... Boron deficiency p.79
4. Young expanding leaves have necrotic lateral margins. Leaves
below them may be dead, but older leaves are less affected. Older
1.
2.
3.
1.
2.
1.
leaves may have circular brown or russet necrotic spots ............... ..
. .......................................................................... Calcium deficiency p.72
The whole plant is pale green, with a generally stunted appearance
and small, dull leaves ......................................... .. .................................... H
Chlorosis or necrosis is only or most severe on mature to old leaves ...... K
No above-ground symptoms other than poor establishment of the
crop, wilting or death of plants at an early stage ...................................... 0
Red or purple pigment is present on the young leaves ............................... I
No red or purple pigmentation is present on the young leaves ......... .. ....... J
Pigment is present on the veins and petioles of young leaves (upper
or lower surface); cultivars which are normally purple-tipped have
purple veins on maturing leaves which are losing general
pigmentation. No pigmentation is present on oldest leaves ..... ...... ..
. ......................................................................... Nitrogen deficiency pA5
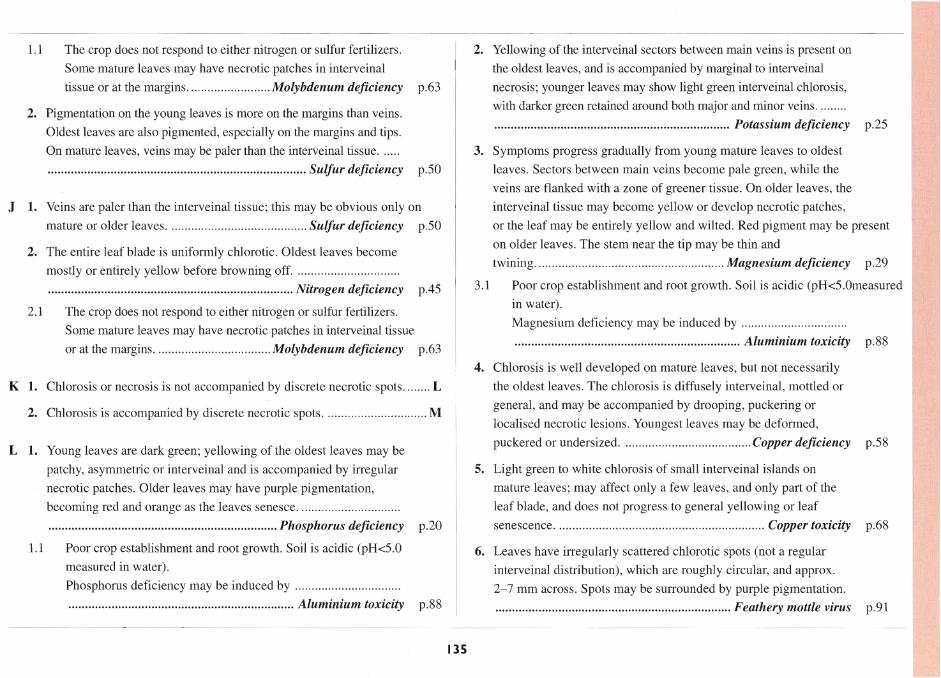
1.1 The crop does not respond to either nitrogen or sulfur fertilizers.
Some mature leaves may have necrotic patches in interveinal
tissue or at the margins ......................... Molybdenum deficiency p.63
2. Pigmentation on the young leaves is more on the margins than veins.
Oldest leaves are also pigmented, especially on the margins and tips.
On mature leaves, veins may be paler than the interveinal tissue ..... .
.............................................................................. Sulfur deficiency p.50
J 1. Veins are paler than the interveinal tissue; this may be obvious only on
mature or older leaves .......................................... Sulfur deficiency p.50
2. The entire leaf blade is uniformly chlorotic. Oldest leaves become
2.1
mostly or entirely yellow before browning off. .............................. .
.......................................................................... Nitrogen deficiency p.45
The crop does not respond to either nitrogen or sulfur fertilizers.
Some mature leaves may have necrotic patches in interveinal tissue
or at the margins .................... ............... Molybdenum deficiency p.63
K 1. Chlorosis or necrosis is not accompanied by discrete necrotic spots ........ L
2. Chlorosis is accompanied by discrete necrotic spots ............................... M
L 1. Young leaves are dark green; yellowing of the oldest leaves may be
patchy, asymmetric or interveinal and is accompanied by irregular
necrotic patches. Older leaves may have purple pigmentation,
1.1
becoming red and orange as the leaves senesce ..... ......................... .
..................................................................... Phosphorus deficiency p.20
Poor crop establishment and root growth. Soil is acidic (pH<5.0
measured in water).
Phosphorus deficiency may be induced by ........... .................... .
.................................................................... Aluminium toxicity p.SS
135
2. Yellowing of the interveinal sectors between main veins is present on
the oldest leaves, and is accompanied by marginal to interveinal
necrosis; younger leaves may show light green interveinal chlorosis,
with darker green retained around both major and minor veins ........ .
. ...................................................................... Potassium deficiency p.25
3. Symptoms progress gradually from young mature leaves to oldest
leaves. Sectors between main veins become pale green, while the
veins are flanked with a zone of greener tissue. On older leaves, the
interveinal tissue may become yellow or develop necrotic patches,
or the leaf may be entirely yellow and wilted. Red pigment may be present
on older leaves. The stem near the tip may be thin and
twining ......................................................... Magnesium deficiency p.29
3.1 Poor crop establishment and root growth. Soil is acidic (pH<5.0measured
in water).
Magnesium deficiency may be induced by .............. ............ .. ... .
.................................................................... Aluminium toxicity p.SS
4. Chlorosis is well developed on mature leaves, but not necessarily
the oldest leaves. The chlorosis is diffusely interveinal, mottled or
general, and may be accompanied by drooping, puckering or
localised necrotic lesions. Youngest leaves may be deformed,
puckered or undersized ................................ .. .... . Copper deficiency p.5S
5. Light green to white chlorosis of small interveinal islands on
mature leaves; may affect only a few leaves, and only part of the
leaf blade, and does not progress to general yellowing or leaf
senescence ................... .... .................................... .... Copper toxicity p.6S
6. Leaves have irregularly scattered chlorotic spots (not a regular
interveinal distribution), which are roughly circular, and approx.
2-7 mm across. Spots may be surrounded by purple pigmentation .
....................................................................... Feathery mottle virus p.91
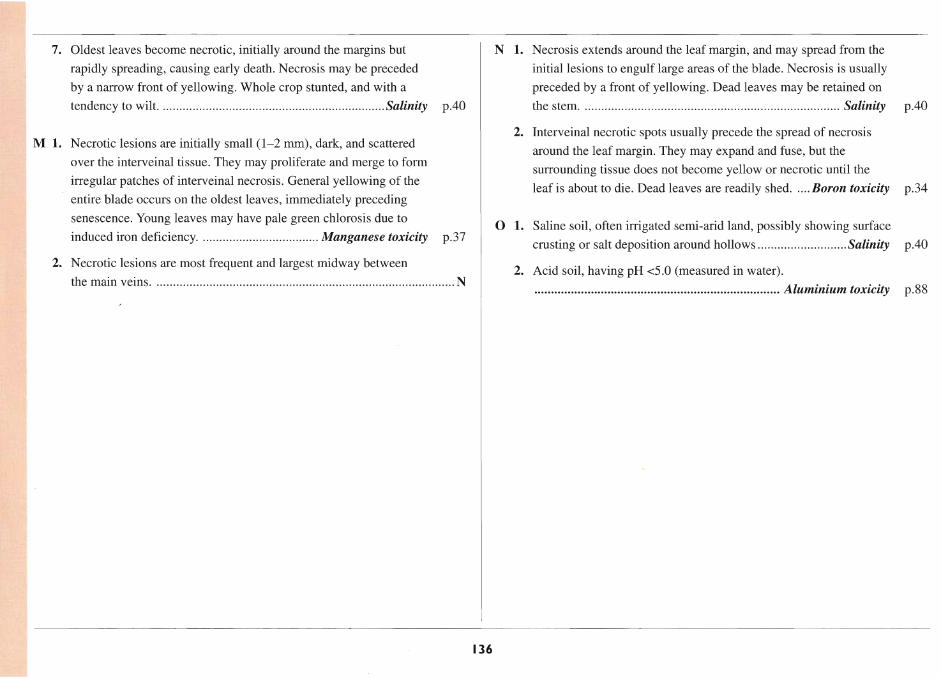
7. Oldest leaves become necrotic, initially around the margins but
rapidly spreading, causing early death. Necrosis may be preceded
by a narrow front of yellowing. Whole crop stunted, and with a
tendency to wilt. ................................................................... Salinity p.40
M 1. Necrotic lesions are initially small (1-2 mm), dark, and scattered
over the interveinal tissue. They may proliferate and merge to form
irregular patches of interveinal necrosis. General yellowing of the
entire blade occurs on the oldest leaves, immediately preceding
senescence. Young leaves may have pale green chlorosis due to
induced iron deficiency .................................... Manganese toxicity p.37
2. Necrotic lesions are most frequent and largest midway between
the main veins ........................................................................................... N
136
N 1. Necrosis extends around the leaf margin, and may spread from the
initial lesions to engulf large areas of the blade. Necrosis is usually
preceded by a front of yellowing. Dead leaves may be retained on
the stem .............................................................................. Salinity p.40
2. Interveinal necrotic spots usually precede the spread of necrosis
around the leaf margin. They may expand and fuse, but the
surrounding tissue does not become yellow or necrotic until the
leaf is about to die. Dead leaves are readily shed ..... Boron toxicity p.34
o 1. Saline soil, often irrigated semi-arid land, possibly showing surface
crusting or salt deposition around hollows ....................... .... Salinity p.40
2. Acid soil, having pH <5.0 (measured in water).
.......................................................................... Aluminium toxicity p.88