Nutrient cycling in ecosystems: Lecture Content n Introduction to nutrient cycles n Driving forces...
28
Nutrient cycling in ecosystems: Lecture Content Introduction to nutrient cycles Driving forces for nutrient cycles in ecosystems Water (hydrological) cycle as a physical model of nutrient cycling Case study of N, Ca limitation: Hubbard Brook Experimental Forest, NH Major nutrient cycles & their pool sizes, transfer rates, control mechanisms, human impacts Nitrogen Phosphorus
-
Upload
theodore-wade -
Category
Documents
-
view
232 -
download
1
Transcript of Nutrient cycling in ecosystems: Lecture Content n Introduction to nutrient cycles n Driving forces...
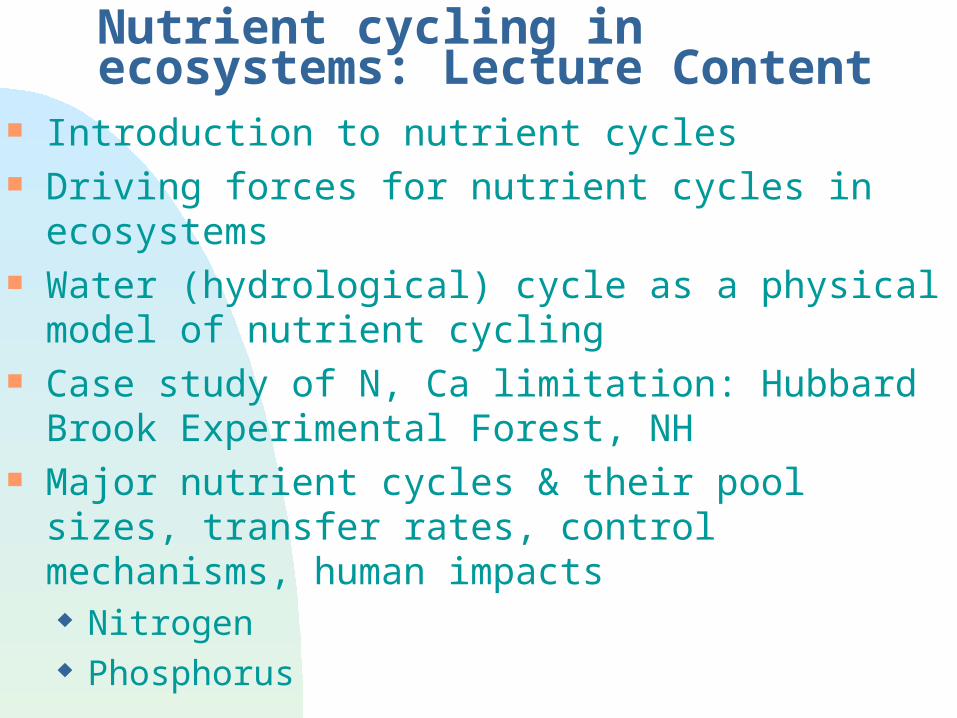
Nutrient cycling in ecosystems: Lecture Content
Introduction to nutrient cycles Driving forces for nutrient cycles in ecosystems Water (hydrological) cycle as a physical model of
nutrient cycling Case study of N, Ca limitation: Hubbard Brook
Experimental Forest, NH Major nutrient cycles & their pool sizes, transfer rates,
control mechanisms, human impacts Nitrogen Phosphorus
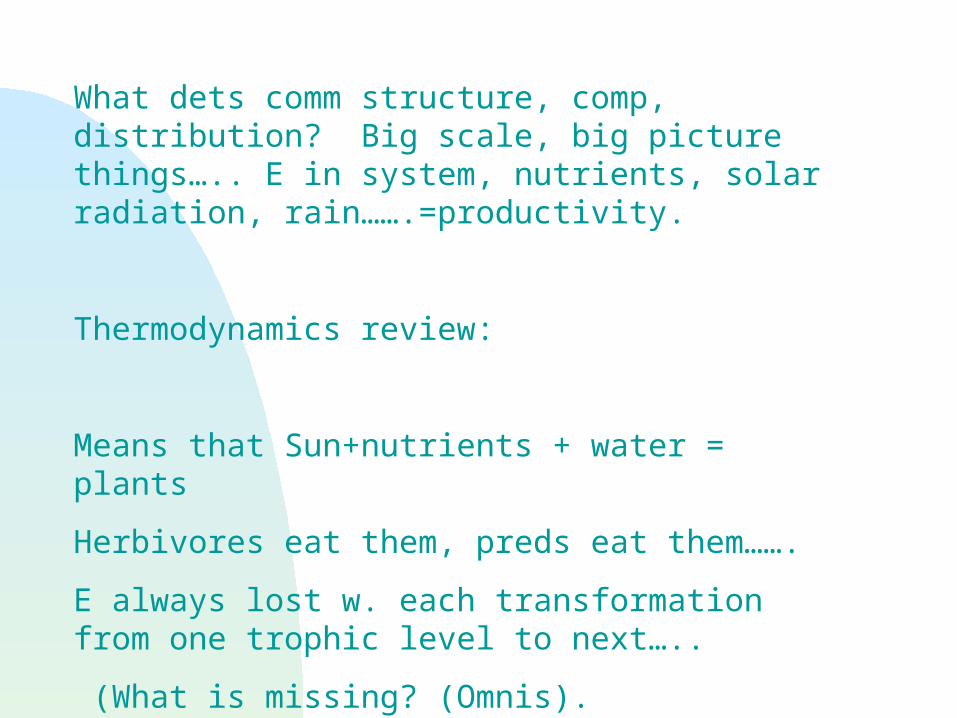
What dets comm structure, comp, distribution? Big scale, big picture things….. E in system, nutrients, solar radiation, rain…….=productivity.
Thermodynamics review:
Means that Sun+nutrients + water = plants
Herbivores eat them, preds eat them…….
E always lost w. each transformation from one trophic level to next…..
(What is missing? (Omnis).
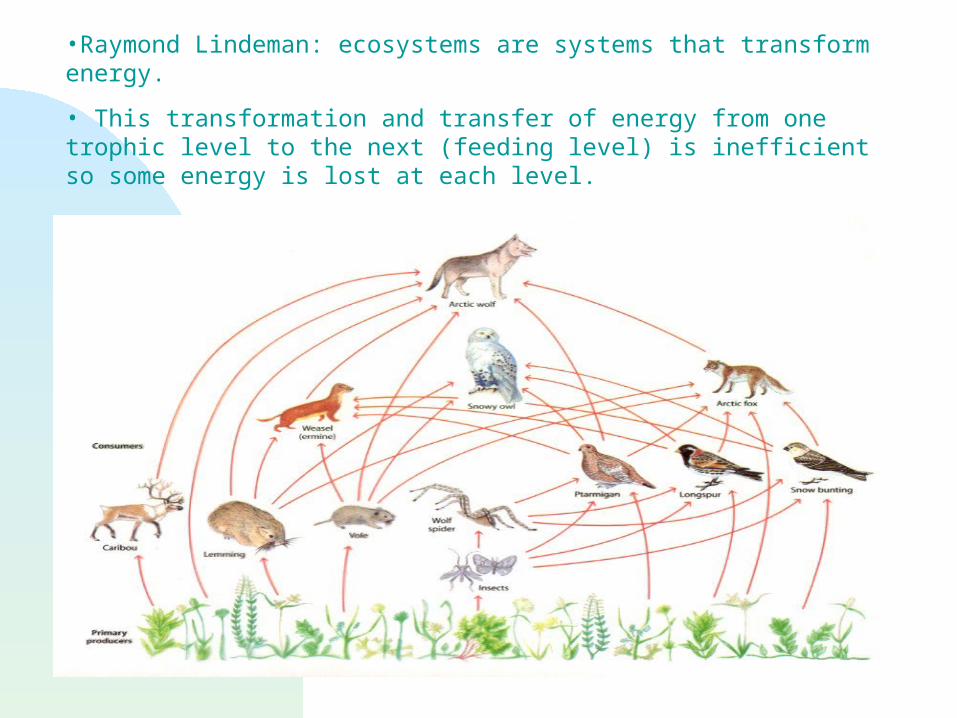
•Raymond Lindeman: ecosystems are systems that transform energy.
• This transformation and transfer of energy from one trophic level to the next (feeding level) is inefficient so some energy is lost at each level.
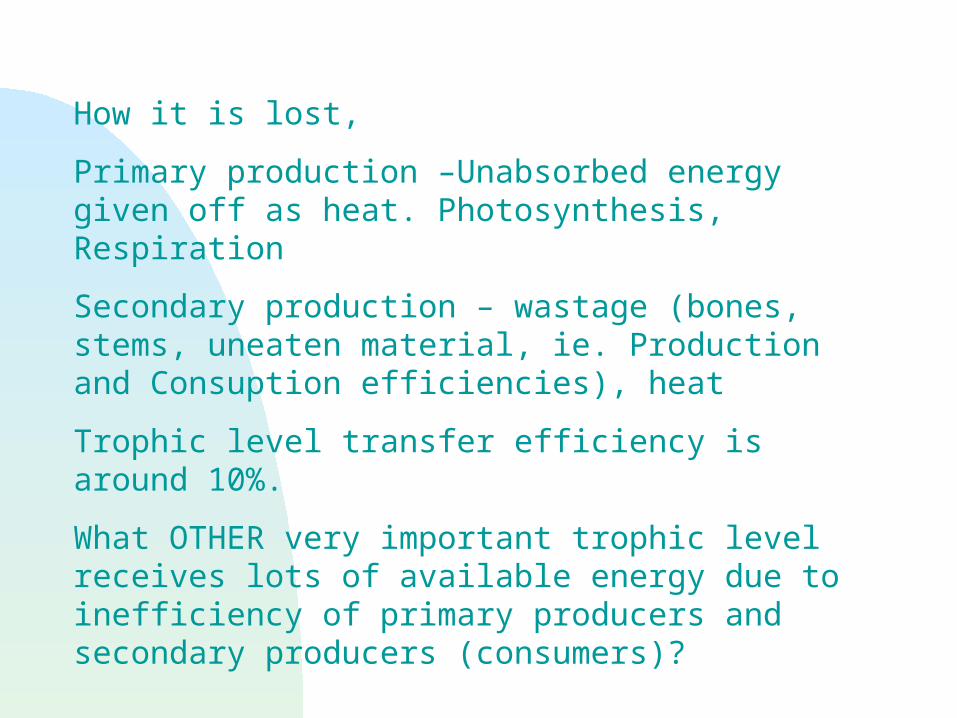
How it is lost,
Primary production –Unabsorbed energy given off as heat. Photosynthesis, Respiration
Secondary production – wastage (bones, stems, uneaten material, ie. Production and Consuption efficiencies), heat
Trophic level transfer efficiency is around 10%.
What OTHER very important trophic level receives lots of available energy due to inefficiency of primary producers and secondary producers (consumers)?
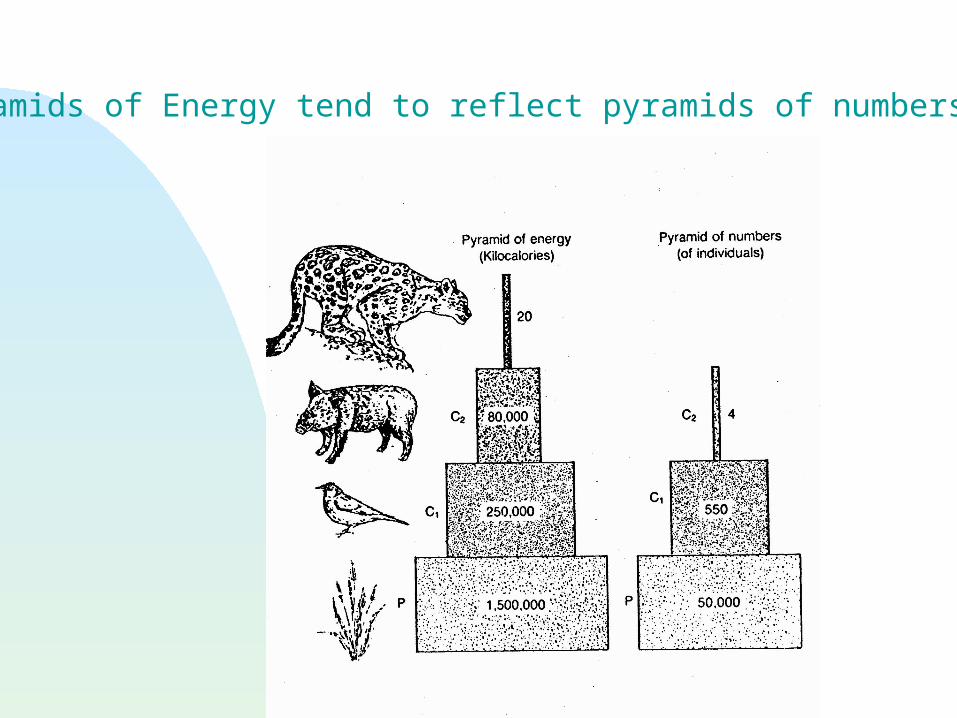
Pyramids of Energy tend to reflect pyramids of numbers
What are the limits, determinants of primary production (see biome lecture!)
Secondary productivity- well…. Primary productivity
Nutrients, unlike energy, are not constantly renewed and used up
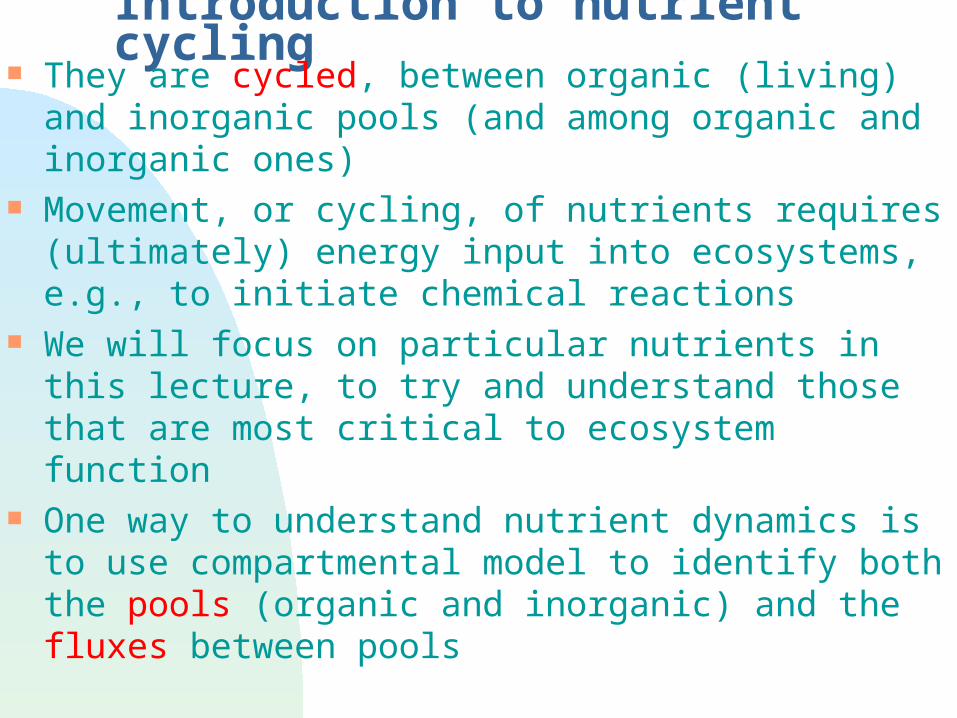
Introduction to nutrient cycling They are cycled, between organic (living) and
inorganic pools (and among organic and inorganic ones)
Movement, or cycling, of nutrients requires (ultimately) energy input into ecosystems, e.g., to initiate chemical reactions
We will focus on particular nutrients in this lecture, to try and understand those that are most critical to ecosystem function
One way to understand nutrient dynamics is to use compartmental model to identify both the pools (organic and inorganic) and the fluxes between pools
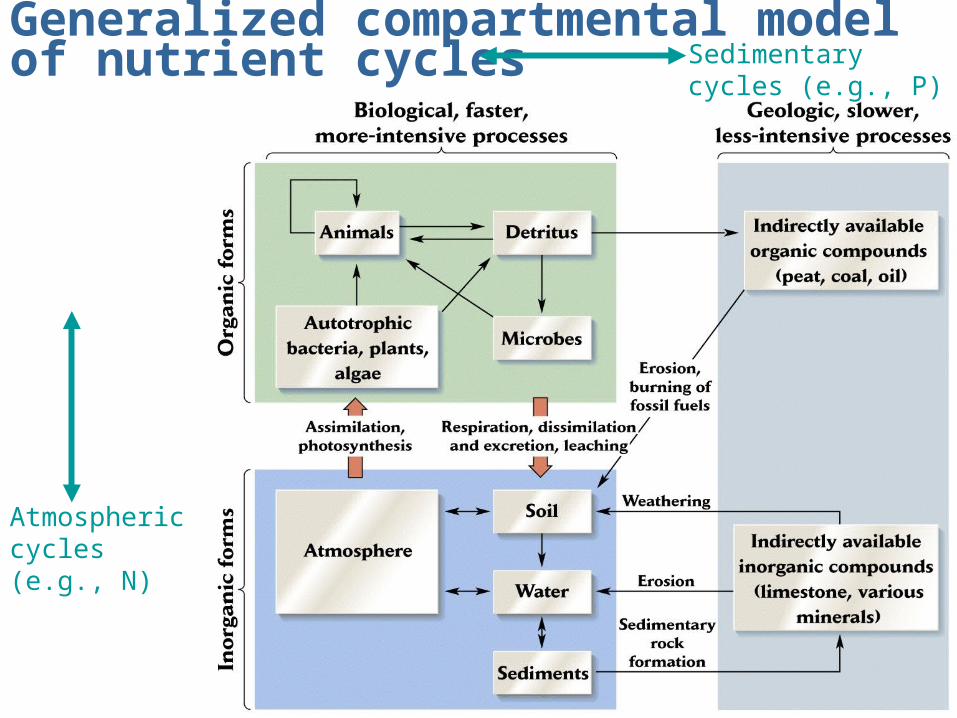
Generalized compartmental model of nutrient cycles Sedimentary cycles
(e.g., P)
Atmospheric cycles (e.g., N)
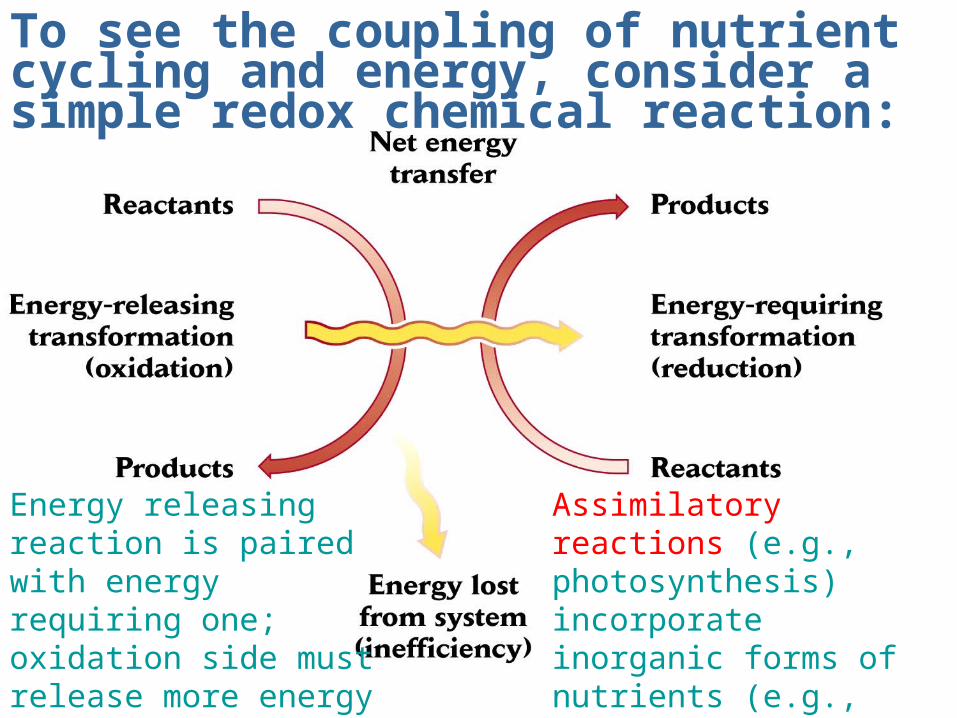
To see the coupling of nutrient cycling and energy, consider a simple redox chemical reaction:
Energy releasing reaction is paired with energy requiring one; oxidation side must release more energy than reduction side requires; rest lost as heat
Assimilatory reactions (e.g., photosynthesis) incorporate inorganic forms of nutrients (e.g., carbon) into organic forms (e.g., carbohydrates); dissimilatory rxns. the reverse
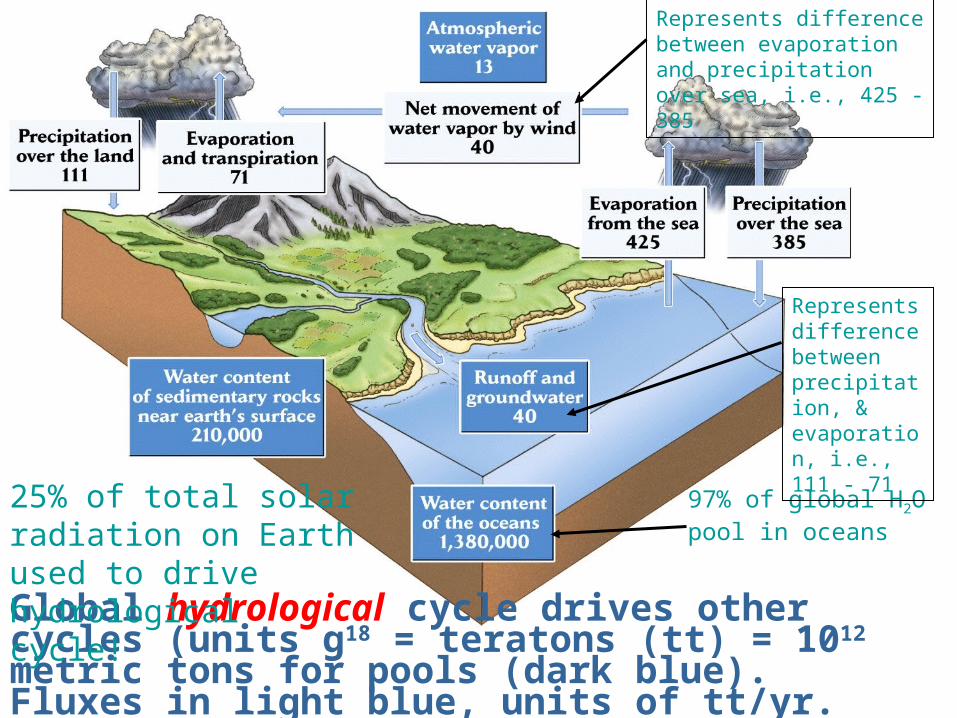
Global hydrological cycle drives other cycles (units g18 = teratons (tt) = 1012 metric tons for pools (dark blue). Fluxes in light blue, units of tt/yr.
97% of global H2O pool in oceans
25% of total solar radiation on Earth used to drive hydrological cycle!
Represents difference between precipitation, & evaporation, i.e., 111 - 71
Represents difference between evaporation and precipitation over sea, i.e., 425 - 385
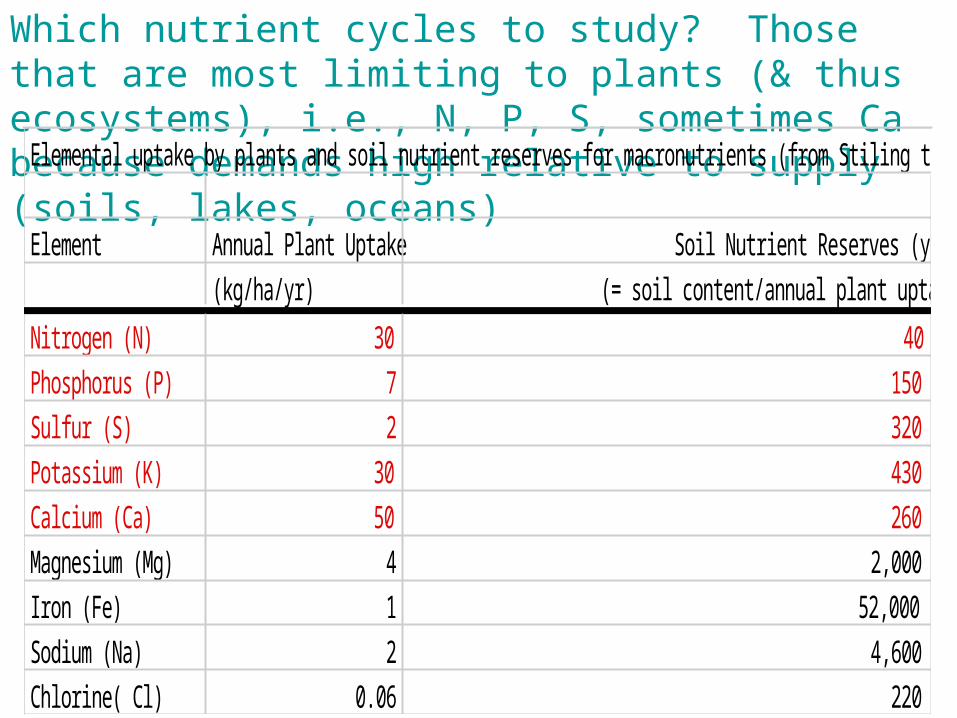
Which nutrient cycles to study? Those that are most limiting to plants (& thus ecosystems), i.e., N, P, S, sometimes Ca because demands high relative to supply (soils, lakes, oceans)
Elemental uptake by plants and soil nutrient reserves for macronutrients (from Stiling text, Table 22.2)
Element Annual Plant Uptake Soil Nutrient Reserves (yr)(kg/ha/yr) (= soil content/annual plant uptake)
Nitrogen (N) 30 40Phosphorus (P) 7 150Sulfur (S) 2 320Potassium (K) 30 430Calcium (Ca) 50 260Magnesium (Mg) 4 2,000Iron (Fe) 1 52,000Sodium (Na) 2 4,600Chlorine( Cl) 0.06 220
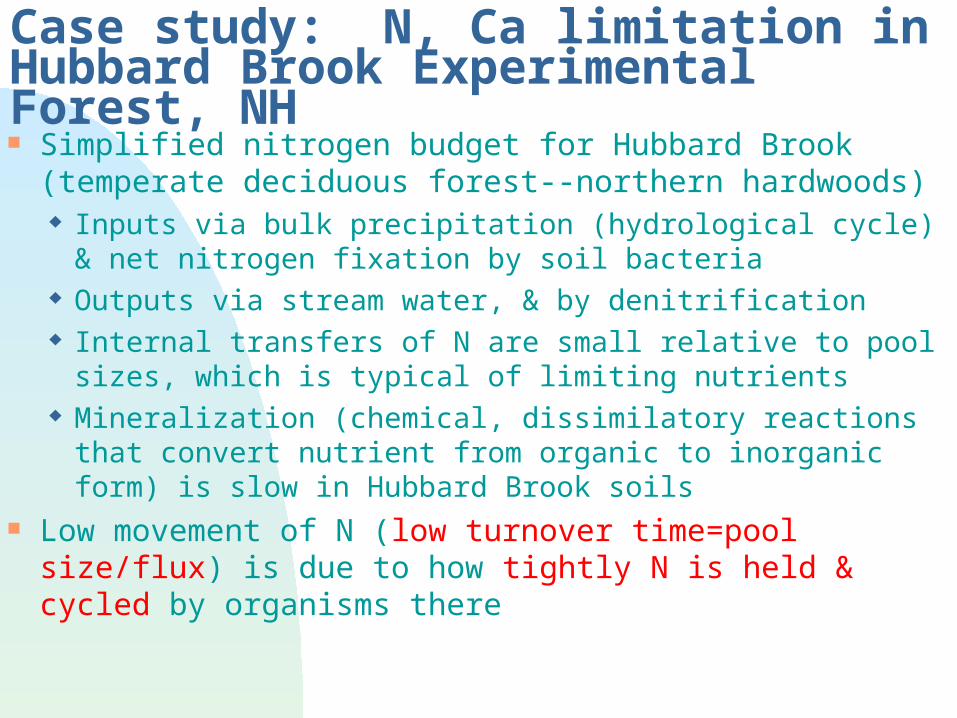
Case study: N, Ca limitation in Hubbard Brook Experimental Forest, NH Simplified nitrogen budget for Hubbard Brook
(temperate deciduous forest--northern hardwoods) Inputs via bulk precipitation (hydrological cycle) & net
nitrogen fixation by soil bacteria Outputs via stream water, & by denitrification Internal transfers of N are small relative to pool sizes,
which is typical of limiting nutrients Mineralization (chemical, dissimilatory reactions that
convert nutrient from organic to inorganic form) is slow in Hubbard Brook soils
Low movement of N (low turnover time=pool size/flux) is due to how tightly N is held & cycled by organisms there
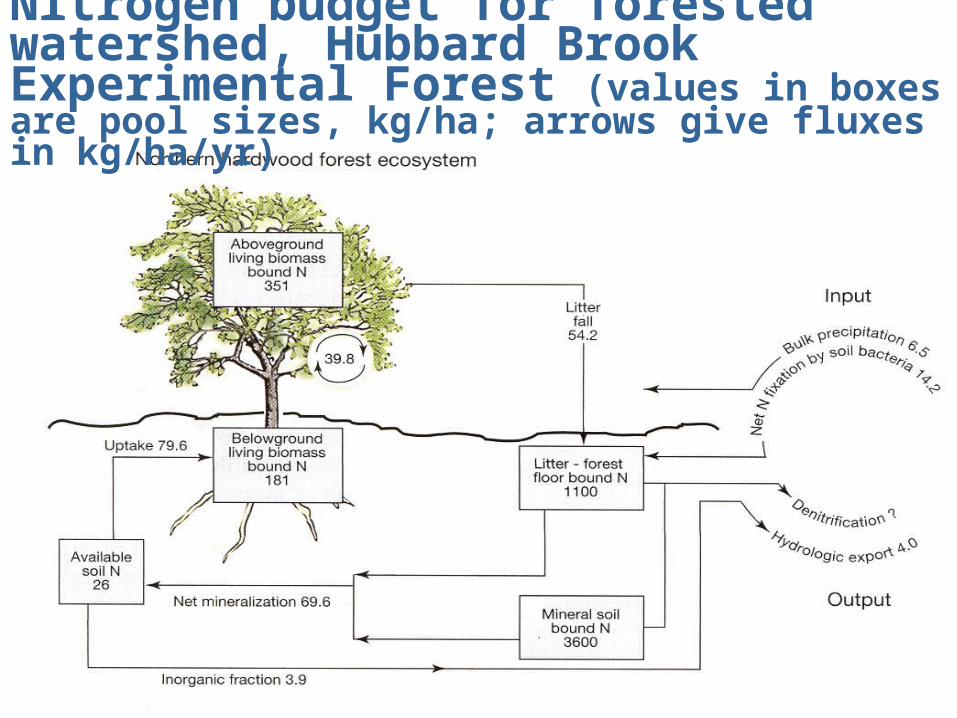
Nitrogen budget for forested watershed, Hubbard Brook Experimental Forest (values in boxes are pool sizes, kg/ha; arrows give fluxes in kg/ha/yr)
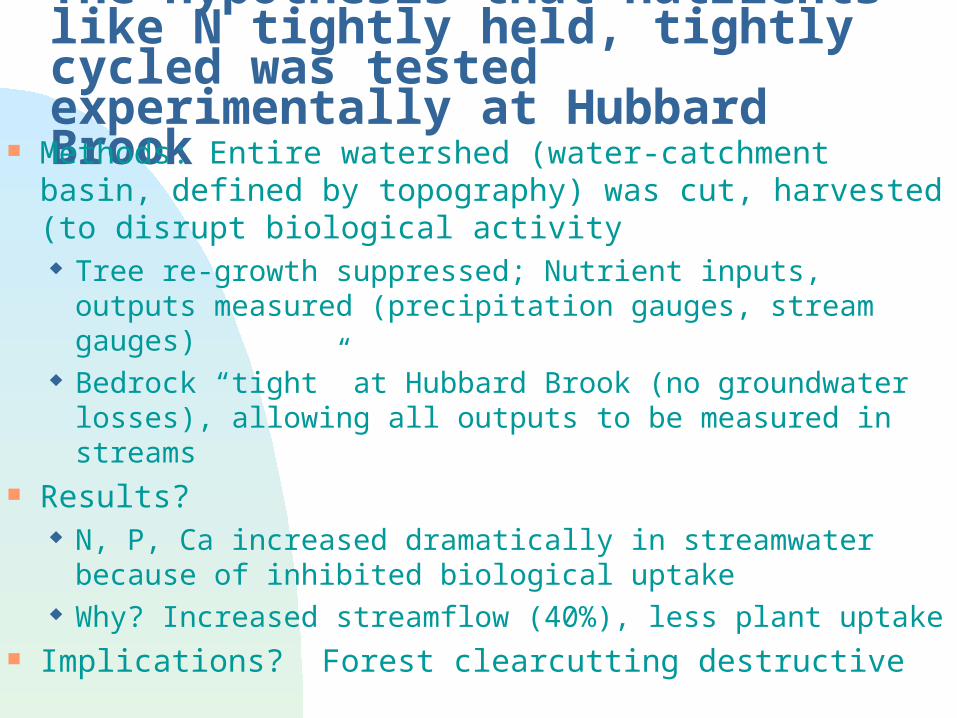
The hypothesis that nutrients like N tightly held, tightly cycled was tested experimentally at Hubbard Brook
Methods: Entire watershed (water-catchment basin, defined by topography) was cut, harvested (to disrupt biological activity Tree re-growth suppressed; Nutrient inputs, outputs
measured (precipitation gauges, stream gauges) Bedrock “tight” at Hubbard Brook (no groundwater
losses), allowing all outputs to be measured in streams Results?
N, P, Ca increased dramatically in streamwater because of inhibited biological uptake
Why? Increased streamflow (40%), less plant uptake Implications? Forest clearcutting destructive
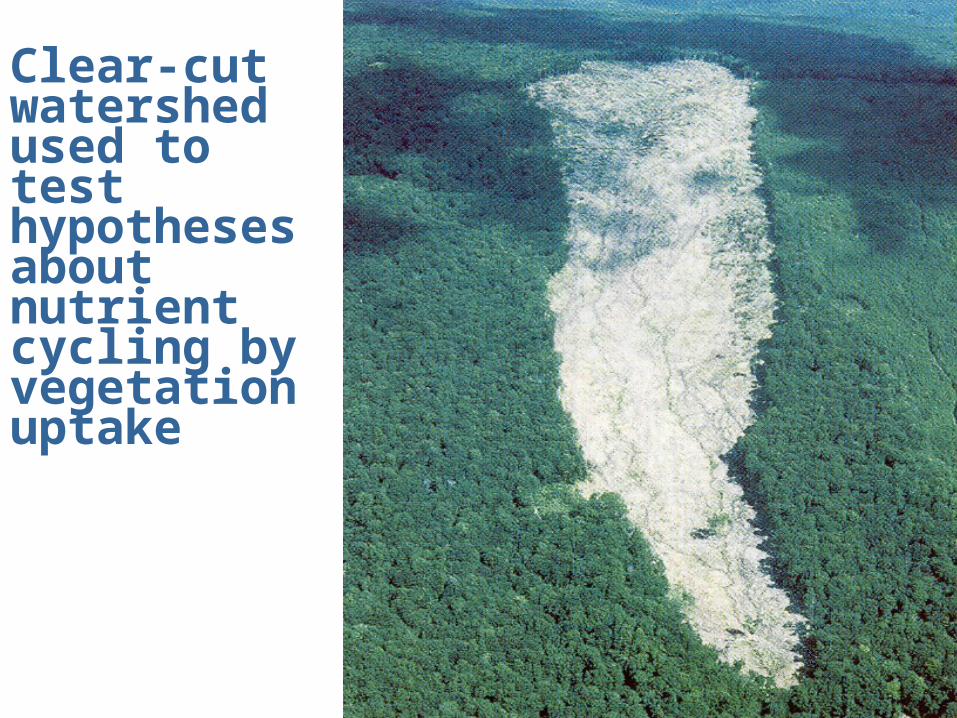
Clear-cut watershed used to test hypotheses about nutrient cycling by vegetation uptake
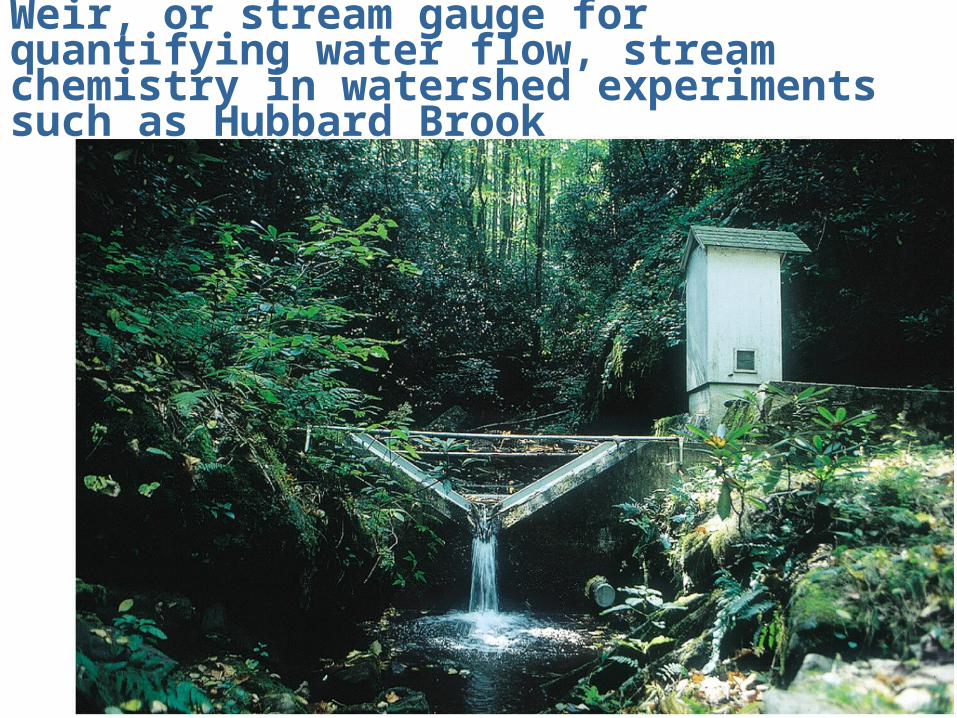
Weir, or stream gauge for quantifying water flow, stream chemistry in watershed experiments such as Hubbard Brook
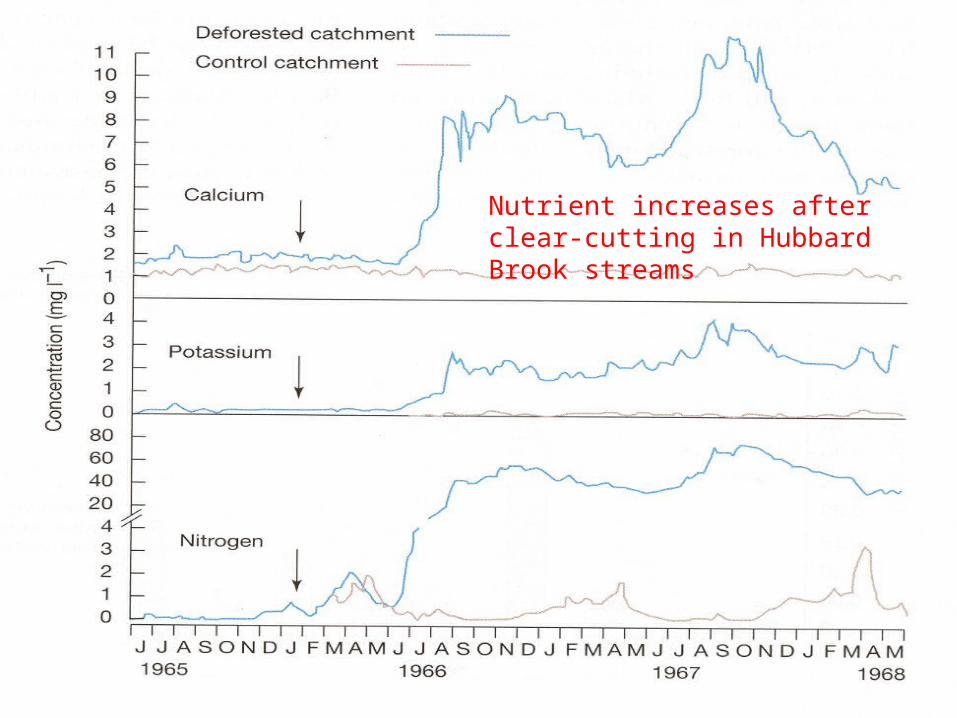
Nutrient increases after clear-cutting in Hubbard Brook streams
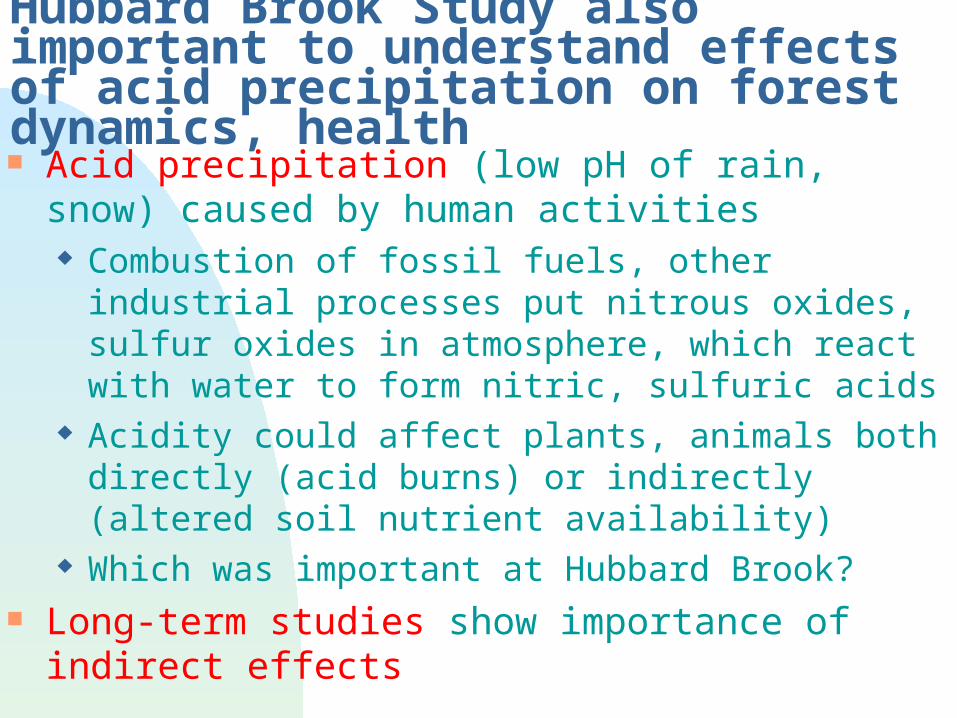
Hubbard Brook Study also important to understand effects of acid precipitation on forest dynamics, health Acid precipitation (low pH of rain, snow) caused by
human activities Combustion of fossil fuels, other industrial processes
put nitrous oxides, sulfur oxides in atmosphere, which react with water to form nitric, sulfuric acids
Acidity could affect plants, animals both directly (acid burns) or indirectly (altered soil nutrient availability)
Which was important at Hubbard Brook? Long-term studies show importance of indirect effects

Long-term recovery from acid precipitation, Hubbard Brook, slow
Clean-air Act, 1970
Factors preventing recovery of ecosystem after Clean-air Act?
•Sulfur emissions remained high (fossil fuels not controlled enough)
•Particulate emissions dropped, but this reduced Ca inputs in rain!
•Long-term leaching of Ca from soils via hydronium ions (attaching to clay particles in soil)
•Ca in tree tissues has dropped, causing widespread forest die-back (spruce, sugar maple)
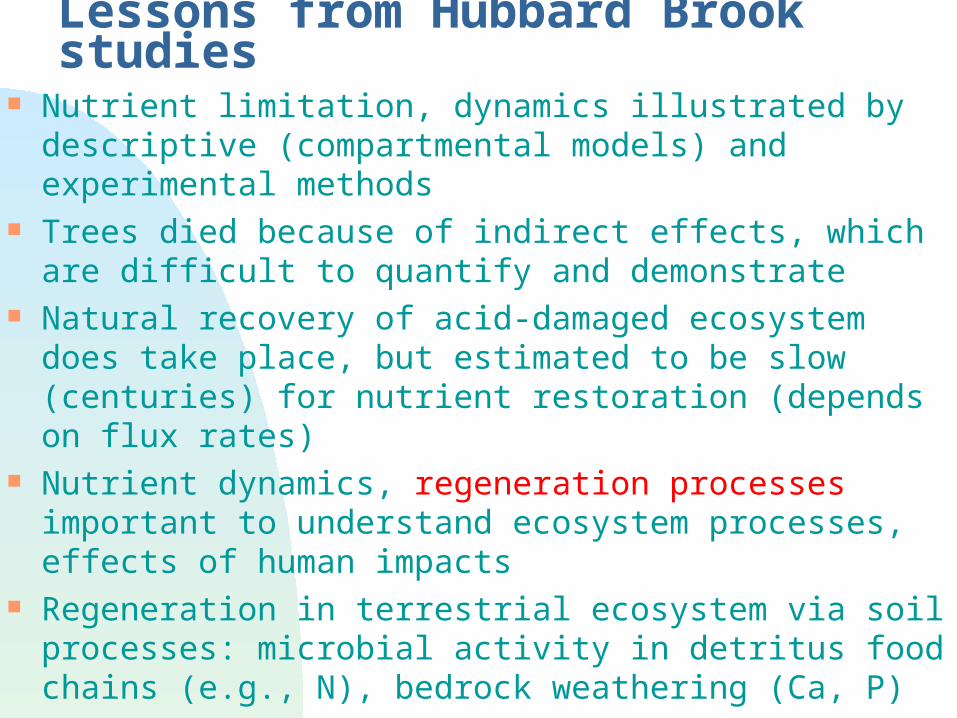
Lessons from Hubbard Brook studies Nutrient limitation, dynamics illustrated by descriptive
(compartmental models) and experimental methods Trees died because of indirect effects, which are
difficult to quantify and demonstrate Natural recovery of acid-damaged ecosystem does
take place, but estimated to be slow (centuries) for nutrient restoration (depends on flux rates)
Nutrient dynamics, regeneration processes important to understand ecosystem processes, effects of human impacts
Regeneration in terrestrial ecosystem via soil processes: microbial activity in detritus food chains (e.g., N), bedrock weathering (Ca, P)
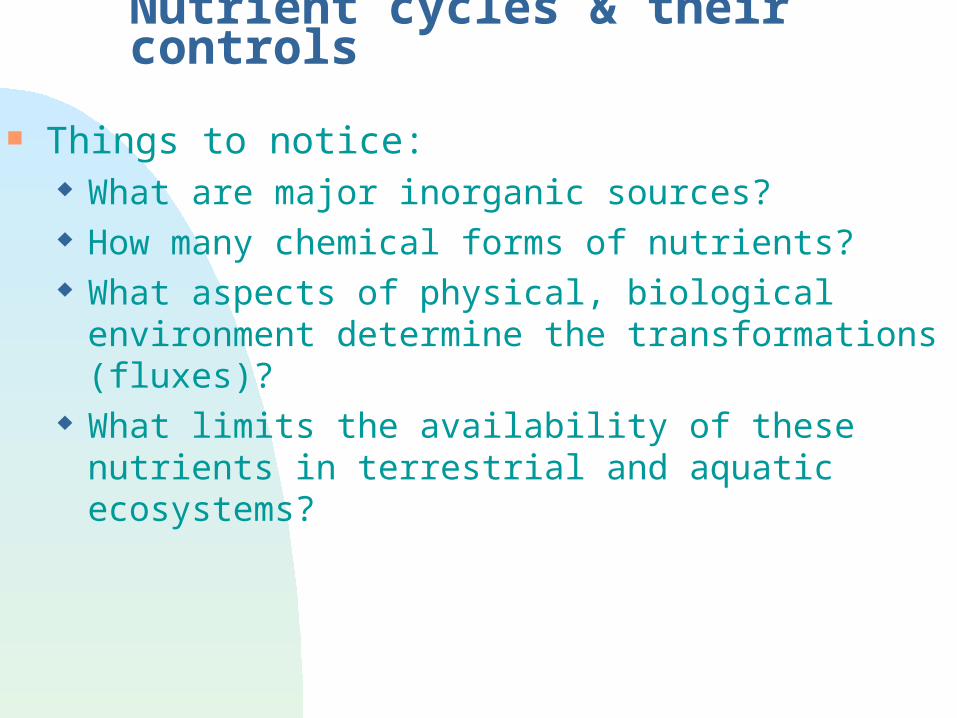
Nutrient cycles & their controls
Things to notice: What are major inorganic sources? How many chemical forms of nutrients? What aspects of physical, biological environment
determine the transformations (fluxes)? What limits the availability of these nutrients in
terrestrial and aquatic ecosystems?
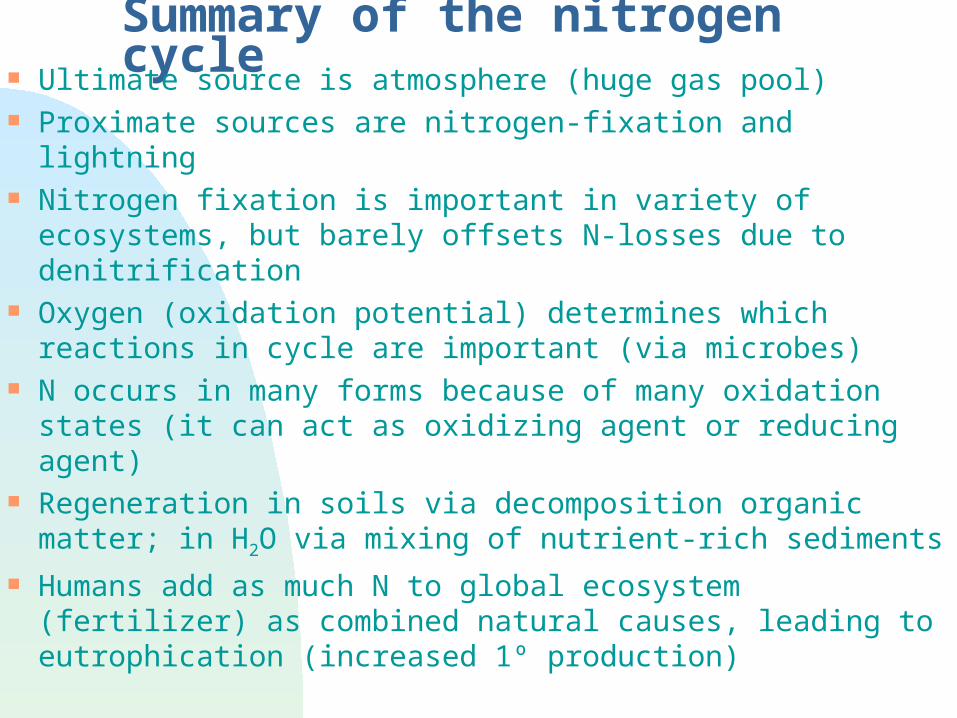
Summary of the nitrogen cycle Ultimate source is atmosphere (huge gas pool) Proximate sources are nitrogen-fixation and lightning Nitrogen fixation is important in variety of ecosystems,
but barely offsets N-losses due to denitrification Oxygen (oxidation potential) determines which
reactions in cycle are important (via microbes) N occurs in many forms because of many oxidation
states (it can act as oxidizing agent or reducing agent) Regeneration in soils via decomposition organic
matter; in H2O via mixing of nutrient-rich sediments Humans add as much N to global ecosystem
(fertilizer) as combined natural causes, leading to eutrophication (increased 1º production)
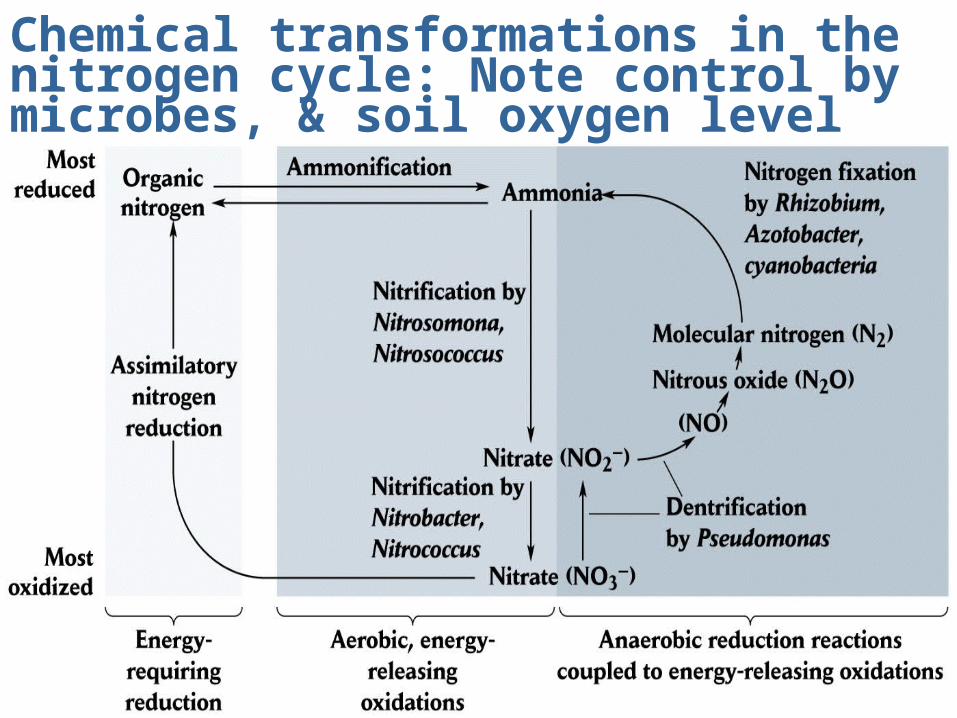
Chemical transformations in the nitrogen cycle: Note control by microbes, & soil oxygen level
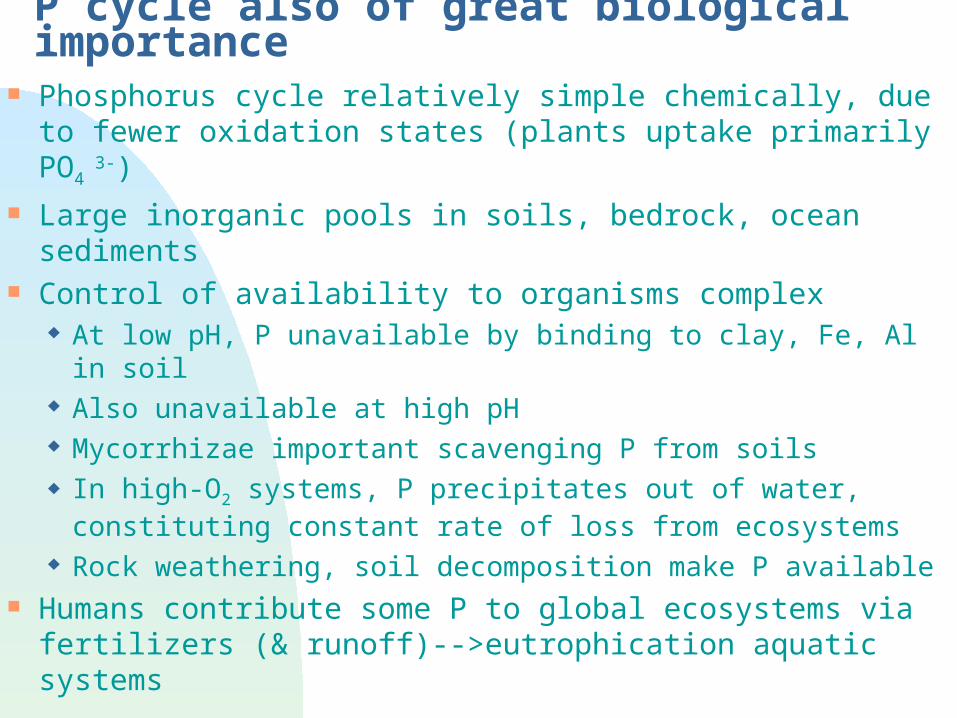
P cycle also of great biological importance
Phosphorus cycle relatively simple chemically, due to fewer oxidation states (plants uptake primarily PO4
3-) Large inorganic pools in soils, bedrock, ocean sediments Control of availability to organisms complex
At low pH, P unavailable by binding to clay, Fe, Al in soil Also unavailable at high pH Mycorrhizae important scavenging P from soils In high-O2 systems, P precipitates out of water,
constituting constant rate of loss from ecosystems Rock weathering, soil decomposition make P available
Humans contribute some P to global ecosystems via fertilizers (& runoff)-->eutrophication aquatic systems
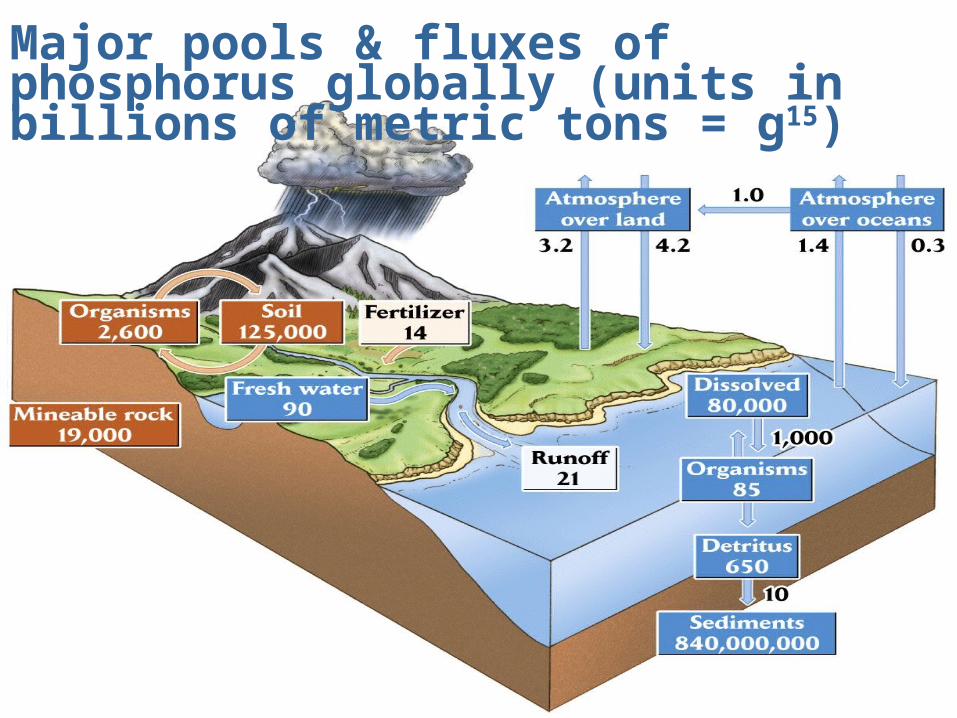
Major pools & fluxes of phosphorus globally (units in billions of metric tons = g15)
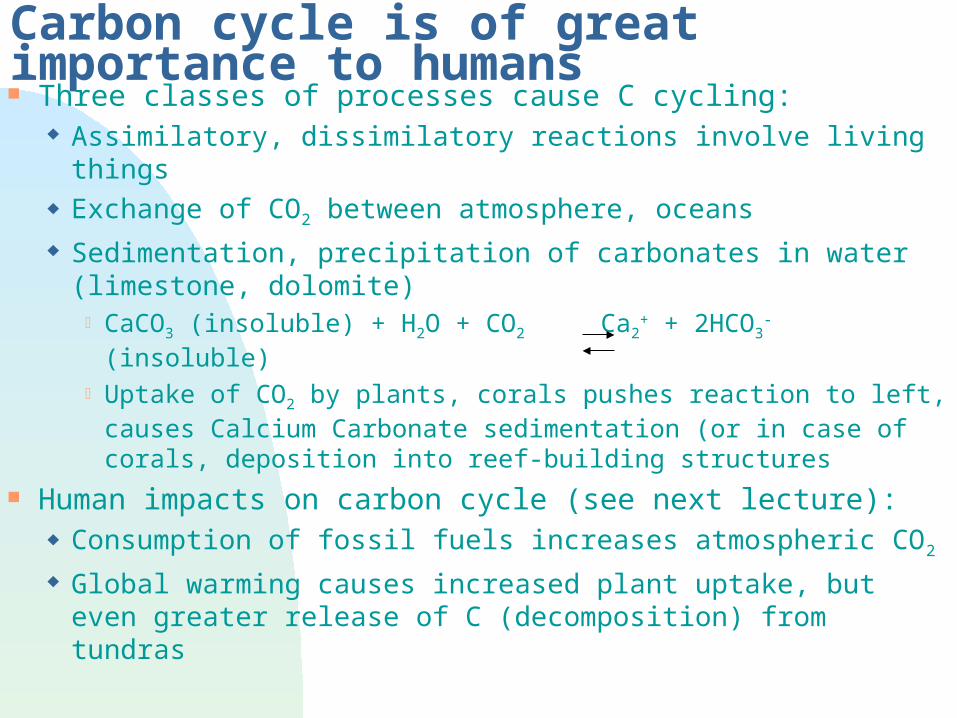
Carbon cycle is of great importance to humans Three classes of processes cause C cycling:
Assimilatory, dissimilatory reactions involve living things Exchange of CO2 between atmosphere, oceans Sedimentation, precipitation of carbonates in water
(limestone, dolomite) CaCO3 (insoluble) + H2O + CO2 Ca2
+ + 2HCO3-
(insoluble) Uptake of CO2 by plants, corals pushes reaction to left,
causes Calcium Carbonate sedimentation (or in case of corals, deposition into reef-building structures
Human impacts on carbon cycle (see next lecture): Consumption of fossil fuels increases atmospheric CO2 Global warming causes increased plant uptake, but
even greater release of C (decomposition) from tundras

Conclusions: Energy (sunlight) ultimately required for chemical
circulation (e.g., water movement), transformations Hubbard Brook Experimental Forest studies show
some factors controlling cycling, availability of N, Ca Different nutrient cycles are very different in terms of
the pools, fluxes, interaction with biological organisms, and impacts of humans
Humans are causing global changes in N, C, P cycles, among others, that are altering the biosphere
Acknowledgements: Some illustrations for this lecture from R.E. Ricklefs. 2001. The Economy of Nature, 5th Edition. W.H. Freeman and Company, New York.