Nutrient Concentrations in the Soil Solution and Shallow ...atlas.massey.ac.nz/courses/171305/Yield...
36
Creating Yield Maps & Turning them into Money Making Management Tools presented by: George Vellidis for the Precision Farming Team National Environmentally Sound Production Agriculture Laboratory Part of Presentation given at Smart Farming, Putra Malaysia
Transcript of Nutrient Concentrations in the Soil Solution and Shallow ...atlas.massey.ac.nz/courses/171305/Yield...

Creating Yield Maps &
Turning them into
Money Making
Management Tools
presented by:
George Vellidis
for the Precision Farming Team
National Environmentally Sound Production Agriculture Laboratory
Part of Presentation given at Smart Farming, Putra Malaysia

Variability, What Variability?
Low altitude aerial
photo of field TR03
Peanuts, Spring 1997

The Power of the Yield Map
1996
peanut
yield
map
Comparison of parasitic nematode
incidence to peanut yield

Sequential Profit Maps
corn map
1996corn map
1995
peanut map
1997
$200 and above
-$200 and below
-$100 to $100
Field A10
Early County, Georgia

Grain Yield Monitors
The first yield monitors
Available commercially for at least 5 years
At least 5 companies offering systemsJohn Deere (GreenStar)
Case IH (AFS – Advanced Farming Systems)
CLAAS – Quantimeter
AGCO – FieldStar
Ag Leader (independent)
Micro Trak (independet)

Customized for more than 70 combines
Reliable, user friendly, excellent support
Display has multiple uses
moisture sensor
force plate
yield sensor
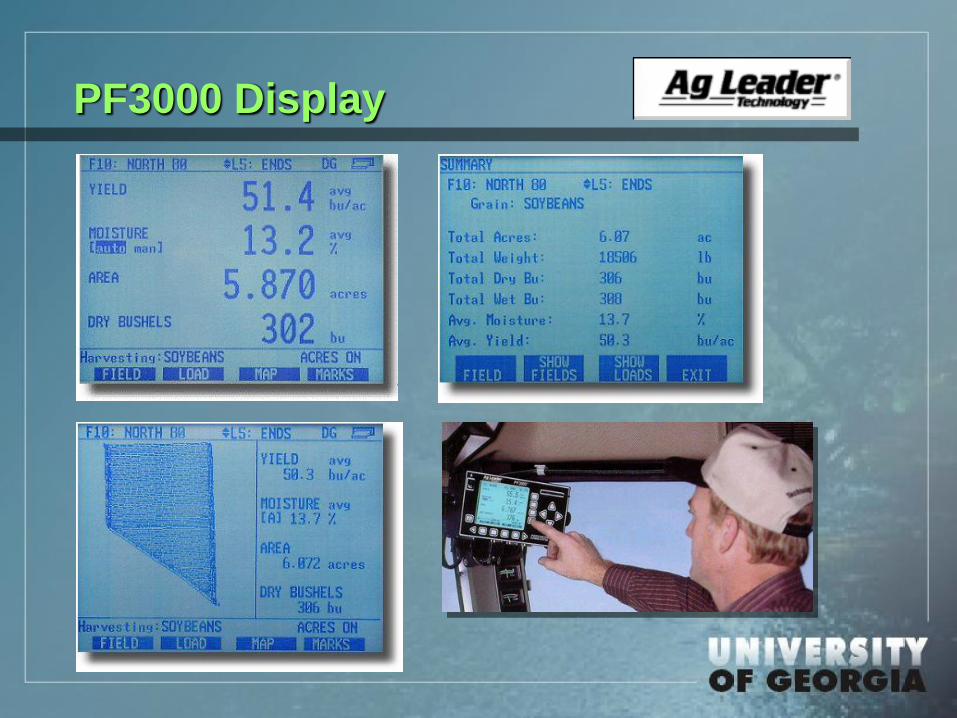
PF3000 Display

Ag Leader force plate yield sensor
Universal displaycan mark problem areas
in or landmarks in fields
touchscreen interface
force plate
yield sensor
moisture sensorAFS display
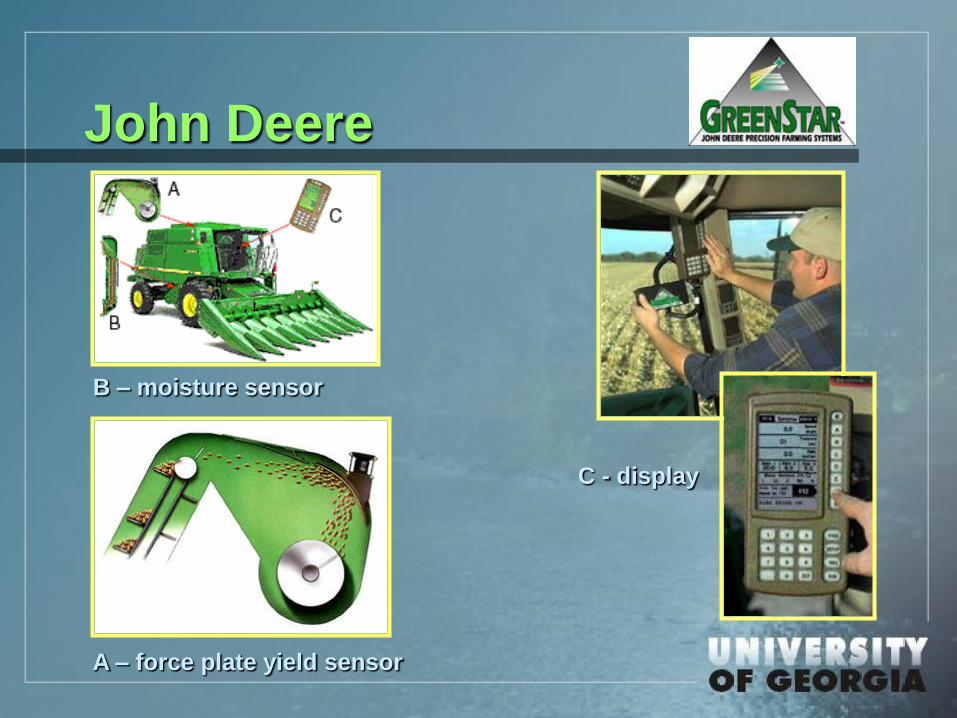
John Deere
C - display
B – moisture sensor
A – force plate yield sensor
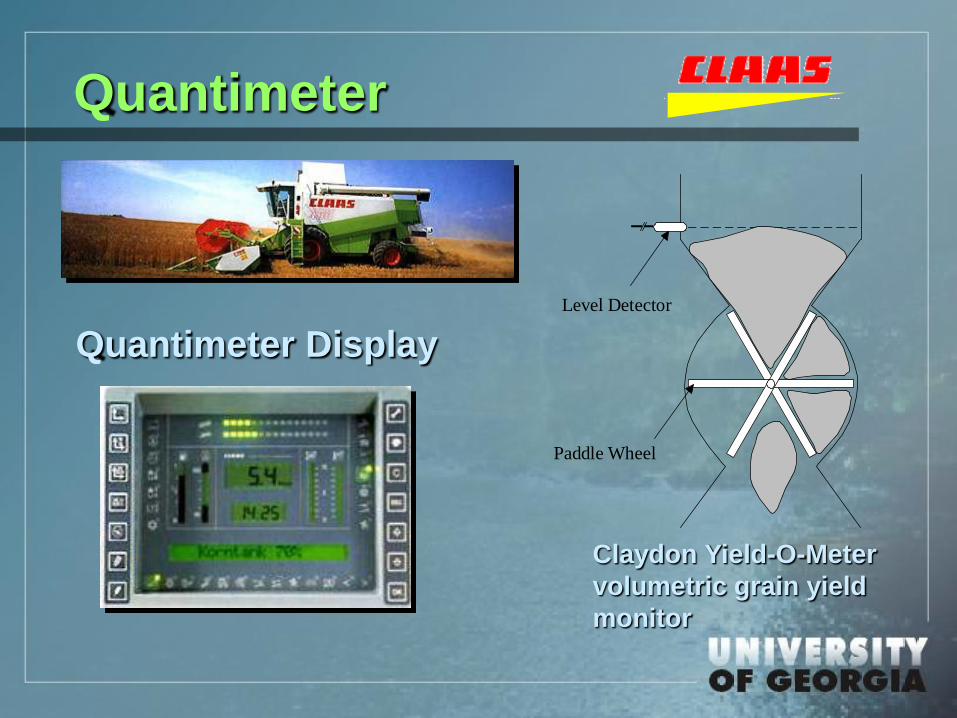
Quantimeter
Quantimeter Display
Level Detector
Paddle Wheel
Claydon Yield-O-Meter
volumetric grain yield
monitor

AGCO
Fieldstar terminal
(standard on all combines)GPS control unit
implement
computerdata card and
data card reader
office PC & printer
(not included)

Interpreting Corn Yield Maps
A – variety change
B – drainage problems
C – low wet area
D – recently cleared land
E – end row compaction
F – soil type change
G – mechanical problem
H – grassed waterway
80 180120 160
Yield – bu/ac

1998 Corn Yield MapAverage Yield: 175.3 bu/ac
Area: 35.4 acres
Malfunctioning Sprinklers

Cotton Yield Monitors
Used mostly in the U.S. and Australia
Available commercially for the past 4 years
At least 4 companies offering systems
Agriplan/Zycom
Ag Leader
Farmscan
Micro Trak

Early Commercial Systems
Zycom
MicroTrakBoth commercially available systems evaluated 1997 &1998

Zycom
Uses 3 infrared light emitters and receptors per sensor
Counts when cotton passing through duct breaks infrared beam
Emitters

Micro-Trak
Uses 8 infrared light emitters and receptors per sensor
Counts when cotton passing through duct breaks infrared beam
closed unit
open unit
Emitters
Graintrak

Field Evaluation
harvest with
yield monitors empty into
boll buggy
weigh load

1998 Yield Maps
63 acres
aerial photo
ZycomMicroTrak
Zycom Micro-Trak

DPL 5415 RR
DPL 5690 RR
0-1/2 Bale
½-1 Bale
1-1½ Bale
1½-2 Bale
2+ Bale
Variety Testing by a Farmer
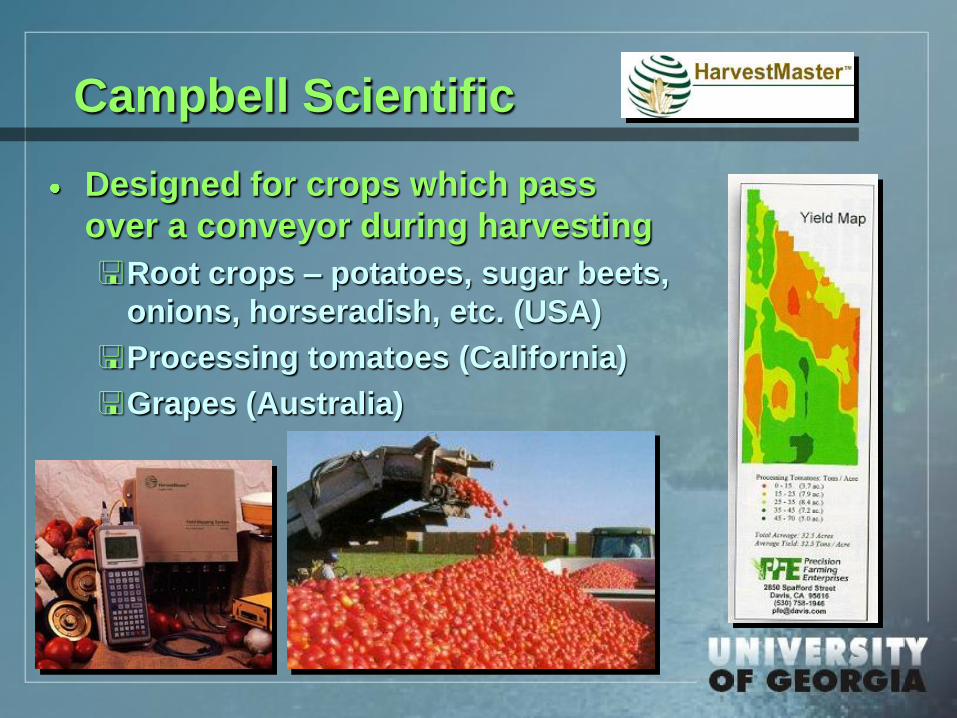
Campbell Scientific
Designed for crops which pass
over a conveyor during harvesting
Root crops – potatoes, sugar beets,
onions, horseradish, etc. (USA)
Processing tomatoes (California)
Grapes (Australia)
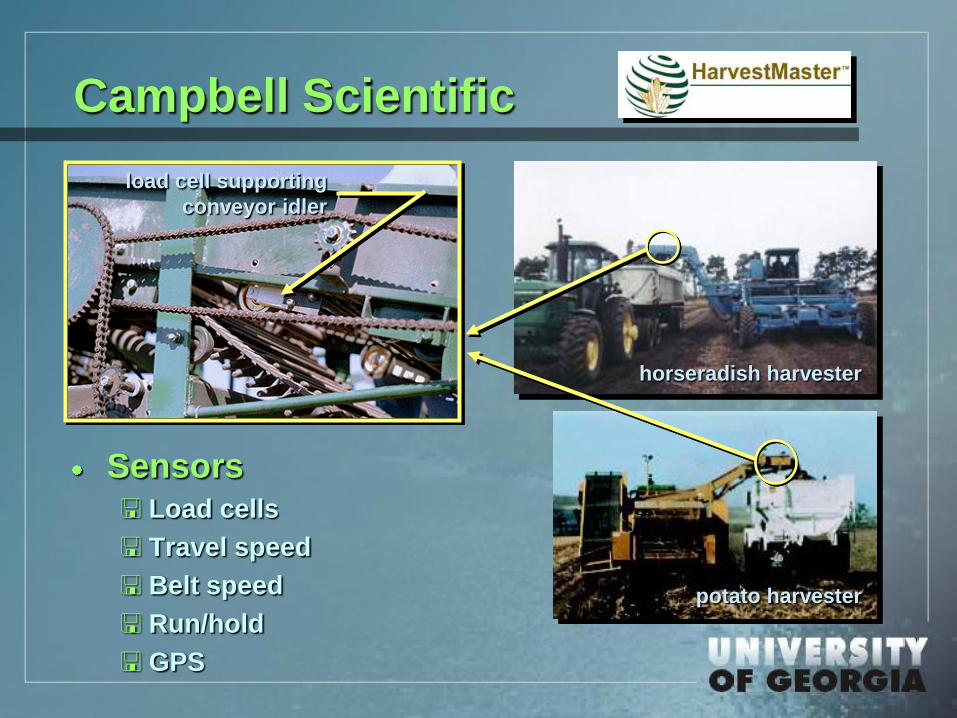
Campbell Scientific
load cell supporting
conveyor idler
Sensors Load cells
Travel speed
Belt speed
Run/hold
GPS
potato harvester
horseradish harvester

Peanut Yield Monitoring System (PYMS) --
Profit Monitoring

PYMS Components
5k load cellsdata acquisition
board
Omnistar DGPS
antenna
palmtop computer
swath width
indicator
junction box

Field Testing: Peanut Harvest
diggingharvesting
harvesting

Field Testing: Emptying Basket

Field Testing: Weighing
• Four Intercomp 5000 kg portable scales
• Accuracy ±1% of total load
• Interconnect cable for totalizing and zeroing
• Sturdy, all aluminum, and self-contained

Tree Crops
Pecans (similar
to walnuts)
Citrus (oranges
and grapefruit)

Pecan Yield Monitoring
Prototype monitor developed during 1998
Preliminary testing conducted over approximately 12 ha
Initial data look promising but many issues yet to be addressed

Pecan Harvesting
shaking the treesharvesting wind rows
harvester conveyer
and traileremptying
harvesting trailer

1998 Pecan Yield Map
Low
Medium
High
Mitchell County, GA
November 1998
11 ha

Citrus Yield Monitoring
Prototype monitor developed
during 1999 by University of Florida
Preliminary testing conducted over
approximately 63 ha

Creating a Yield Map
aerial photo
of orchard
location of
fruit tubs
GPS event
recorder
63 ha

1999 Citrus Yield Map
600
400
400
500
500

Vegetable Yield Monitoring
Just beginning to address in Georgia
Many difficulties
Market vegetables harvested manually
by migrant laborers
Laborers paid by amount harvested
Harvesting procedures vary greatly
from farm to farm

Who’s Job Is It?
It’s the research community’s responsibility to develop and evaluate yield monitoring technologies so that our clientele has assurance in these products.