NUREG/IA-0507, 'International Agreement Report - Natural ...
69
NUREG/IA-0507 Natural Circulation (Interruption) Analysis with MELCOR 2.2 during Asymmetric Cooldown Transients Prepared by: Martina Adorni, Anis Bousbia Salah, and Jacques Vlassenbroeck Bel V Rue Walcourt 148 Walcourtstraat 1070 Brussels, Belgium Hossein Esmaili, NRC Project Manager Division of Systems Analysis Office of Nuclear Regulatory Research U.S. Nuclear Regulatory Commission Washington, DC 20555-0001 Manuscript Completed: September 2018 Date Published: March 2019 Prepared as part of The Agreement on Research Participation and Technical Exchange Under the Cooperative Severe Accident Research Program (CSARP) Published by U.S. Nuclear Regulatory Commission
Transcript of NUREG/IA-0507, 'International Agreement Report - Natural ...

NUREG/IA-0507
Natural Circulation (Interruption) Analysis with MELCOR 2.2 during Asymmetric Cooldown Transients
Prepared by: Martina Adorni, Anis Bousbia Salah, and Jacques Vlassenbroeck
Bel V Rue Walcourt 148 Walcourtstraat 1070 Brussels, Belgium
Hossein Esmaili, NRC Project Manager
Division of Systems Analysis Office of Nuclear Regulatory Research U.S. Nuclear Regulatory Commission Washington, DC 20555-0001
Manuscript Completed: September 2018 Date Published: March 2019
Prepared as part of The Agreement on Research Participation and Technical Exchange Under the Cooperative Severe Accident Research Program (CSARP)
Published by U.S. Nuclear Regulatory Commission

AVAILABILITY OF REFERENCE MATERIALSIN NRC PUBLICATIONS
NRC Reference Material
As of November 1999, you may electronically access NUREG-series publications and other NRC records at NRC’s Library at www.nrc.gov/reading-rm.html. Publicly released records include, to name a few, NUREG-series publications; Federal Register notices; applicant, licensee, and vendor documents and correspondence; NRC correspondence and internal memoranda; bulletins and information notices; inspection and investigative reports; licensee event reports; and Commission papers and their attachments.
NRC publications in the NUREG series, NRC regulations, and Title 10, “Energy,” in the Code of Federal Regulations may also be purchased from one of these two sources.
1. The Superintendent of DocumentsU.S. Government Publishing OfficeMail Stop IDCCWashington, DC 20402-0001Internet: bookstore.gpo.govTelephone: (202) 512-1800Fax: (202) 512-2104
2. The National Technical Information Service5301 Shawnee RoadAlexandria, VA 22312-0002www.ntis.gov1-800-553-6847 or, locally, (703) 605-6000
A single copy of each NRC draft report for comment isavailable free, to the extent of supply, upon writtenrequest as follows:
Address: U.S. Nuclear Regulatory Commission Office of Administration Multimedia, Graphics, and Storage & Distribution Branch Washington, DC 20555-0001 E-mail: [email protected]: (301) 415-2289
Some publications in the NUREG series that are posted at NRC’s Web site address www.nrc.gov/reading-rm/doc-collections/nuregs are updated periodically and may differ from the last printed version. Although references to material found on a Web site bear the date the material was accessed, the material available on the date cited may subsequently be removed from the site.
Non-NRC Reference Material
Documents available from public and special technical libraries include all open literature items, such as books, journal articles, transactions, Federal Register notices, Federal and State legislation, and congressional reports. Such documents as theses, dissertations, foreign reports and translations, and non-NRC conference proceedings may be purchased from their sponsoring organization.
Copies of industry codes and standards used in asubstantive manner in the NRC regulatory process are maintained at—
The NRC Technical LibraryTwo White Flint North11545 Rockville PikeRockville, MD 20852-2738
These standards are available in the library for reference use by the public. Codes and standards are usually copyrighted and may be purchased from the originating organization or, if they are American National Standards, from—
American National Standards Institute11 West 42nd StreetNew York, NY 10036-8002www.ansi.org(212) 642-4900
Legally binding regulatory requirements are stated only in laws; NRC regulations; licenses, including technical specifications; or orders, not in NUREG-series publications. The views expressed in contractor prepared publications in this series are not necessarily those of the NRC.
The NUREG series comprises (1) technical and adminis-trative reports and books prepared by the staff (NUREG–XXXX) or agency contractors (NUREG/CR–XXXX), (2)proceedings of conferences (NUREG/CP–XXXX), (3) reportsresulting from international agreements (NUREG/IA–XXXX),(4) brochures (NUREG/BR–XXXX), and (5) compilations oflegal decisions and orders of the Commission and Atomicand Safety Licensing Boards and of Directors’ decisionsunder Section 2.206 of NRC’s regulations (NUREG–0750).
DISCLAIMER: This report was prepared under an international cooperative agreement for the exchange of technical information. Neither the U.S. Government nor any agency thereof, nor any employee, makes any warranty, expressed or implied, or assumes any legal liability or responsibility for any third party’s use, or the results of such use, of any information, apparatus, product or process disclosed in this publication, or represents that its use by such third party would not infringe privately owned rights.

NUREG/IA-0507
Natural Circulation (Interruption) Analysis with MELCOR 2.2 during Asymmetric Cooldown Transients Prepared by: Martina Adorni, Anis Bousbia Salah, and Jacques Vlassenbroeck
Bel V Rue Walcourt 148 Walcourtstraat 1070 Brussels, Belgium
Hossein Esmaili, NRC Project Manager
Division of Systems Analysis Office of Nuclear Regulatory Research U.S. Nuclear Regulatory Commission Washington, DC 20555-0001
Manuscript Completed: September 2018 Date Published: March 2019
Prepared as part of The Agreement on Research Participation and Technical Exchange Under the Cooperative Severe Accident Research Program (CSARP)
Published by U.S. Nuclear Regulatory Commission


iii
ABSTRACT
This document describes the analysis carried out with MELCOR 2.2 computer code of the natural circulation (interruption) phenomena during asymmetric cooldown transients in a 3-loop nuclear power plant (NPP) configuration. Indeed, thermal-hydraulic analysis is an important issue for severe accident codes, it constitutes the starting point of the analysis before the occurrence of the core degradation. The considered accident scenario consists in a feedwater line break (FWLB) combined with loss of offsite power (LOOP) in a generic 1000 MWe 3-loop pressurized water reactor (PWR).
For this study, a Bel V MELCOR 3-loop PWR model has been developed. The main goal is to verify the capabilities of the MELCOR code in predicting the establishment of the natural circulation flow regime, the eventual occurrence of the natural circulation interruption (NCI) phenomena and to compare to the results from an equivalent analysis performed using the thermal-hydraulic system code CATHARE. The activity is completed by carrying out sensitivity analyses in order to identify the key MELCOR modeling parameters.
The calculation results confirm the Bel V MELCOR 3-loop plant model capability and suitability for its intended purpose in support of regulatory activities.

v
FOREWORD
MELCOR is a fully integrated, engineering-level computer code that models the progression of severe accidents (SA) in light water reactor (LWR) nuclear power plants. A broad spectrum of severe accident phenomena is treated in MELCOR in a unified framework. Among these, the thermal-hydraulic (TH) response in the reactor coolant system is addressed in the current study. MELCOR is the reference code used by Bel V for severe accident analyses, and, to date, it has been mainly used in the framework of Bel V R&D program.
Belgium and US have signed an agreement on Cooperative Severe Accident Research Program (CSARP). Bel V is responsible for the CSARP agreement in Belgium since 2012.
Bel V is acting, since 2008, as a subsidiary of the Belgian Federal Agency for Nuclear Control (FANC). Bel V groups nuclear experts who are performing activities in the area of nuclear safety and radiation protection. Its mission is to contribute to the safety of the population and of the environment.
This report was prepared to share the code application experience with other CSARP members.


vii
TABLE OF CONTENTS
ABSTRACT………………………………………………………….……………………….….……….iii
FOREWORD…………………………………………………..…………………….…...…….…………v
TABLE OF CONTENTS………………………………………………………….….….………..….…vii
LIST OF FIGURES…………………………………………………………..…….…………………….ix
LIST OF TABLES……………………….……………………………….…….…..………….…….…..xi
EXECUTIVE SUMMARY………………………..………….…………………………….…..….…....xiii
ABBREVIATIONS AND ACRONYMS……….………………………………………………..……..xv
1 INTRODUCTION...………………………………………………………………………………….....1 1.1 Background……………………………..……..………………………………………….......….…1 1.2 Objective.....................................................................................................................................2 1.3 Outline of the Report……………………………………………………………………………….2
2 ACCIDENT SCENARIO DESCRIPTION……………………………………………………………5 2.1 Operator Actions……………………………………………………………………...…………….6 2.2 MELCOR Initial and Boundary Conditions: Base Case (A)……………………….………........6 2.3 Sensitivity Analyses Definitions: Cases B to D……………………………………….................6 2.4 Additional Case E: Single-Phase NC……………………………………………………………..7
3 MELCOR MODEL OF THE 3-LOOP PLANT ....................................................................... 11 3.1 Overview…………………………………………………………………………………………...11 3.2 Main Modeling Assumptions………………………………………………………………..……12
3.2.1 RCP Model ...................................................................................................... 12 3.2.2 Steam Generator ............................................................................................. 13 3.2.3 Cooldown Procedure ....................................................................................... 13 3.2.4 Decay Heat ...................................................................................................... 14
4 RESULTS OF THE ANALYSES .......................................................................................... 17 4.1 Steady-State Results……………………….……………………………………………………..17 4.2 Transient Results………………………………………………………………………………….20
4.2.1 Base Case (A) ................................................................................................. 20 4.2.2 Cases B: Impact of Cooling Rate on NCI Occurrence ...................................... 22 4.2.3 Cases C: Impact of Decay Heat (or Time After Scram) on NC(I)Transition …..22 4.2.4 Cases D: Impact of RCP Resistance Set to Zero on NC(I) Transition .............. 23 4.2.5 Single-Phase NC: Case E ................................................................................ 24
5 CONCLUSIONS ................................................................................................................... 31
6 REFERENCES ..................................................................................................................... 33
APPENDIX A RESULTS OF BASE CASE (A) (12 K/H....……………………………….………A-1 APPENDIX B RESULTS OF NATURAL CIRCULATION STUDY: CASE E………….…..…...B-1


ix
LIST OF FIGURES
Figure 2-1 RCP Coast-Down Input ........................................................................................ 7 Figure 2-2 Decay Power Input: Conservative (Red) and Best Estimate (Blue) ...................... 8 Figure 3-1 MELCOR 2.2: 3-Loop PWR Reactor Coolant System Hydrodynamic
Nodalization ....................................................................................................... 15 Figure 4-1 MELCOR Pressure and Pressure Drops RPV (Left) and Loop A (Right)
and Indication of Available Reference Data........................................................ 18 Figure 4-2 Base Case: MELCOR and CATHARE CL and HL Temperatures ....................... 26 Figure 4-3 Base Case: MELCOR and CATHARE CL Temperatures and Mass Flow
Rates ................................................................................................................. 26 Figure 4-4 Case B1: MELCOR and CATHARE CL Temperatures and Mass Flow Rates .... 27 Figure 4-5 Cases B: MELCOR CL Temperatures and Mass Flow Rates, Sensitivity
Study on Cooling Rate ....................................................................................... 27 Figure 4-6 Cases C: MELCOR CL Temperatures and Mass Flow Rates, Impact of
Decay Heat on NCI Occurrence ......................................................................... 28 Figure 4-7 Cases C: MELCOR CL Temperatures and Mass Flow Rates, Sensitivity
Study on Decay Heat ......................................................................................... 28 Figure 4-8 Cases D: MELCOR CL Temperatures and Mass Flow Rates: Impact of
RCP Resistance Set to Zero on NCI Occurrence ............................................... 29 Figure A-1 Base Case: Loop A Temperatures: CL (Blue) and HL (Red) Temperatures ..... A-1 Figure A-2 Base Case: Loop B Temperatures: CL (Blue) and HL(Red) Temperatures ...... A-1 Figure A-3 Base Case: Loop C Temperatures: CL (Blue) And HL (Red)
Temperatures .................................................................................................. A-2 Figure A-4 Base Case: Loops Mass Flow Rates: Loop A (Blue), Loop B (Red) and
Loop C (Green) ................................................................................................ A-2 Figure A-5 Base Case: ADVs and SVs Opening Fractions (Resulting from the
Imposed Cooldown Curve from CATHARE) ..................................................... A-3 Figure A-6 Base Case: Inlet and Outlet Core Temperatures .............................................. A-3 Figure A-7 Base Case: UH Temperatures and Pressures ................................................. A-4 Figure A-8 Base Case: CVCS Injection and Letdown ........................................................ A-4 Figure A-9 Base Case: Pressurizer Pressures .................................................................. A-5 Figure A-10 Base Case: SGs Pressures ............................................................................. A-5 Figure A-11 Base Case: SGs Levels ................................................................................... A-6 Figure A-12 Base Case: SG-A Mass of Water Pool, Vapor and Total .................................. A-6 Figure A-13 Base Case: SG-B Mass of Water Pool, Vapor and Total .................................. A-7 Figure A-14 Base Case: SG-C Mass of Water Pool, Vapor and Total .................................. A-7 Figure A-15 Base Case: Heat Exchange in SGs ................................................................. A-8 Figure A-16 Base Case: Core Power ................................................................................... A-8

x
Figure B-1 Natural Circulation Study: Loop A Temperatures: CL (Blue) and HL (Red) Temperatures .................................................................................................. B-1
Figure B-2 Natural Circulation Study: Loop B Temperatures: CL (Blue) and HL (Red) Temperatures .................................................................................................. B-1
Figure B-3 Natural Circulation Study: Loop C Temperatures: CL (Blue) and HL (Red) Temperatures .................................................................................................. B-2
Figure B-4 Natural Circulation Study: Loops Mass Flow Rates: Loop A (Blue), Loop B (Red) and Loop C (Green) ............................................................................... B-2
Figure B-5 Natural Circulation Study: Loops Mass Flow Rates: Loop A (Blue), Loop B (Red) and Loop C (Green) - Zoom ................................................................... B-3
Figure B-6 Natural Circulation Study: Core Temperatures ................................................. B-3 Figure B-7 Natural Circulation Study: Core Bypass (Blue) and Core (Red) Mass Flow
Rates................................................................................................................ B-4 Figure B-8 Natural Circulation Study: Core Bypass (Blue) and Core (Red) Mass Flow
Rates - Zoom ................................................................................................... B-4

xi
LIST OF TABLES
Table 2-1 Main Events of the Base Case (and Cases B to D) .............................................. 8 Table 2-2 Main Events of the Single-Phase NC Test, Case E .............................................. 9 Table 2-3 List of Cases Analyzed......................................................................................... 9 Table 4-1 Results of Steady-State Analysis ....................................................................... 19 Table 4-2 Base Case: Resulting Sequence of Main Events. .............................................. 25 Table 4-3 Summary of MELCOR Results ........................................................................... 25


xiii
EXECUTIVE SUMMARY
This document describes the analysis carried out using MELCOR 2.2 code of the natural circulation (interruption) phenomena during asymmetric cooldown transients in a 3-loop nuclear power plant (NPP) configuration. Indeed, thermal-hydraulic (TH) analysis is an important issue for severe accident codes since it constitutes a starting point of the analysis that precedes the core degradation occurrence.
The considered scenario consists of a feedwater line break (FWLB) accident combined with loss of offsite power (LOOP) in a generic 1000 MWe 3-loop pressurized water reactor (PWR).
When the primary forced flow is lost, the nuclear reactor core decay heat is generally removed through natural circulation (NC) convection: the flow is driven by the coolant density differences in the steam generators (SGs) (heat sink) and in the reactor vessel (heat source).
In such conditions, with one affected SG which is emptied and isolated on its secondary side SG, a cooldown procedure at prescribed cooldown (and depressurization) rate is started. In general, the emergency response guidelines (ERG) limit the cooldown rate in a range that prevents steam bubble formation under the reactor vessel head. However, under asymmetric cooldown conditions between the RCS loops, natural circulation interruption (NCI) might occur in the inactive (i.e., non-cooling) loop. This scenario may prevent the reactor coolant system (RCS) to reach the entry conditions for the residual heat removal system (RHRS).
For this study, a MELCOR 3-loop PWR model has been developed. The main goal is to verify the capabilities of the MELCOR code in predicting the natural circulation interruption (NCI) phenomena and to compare to the results from an equivalent CATHARE calculation. The activity is completed by carrying out sensitivity analyses, performed in order to identify the key MELCOR modeling parameters.
The results of the CATHARE model which was validated against (among other) experimental data in the framework of experimental projects like PKL and ROSA and on plant available data, are considered as reference in the current study.
It is noted that some boundary conditions are selected for comparison purposes only and might not represent real plant cases.
The calculation results show: • the MELCOR 3-loop plant model capability to simulate NC(I) phenomena, as well as the
correctness of the implemented modeling assumptions;• the sensitivity of the NC(I) phenomena (at least/mainly) to the conditions that could lead
or not to the occurrence of the NCI phenomenon such as the decay heat level(conservative vs best estimate or time after scram) and RCP resistance value.
To conclude, the calculation results confirm the Bel V MELCOR 3-loop plant model capability and suitability for its intended purpose in support of regulatory activities.


xv
ABBREVIATIONS AND ACRONYMS
ADV Atmospheric Discharge Valve AFW Auxiliary Feed Water Bel V Belgian Technical Support Organization CF Control Function CL Cold Leg CVCS Chemical and Volume Control System CVH Control Volume Hydrodynamics (MELCOR Package) DC DownComer EOT End of Transient ERG Emergency Response Guideline FW Feed Water FWLB Feed Water Line Break HL Hot Leg LOOP Loss of Offsite Power LSTF Large Scale Test Facility LWR Light Water Reactor MSIV Main Steam Isolation Valve NC Natural Circulation NCI Natural Circulation Interruption NPP Nuclear Power Plant PKL Primär-KreisLauf PRZ Pressurizer PWR Pressurized Water Reactor RCP Reactor Coolant Pump RCS Reactor Coolant System RHRS Residual Heat Removal System ROSA Rig-of-Safety Assessment RPV Reactor Pressure Vessel RV Relief Valve SA Severe Accident SD Steam Dump to Condenser SG Steam Generator SOT Start of the Transient SV Safety Valve TH Thermal-Hydraulic TU Turbine UH Upper Head


1
1 INTRODUCTION
This document describes the MELCOR 2.2 TH code analysis of the NC(I) during asymmetric cooldown transients in a 3-loop NPP configuration. The objective is to assess the TH capability of the code during the transient period that precedes the core degradation phase. MELCOR is the reference code used by Bel V for severe accident analysis, and, to date, it has been mainly used in the framework of the Bel V R&D program.
1.1 Background
The considered scenario consists in a FWLB accident combined with LOOP in a generic 1000 MWe 3-loop PWR. Actually, when the primary flow is lost, the nuclear reactor core decay heat is removed through NC convection: the flow is driven by the coolant density differences in the SGs (heat sink) and in the reactor vessel (heat source).
In such conditions, with one affected SG which is emptied and isolated on its secondary side SG, a cooldown procedure at prescribed cooldown (and depressurization) rate is started. In general, the emergency response guidelines (ERG) limit the cooldown rate in a range that prevents steam bubble formation under the reactor vessel head. However, under asymmetric cooldown conditions between the RCS loops, NCI might occur in the inactive (i.e., non-cooling) loop. This scenario may prevent the RCS to reach the entry conditions for the residual heat removal system (RHRS), i.e. RCS temperature of 450 K.
In particular, the NCI occurrence in the loop with the affected (emptied) SG (SG-A) and RCS pressure of 3 MPa on its secondary side is the result of a counter-buoyancy force buildup in its U-tubes. Due to continuous decrease of the temperature in the hot leg, a negative temperature difference between the ascending and descending part of the SG-A U-tubes will take place leading to a progressive flow decrease. Flow stagnation will occur if the counter driving forces balance the driving force over the reactor vessel.
Actually, as pointed out in [1][3], a stagnant loop may hinder the overall RCS cooling process and the transient may evolve toward a degenerated state. Some recent experimental and analytical studies [1][2][3] identify the number of affected (non-cooling) loops as well as the secondary side conditions as the main parameters in determining the cooldown rate that maintain NC in the affected loops. The mentioned studies show that in some cases, the RHRS entry conditions could not be reached, i.e. RCS temperature of 450 K, notwithstanding the fact that NC is maintained in the intact loop(s).
The above mentioned experimental and analytical activities are the starting point of this study. The selection of the scenarios to be investigated by means of MELCOR severe accident code is based on the calculation results obtained by the advanced TH system code CATHARE 2/V2.5_2/mod8.1 1 developed by CEA, EDF, AREVA, and IRSN. Using CATHARE NC(I)-study explorations, for the current comparison activities only a selection of accident scenarios is analyzed (i.e. not all the CATHARE studies are repeated).

2
1.2 Objective
The objectives of this study are: • to assess the MELCOR capabilities in predicting correctly the establishment of the NC
flow regime.• to verify whether or not the NCI phenomena is reproduced by MELCOR and, if it is the
case, on which modeling conditions• to investigate how sensitive are the MELCOR modeling key parameters on the
simulation results; the input parameters to be varied are selected in order to getMELCOR calculation results close to the CATHARE ones
• to confirm the Bel V MELCOR 3-loop PWR model capabilities in simulating importantphenomena (i.e. NC and NCI in this particular case)
A MELCOR-CATHARE comparison for a RCP trip transient (LOOP), performed by using the developed reference 3-loop input deck, completes the analysis.
It is noted that CATHARE results are considered as reference data for MELCOR calculations since the 3-loop PWR Bel V CATHARE model has been validated against experiments carried out in integral test facilities 123 and on plant available data.
1.3 Outline of the Report
In this study, MELCOR and CATHARE calculation results, simulating NC(I) phenomena during asymmetric cooldown transients, are compared. The accident scenario is described in §0. The MELCOR model of the 3-loop PWR is described in §1.
The results of the comparative analyses are reported in §0. It includes steady-state and transient results of the FWLB cases and their related sensitivity studies and also the simulation of the single-phase NC test which completes the study.
It is noted that some boundary conditions are selected for comparison purposes only and might not represent real plant conditions.
The major results of the analyses are summarized in the conclusions section §1: • MELCOR capability to simulate NC(I) phenomena is assessed, confirming the suitability
of the selected transient for MELCOR plant model for analyzing such transientscenarios.
• The modeling conditions on which CATHARE calculations can be reproduced byMELCOR are identified.
• The most influencing parameters on the NCI are identified and analyzed throughsensitivity studies.
• Further studies will be performed (depending on the interest and availability ofresources):
o Additional comparisons with available thermal-hydraulic calculation results.o Further model improvements based on comparative analyses, due to code
modeling progress.o Extend the analysis to core melt accidents.

3
The calculation results confirm the Bel V MELCOR 3-loop plant model capability and suitability for its intended purpose in support of regulatory activities.
Two appendixes report the figures of the comparisons MELCOR-CATHARE for the base case for FWLB and for the RCP trip transient.


5
2 ACCIDENT SCENARIO DESCRIPTION
The first part of the calculation (time < T1) is dedicated to the steady-state stabilization of the system (i.e. no variation of relevant system variables during the calculation) which is followed by the accident initiator and transient conditions.
The transient consists of a FWLB accident combined with a LOOP (i.e. FWLB at t = T1 and LOOP at t = T2) as described in Table 2-1. The analyses are performed starting from the nominal parameters (e.g. temperature and pressure) corresponding to nominal power rate of 3000 MWth. According to MELCOR best practices 5, end of cycle decay heat based on real cycle data is used for the reference case.
The accident scenario can be divided into four phases delimited by key events occurring at times T1, T2, T3, and T4 as follows:
1. Steady-state stabilization (T < 0s): stabilization of the system at full power2. Depressurization of the broken SG (0-50s): from the SOT up to scram
At time T1 = 0 s (SOT), a full rupture in the main feedwater line of SG-A occurs. Therapid depressurization and emptying of SG-A also entrains the depressurization andemptying of SG-B and SG-C via the common steam header and the steam lines, prior toMSIV closure. The reactor trip is assumed to occur at time T2 = 50 s when the low-lowlevel signal in one of the intact SG is generated.
3. System stabilization (50-20000s): up to the start of the cooldown procedure by theoperatorAt the time of reactor trip, the RCPs are assumed to be lost (because of LOOP), thesteam lines are isolated via their MSIVs, and the AFW to SG-B and SG-C is startedwithout delay. The ADV of SG-B and SG-C evacuates the core decay power until theoperator starts the cooldown. Around 2.5 h after the onset of the accident, the massinventory is restored in SG-B and SG-C. The system is left to stabilize until time T3.
4. Cooldown phase (20000-80000s): up to EOTAt T3 = 20000 s, the operator starts the cooldown by using the ADV of SG-B and SG-Cto bring the RCS to RHRS entry conditions. Since the primary loop flow rate due to NC israther low and thus the loop transit time is rather high, the operator needs to wait forseveral minutes to evaluate the effective primary cooling rate (based on the measure ofthe cold-leg temperature evolution of the cooling loop) and to perform eventualcorrective actions.
5. End of transient (80000s)At T4 = 80000 s, the simulation ends. This is the same duration as in the case ofCATHARE. RHRS entry conditions are checked in the results of the calculations.
Specific modeling assumptions adopted in the base case (A) and sensitivity studies (B to E) are described in the following sections.

6
2.1 Operator Actions
In all cases, the cooldown phase is initiated by the operator (imparted event in the simulations) to ensure a prescribed RCS temperature decrease rate of 12 K/h1.
In MELCOR, the cooldown phase is simulated by a control function (CF) which uses the temperature input of CATHARE to determine the desired ADV opening fraction.
2.2 MELCOR Initial and Boundary Conditions: Base Case (A)
The initial and boundary conditions considered in the current simulations are as follows: 1. The main feedwater is simulated until time T1.2. The reactor trip occurs at the low-low level signal in one of the intact SG, which is
however imposed by the user at T2 = 50 s.3. The LOOP is assumed to occur at the time of reactor trip. The RCP coast-down is
modeled according to plant available data, see Figure 2-1.4. The isolation of the steam lines is assumed to occur at the time of reactor trip.5. The AFW system starts delivering water to SG-B and SG-C 25s after reactor trip occurs
(10 s after is fully isolated).6. After time T3 (20000 s), the operator cooldown actions are simulated.7. The target cooldown rate is 12 K/h.8. The SG ADV setpoints are modified to keep the SG at a prescribed pressure before time
T3, in order to match CATHARE results.
2.3 Sensitivity Analyses Definitions: Cases B to D
The timing and occurrence of NCI depend upon several modeling parameters 123, such as the initial loop flow rate at the beginning of the cooldown phase, the status of the SGs (empty or filled) at the start of the cooldown, the number of active SGs, the initial core decay power, and the operator actions with respect to the cooldown rate.
The considered sensitive cases are listed in Table 2-3. The objective is to identify the most sensitive MELCOR modeling parameters with respect to the NCI occurrence as:
1. the cooldown rate, to identify the cooldown gradient limit under which NC in the inactiveloop(s) is maintained;
2. the decay heat (or time after scram), to identify which one between the best estimate(based on a real plant cycle and ORIGEN calculation results) and conservative (the oneused for the design basis accident licensing studies) values for the core decay heat areconservative with respect to the NCI phenomena occurrence. The decay power input isshown in Figure 2-2.
An additional case is studied to verify the occurrence or not of the NCI phenomena, in case the RCP resistance is set to zero. This allows verifying whether or not the way in which the pump resistance is modeled could impact the occurrence of the NCI. Thus the only modification with
1 The value of 12 K/h is not prescribed by the procedures but assumed for the calculations.

7
resistance is modeled could impact the occurrence of the NCI. Thus the only modification with respect to the base case, in addition to the cooling rate, is the pump resistance factor which is set to zero.
2.4 Additional Case E: Single-phase NC
This case was considered in order to assess the capability of the developed 3-loop MELCOR plant model, to correctly predict single-phase NC phenomenon against experimental data. The validation was performed by comparing the MELCOR simulations results with the CATHARE simulation results of an experimental RCP trip transient. The CATHARE calculation results are considered herein as reference (also in this case) in the comparisons against MELCOR. The main events of case E are reported in Table 2-2.
Figure 2-1 RCP Coast-Down Input

8
Figure 2-2 Decay Power Input: Conservative (Red) and Best Estimate (Blue)
Table 2-1 Main Events of the Base Case (and Cases B to D)
Phase/Event Time or Time Span Description Phase 1 Event T1
time < 0 s time = 0 s *
Steady-state stabilization FWLB in SG-A
Phase 2 Event T2
0 s < time < 50 s time = 50 s*
Depressurization and emptying of all SGs Reactor trip, MSIVs closed, shutdown of RCPs due to LOOP
Phase 3
Event T3
50 s < time < 20000 s
time = 20000 s *
SG-B and SG-C refilling and RCS stabilization Operator starts cooldown at prescribed cooling rate using ADV of SG-B and SG-C
Phase 4 Event T4
time > 20000 s time = 80000 s
Cooldown to RHRS entry conditions End of calculation
* Imparted event

9
Table 2-2 Main Events of the Single-Phase NC Test, Case E Event Time or Time Span Description Phase 1 Event T1
time < 0 s time = 0 s *
Steady-state stabilization RCPs trip
Phase 2 Event T2
0 s < time < 160 s time = 2 s * time = 160 s
RCPs coast-down Reactor trip on RCP low-low speed End of RCPs coast-down
Phase 3 Event T3
160 s < time < 800 s time = 800 s
Single phase NC RCPs restart End of calculation
* Imparted event
Table 2-3 List of Cases Analyzed
Run Type Cooldown Rate [K/h]
RCP resistance factor [-] $
Decay heat Notes
A Base case: REFERENCE
BC Reference 12 4.20e-4 Best estimate Comparison against CATHARE
B Sensitivity study: impact of cooling rate on NC(I) occurrence
B1 Cooling rate 10 4.20e-4 Best estimate Comparison against CATHARE
B2 Cooling rate 14 4.20e-4 Best estimate
C Sensitivity study: impact of decay heat * on NC(I) transition
C1 Decay heat 12 4.20e-4 Conservative
C2 Decay heat 24 4.20e-4 Conservative
C3 Decay heat 26 4.20e-4 Conservative
C4 Decay heat 28 4.20e-4 Conservative
D Sensitivity studies: impact of RCP resistance set to zero on NC(I) transition
D1 NO RCP resistance 34 0 Best estimate
D2 NO RCP resistance 36 0 Best estimate
E Single phase NC study
E NC test - 4.20e-4 Best estimate $ See §3.2.1 for more information * Or time after scram


11
3 MELCOR MODEL OF THE 3-LOOP PLANT
MELCOR is a fully integrated, engineering-level computer code that models the progression of severe accidents in light-water reactor NPPs. MELCOR is being developed at Sandia National Laboratories for the U.S. NRC as a second-generation plant risk assessment tool and the successor to the Source Term Code Package (STCP). A broad spectrum of severe accident phenomena in both BWRs and PWRs is treated in MELCOR in a unified framework. These include TH response in the RCS, reactor cavity, containment, and confinement buildings; core heat-up, degradation, and relocation; core-concrete attack; hydrogen production, transport, and combustion; fission product release and transport behavior [9,10,12].
MELCOR TH models are common for the whole code, and thus are used for both RCS and containment. The discretized hydrodynamic equations are formulated in a form that conserves mass and energy to a high level of accuracy. The numerical solution method is based on a semi-implicit solution of the equations, and the time step is therefore subject to the material Courant limit. Sources, sinks, and other modifiers are calculated by closure relations and additional auxiliary models that are generally nonlinear [12].
The latest development release, i.e. MELCOR 2.2.9607, has been used for the current analysis.
3.1 Overview
The creation of a plant model is an interactive procedure which includes the selection of a nodalization2 diagram, preparation of the code input deck, and documentation of these activities 16. For the current activity a 3-loop 3000 MWth PWR plant model has been developed forMELCOR 1.8.6 code version, and then converted for MELCOR 2.1, thanks also to theavailability of similar studies like 461120. No changes were needed to switch from the 2.1 to the2.2 version [5, 9, 10].
In particular, an existing MELCOR input deck of a generic 4-loop PWR has been ‘adapted’ to the selected plant. The following main assumptions were adopted for the development of the plant input deck:
• same subdivision of the input deck in separated files• similar ‘noding’ of the components• similar structure of the CFs• the behavior of several systems is currently modeled, including flags and set-points
added as CF for activation (or not)
The main modeling effort has been spent in the: • stabilization at full power• COR package: plant data converted into the plant input deck• containment modeling (not addressed in this study)
The plant model is suitable for steady-state and transients calculations (i.e. it is able to calculate the accident sequences).
2 Nodalization/nodalization diagram. Spatial discretization of the two-phase flow field, in which equations are solved, is organized in control volumes connected by junctions and it is called nodalization. Sometimes the meaning of the word nodalization is extended to the whole set of parameters and information supplied by the user. Nodalization diagram is a drawing or illustration showing control volumes with their connecting junctions. Definition from 7.

12
The developed input deck of a 3-loop PWR comprises, see Figure 3-1: • Vessel and Reactor Coolant System,• Reactor Coolant Pumps,• Pressurizer• Steam Generators• Primary and Secondary System Relief Valves• Feed-Water and Auxiliary Feed-Water Systems• Charging and Volume Control System• Natural Circulation Modeling• Decay Heat Power Modeling (best estimate based on a real plant cycle and ORIGEN
calculation results)• Accumulators (not addressed in this study)• Safety Injection System (not addressed in this study)• Core Degradation Modeling (not addressed in this study)• Containment (not addressed in this study)• Auxiliary Building (1 CV) (not addressed in this study)
3.2 Main Modeling Assumptions
Only the main modeling assumptions impacting this study are described below.
3.2.1 RCP Model
The primary pumps, rated at 5.3 MWth each, circulate 4600 kg/s of coolant per loop with a net pump head of 0.56 MPa.
In the CATHARE input deck, the pump is modeled by using the homologous curves.
QUICK-CF pump model is implemented in the flow path (FL) package of the plant input deck. The model simply uses a user-defined CF to calculate the pressure head the pressure developed by a pump (in Pa). All control logics must be included in the CF that has been constructed to yield a homologous pump model similar to that used in CATHARE and RELAP of the selected 3-loop plant model.
The model is numerically explicit; that is, the pressure head is based on conditions at the start of the MELCOR system timestep and remains unchanged throughout the step, even if the CVH package is sub-cycling [9,10].
In practice in MELCOR the pump is modeled as Δp (loss term). The resistance is modeled by CFs: “negative pump” to simulate friction losses behavior (i.e. negative Δp).
In the present case: • the RCP coast-down is modeled according to plant available data, see Figure 2-1; and• the RCP resistance is “adjusted” to get a similar NC mass flow rate of CATHARE before
the start of cooldown.
The new pump models UNIV and HOM are out of the scope of the present study, and might be subject to further study.

13
To interpret the value of the pump resistance in Table 2-3, the value reported in the column is to be multiplied to 6.9E5 Pa. Like this, the pump resistance is given in terms of pressure. The resistance value has been calibrated on the basis of the CATHARE results (which are considered as reference because validated on experiments), and then verified on the NC case E.
The RCP resistance is one of the modeling assumptions most influencing the phenomena investigated in the current study, i.e. NC and NCI.
3.2.2 Steam Generator
The SGs are of the inverted U-type design. The U tube bundle consists of 5350 Inconel tubes with a 19 mm outer diameter, and a nominal heat transfer area of 6250 m2. The nominal recirculation ratio is about 3.
The several vertical U-tubes with different elevations are modeled as follows: • MELCOR: the U-tubes are lumped into one equivalent U-tube having the mean elevation
and the same total heat exchange area.• CATHARE: 3 elevations are considered in order to take into account the effects of the
longest and shortest tubes. In this case the inlet and outlet zones of the SGs aremodelled as VOLUME component in order to take into account the connections to thedifferent U-tubes. Also other cases considering different U-tube elevations have beenstudied in the past, see [1, 2, 3, 22].
Previous studies showed that the number of equivalent tubes (e.g. 1 vs 3) may slightly impact the time of NCI occurrence.
3.2.3 Cooldown Procedure
The plant modeled in this study is a “cold reactor vessel head”, this means that the bypass flow to the reactor vessel head is designed in such a way to keep the upper head temperature at the cold leg temperature as long as the RCP are running. Together with the heat exchange out of the vessel upper head, the cooling and depressurization rate of the primary circuit and the number of active SGs impact the vapor formation in the upper head in case of a cooling/depressurization transient under NC flow conditions.
The ERG addressed in this study allows the cooling and depressurization of the primary circuit without vapor formation in all the parties of the primary circuit and more particularly the vessel upper head and the SG U–tubes apex. On the basis of the analysis of the transient cooling/depressurization based on the experience on PWR, limits on the cooldown rate in case of NC have been defined. In particular, the limitations on the cooldown rate and minimum sub-cooling to prevent vapor formation have been defined.
The previous version of the ERG procedure of the analyzed plant limits the cooldown rate to prevent steam bubble formation under the reactor vessel head during the depressurization, and a clear statement about the strategy to be followed to prevent NCI occurrence was lacking. In the most updated version, there is also a warning saying that in case of an inactive loop, the maximum cooldown is more restrictive to avoid the stagnation in this inactive loop. An inactive loop is defined as a loop which does not allow evacuating the heat by means of its SG.

14
In general, the operator is quite free to adopt an appropriate cooldown strategy: stepwise, gradual, or continuous cooldown. For that reason, there is a large source of uncertainty in determining an adequate cooldown procedure. This specific point has been thoroughly analyzed by Bel V by means of CATHARE code, e.g. in [1, 2, 3].
The cooldown period ends when the entry conditions for the RHRS connection are reached in each loop, i.e. HL temperatures become lower than 450 K [1].
In MELCOR the cooldown is performed by a series of CFs which models the ADV valve opening fraction on the basis of the temperature difference between the atmosphere in SG secondary side and a reference temperature. To reduce uncertainties in the results interpretation, the reference cooldown temperature is taken directly from CATHARE results.
The following input assumptions are adopted: • ADVs in SG-B and SG-C perform the function of cooldown at a prescribed rate (at
imposed temperature from CATHARE results) from 5.5h on.• To keep the SG pressure at prescribed level like in CATHARE results before the manual
activation of the ADVs (before 5.5h), the SV setpoint is modified to match the CATHARESG pressure. No further modifications have been done, since the steady-state resultswere satisfactory.
3.2.4 Decay Heat
Previous CATHARE calculations were performed with conservative decay heat 1. However in the current study, the MELCOR best estimate decay heat based on real cycle data at the end of life is considered. This input parameter, together with the cooling rate, has a major impact on NCI cooldown rate value prediction.
It is noted that since the decay heat level is the key parameter, the same conclusions can be achieved by varying the time of cooldown after scram.

15
Figure 3-1 MELCOR 2.2: 3-Loop PWR Reactor Coolant System Hydrodynamic Nodalization

17
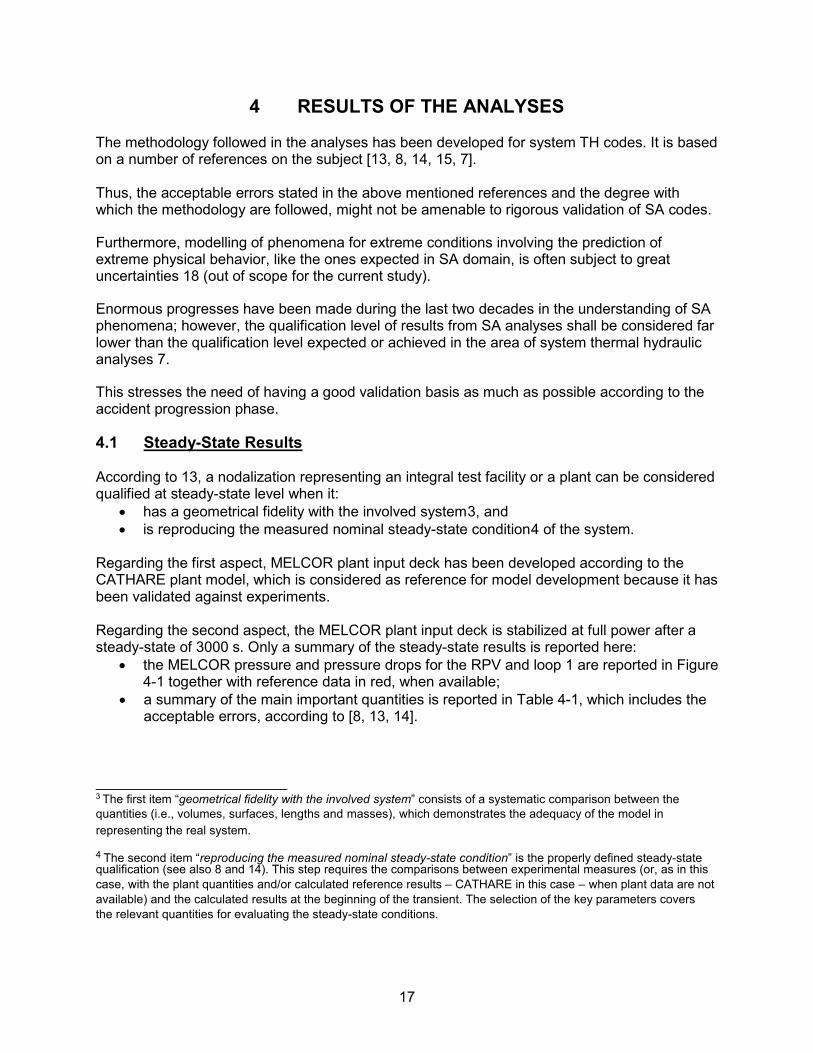
4 RESULTS OF THE ANALYSES
The methodology followed in the analyses has been developed for system TH codes. It is based on a number of references on the subject [13, 8, 14, 15, 7].
Thus, the acceptable errors stated in the above mentioned references and the degree with which the methodology are followed, might not be amenable to rigorous validation of SA codes.
Furthermore, modelling of phenomena for extreme conditions involving the prediction of extreme physical behavior, like the ones expected in SA domain, is often subject to great uncertainties 18 (out of scope for the current study).
Enormous progresses have been made during the last two decades in the understanding of SA phenomena; however, the qualification level of results from SA analyses shall be considered far lower than the qualification level expected or achieved in the area of system thermal hydraulic analyses 7.
This stresses the need of having a good validation basis as much as possible according to the accident progression phase.
4.1 Steady-State Results
According to 13, a nodalization representing an integral test facility or a plant can be considered qualified at steady-state level when it:
• has a geometrical fidelity with the involved system3, and• is reproducing the measured nominal steady-state condition4 of the system.
Regarding the first aspect, MELCOR plant input deck has been developed according to the CATHARE plant model, which is considered as reference for model development because it has been validated against experiments.
Regarding the second aspect, the MELCOR plant input deck is stabilized at full power after a steady-state of 3000 s. Only a summary of the steady-state results is reported here:
• the MELCOR pressure and pressure drops for the RPV and loop 1 are reported in Figure4-1 together with reference data in red, when available;
• a summary of the main important quantities is reported in Table 4-1, which includes theacceptable errors, according to [8, 13, 14].
3 The first item “geometrical fidelity with the involved system” consists of a systematic comparison between the quantities (i.e., volumes, surfaces, lengths and masses), which demonstrates the adequacy of the model in representing the real system.
4 The second item “reproducing the measured nominal steady-state condition” is the properly defined steady-state qualification (see also 8 and 14). This step requires the comparisons between experimental measures (or, as in this case, with the plant quantities and/or calculated reference results – CATHARE in this case – when plant data are not available) and the calculated results at the beginning of the transient. The selection of the key parameters covers the relevant quantities for evaluating the steady-state conditions.

18
The following considerations are valid for Table 4-1:
• The percent difference [%] with respect to the reference value (plant data or referencecalculations) is calculated as the ratio:|reference value – calculated value| / |reference value|
• The steadiness of the steady-state is checked qualitatively from figures (not reportedhere)
• Other quantities are checked and compared with reference data (plant data or referencecalculations), e.g. the results of other calculations (not reported here)
• No noticeable differences were found between the steady-state results ofMELCOR 1.8.6, MELCOR 2.1 and MELCOR 2.2 (not reported here)
Considering (among other) the acceptability criteria set forth in 13, Table 3 of 8 and Table 2 of 14 developed for TH codes, it can be concluded that the MELCOR plant nodalization results are satisfactory at the steady-state level.
Figure 4-1 MELCOR Pressure and Pressure Drops RPV (Left) and Loop A (Right) and Indication of Available Reference Data

19
Table 4-1 Results of Steady-State Analysis
Parameter Unit MELCOR Bel V
Difference* Acceptable error 8
Primary System
Core power MWth 3000 Imposed 2%
Mass inventory in primary circuit kg 206000 1.5% 2%
Primary pressure (PRZ) MPa 15.5 0.3% 0.1%
PRZ level (collapsed) m 6.4 0m 0.05m
Temperature Cold Leg K 561 0.9% 0.5%
Temperature Hot Leg K 599 0.6%
Temperature average K 580 0.8%
Mass flow rate (for each loop) kg/s 4600 0.2% 2%
Mass flow rate (core + core bypass)
kg/s 13800 4.0%
Bypass core % 4.3 0.3% 10%
Pressure drop LP-HL MPa 0.27 1.1% 10%
Pressure drop core MPa 0.17 1.1%
Secondary System
SG power MW 1000 0.1% 2%
SG vapor mass kg 3315 2.4% 5%
SG liquid mass kg 44792 4.4%
SG total mass kg 48109 4.1%
SG pressure MPa 5.9 3.9% 0.1%
SG level (collapsed) m 12.5 0.3m 0.1m
* With respect to plant data or reference calculations

20
4.2 Transient Results
The demonstration of the nodalization quality at the steady-state level does not ensure that the prediction of a transient scenario is phenomenologically correct or even that the nodalization (input deck) is error-free: transient-level nodalization qualification process is needed (e.g. 3rd step of the nodalization qualification according to 13).
The comparisons between the experimental data (in this case: results of other another qualified nodalization, i.e. the CATHARE model which was qualified against (among other) experimental data in the framework of experimental projects like PKL and ROSA) and the calculated results are carried out with the objective of:
• verifying whether or not the code simulations are capable to reproduce the relevant THphenomena and processes expected during the transient, and
• providing a reliable estimation of the parameters relevant for safety analysis.
A comprehensive comparison between the calculated trends or values is performed, including the following steps:
• the comparisons between the resulting sequence of main events (see Table 4-2) and• the comparisons between calculated time trends on the basis of the selected variables
(see Figure 4-2 to Figure 4-8, APPENDIX A and APPENDIX B, Table 4-2 and Table4-3), by visual observation of the time trends and the occurrence of the relevantphenomena, for each phase of the transient.
Although methods exist for such purpose (see e.g. [19, 20, 21), quantitative accuracy evaluation5 of the code results is not addressed.
4.2.1 Base Case (A)
The results of the comparison of the MELCOR calculation results against the CATHARE ones for the reference case are reported in APPENDIX A. Summary results are also reported in Table 4-3 (together with the results of the sensitivity analyses) and Figure 4-2 and Figure 4-3. Theresulting sequence of main events is reported in Table 4-2.
The transient starts at T1 = 0 s with a full rupture in the main feedwater line of one SG. The rapid depressurization and emptying of the affected SG also cause the reactor trip signal and entrains the depressurization and emptying of the other SGs via the common steam header and the steam lines, till isolation of the MS lines.
The reactor trips at T2 = 50 s after the FWLB in SG-A due to the low-low SG level in one of the intact SG (imparted event). At the same instant T2, the steam lines are isolated via their main steam isolation valves (MSIVs), the RCPs are shut down (because of LOOP), the normal FW is isolated and the AFW system starts delivering water to the intact SGs with a delay of 25 s from scram. The high core decay power and the loss of primary flow cause the primary system to heat-up and pressurize leading the PRZ relief valves to open momentarily. Around 2.5 h after the onset of the accident, the mass inventory is restored in the intact SGs.
5 Accuracy. The known bias between a code prediction and the actual transient performance of a real facility. Definition taken from 16

21
The system is left to stabilize until the operator starts the cooldown by using the ADV of the intact SGs to bring the RCS to RHRS conditions. Once the RCS starts to stabilize, the pressurizer pressure control system brings the primary pressure back to about 16 MPa.
After restoration of the mass inventory in the intact SGs before T3 = 20000 s (5.5 h after the SOT), the manual cooldown starts at 12 K/h. The “perturbation” induced by the stepwise opening of the ADV of SG-B and SG-C by 5% (assumed operator action at the beginning of the cooldown phase) creates a large counter-manometric force in the rising part of the affected loop (rising part of the HL, the SG inlet plenum, and the ascending side of the U-tube).
As shown in Figure 4-2, in Loop-A, the CL temperature remains higher than the HL temperature. Consequently, counter-buoyancy forces are created and become high enough to overcome the NC driving forces in the reactor vessel. Therefore, the mass flow in the affected loop drops to almost 0 kg/s. According to MELCOR results, the NCI occurs around 14h after the initiation of the cooldown phase (this is about 7h later than in CATHARE case), see Figure 4-3. The number of SG tubes modeled, as well as the level of details of the axial nodalizations (more detailed in CATHARE) might explain the time difference in the MELCOR prediction of the NCI occurrence6. The RHRS connection temperature is reached during the simulation time span in MELCOR and not in CATHARE. At the time of the NCI occurrence the CL temperature in CATHARE is still high and the NCI prevents further cooling of the CL of the affected loop. Indeed, the earlier is the NCI occurrence, the higher is the temperature in the affected loop.
In addition to what stated above, the following conclusions about the comparison of the MELCOR calculated results against the CATHARE ones can be derived:
• The CL and HL temperatures predicted by MELCOR in the affected loop are lower thanthe CATHARE ones, see Figure A-1. This is a consequence of the different prediction ofthe time of NCI occurrence (i.e. about 7h later in MELCOR).
• The CL and HL temperatures in the other loops of both MELCOR and CATHARE arevery similar up to the time of NCI occurrence in CATHARE, discrepancies increase withthe transient progression, see Figure A-2 and Figure A-3. It seems that MELCOR ADVcapacity is lower than the one used in CATHARE code.
• The mass flow rates comparison reported in Figure A-4 shows very good agreement forthe unaffected loops. Discrepancies are experienced in the affected loop, but the trend isvery similar. The higher mass flow rate predicted by MELCOR might be a reason for thediscrepancies in the time of NCI occurrence. It is noted that the same resistance andRCP coast-down curve is adopted for all three loops as the one used in CATHARE code.
• The ADV opening fraction is based on the temperature curve issued from the output ofCATHARE, implemented as input parameter by means of CF in MELCOR, see FigureA-5. It is not surprising that the results are very similar: minor differences might be due todifferent initialization of the CF.
• Core temperatures are very similar: differences at the end of the transient are consistentwith the ones experienced in the CL and HL temperatures in the unaffected loops, seeFigure A-6.
• The analyzed plant is a “cold reactor vessel head” type, this is correctly reproduced byMELCOR calculations where the CL temperature equals the UH temperature duringsteady-state. MELCOR and CATHARE transient results show similar trends, and thebehavior is judged satisfactory for the purpose of the analysis, see Figure A-7. No
6 The same time of occurrence of NCI (i.e. earlier) predicted by CATHARE can be achieved also by MELCOR by increasing the pump resistance or the cooling rate.

22
changes are performed in the MELCOR model, the results being compliant with the steady-state specifications and the transient differences are minor.
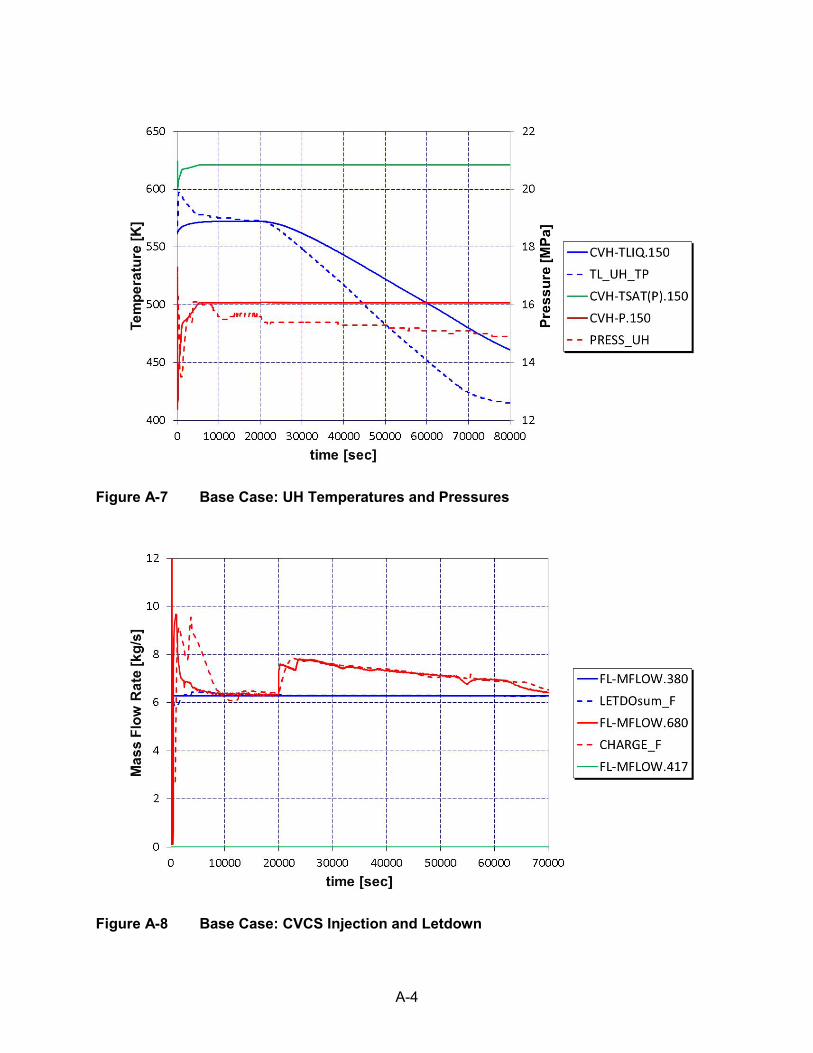
• The behavior of the CVCS is almost identical for both MELCOR and CATHARE cases. Itis noted that in MELCOR the system is modeled (charging, letdown and pump sealinjection: to maintain the water level in the pressurizer and the pump seals injection), andnot imposed, see Figure A-8.
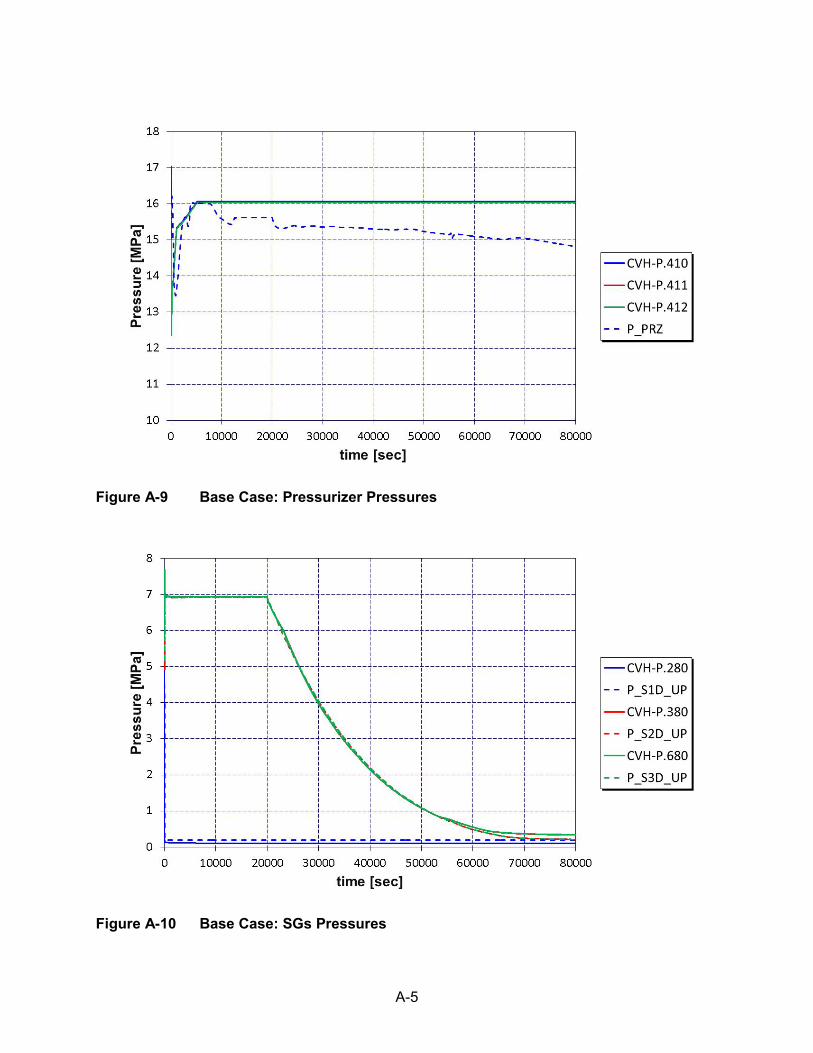
• The PRZ behavior shows some discrepancies which increases during the transient, butthey are considered acceptable considering the modeling differences and the intent ofthe calculations (see Figure A-9).
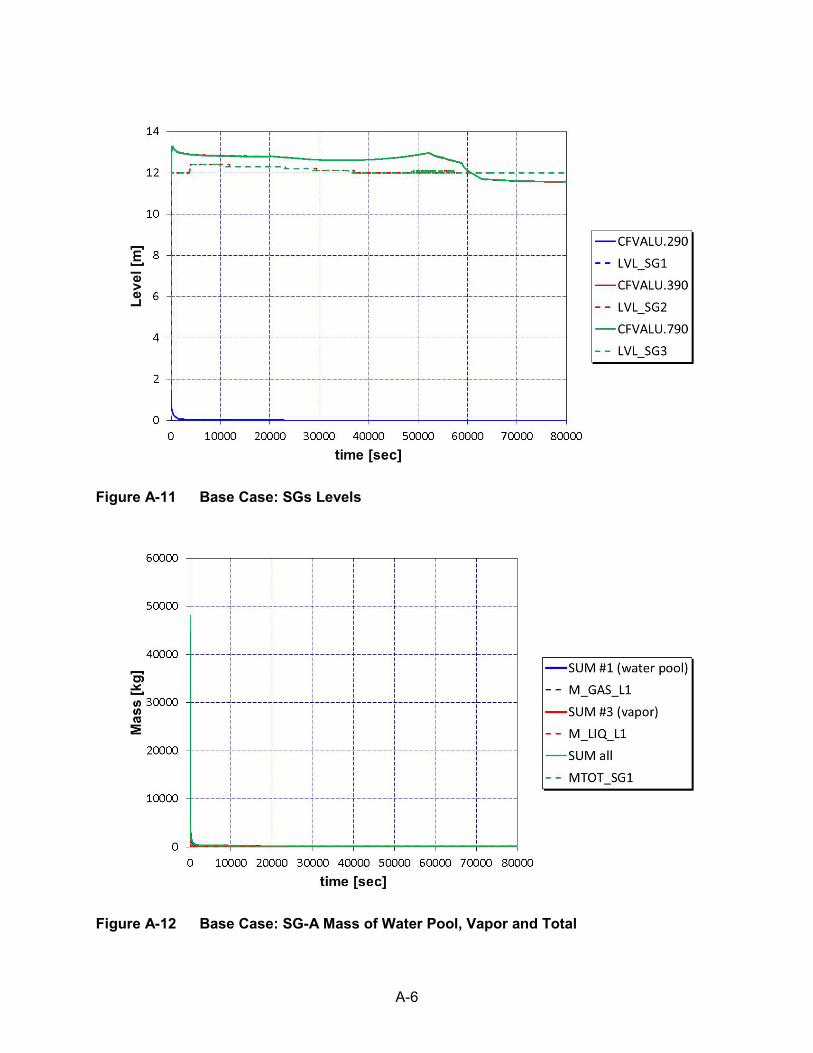
• The SG secondary side pressures (Figure A-10), levels (Figure A-11), masses (FigureA-12, Figure A-13, Figure A-14) are very similar, confirming the adequacy of theMELCOR modeling of the SG for the intended purpose7, notwithstanding the moresimple modeling approach. The major discrepancies are experienced for the SG heatexchange (Figure A-15) and the discrepancies increase with the transient progression.This is anyway consistent with the temperatures predictions already discussed, wherereverse flow is predicted in the affected primary loop in CATHARE but not in MELCOR.
• Core power is imposed by a CF in both MELCOR and CATHARE cases, see FigureA-16, and it is reported there for the sake of completeness.
4.2.2 Cases B: Impact of Cooling Rate on NCI Occurrence
For the case B1, the base case cooldown rate is decreased by 2 K/h: thus a cooldown rate of 10 K/h is considered. This is the only modification in the MELCOR input deck. In this case NCI occurrence is not predicted and RHRS connection temperature is achieved in both MELCOR and CATHARE predictions, see Figure 4-4 and Table 4-3. The results of MELCOR calculations seem to be correctly reproducing the expected CATHARE results.
For the case B2, cooldown rate is increased by 2 K/h: thus a cooldown rate of 14 K/h is considered. Figure 4-5 and Table 4-3 show an earlier time of NCI occurrence with respect to the reference case.
Regarding the impact of the cooling rate on NCI occurrence, the following conclusions can be drawn:
• Reducing the cooling rate might prevent NCI occurrence in the inactive loop.• Increasing the cooling rate, in case NCI is predicted, has an impact on the time of NCI
occurrence, which in turn impacts the temperature in the affected loop: the higher is thecooldown rate, the earlier NCI occurrence is predicted, the higher is the temperature inthe affected loop.
4.2.3 Cases C: Impact of Decay Heat (or Time After Scram) on NC(I) Transition
Decay heat level (or time after scram) strongly influences the NC(I) transition: using higher decay heat power is not conservative with respect to the NCI occurrence. In fact, the core power has a strong effect on the driving forces balance and consequently on the NCI time of occurrence. Therefore, for cases C the base case decay heat level is increased in conformity with the conservative assumption related to 20% of the ANS79 decay heat level and by adopting the same cooling rate of the base case. In this case, no NCI is observed, see Figure 4-6 and Table 4-3.
7 Severe accident analysis

23
As shown in Figure 4-7 and Table 4-3, by adopting higher decay heat value, transition NC(I) is experienced at higher cooling rate with respect to the base case. Indeed, also in this case the occurrence of NCI for a difference of 2 K/h in the cooldown rate might impact reaching or not the RHRS connection temperature at the end of the transient, with the only modification of the cooldown rate:
• A continuous cooldown rate of 26 K/h leads to NCI.• With the only modification of the cooldown rate with respect to the previous case, a
continuous cooldown rate of 24 K/h does not lead to NCI.
Furthermore, the following general conclusions are also derived: • In case NCI does not occur, cooling rate has a minor impact on the mass flow rate and
temperature predictions at the end of the cooling rate up to the end of the transient (i.e.the values of these quantities at the end of the transient of different cases are verysimilar).
• The same considerations of other cases reported above can be drawn in case of NCIoccurrence (i.e. the higher the cooling rate, the earlier the NCI occurrence, the higherthe temperature in the affected loop, which might reach or not the RHRS connectiontemperature).
For the sake of completeness (not reported in this study) the CATHARE results with high decay heat experience the transition NC(I) between 12 K/h and 14 K/h. MELCOR can reproduce such results by a RCP resistance factor of 5.80e-4. However it is supposed that the difference is mainly due to the degree of detail of the used nodalization by the two codes. On one hand, MELCOR uses coarse meshes for representing the plan systems. On the other hand, CATHARE code uses detailed plant nodalization based upon hundred thousand nodes, and more particularly the SG nodalization on the primary and secondary side.
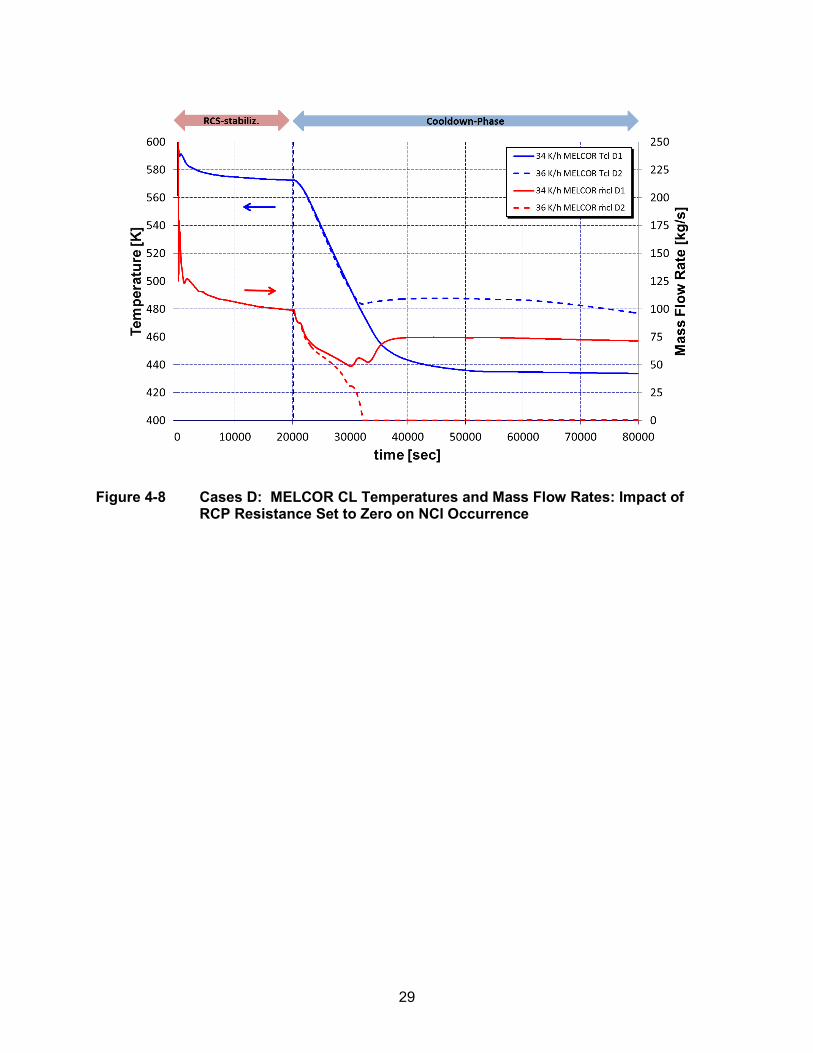
4.2.4 Cases D: Impact of RCP Resistance Set to Zero on NC(I) Transition
Sensitivities on the pump resistance set to zero are reported in Figure 4-8 and Table 4-3. Also without considering the pump resistance, MELCOR is able to predict the occurrence of the transition NC(I), experienced at higher cooling rate with respect to the base cases. Indeed, also in this case the occurrence of NCI with a difference of 2 K/h in the cooldown rate might impact reaching or not the RHRS connection temperature at the end of the transient, with the only modification of the cooldown rate:
• A continuous cooldown rate of 36 K/h leads to NCI.• With the only modification of the cooldown rate with respect to the previous case, a
continuous cooldown rate of 34 K/h does not lead to NCI.
This sensitivity study evidences the importance of implementing the resistance factor in the input deck and that NCI occurrence could be impacted by the nodalization assumptions (the nodalization of the U-tubes with MELCOR should be more detailed). Indeed using a coarse nodalization (as it is the case in MELCOR) could lead to higher value of the minimal value of the cooldown rate that leads to NCI [1]. It is worth to mention that further studies are needed to better understand the impact of this (among others) modeling assumptions (i.e. RCP resistance, and nodalization) on the results.
24
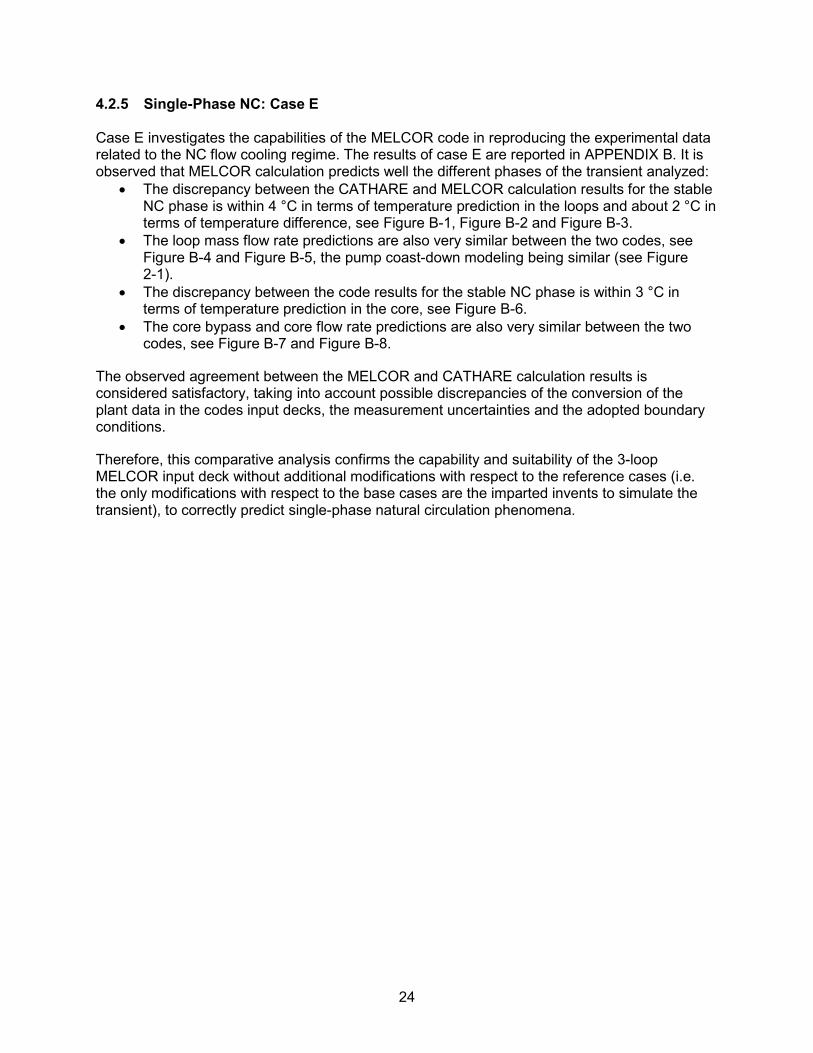
4.2.5 Single-Phase NC: Case E
Case E investigates the capabilities of the MELCOR code in reproducing the experimental data related to the NC flow cooling regime. The results of case E are reported in APPENDIX B. It is observed that MELCOR calculation predicts well the different phases of the transient analyzed:
• The discrepancy between the CATHARE and MELCOR calculation results for the stableNC phase is within 4 °C in terms of temperature prediction in the loops and about 2 °C interms of temperature difference, see Figure B-1, Figure B-2 and Figure B-3.
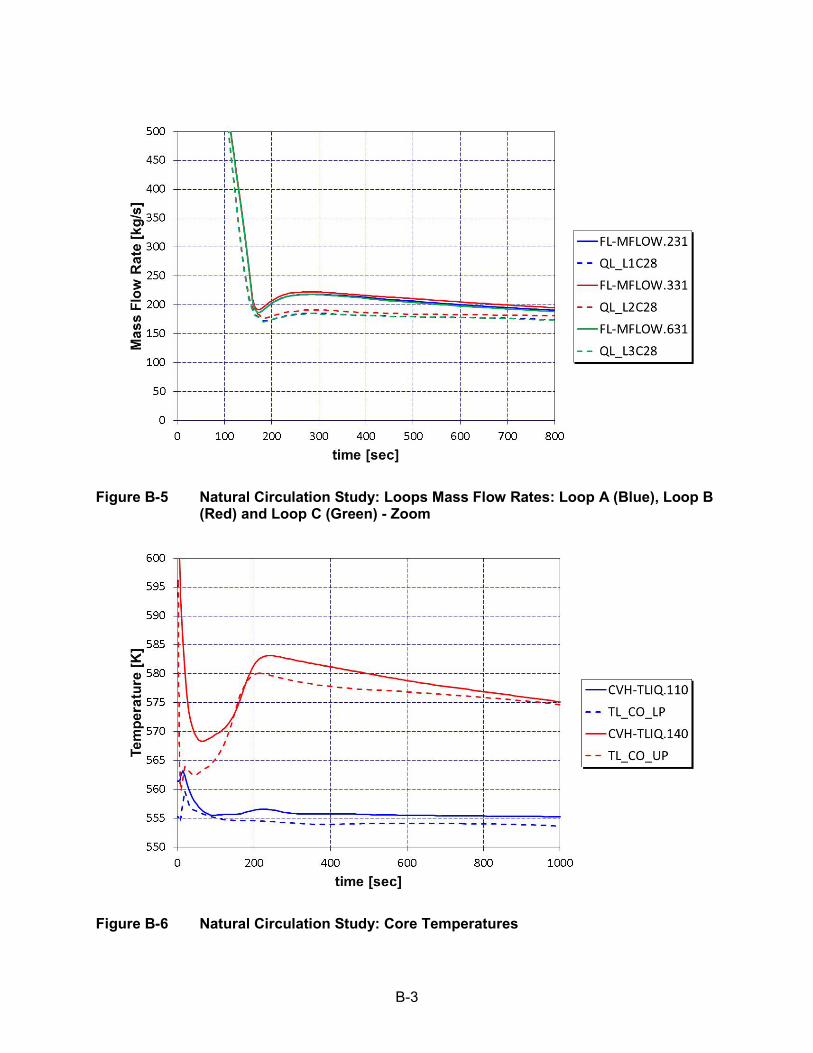
• The loop mass flow rate predictions are also very similar between the two codes, seeFigure B-4 and Figure B-5, the pump coast-down modeling being similar (see Figure2-1).
• The discrepancy between the code results for the stable NC phase is within 3 °C interms of temperature prediction in the core, see Figure B-6.
• The core bypass and core flow rate predictions are also very similar between the twocodes, see Figure B-7 and Figure B-8.
The observed agreement between the MELCOR and CATHARE calculation results is considered satisfactory, taking into account possible discrepancies of the conversion of the plant data in the codes input decks, the measurement uncertainties and the adopted boundary conditions.
Therefore, this comparative analysis confirms the capability and suitability of the 3-loop MELCOR input deck without additional modifications with respect to the reference cases (i.e. the only modifications with respect to the base cases are the imparted invents to simulate the transient), to correctly predict single-phase natural circulation phenomena.
25
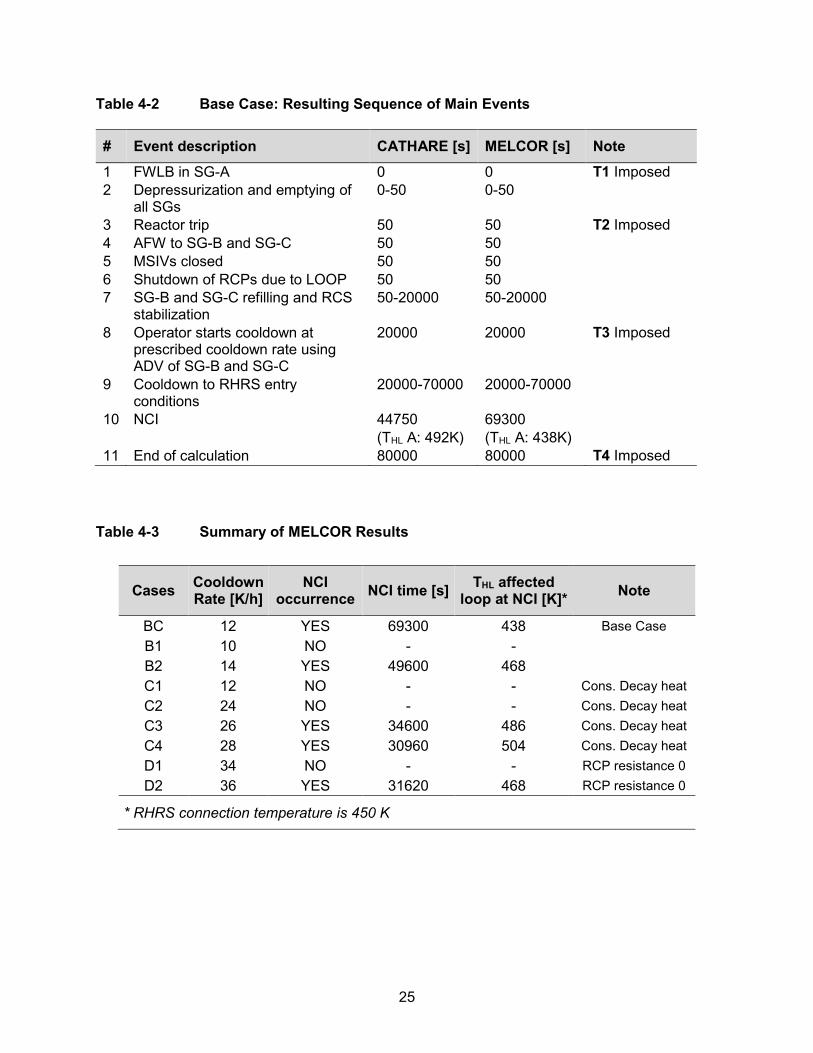
Table 4-2 Base Case: Resulting Sequence of Main Events
# Event description CATHARE [s] MELCOR [s] Note
1 FWLB in SG-A 0 0 T1 Imposed 2 Depressurization and emptying of
all SGs 0-50 0-50
3 Reactor trip 50 50 T2 Imposed 4 AFW to SG-B and SG-C 50 50 5 MSIVs closed 50 50 6 Shutdown of RCPs due to LOOP 50 50 7 SG-B and SG-C refilling and RCS
stabilization 50-20000 50-20000
8 Operator starts cooldown at prescribed cooldown rate using ADV of SG-B and SG-C
20000 20000 T3 Imposed
9 Cooldown to RHRS entry conditions
20000-70000 20000-70000
10 NCI 44750 (THL A: 492K)
69300 (THL A: 438K)
11 End of calculation 80000 80000 T4 Imposed
Table 4-3 Summary of MELCOR Results
Cases Cooldown Rate [K/h]
NCI occurrence NCI time [s] THL affected
loop at NCI [K]* Note
BC 12 YES 69300 438 Base Case B1 10 NO - - B2 14 YES 49600 468 C1 12 NO - - Cons. Decay heat C2 24 NO - - Cons. Decay heat C3 26 YES 34600 486 Cons. Decay heat C4 28 YES 30960 504 Cons. Decay heat D1 34 NO - - RCP resistance 0 D2 36 YES 31620 468 RCP resistance 0
* RHRS connection temperature is 450 K

26
Figure 4-2 Base Case: MELCOR and CATHARE CL and HL Temperatures
Figure 4-3 Base Case: MELCOR and CATHARE CL Temperatures and Mass Flow Rates

27
Figure 4-4 Case B1: MELCOR and CATHARE CL Temperatures and Mass Flow Rates
Figure 4-5 Cases B: MELCOR CL Temperatures and Mass Flow Rates, Sensitivity Study on Cooling Rate
B
B B B
B
B
B B

28
Figure 4-6 Cases C: MELCOR CL Temperatures and Mass Flow Rates, Impact of Decay Heat on NCI Occurrence
Figure 4-7 Cases C: MELCOR CL Temperatures and Mass Flow Rates, Sensitivity Study on Decay Heat
29
Figure 4-8 Cases D: MELCOR CL Temperatures and Mass Flow Rates: Impact of RCP Resistance Set to Zero on NCI Occurrence


31
5 CONCLUSIONS
MELCOR is the reference code used by Bel V for SA analysis, and, to date, it has been mainly used in the framework of the Bel V R&D program: The current study focuses on the capabilities of the MELCOR Bel V plant model to simulate NC(I) phenomena during asymmetric cooldown transients. Under accident conditions with LOOP, NC constitutes the main mechanism for core heat removal of a nuclear PWR. In certain asymmetric cooling circumstances during the cooldown phase, single-phase NCI could occur as a consequence of an imposed cooldown rate by the operator.
A model of a 3-loop 1000 MWe PWR has been developed for MELCOR 1.8.6 code version. It has been afterwards converted for MELCOR 2.1 and finally run with MELCOR 2.2 code version. The model was assessed for steady-state calculations by carrying out comparison studies against reference operating values of NPP data and other reference calculations e.g. CATHARE in this case. However, steady-state qualification does not guarantee the capability to reproduce expected transient scenarios, that’s why transient analyses are performed.
Code-to-code comparisons are performed thanks to the availability of similar studies performed by means of the best estimate TH system code CATHARE. Such comparison activities are fundamental for the planned use of MELCOR for the verification of safety analyses of Belgian nuclear installations and accident management and to increase confidence in the calculated results.
For this purpose a MELCOR/CATHARE comparison of a real plant RCP trip transient simulation was performed. This is one of the steps in the Bel V MELCOR model validation matrix. The assessment study confirms the capability and suitability of the 3-loop MELCOR input deck to correctly predict single-phase NC phenomena.
According the achievements of the current study, the following conclusions can be drawn: • The MELCOR simulation results can properly reproduce CATHARE outputs and the
expected NCI phenomena;o For the base case, the minimum continuous cooldown rate that can still lead to
NCI is about 12K/h (confirmed by CATHARE results).o For the cases with higher value of the core power decay heat (or earlier time
after scram), NCI occurs with a higher minimum continuous cooldown rate ofabout 28K/h
• The MELCOR results show that, for a FWLB accident with LOOP, the occurrence of NCIis governed by the cooldown rate value and the decay heat levels (with a pumpresistance values adapted to reproduce the CATHARE ones).
The following general messages on NC and NCI phenomena can be summarized as follow: • Impact of cooldown rate
o Reducing the cooldown rate might prevent NCI occurrence.o Increasing the cooldown rate, in case NCI is predicted, has an impact on the time
of NCI occurrence, which in turn impacts the temperature in the affected loop: the higher is the cooldown rate, and the earlier NCI occurrence is predicted, the higher is the temperature in the affected (and inactive) loop.
o In case NCI does not occur, cooldown rate has a minor impact on the mass flow rate up to the end of the transient.

32
o The higher is the decay heat (or the earlier is the time after scram), the higher isthe minimal value of the cooldown rate without experiencing NCI.
o It is worth noticing that implementing “conservative” power is not conservativewith respect to the NCI occurrence: the lower is the decay heat, the lower is thecooldown rate that leads (in certain conditions) to NCI occurrence
• Implementing the pump resistance factor in the MELCOR model is important, but it is notnecessary to experience the NCI phenomenon (i.e. NCI is experienced also without theRCP resistance).
Regarding the model development, further studies might be carried out addressing the impact of the RCP modeling as well as the RCP resistance factors on NCI prediction (depending on interest and availability of resources). In addition, since CATHARE studies showed (among other) the impact on the NCI occurrence of a detailed nodalization and more particularly the SG nodalization, similar studies might be envisaged also for MELCOR. This might explain the time difference in the MELCOR prediction of the NCI occurrence.
Regarding further comparative analyses, further assessment of the Bel V MELCOR model by using insights from the PKL, ROSA, other tests or plant available data, in conjunction with activities carried out for thermal-hydraulics is under consideration. This might include extending the comparative analyses to two phase flow conditions. In parallel, it is also worth noticing that transient analyses after fuel failure are already ongoing.
• Impact of decay heat (or time after scram):

33
6 REFERENCES
1. J. Vlassenbroeck, A. Bousbia Salah, A. Bucalossi, Assessment of Natural CirculationInterruption During Asymmetric Cooldown Transients, Nuclear Technology Vol. 172 Nov.2010.
2. A. Bousbia Salah, J. Vlassenbroeck, Assessment of Natural Circulation InterruptionPhenomenon in A PWR with Inverted SG-U-Tubes, The 15th International Topical Meetingon Nuclear Reactor Thermal - Hydraulics, NURETH-15, 2013.
3. A. Bousbia Salah, J. Vlassenbroeck, H. Austregesilo, Experimental and AnalyticalAssessment of Natural Circulation Interruption Phenomenon in the LSTF And PKL TestFacilities, Nuclear Technology Vol. 192 Oct. 2015.
4. State-of-the-Art Reactor Consequence Analyses Project Volume 2: Surry IntegratedAnalysis, NUREG/CR-7110, Vol. 2, Rev. 1.
5. MELCOR Best Practices as Applied in the State-of-the-Art Reactor Consequence Analyses(SOARCA) Project, NUREG/CR-7008.
6. M. Adorni, L. E. Herranz, et al., OECD/NEA Sandia Fuel Project Phase I: Benchmark of theIgnition Testing, Nuclear Engineering and Design 307 (2016) 418–430.
7. F. D’Auria, Thermal Hydraulics in Water-Cooled Nuclear Reactors, Elsevier, 2017.8. CRISSUE-S – WP2 Neutronics/Thermal-hydraulics Coupling in LWR Technology: State-of-
the-art Report (REAC-SOAR), NEA No. 5436, 2004.9. MELCOR Computer Code Manuals, Vol. 1: Primer and Users’ Guide, Version 2.2.9541
2017, SAND2017-0455 O.10. MELCOR Computer Code Manuals, Vol. 2: Reference Manual Version 2.2.9541 2017,
SAND2017-0876 O.11. G. P. Rouel, E. J. Stubbe, Assessment Study of RELAP5/MOD2 Cycle 36.05 Based on the
Tihange-2 Reactor Trip of January 11, 1983, NUREG/IA-0044.12. B. R. Sehgal, Nuclear Safety in Light Water Reactors: Severe Accident Phenomenology,
Elsevier 2012.13. M. Bonuccelli, D’Auria, F., Debrecin, N., Galassi, G.M., 1993. A Methodology for the
Qualification of Thermal-Hydraulic Codes Nodalizations. in: International Top. Meet. OnNuclear Reactor Thermal-Hydraulics (NURETH-6), Grenoble, France.
14. F. D’Auria, A. Bousbia Salah, A. Petruzzi, and A. Del Nevo, State of the Art in Using BestEstimate Calculation Tools in Nuclear Technology, Nuclear Engineering and Technology,vol. 38, no. 1, pp. 11–32, 2006.
15. E. Coscarelli, A. Del Nevo, F. D’Auria, Qualification of TRACE V5.0 Code against FastCooldown Transient in the PKL-III Integral Test Facility, Science and Technology of NuclearInstallations, vol. 2013 (2013), Article ID 128305.
16. Accident Analysis for Nuclear Power Plants, IAEA SRS 23, IAEA 2002.17. Approaches and Tools for Severe Accident Analysis for Nuclear Power Plants, IAEA SRS
56, IAEA 2008.18. Technical Safety Assessment Guide, Deterministic Severe Accidents Analysis,
ETSON/2013-003 January 2013.19. W. Ambrosini, F. D'Auria, R. Bovalini, and F. D'Auria, Evaluation of Accuracy of Thermal-
Hydraulic Code Calculations, Energia Nucleare, vol. 7, no. 2, pp. 5–16, 1990.

34
20. A. Del Nevo, M. Adorni, et al., Validation of Advanced Computer Codes for VVERTechnology: LB-LOCA Transient in PSB-VVER Facility, Science and Technology of NuclearInstallations, vol. 2012 (2012), Article ID 480948.
21. A. Prošek, M. Leskovar, Application of FFTBM to Severe Accidents, InternationalConference Nuclear Energy for New Europe 2005.
22. D. Bestion, F. D’Auria, P. Lien, H. Nakamura, A State-of-the-Art Report on Scaling inSystem Thermalhydraulics Applications to Nuclear Reactor Safety and Design,NEA/CSNI/R(2016)14, 2017.
A-1
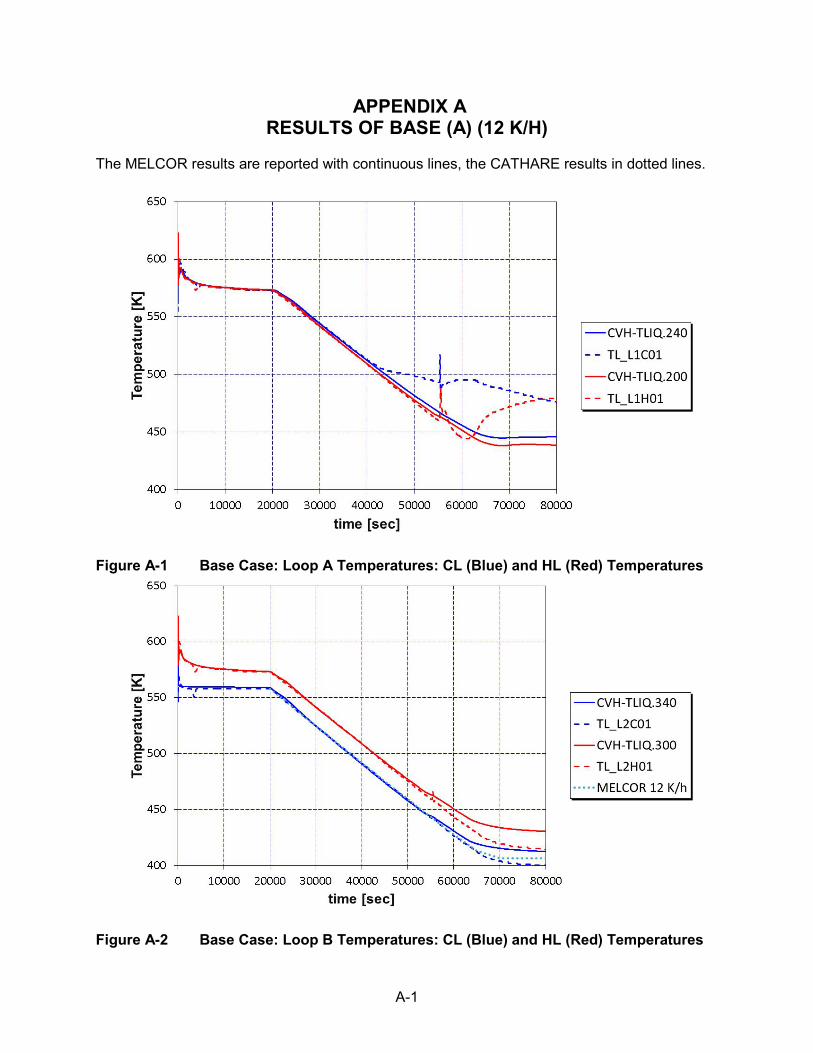
APPENDIX A RESULTS OF BASE (A) (12 K/H)
The MELCOR results are reported with continuous lines, the CATHARE results in dotted lines.
Figure A-1 Base Case: Loop A Temperatures: CL (Blue) and HL (Red) Temperatures
Figure A-2 Base Case: Loop B Temperatures: CL (Blue) and HL (Red) Temperatures
A-2
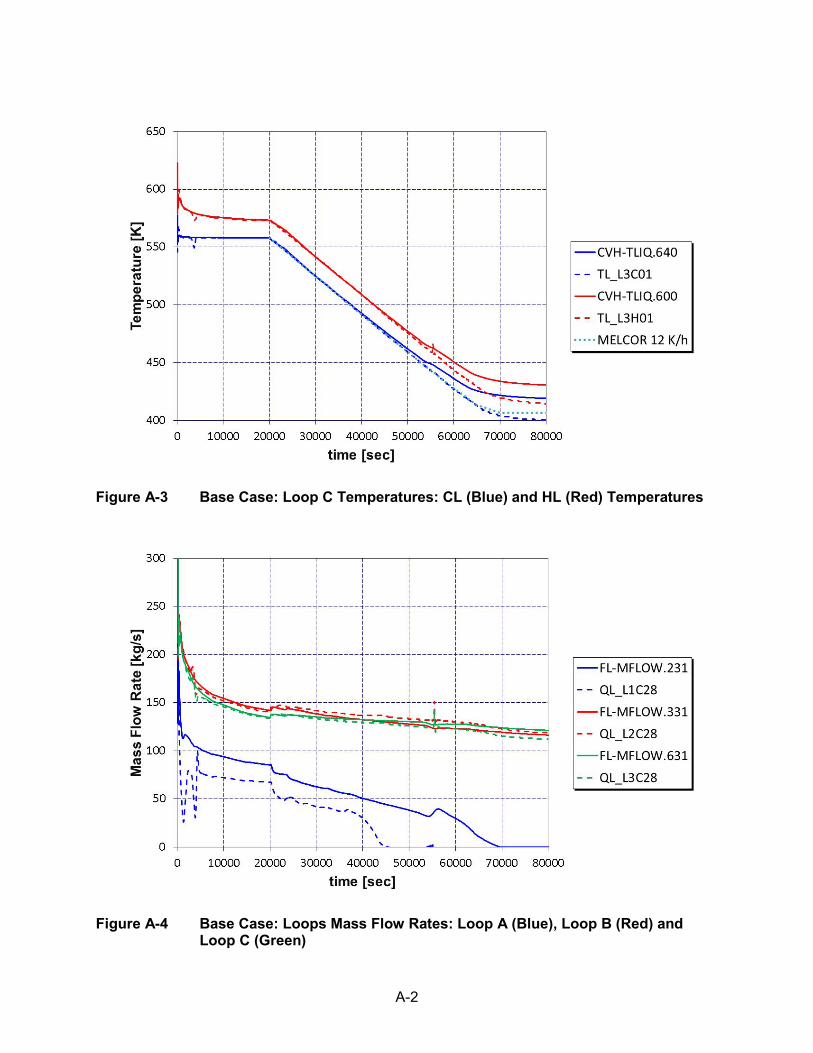
Figure A-3 Base Case: Loop C Temperatures: CL (Blue) and HL (Red) Temperatures
Figure A-4 Base Case: Loops Mass Flow Rates: Loop A (Blue), Loop B (Red) and Loop C (Green)

A-3
Figure A-5 Base Case: ADVs and SVs Opening Fractions (Resulting from the Imposed Cooldown Curve from CATHARE)
Figure A-6 Base Case: Inlet and Outlet Core Temperatures
A-4
Figure A-7 Base Case: UH Temperatures and Pressures
Figure A-8 Base Case: CVCS Injection and Letdown
A-5
Figure A-9 Base Case: Pressurizer Pressures
Figure A-10 Base Case: SGs Pressures
A-6
Figure A-11 Base Case: SGs Levels
Figure A-12 Base Case: SG-A Mass of Water Pool, Vapor and Total

A-7
Figure A-13 Base Case: SG-B Mass of Water Pool, Vapor and Total
Figure A-14 Base Case: SG-C Mass of Water Pool, Vapor and Total

A-8
Figure A-15 Base Case: Heat Exchange in SGs
Figure A-16 Base Case: Core Power

B-1
APPENDIX BRESULTS OF NATURAL CIRCULATION STUDY: CASE E
The MELCOR results are reported with continuous lines, the CATHARE results in dotted lines.
Figure B-1 Natural Circulation Study: Loop A Temperatures: CL (Blue) and HL (Red) Temperatures
Figure B-2 Natural Circulation Study: Loop B Temperatures: CL (Blue) and HL (Red) Temperatures

B-2
Figure B-3 Natural Circulation Study: Loop C Temperatures: CL (Blue) and HL (Red) Temperatures
Figure B-4 Natural Circulation Study: Loops Mass Flow Rates: Loop A (Blue), Loop B (Red) and Loop C (Green)
B-3
Figure B-5 Natural Circulation Study: Loops Mass Flow Rates: Loop A (Blue), Loop B (Red) and Loop C (Green) - Zoom
Figure B-6 Natural Circulation Study: Core Temperatures

B-4
Figure B-7 Natural Circulation Study: Core Bypass (Blue) and Core (Red) Mass Flow Rates
Figure B-8 Natural Circulation Study: Core Bypass (Blue) and Core (Red) Mass Flow Rates - Zoom

Natural Circulation (Interruption) Analysis with MELCOR 2.2 during Asymmetric Cooldown Transients
NUREG/IA-0507
Martina Adorni, Anis Bousbia Salah, Jacques Vlassenbroeck
Bel V Rue Walcourt 148 Walcourtstraat 1070 Brussels, Belgium
Hossein Esmaili, Project Manager
Division of Systems Analysis Office of Nuclear Regulatory Research U.S. Nuclear Regulatory Commission Washington, DC 20555-0001
This document describes the analysis carried out with MELCOR 2.2 computer code of the natural circulation (interruption) phenomena during asymmetric cooldown transients in a 3-loop nuclear power plant (NPP) configuration. Indeed, thermal-hydraulic analysis is an important issue for severe accident codes, it constitutes the starting point of the analysis before the occurrence of the core degradation.
The considered accident scenario consists in a feedwater line break (FWLB) combined with loss of offsite power (LOOP) in a generic 1000 MWe 3-loop pressurized water reactor (PWR).
For this study, a Bel V MELCOR 3-loop PWR model has been developed. The main goal is to verify the capabilities of the MELCOR code in predicting the establishment of the natural circulation flow regime, the eventual occurrence of the natural circulation interruption (NCI) phenomena and to compare to the results from an equivalent analysis performed using the thermal-hydraulic system code CATHARE. The activity is completed by carrying out sensitivity analyses in order to identify the key MELCOR modeling parameters.
The calculation results confirm the Bel V MELCOR 3-loop plant model capability and suitability for its intended purpose in support of regulatory activities.
Natural Circulation (Interruption) MELCOR 2.2 Asymmetric Cooldown Transients 3-loop Pressurized Water Reactor
March 2019
Technical


NU
REG
/IA-0507
Natural C
irculation (Interruption) Analysis w
ith MELC
OR
2.2 during Asym
metric C
ooldown Transients
March 2019