Numerical simulations of tsunami generated by underwater ... · tsunamis generated by underwater...
26
Manuscript prepared for Nat. Hazards Earth Syst. Sci. with version 5.0 of the L A T E X class copernicus.cls. Date: 15 January 2014 Numerical simulations of tsunami generated by underwater volcanic explosions at Karymskoye lake (Kamchatka, Russia) and Kolumbo volcano (Aegean Sea, Greece) M. Ulvrov´ a 1,2,3 , R. Paris 1,2,3 , K. Kelfoun 1,2,3 , and P. Nomikou 4 1 Clermont Universit´ e, Universit´ e Blaise Pascal, Laboratoire Magmas et Volcans, BP 10448, 63000 Clermont-Ferrand, France 2 Laboratoire Magmas et Volcans (LMV), UMR6524, CNRS, 63038 Clermont-Ferrand, France 3 IRD, R 163, LMV, 63038 Clermont-Ferrand, France 4 Department of Geology and Geoenvironment, University of Athens, Athens, Greece Correspondence to: M. Ulvrov´ a ([email protected]) Abstract. Increasing human activities along the coasts of the world arise the necessity to assess tsunami hazard from different sources (earthquakes, landslides, volcanic activity). In this paper, we simulate tsunamis generated by underwater volcanic explosions from (1) a submerged vent in a shallow water lake (Karymskoye Lake, Kamchatka), and (2) from Kolumbo submarine volcano (7 km NE of San- 5 torini, Aegean Sea, Greece). The 1996 tsunami in Karymskoye lake is a well-documented example and thus serves as a case-study for validating the calculations. The numerical model reproduces re- alistically the tsunami runups measured onshore. Systematic numerical study of tsunamis generated by explosions of Kolumbo volcano is then conducted for a wide range of energies. Results show that in case of reawakening, Kolumbo volcano might represent a significant tsunami hazard for the 10 northern, eastern and southern coasts of Santorini, even for small-power explosions. 1 Introduction While tsunamis generated by earthquakes and landslides are very well documented, less attention is paid to not so frequent but potentially damaging sources of tsunamis such as underwater explosions of volcanic or anthropic origin (e.g. Freundt et al., 2007; Paris et al., 2013). Underwater volcanic ex- 15 plosions are at the origin of around 1 % of all tsunamis listed for the last four centuries (Latter, 1981) and are particularly tsunamigenic when occurring in shallow water geometries, i.e. where the depth of the crater is small compared to the crater size (or the energy of eruption). They typically generate waves of short period limiting propagation and damage in space, but wave’s runup inland can be 1
Transcript of Numerical simulations of tsunami generated by underwater ... · tsunamis generated by underwater...
Manuscript prepared for Nat. Hazards Earth Syst. Sci.with version 5.0 of the LATEX class copernicus.cls.Date: 15 January 2014
Numerical simulations of tsunami generated byunderwater volcanic explosions at Karymskoye lake(Kamchatka, Russia) and Kolumbo volcano (AegeanSea, Greece)M. Ulvrova1,2,3, R. Paris1,2,3, K. Kelfoun1,2,3, and P. Nomikou4
1Clermont Universite, Universite Blaise Pascal, Laboratoire Magmas et Volcans, BP 10448, 63000Clermont-Ferrand, France2Laboratoire Magmas et Volcans (LMV), UMR6524, CNRS, 63038 Clermont-Ferrand, France3IRD, R 163, LMV, 63038 Clermont-Ferrand, France4Department of Geology and Geoenvironment, University of Athens, Athens, Greece
Correspondence to: M. Ulvrova ([email protected])
Abstract.
Increasing human activities along the coasts of the world arise the necessity to assess tsunami
hazard from different sources (earthquakes, landslides, volcanic activity). In this paper, we simulate
tsunamis generated by underwater volcanic explosions from (1) a submerged vent in a shallow water
lake (Karymskoye Lake, Kamchatka), and (2) from Kolumbo submarine volcano (7 km NE of San-5
torini, Aegean Sea, Greece). The 1996 tsunami in Karymskoye lake is a well-documented example
and thus serves as a case-study for validating the calculations. The numerical model reproduces re-
alistically the tsunami runups measured onshore. Systematic numerical study of tsunamis generated
by explosions of Kolumbo volcano is then conducted for a wide range of energies. Results show
that in case of reawakening, Kolumbo volcano might represent a significant tsunami hazard for the10
northern, eastern and southern coasts of Santorini, even for small-power explosions.
1 Introduction
While tsunamis generated by earthquakes and landslides are very well documented, less attention is
paid to not so frequent but potentially damaging sources of tsunamis such as underwater explosions
of volcanic or anthropic origin (e.g. Freundt et al., 2007; Paris et al., 2013). Underwater volcanic ex-15
plosions are at the origin of around 1 % of all tsunamis listed for the last four centuries (Latter, 1981)
and are particularly tsunamigenic when occurring in shallow water geometries, i.e. where the depth
of the crater is small compared to the crater size (or the energy of eruption). They typically generate
waves of short period limiting propagation and damage in space, but wave’s runup inland can be
1
locally high, especially in narrow bays and lakes (Kranzer and Keller, 1959; Basov et al. [(1954)]20
1981 Basov, Dorfman; Le Mehaute, 1971; Mirchina and Pelinovsky, 1988; Egorov, 2007). Existing
tsunami warning systems are structured primarily to deal with earthquake-generated tsunamis and
might be unsuited to deal with explosion-generated tsunamis. Unpredictability coupled with high
population densities at the coasts lying in potentially damaged areas make the risk clearly evident
(e.g. Nicaragua lakes, Indonesia, and Philippines etc.). However, Paris et al. (2013) point out that25
volcanic tsunamis, including underwater explosions, are rarely included in volcanic hazard studies,
even though they strongly expand the potential damage of many submerged volcanoes.
Tsunamis produced by underwater volcanic explosions were observed several times during the
20th century. For instance, the Kick’em Jenny volcano in the Caribbean Sea caused 2 m tsunami
waves at Grenada Island in 1939 (Smith and Shepherd, 1993). Local tsunami waves generated by30
underwater explosions in the Krakatau caldera were described and photographed by Stehn et al.
(1929). The Myojin-Sho (Japan) eruption in 1952 generated waves with amplitudes up to 1.4 m
high at 130 km from the volcano (Niino, 1952; Dietz and Sheehy, 1954; Miyoshi and Akiba, 1954).
Low amplitude tsunamis interpreted as the result of submarine explosions of Ritter Island volcano
(Papua New Guinea) were reported in October 1972 and October 1974 in the Bismarck Sea (Cooke,35
1981). The 1974 tsunami runup was 0.5 m high in Sakar and Umboi islands, located 10 km from
Ritter Island (Cooke, 1981; Soloviev and Kim, 1997). Numerous small tsunamis were reported and
sometimes photographed during explosions of Kavachi volcano in the Solomon Islands (Johnson
and Tuni, 1987). Repeated explosions at Karymskoye Lake (Kamchatka, Russia) in 1996 produced
waves with runups up to 19 m on the shores of the lake, which has a diameter of 4 km and a mean40
depth of 50–60 m (Belousov et al., 2000). Older events worldwide are less documented and the
precise nature of the tsunami sources is often uncertain. The 1716 tsunami in Taal Lake (Luzon,
Philippines) is inferred to have been generated by underwater explosion because the eruptive centre
was located offshore (Maso, 1904), but a landslide origin cannot be excluded. It is worth to note that
many underwater volcanic explosions are not tsunamigenic, depending on their depth, magnitude45
and on water-magma interactions.
In order to assess the potential hazard of tsunami with volcanic underwater explosion source we
use numerical calculations performed by tsunami modelling package COMCOT (Liu et al., 1995a;
Liu et al., 1998). Two different cases are simulated: (1) underwater explosions from a submerged
vent at around 40 m depth in a shallow water (Karymskoye lake, Kamchatka, Russia) and (2) under-50
water explosion from Kolumbo submarine volcano in Aegean Sea (Greece).
The tsunami in Karymskoye Lake is taken as a case-study for calibrating the code, since runups
onshore were measured all around the lake several months after the eruption at more than 20 lo-
cations (Belousov et al., 2000). Indeed, the subaqueous explosion dating back to 1996 provides
a unique opportunity to compare tsunami runup values obtained by numerical modeling with field55
runup measurements, cf. Fig. 1. Such an exercise has been done by Torsvik et al. (2010), who how-
2
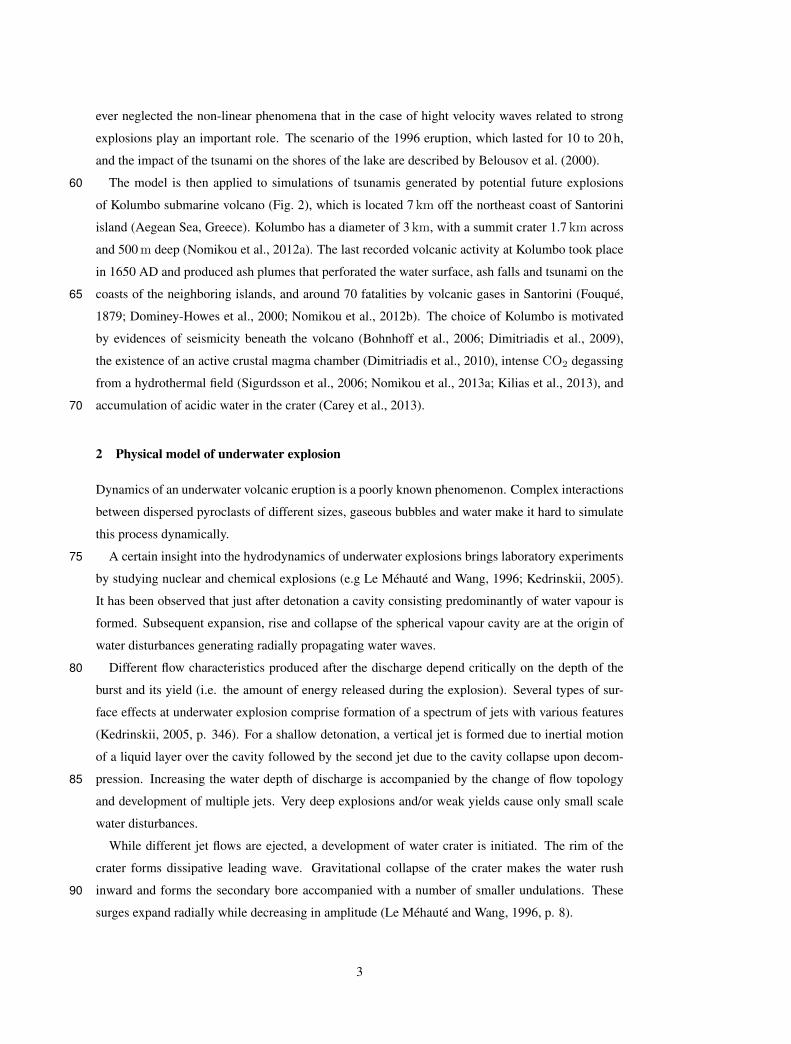
ever neglected the non-linear phenomena that in the case of hight velocity waves related to strong
explosions play an important role. The scenario of the 1996 eruption, which lasted for 10 to 20 h,
and the impact of the tsunami on the shores of the lake are described by Belousov et al. (2000).
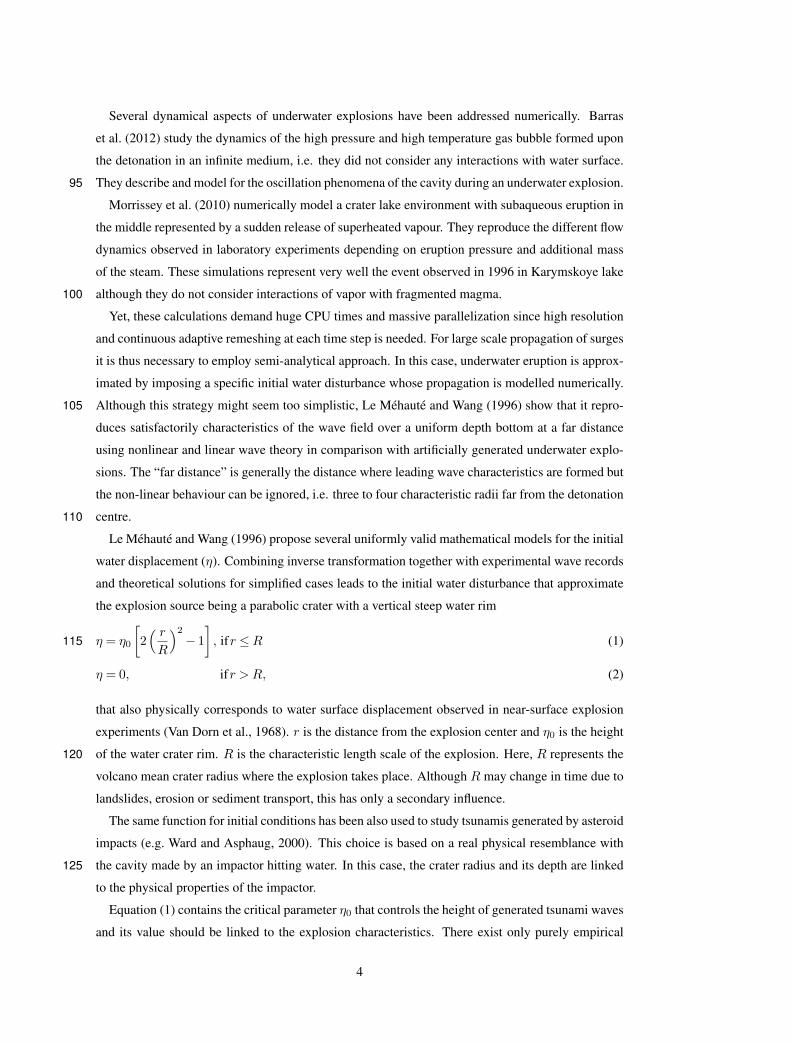
The model is then applied to simulations of tsunamis generated by potential future explosions60
of Kolumbo submarine volcano (Fig. 2), which is located 7 km off the northeast coast of Santorini
island (Aegean Sea, Greece). Kolumbo has a diameter of 3 km, with a summit crater 1.7 km across
and 500 m deep (Nomikou et al., 2012a). The last recorded volcanic activity at Kolumbo took place
in 1650 AD and produced ash plumes that perforated the water surface, ash falls and tsunami on the
coasts of the neighboring islands, and around 70 fatalities by volcanic gases in Santorini (Fouque,65
1879; Dominey-Howes et al., 2000; Nomikou et al., 2012b). The choice of Kolumbo is motivated
by evidences of seismicity beneath the volcano (Bohnhoff et al., 2006; Dimitriadis et al., 2009),
the existence of an active crustal magma chamber (Dimitriadis et al., 2010), intense CO2 degassing
from a hydrothermal field (Sigurdsson et al., 2006; Nomikou et al., 2013a; Kilias et al., 2013), and
accumulation of acidic water in the crater (Carey et al., 2013).70
2 Physical model of underwater explosion
Dynamics of an underwater volcanic eruption is a poorly known phenomenon. Complex interactions
between dispersed pyroclasts of different sizes, gaseous bubbles and water make it hard to simulate
this process dynamically.
A certain insight into the hydrodynamics of underwater explosions brings laboratory experiments75
by studying nuclear and chemical explosions (e.g Le Mehaute and Wang, 1996; Kedrinskii, 2005).
It has been observed that just after detonation a cavity consisting predominantly of water vapour is
formed. Subsequent expansion, rise and collapse of the spherical vapour cavity are at the origin of
water disturbances generating radially propagating water waves.
Different flow characteristics produced after the discharge depend critically on the depth of the80
burst and its yield (i.e. the amount of energy released during the explosion). Several types of sur-
face effects at underwater explosion comprise formation of a spectrum of jets with various features
(Kedrinskii, 2005, p. 346). For a shallow detonation, a vertical jet is formed due to inertial motion
of a liquid layer over the cavity followed by the second jet due to the cavity collapse upon decom-
pression. Increasing the water depth of discharge is accompanied by the change of flow topology85
and development of multiple jets. Very deep explosions and/or weak yields cause only small scale
water disturbances.
While different jet flows are ejected, a development of water crater is initiated. The rim of the
crater forms dissipative leading wave. Gravitational collapse of the crater makes the water rush
inward and forms the secondary bore accompanied with a number of smaller undulations. These90
surges expand radially while decreasing in amplitude (Le Mehaute and Wang, 1996, p. 8).
3
Several dynamical aspects of underwater explosions have been addressed numerically. Barras
et al. (2012) study the dynamics of the high pressure and high temperature gas bubble formed upon
the detonation in an infinite medium, i.e. they did not consider any interactions with water surface.
They describe and model for the oscillation phenomena of the cavity during an underwater explosion.95
Morrissey et al. (2010) numerically model a crater lake environment with subaqueous eruption in
the middle represented by a sudden release of superheated vapour. They reproduce the different flow
dynamics observed in laboratory experiments depending on eruption pressure and additional mass
of the steam. These simulations represent very well the event observed in 1996 in Karymskoye lake
although they do not consider interactions of vapor with fragmented magma.100
Yet, these calculations demand huge CPU times and massive parallelization since high resolution
and continuous adaptive remeshing at each time step is needed. For large scale propagation of surges
it is thus necessary to employ semi-analytical approach. In this case, underwater eruption is approx-
imated by imposing a specific initial water disturbance whose propagation is modelled numerically.
Although this strategy might seem too simplistic, Le Mehaute and Wang (1996) show that it repro-105
duces satisfactorily characteristics of the wave field over a uniform depth bottom at a far distance
using nonlinear and linear wave theory in comparison with artificially generated underwater explo-
sions. The “far distance” is generally the distance where leading wave characteristics are formed but
the non-linear behaviour can be ignored, i.e. three to four characteristic radii far from the detonation
centre.110
Le Mehaute and Wang (1996) propose several uniformly valid mathematical models for the initial
water displacement (η). Combining inverse transformation together with experimental wave records
and theoretical solutions for simplified cases leads to the initial water disturbance that approximate
the explosion source being a parabolic crater with a vertical steep water rim
η = η0
[2( rR
)2− 1
], ifr ≤R (1)115
η = 0, ifr > R, (2)
that also physically corresponds to water surface displacement observed in near-surface explosion
experiments (Van Dorn et al., 1968). r is the distance from the explosion center and η0 is the height
of the water crater rim. R is the characteristic length scale of the explosion. Here, R represents the120
volcano mean crater radius where the explosion takes place. Although R may change in time due to
landslides, erosion or sediment transport, this has only a secondary influence.
The same function for initial conditions has been also used to study tsunamis generated by asteroid
impacts (e.g. Ward and Asphaug, 2000). This choice is based on a real physical resemblance with
the cavity made by an impactor hitting water. In this case, the crater radius and its depth are linked125
to the physical properties of the impactor.
Equation (1) contains the critical parameter η0 that controls the height of generated tsunami waves
and its value should be linked to the explosion characteristics. There exist only purely empirical
4
relations that estimate η0 as a function of explosion energy E [J] released. These were derived for
shallow or intermediate depth explosions. The generic scaling law is (Le Mehaute and Wang, 1996)130
η0 = cE0.24, (3)
where c is a constant. According to the explosion yield, two cases are distinguished: c= 0.014
for smaller explosions for which holds 0.076< dc/W1/3 < 2.286 (dc is the depth of explosion, i.e.
the depth of the volcano crater, in meters and W the explosion yield in pounds of TNT). Larger
explosions, 0< dc/W1/3 < 0.076, produce larger cavities and c doubles, c= 0.029. Shallower135
explosion thus causes deeper water crater for the same yield.
Explosion energy E [J] is generally proportional to the third power of the crater diameter. Sato
and Taniguchi (1997) give an empirical relationship
E = 3.56× 10⁷R3, (4)
where data from experimental and volcanic explosions varying over 14 orders of magnitude up to140
E ∼ 1017 J (corresponding to a crater radius up to R∼ 1.5 km) were used for fitting. The size of
a volcanic crater represents the cumulated energy of multiple explosions (e.g Valentine et al., 2012)
and might be modified by later erosion. Energy obtained from the crater radius is thus a maximum
estimation used for simulating past events such as the 1996 Karymskoye Lake volcanic explosions.
Simulations of future underwater explosions must be conducted for different energies which are145
determined from style of past eruptions. Energies considered typically range between 1012 and
1017 J, corresponding approximately to volcanic crater radius of 100 to 1500 m.
3 Numerical model
In order to perform numerical simulations of volcanic explosion resulting in tsunami wave travel-
ling across the water we adopt the Cornell multi-grid coupled tsunami model COMCOT (Liu et al.,150
1995a; Liu et al., 1998), that solves for the nonlinear shallow water equations (NSWE), cf. Ap-
pendix A. The COMCOT numerical model has been extensively tested and validated against labo-
ratory experiments (Liu et al., 1995b). Successful diverse applications were computed including the
1992 tsunami in Babi Island, Indonesia (Liu et al., 1995b), 1993 tsunami in Okushiri Island, Japan
(Liu et al., 1995b), 1960 Chilian tsunami recorded at Hilo, Hawaii (Liu et al., 1995a) or 2004 Indian155
Ocean tsunami (Wang and Liu, 2006, 2007).
Tsunami wave field generated by underwater explosions depends critically on the explosion
power. However, other physical parameters can change the tsunami propagation and in particular
the influence of dissipative mechanisms might be important especially in shallow waters. Here, we
neglect the interfacial shear stress and horizontal diffusion force, but examine the effect of bottom160
friction. The term describing the bottom friction is introduced in governing equations using the
5
Manning’s formula (cf. Appendix A)
gn2mH7/3
F|F |, (5)
where g is the gravity, H the total water depth, F =Hv the volume flux with v the horizontal
velocity vector at the seafloor, and nm the Manning coefficient. Manning coefficient should be165
spatially variable according to the surface roughness and in particular it should differ in between
the sea bottom and populated coastal areas. However, it is often considered constant in tsunami
numerical simulations and its value around 0.025 m−1/3 s is used in calculations. This is a value
that is adapted from water engineering studies and was empirically determined for natural channels
(Linsley et al., 1992, p. 314).170
4 Grid preparation
4.1 Karymskoye lake
To perform simulations, topography and bathymetry data are needed. A 274× 334 grid with a res-
olution of 21 m of the pre-eruption bathymetry and topography of Karymskoye lake and its sur-
roundings was prepared by Torsvik et al. (2010). We further improve the quality of the grid on the175
shores by georeferencing and digitalizing 1 : 10000 topographical maps of the lake dating 1974.
The data are then interpolated on the 498× 488 mesh with resolution of 9 m in the both horizon-
tal directions to obtain higher precision data. Time step ∆t= 0.01 s is chosen so as to satisfy the
Courant–Friedrichs–Lewy (CFL) condition ensuring the stability of employed numerical scheme.
The CFL condition is given by the following formula180
∆t≤ ∆x√ghmax
, (6)
where ∆x is the grid size and hmax is the greatest still water depth in the calculation domain.
4.2 Kolumbo and Santorini
To perform simulations of tsunami generated by Kolumbo explosion registered at Santorini, we
use topography and bathymetry data prepared in Nomikou et al. (2013b), cf. Fig. 2. The swath185
bathymetry was obtained from several oceanographic surveys. The first data were collected in 2001,
and further refined in 2006. The resulting computational grid has a spatial resolution of 50 m. Time
step size is chosen to be ∆t= 0.15 s that satisfies the CFL criterion, cf. Eq. (6). Artificial tide gauges
were placed offshore near areas of particular vulnerability in case of tsunami (harbors, touristic
resorts, coastal towns).190
6
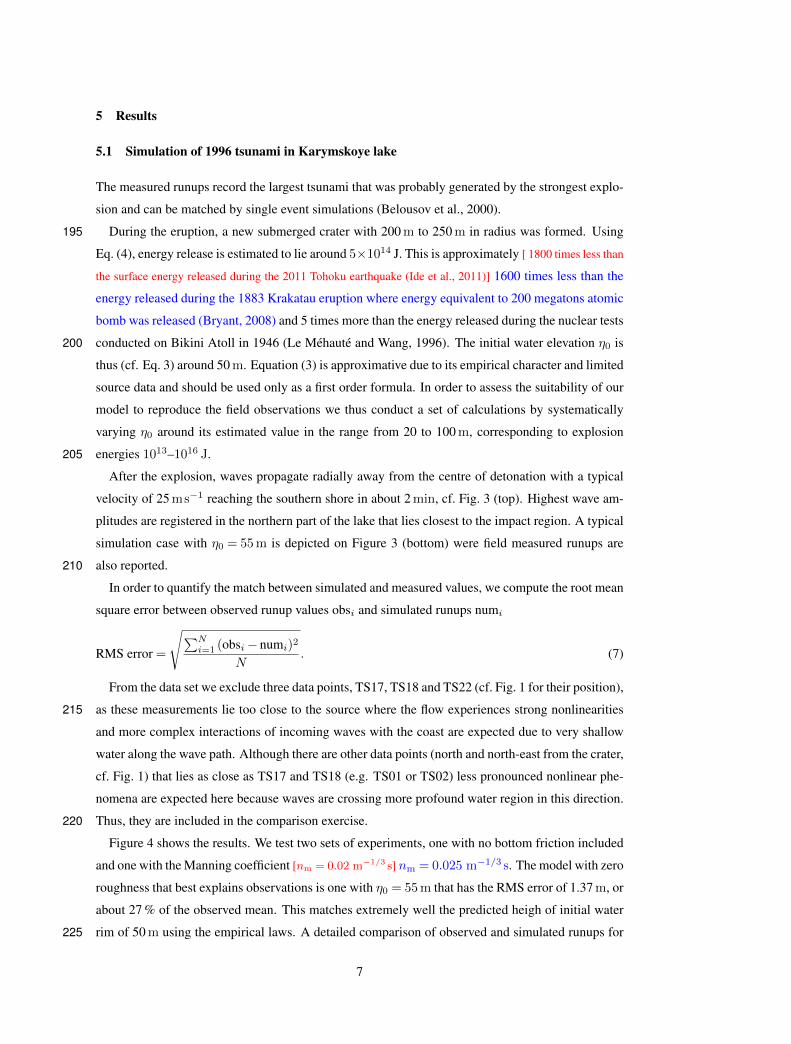
5 Results
5.1 Simulation of 1996 tsunami in Karymskoye lake
The measured runups record the largest tsunami that was probably generated by the strongest explo-
sion and can be matched by single event simulations (Belousov et al., 2000).
During the eruption, a new submerged crater with 200 m to 250 m in radius was formed. Using195
Eq. (4), energy release is estimated to lie around 5×10¹⁴ J. This is approximately [ 1800 times less than
the surface energy released during the 2011 Tohoku earthquake (Ide et al., 2011)] 1600 times less than the
energy released during the 1883 Krakatau eruption where energy equivalent to 200 megatons atomic
bomb was released (Bryant, 2008) and 5 times more than the energy released during the nuclear tests
conducted on Bikini Atoll in 1946 (Le Mehaute and Wang, 1996). The initial water elevation η0 is200
thus (cf. Eq. 3) around 50 m. Equation (3) is approximative due to its empirical character and limited
source data and should be used only as a first order formula. In order to assess the suitability of our
model to reproduce the field observations we thus conduct a set of calculations by systematically
varying η0 around its estimated value in the range from 20 to 100 m, corresponding to explosion
energies 1013–1016 J.205
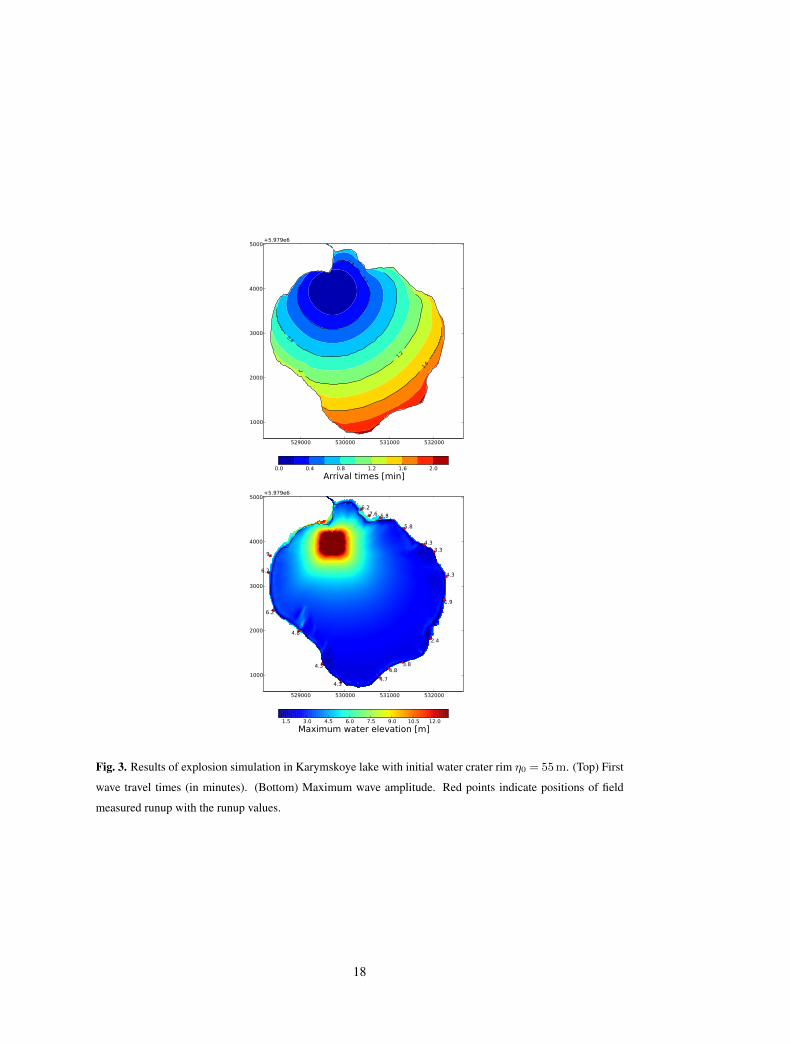
After the explosion, waves propagate radially away from the centre of detonation with a typical
velocity of 25 ms−1 reaching the southern shore in about 2 min, cf. Fig. 3 (top). Highest wave am-
plitudes are registered in the northern part of the lake that lies closest to the impact region. A typical
simulation case with η0 = 55 m is depicted on Figure 3 (bottom) were field measured runups are
also reported.210
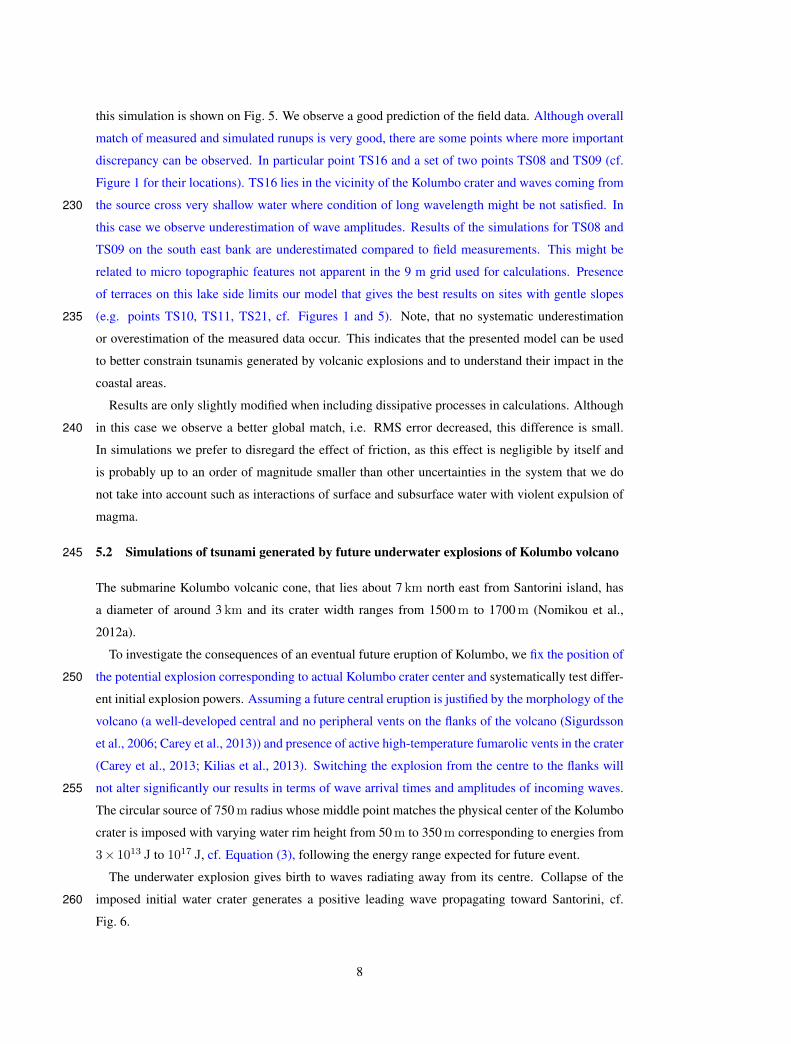
In order to quantify the match between simulated and measured values, we compute the root mean
square error between observed runup values obsi and simulated runups numi
RMS error =
√∑Ni=1 (obsi− numi)2
N. (7)
From the data set we exclude three data points, TS17, TS18 and TS22 (cf. Fig. 1 for their position),
as these measurements lie too close to the source where the flow experiences strong nonlinearities215
and more complex interactions of incoming waves with the coast are expected due to very shallow
water along the wave path. Although there are other data points (north and north-east from the crater,
cf. Fig. 1) that lies as close as TS17 and TS18 (e.g. TS01 or TS02) less pronounced nonlinear phe-
nomena are expected here because waves are crossing more profound water region in this direction.
Thus, they are included in the comparison exercise.220
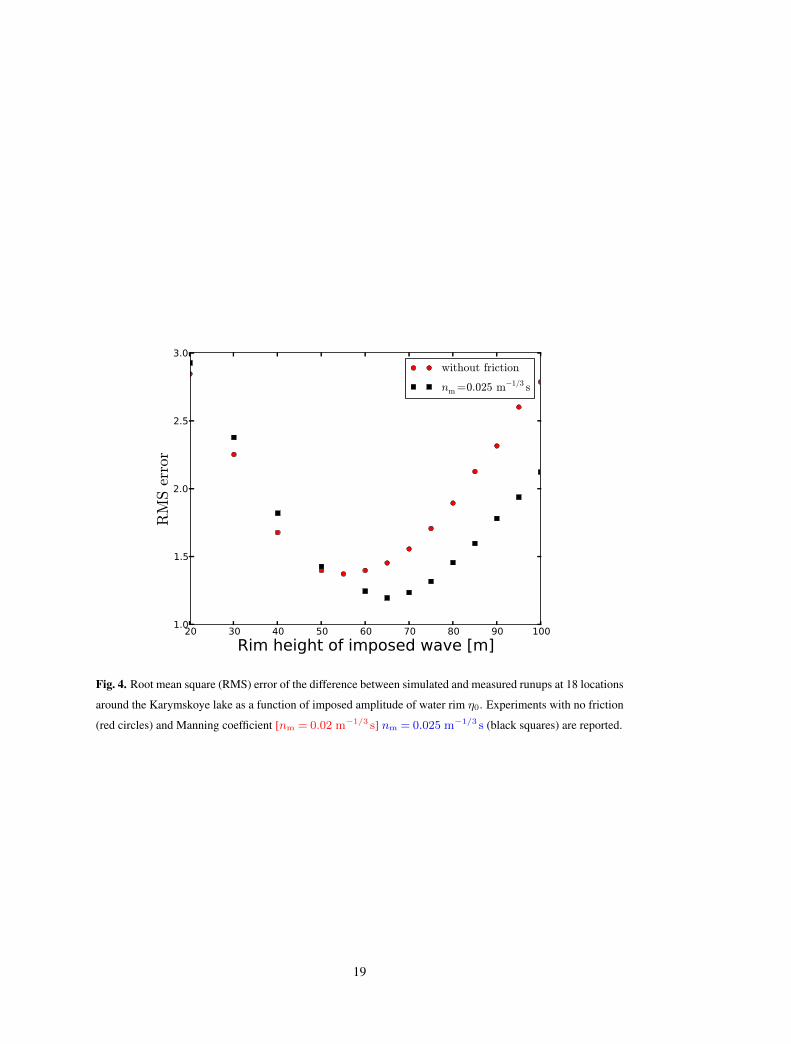
Figure 4 shows the results. We test two sets of experiments, one with no bottom friction included
and one with the Manning coefficient [nm = 0.02 m−1/3 s] nm = 0.025 m−1/3 s. The model with zero
roughness that best explains observations is one with η0 = 55 m that has the RMS error of 1.37 m, or
about 27 % of the observed mean. This matches extremely well the predicted heigh of initial water
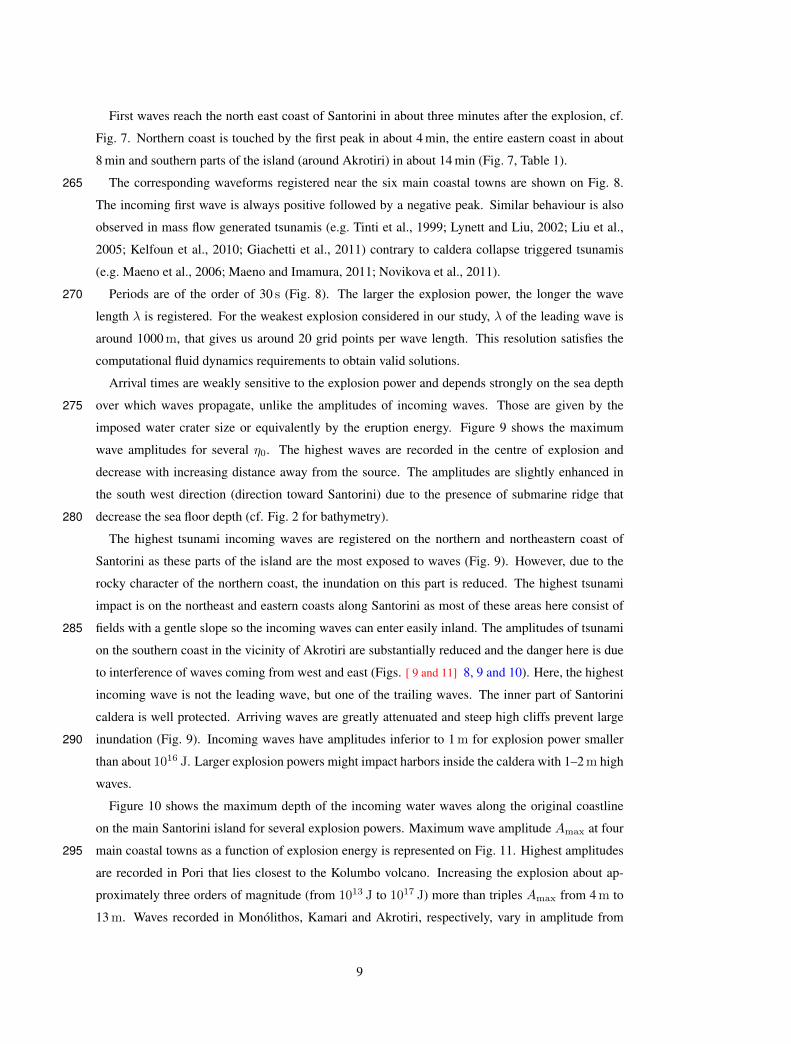
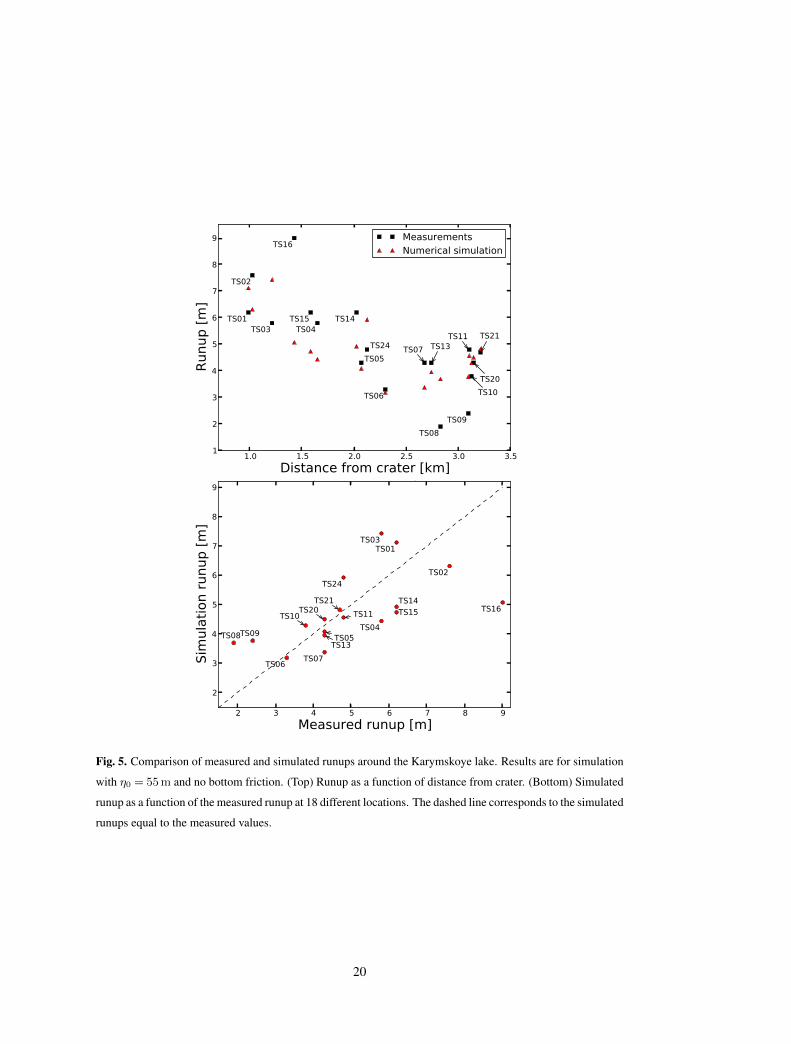
rim of 50 m using the empirical laws. A detailed comparison of observed and simulated runups for225
7
this simulation is shown on Fig. 5. We observe a good prediction of the field data. Although overall
match of measured and simulated runups is very good, there are some points where more important
discrepancy can be observed. In particular point TS16 and a set of two points TS08 and TS09 (cf.
Figure 1 for their locations). TS16 lies in the vicinity of the Kolumbo crater and waves coming from
the source cross very shallow water where condition of long wavelength might be not satisfied. In230
this case we observe underestimation of wave amplitudes. Results of the simulations for TS08 and
TS09 on the south east bank are underestimated compared to field measurements. This might be
related to micro topographic features not apparent in the 9 m grid used for calculations. Presence
of terraces on this lake side limits our model that gives the best results on sites with gentle slopes
(e.g. points TS10, TS11, TS21, cf. Figures 1 and 5). Note, that no systematic underestimation235
or overestimation of the measured data occur. This indicates that the presented model can be used
to better constrain tsunamis generated by volcanic explosions and to understand their impact in the
coastal areas.
Results are only slightly modified when including dissipative processes in calculations. Although
in this case we observe a better global match, i.e. RMS error decreased, this difference is small.240
In simulations we prefer to disregard the effect of friction, as this effect is negligible by itself and
is probably up to an order of magnitude smaller than other uncertainties in the system that we do
not take into account such as interactions of surface and subsurface water with violent expulsion of
magma.
5.2 Simulations of tsunami generated by future underwater explosions of Kolumbo volcano245
The submarine Kolumbo volcanic cone, that lies about 7 km north east from Santorini island, has
a diameter of around 3 km and its crater width ranges from 1500 m to 1700 m (Nomikou et al.,
2012a).
To investigate the consequences of an eventual future eruption of Kolumbo, we fix the position of
the potential explosion corresponding to actual Kolumbo crater center and systematically test differ-250
ent initial explosion powers. Assuming a future central eruption is justified by the morphology of the
volcano (a well-developed central and no peripheral vents on the flanks of the volcano (Sigurdsson
et al., 2006; Carey et al., 2013)) and presence of active high-temperature fumarolic vents in the crater
(Carey et al., 2013; Kilias et al., 2013). Switching the explosion from the centre to the flanks will
not alter significantly our results in terms of wave arrival times and amplitudes of incoming waves.255
The circular source of 750 m radius whose middle point matches the physical center of the Kolumbo
crater is imposed with varying water rim height from 50 m to 350 m corresponding to energies from
3× 10¹³ J to 1017 J, cf. Equation (3), following the energy range expected for future event.
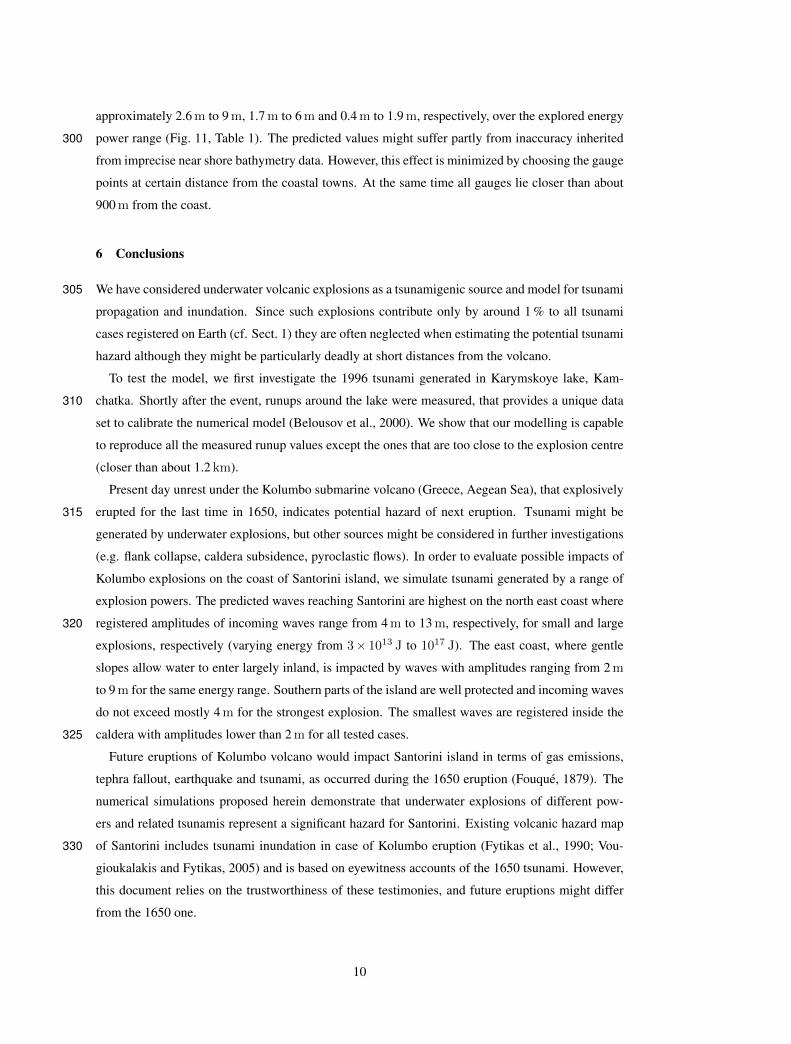
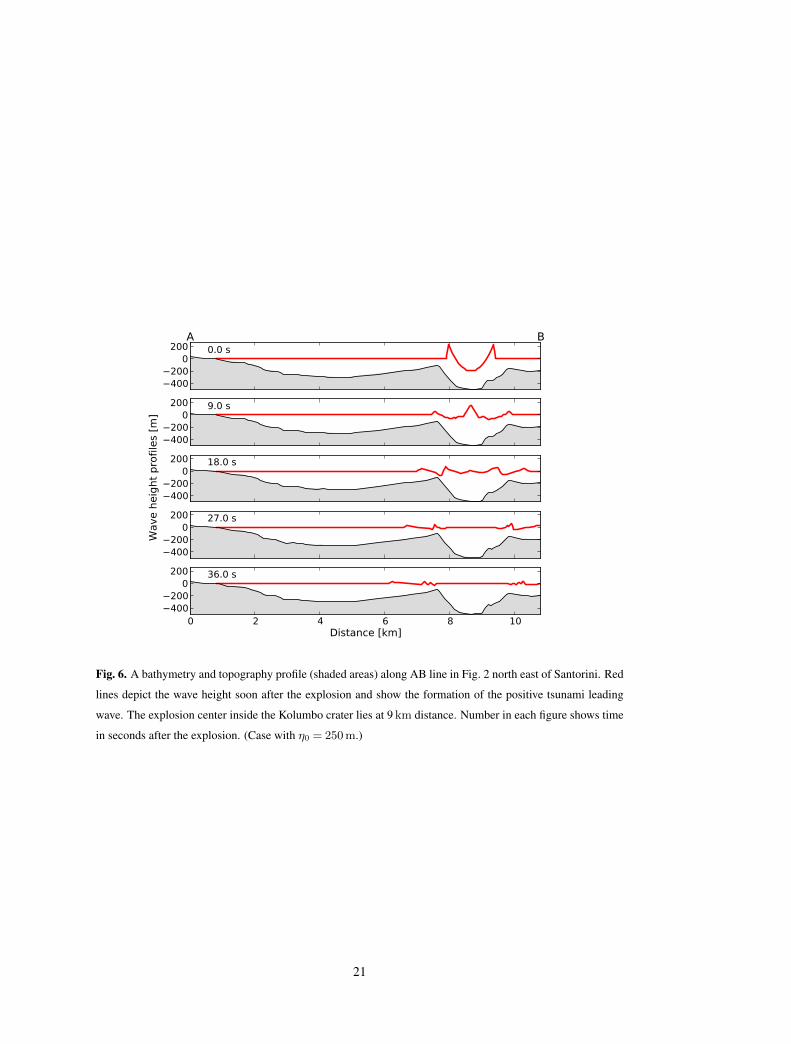
The underwater explosion gives birth to waves radiating away from its centre. Collapse of the
imposed initial water crater generates a positive leading wave propagating toward Santorini, cf.260
Fig. 6.
8
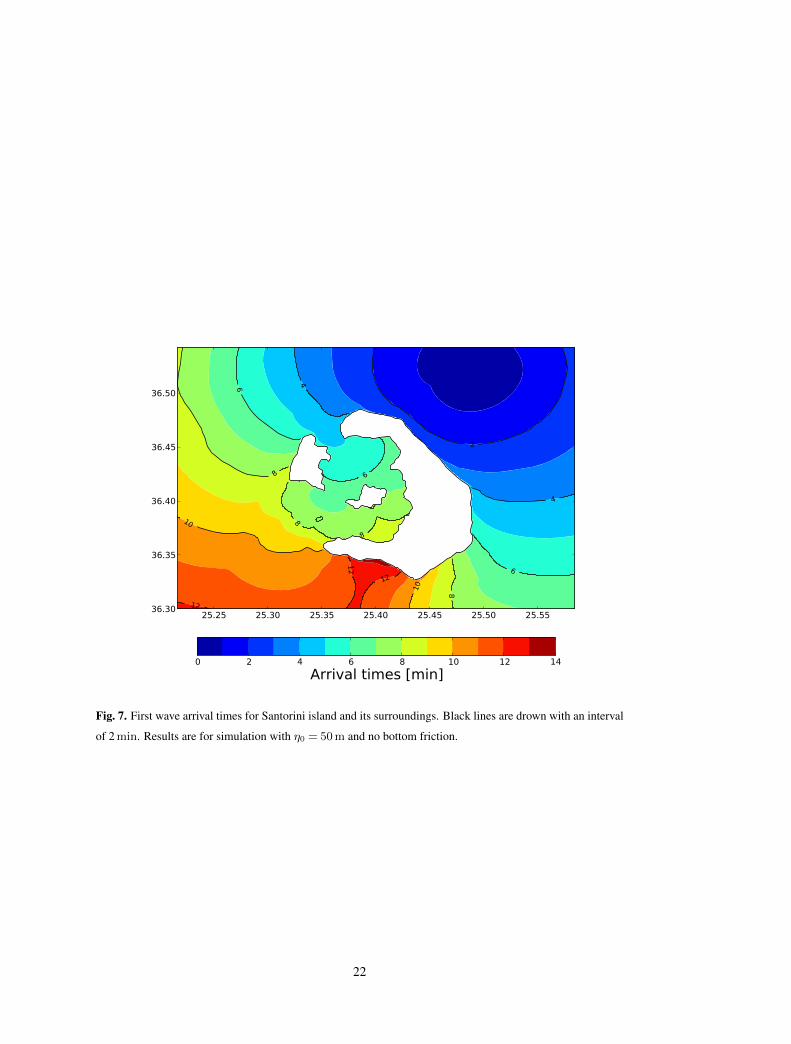
First waves reach the north east coast of Santorini in about three minutes after the explosion, cf.
Fig. 7. Northern coast is touched by the first peak in about 4 min, the entire eastern coast in about
8 min and southern parts of the island (around Akrotiri) in about 14 min (Fig. 7, Table 1).
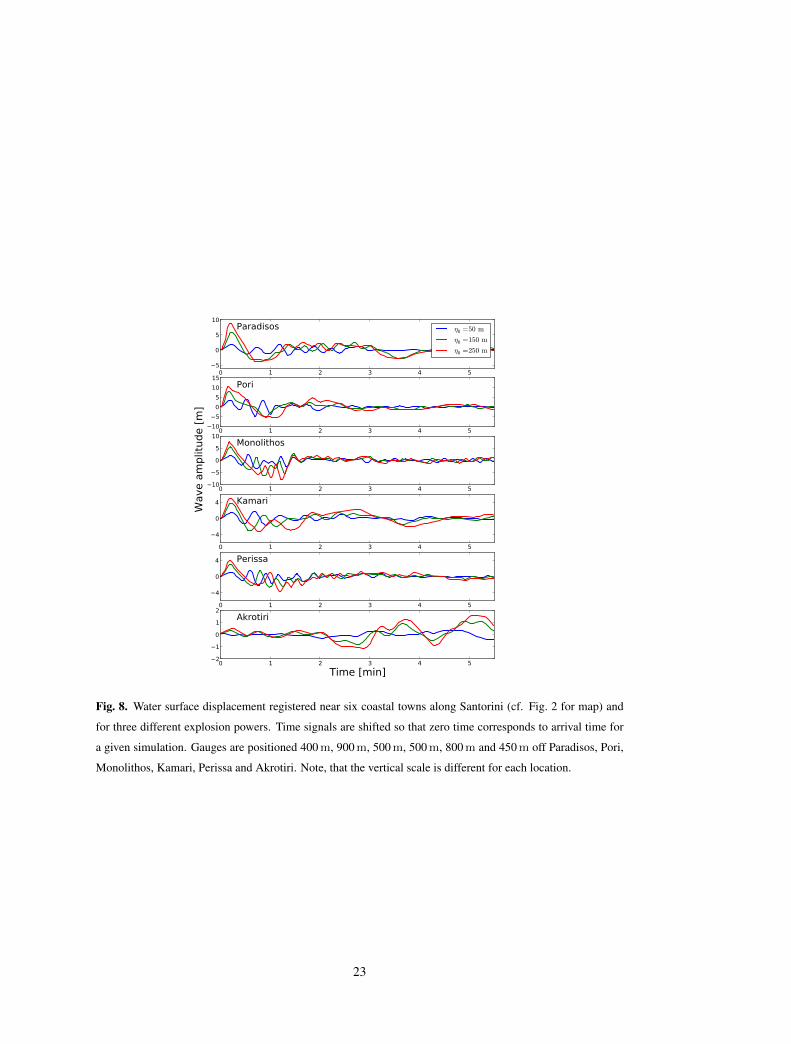
The corresponding waveforms registered near the six main coastal towns are shown on Fig. 8.265
The incoming first wave is always positive followed by a negative peak. Similar behaviour is also
observed in mass flow generated tsunamis (e.g. Tinti et al., 1999; Lynett and Liu, 2002; Liu et al.,
2005; Kelfoun et al., 2010; Giachetti et al., 2011) contrary to caldera collapse triggered tsunamis
(e.g. Maeno et al., 2006; Maeno and Imamura, 2011; Novikova et al., 2011).
Periods are of the order of 30 s (Fig. 8). The larger the explosion power, the longer the wave270
length λ is registered. For the weakest explosion considered in our study, λ of the leading wave is
around 1000 m, that gives us around 20 grid points per wave length. This resolution satisfies the
computational fluid dynamics requirements to obtain valid solutions.
Arrival times are weakly sensitive to the explosion power and depends strongly on the sea depth
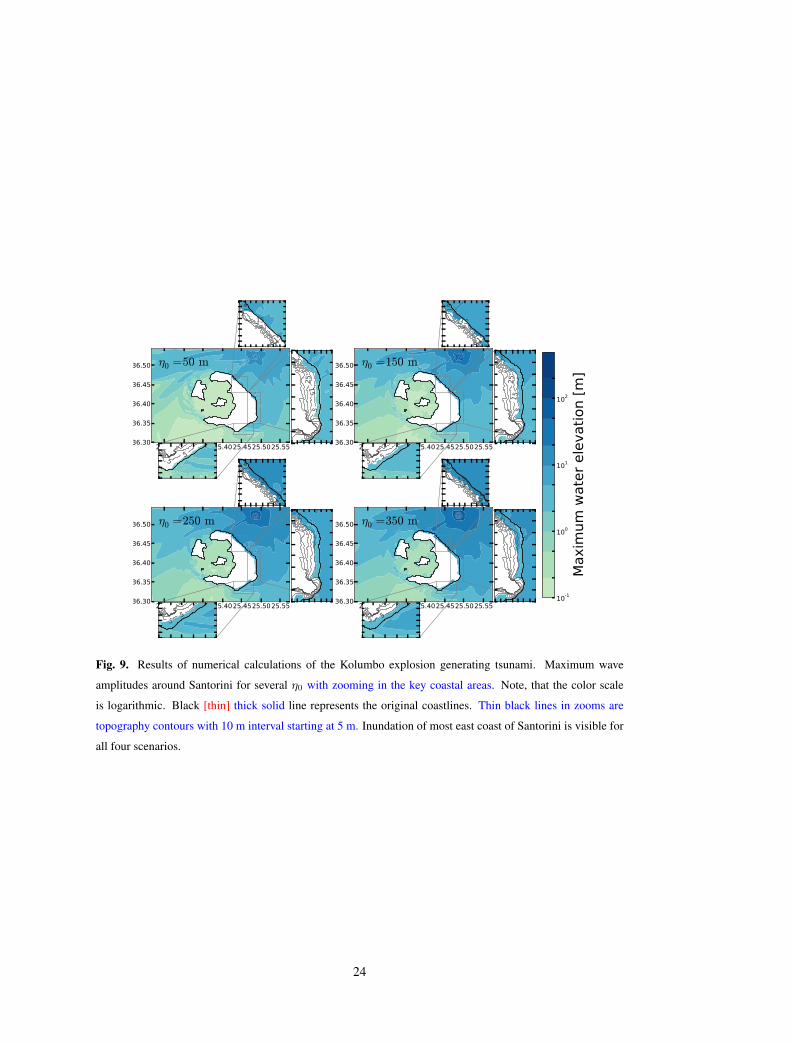
over which waves propagate, unlike the amplitudes of incoming waves. Those are given by the275
imposed water crater size or equivalently by the eruption energy. Figure 9 shows the maximum
wave amplitudes for several η0. The highest waves are recorded in the centre of explosion and
decrease with increasing distance away from the source. The amplitudes are slightly enhanced in
the south west direction (direction toward Santorini) due to the presence of submarine ridge that
decrease the sea floor depth (cf. Fig. 2 for bathymetry).280
The highest tsunami incoming waves are registered on the northern and northeastern coast of
Santorini as these parts of the island are the most exposed to waves (Fig. 9). However, due to the
rocky character of the northern coast, the inundation on this part is reduced. The highest tsunami
impact is on the northeast and eastern coasts along Santorini as most of these areas here consist of
fields with a gentle slope so the incoming waves can enter easily inland. The amplitudes of tsunami285
on the southern coast in the vicinity of Akrotiri are substantially reduced and the danger here is due
to interference of waves coming from west and east (Figs. [ 9 and 11] 8, 9 and 10). Here, the highest
incoming wave is not the leading wave, but one of the trailing waves. The inner part of Santorini
caldera is well protected. Arriving waves are greatly attenuated and steep high cliffs prevent large
inundation (Fig. 9). Incoming waves have amplitudes inferior to 1 m for explosion power smaller290
than about 1016 J. Larger explosion powers might impact harbors inside the caldera with 1–2 m high
waves.
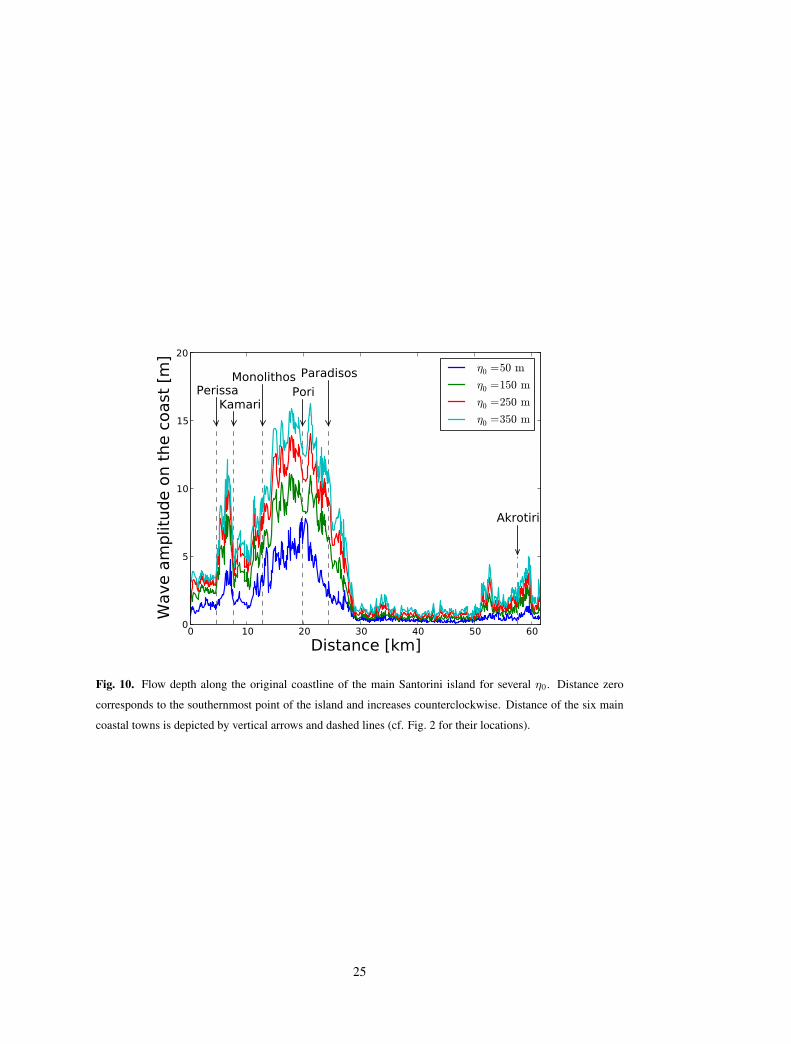
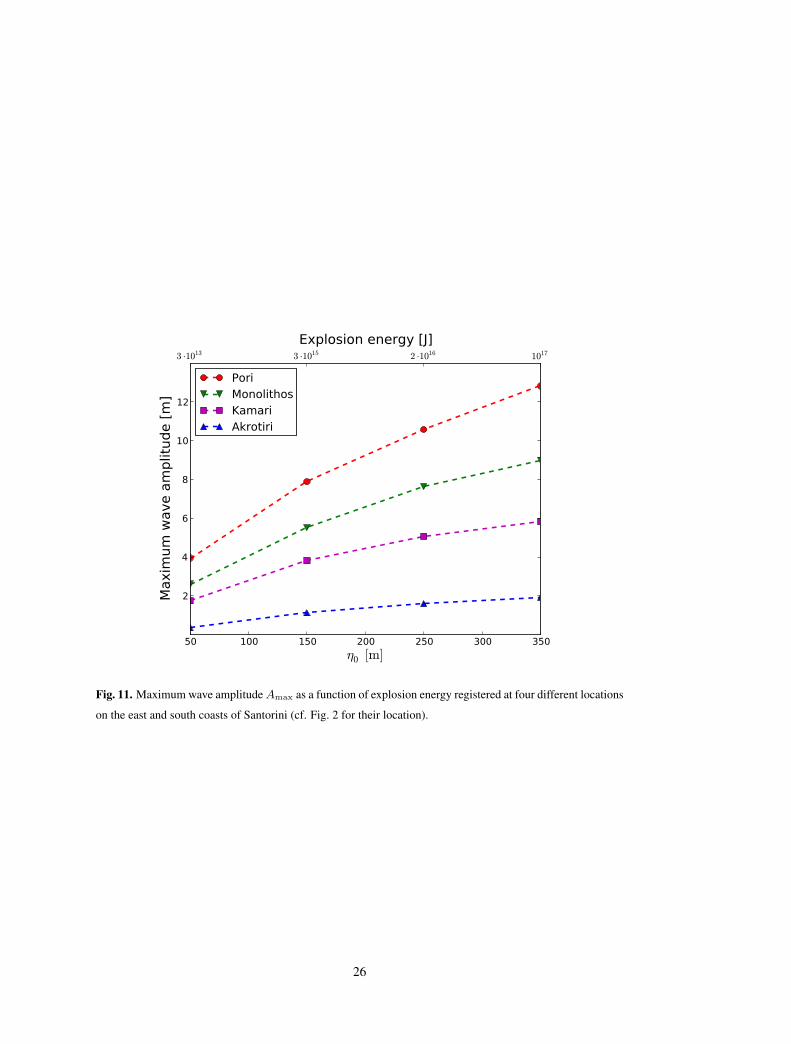
Figure 10 shows the maximum depth of the incoming water waves along the original coastline
on the main Santorini island for several explosion powers. Maximum wave amplitude Amax at four
main coastal towns as a function of explosion energy is represented on Fig. 11. Highest amplitudes295
are recorded in Pori that lies closest to the Kolumbo volcano. Increasing the explosion about ap-
proximately three orders of magnitude (from 1013 J to 1017 J) more than triples Amax from 4 m to
13 m. Waves recorded in Monolithos, Kamari and Akrotiri, respectively, vary in amplitude from
9
approximately 2.6 m to 9 m, 1.7 m to 6 m and 0.4 m to 1.9 m, respectively, over the explored energy
power range (Fig. 11, Table 1). The predicted values might suffer partly from inaccuracy inherited300
from imprecise near shore bathymetry data. However, this effect is minimized by choosing the gauge
points at certain distance from the coastal towns. At the same time all gauges lie closer than about
900 m from the coast.
6 Conclusions
We have considered underwater volcanic explosions as a tsunamigenic source and model for tsunami305
propagation and inundation. Since such explosions contribute only by around 1 % to all tsunami
cases registered on Earth (cf. Sect. 1) they are often neglected when estimating the potential tsunami
hazard although they might be particularly deadly at short distances from the volcano.
To test the model, we first investigate the 1996 tsunami generated in Karymskoye lake, Kam-
chatka. Shortly after the event, runups around the lake were measured, that provides a unique data310
set to calibrate the numerical model (Belousov et al., 2000). We show that our modelling is capable
to reproduce all the measured runup values except the ones that are too close to the explosion centre
(closer than about 1.2 km).
Present day unrest under the Kolumbo submarine volcano (Greece, Aegean Sea), that explosively
erupted for the last time in 1650, indicates potential hazard of next eruption. Tsunami might be315
generated by underwater explosions, but other sources might be considered in further investigations
(e.g. flank collapse, caldera subsidence, pyroclastic flows). In order to evaluate possible impacts of
Kolumbo explosions on the coast of Santorini island, we simulate tsunami generated by a range of
explosion powers. The predicted waves reaching Santorini are highest on the north east coast where
registered amplitudes of incoming waves range from 4 m to 13 m, respectively, for small and large320
explosions, respectively (varying energy from 3× 10¹³ J to 1017 J). The east coast, where gentle
slopes allow water to enter largely inland, is impacted by waves with amplitudes ranging from 2 m
to 9 m for the same energy range. Southern parts of the island are well protected and incoming waves
do not exceed mostly 4 m for the strongest explosion. The smallest waves are registered inside the
caldera with amplitudes lower than 2 m for all tested cases.325
Future eruptions of Kolumbo volcano would impact Santorini island in terms of gas emissions,
tephra fallout, earthquake and tsunami, as occurred during the 1650 eruption (Fouque, 1879). The
numerical simulations proposed herein demonstrate that underwater explosions of different pow-
ers and related tsunamis represent a significant hazard for Santorini. Existing volcanic hazard map
of Santorini includes tsunami inundation in case of Kolumbo eruption (Fytikas et al., 1990; Vou-330
gioukalakis and Fytikas, 2005) and is based on eyewitness accounts of the 1650 tsunami. However,
this document relies on the trustworthiness of these testimonies, and future eruptions might differ
from the 1650 one.
10
Appendix A
Governing equations in COMCOT335
The standard non-linear shallow water equations are employed in COMCOT
∂η
∂t+∂P
∂x+∂Q
∂y= 0, (A1)
∂P
∂t+
∂
∂x
(P 2
H
)+
∂
∂y
(PQ
H
)+ gH
∂η
∂x+τxρ
= 0, (A2)
∂Q
∂t+
∂
∂y
(Q2
H
)+
∂
∂x
(PQ
H
)+ gH
∂η
∂y+τyρ
= 0, (A3)340
where η is the water free surface elevation, and P and Q the volume fluxes for which hold P =Hu
and q =Hv. u and v are vertically averaged velocities in x and y directions, respectively. H is
the total water depth (H = h+ η with h the still water depth), g the gravity acceleration and ρ the
water density. The last terms in Eqs. (A2) and (A3) represent bottom friction in x and y directions,
respectively. Bottom shear stresses τx and τy are then modeled using the Manning formula345
τxρ
=gn2mH7/3
P√P 2 +Q2, (A4)
τyρ
=gn2mH7/3
Q√P 2 +Q2, (A5)
where nm is the Manning’s roughness coefficient.
For the simplicity, only equations in the Cartesian coordinate system are given here. However,350
COMCOT package also solves for the governing equations in the spherical geometry with Coriolis
force due to rotation of the Earth included. Cartesian coordinate system was used in all tsunami
calculations in Karymskoye lake, whereas spherical coordinates were employed in the calculations
of tsunamis generated by Kolumbo underwater explosion.
Acknowledgements. M. Ulvrova is grateful to Xiaoming Wang for his help with COMCOT. We also thank355
participants of the field trip to Santorini island in May 2013. The support for this research has been provided
by FP7-ENV-2013 program ASTARTE and the Laboratory of Excellence ClerVolc. This paper benefited from
LATEX, GMT (Wessel and Smith, 1991) and Matplotlib (Hunter, 2007) magic.
The publication of this article is360
financed by CNRS-INSU.
11
References
Barras, G., Souli, M., Aquelet, N., and Couty, N.: Numerical simulation of underwater explosions using an
ALE method, the pulsating bubble phenomena, Ocean Eng., 41, 53–66, 2012.
Basov, B. I., Dorfman, A. A., Levin, B. V., and Kharlamov, A. A.: On ocean surface waves produced by365
underwater volcanic eruption, Vulkanologiya i Seismologiya, 1, 93–98, [1954] 1981.
Belousov, A., Voight, B., Belousova, M., and Muravyev, Y.: Tsunamis generated by subaquatic volcanic explo-
sions: unique data from 1996 eruption in Karymskoye Lake, Kamchatka, Russia, Pure Appl. Geophys., 157,
1135–1143, 2000.
Bohnhoff, M., Rische, M., Meier, T., Becker, D., Stavrakakis, G., and Harjes, H.-P.: Microseismic activity in370
the Hellenic Volcanic Arc, Greece, with emphasis on the seismotectonic setting of the Santorini Amorgos
zone, Tectonophysics, 423, 17–33, 2006.
Bryant, E.: Tsunami: The Underrated Hazard, Springer, 2008.
Carey, S., Nomikou, P., Bell, K. C., Lilley, M., Lupton, J., Roman, C., Stathopoulou, E., Bejelou, K., and
Ballard, R.: CO2 degassing from hydrothermal vents at Kolumbo submarine volcano, Greece, and the accu-375
mulation of acidic crater water, Geology, 41, 1035–1038, 2013.
Cooke, R. J. S.: Eruptive history of the volcano at Ritter Island, in: Cooke-Ravian Volume of Volcanological
Papers, edited by: Johnson, R. W., vol. 10, Geol. Surv., Papua New Guinea, 115–123, 1981.
Dietz, R. S. and Sheehy, M. J.: Transpacific detection of Myojin volcanic explosions by underwater sound,
Geol. Soc. Am. Bull., 65, 941–956, 1954.380
Dimitriadis, I., Karagianni, E., Panagiotopoulos, D., Papazachos, C., Hatzidimitriou, P., Bohnhoff, M.,
Rische, M., and Meier, T.: Seismicity and active tectonics at Coloumbo Reef (Aegean Sea, Greece): mon-
itoring an active volcano at Santorini Volcanic Center using a temporary seismic network, Tectonophysics,
465, 136–149, 2009.
Dimitriadis, I., Papazachos, C., Panagiotopoulos, D., Hatzidimitriou, P., Bohnhoff, M., Rische, M., and385
Meier, T.: P and S velocity structures of the Santorini–Coloumbo volcanic system (Aegean Sea, Greece)
obtained by non-linear inversion of travel times and its tectonic implications, J. Volcanol. Geoth. Res., 195,
13–30, 2010.
Dominey-Howes, D., Papadopoulos, G., and Dawson, A.: Geological and historical investigation of the 1650
Mt. Columbo (Thera Island) eruption and tsunami, Aegean Sea, Greece, Nat. Hazards, 21, 83–96, 2000.390
Egorov, Y.: Tsunami wave generation by the eruption of underwater volcano, Nat. Hazards Earth Syst. Sci., 7,
65–69, doi:http://dx.doi.org/10.5194/nhess-7-65-200710.5194/nhess-7-65-2007, 2007.
Fouque, F.: Santorin et ses eruptions, G. Masson, 1879.
Freundt, A., Strauch, W., Kutterolf, S., and Schmincke, H.-U.: Volcanogenic tsunamis in lakes: examples from
Nicaragua and general implications, Pure Appl. Geophys., 164, 527–545, 2007.395
Fytikas, M., Kolios, N., and Vougioukalakis, G.: Post-Minoan volcanic activity of the Santorini volcano. Vol-
canic hazard and risk. Forecasting possibilities, in: Therea and the Aegean World III, edited by: Hardy, D. A.,
Keller, J., Galanopoulos, V. P., Flemming, N. C., and Druitt, T. H., vol. 2, Proceedings of the third interna-
tional congress, Santorini, Greece 3–9 September 1989, 183–198, The Thera Foundation, 1990.
Giachetti, T., Paris, R., Kelfoun, K., and Perez Torrado, F. J.: Numerical modelling of the tsunami triggered by400
the Guimar debris avalanche, Tenerife (Canary Islands): comparison with field-based data, Mar. Geol., 284,
12
189–202, 2011.
Hunter, J. D.: Matplotlib: a 2D graphics environment, Comput. Sci. Eng., 9, 90–95, 2007.
Ide, S., Baltay, A., and Beroza, G. C.: Shallow dynamic overshoot and energetic
deep rupture in the 2011 Mw 9.0 Tohoku-Oki earthquake, Science, 332, 1426–1429,405
doi:http://dx.doi.org/10.1126/science.120702010.1126/science.1207020, 2011.
Johnson, R. W. and Tuni, D.: Kavachi, an active forearc volcano in the western Solomon Islands: reported
eruptions between 1950 and 1982, in: Marine Geology, Geophysics, and Geochemistry of the Woodlark
Basin: Solomon Islands, edited by: Taylor, B. J. and Exon, N. F., Earth Science Series 7, 89–112, Circum-
Pacific Council for Energy and Mineral Resources, 1987.410
Kedrinskii, V. K.: Hydrodynamics of Explosion, Springer, Berlin, Heidelberg, 2005.
Kelfoun, K., Giachetti, T., and Labazuy, P.: Landslide-generated tsunamis at Reunion Island, J. Geophys. Res.-
Earth, 115, F04012, doi:http://dx.doi.org/10.1029/2009JF00138110.1029/2009JF001381, 2010.
Kilias, S. P., Nomikou, P., Papanikolaou, D., Polymenakou, P. N., Godelitsas, A., Argyraki, A., Carey, S.,
Gamaletsos, P., Mertzimekis, T. J., Stathopoulou, E., Goettlicher, J., Steininger, R., Betzelou, K., Li-415
vanos, I., Christakis, C., Croff Bell, C., and Scoullos, M.: New insights into hydrothermal vent pro-
cesses in the unique shallow-submarine arc-volcano, Kolumbo (Santorini), Greece, Sci. Rep., 3, 2421,
doi:http://dx.doi.org/10.1038/srep0242110.1038/srep02421, 2013.
Kranzer, H. C. and Keller, J. B.: Water waves produced by explosions, J. Appl. Phys., 30, 398–407, 1959.
Latter, J. H.: Tsunamis of volcanic origin: summary of causes, with particular reference to Krakatoa, 1883,420
Bull. Volcanol., 44, 467–490, 1981.
Le Mehaute, B. L.: Theory of explosion-generated water waves, in: Advances in Hydroscience, vol. 7, edited
by: Chow, V. T., Academic Press, New York, London, 1–79, 1971.
Le Mehaute, B. L., and Wang, S.: Water Waves Generated by Underwater Explosion, Adv. Ser. Ocean Eng.,
World Sci., New Jersey, 1996.425
Linsley, R. K., Franzini, J. B., Freyberg, D. L., and Tchobanoglous, G.: Water-Resources Engineering, 4th Edn.,
Series in Water Resources and Environmental Engineering, McGraw-Hill Publishing Co., 1992.
Liu, P. L.-F., Woo, S.-B., and Cho, Y.-S.: Computer Programs for Tsunami Propagation and Inundation, Tech.
rep., Cornell University, 1998.
Liu, P. L.-F., Wu, T.-R., Raichlen, F., Synolakis, C. E., and Borrero, J. C.: Runup and rundown generated by430
three-dimensional sliding masses, J. Fluid Mech., 536, 107–144, 2005.
Liu, P. L.-F., Cho, Y., Yoon, S., and Seo, S.: Numerical simulations of the 1960 Chilean tsunami propagation
and inundation at Hilo, Hawaii, in: Tsunami: Progress in Prediction, Disaster Prevention and Warning, edited
by: Tsuchiya, Y. and Shuto, N., Advances in Natural and Technological Hazards Research, vol. 4, Springer,
Netherlands, 99–115, 1995a.435
Liu, P. L.-F., Cho, Y.-S., Briggs, M. J., Kanoglu, U., and Synolakis, C. E.: Runup of solitary waves on a circular
island, J. Fluid Mech., 302, 259–285, 1995b.
Lynett, P. and Liu, P. L.-F.: A numerical study of submarine-landslide-generated waves and run-up, P. Roy. Soc.
Lond. A, 458, 2885–2910, 2002.
Maeno, F. and Imamura, F.: Tsunami generation by a rapid entrance of pyroclastic flow into440
the sea during the 1883 Krakatau eruption, Indonesia, J. Geophys. Res.-Sol. Ea., 116, B09205,
13
doi:http://dx.doi.org/10.1029/2011JB00825310.1029/2011JB008253, 2011.
Maeno, F., Imamura, F., and Taniguchi, H.: Numerical simulation of tsunamis generated by caldera collapse
during the 7.3 ka Kikai eruption, Kyushu, Japan, Earth Planets Space, 58, 1013–1024, 2006.
Maso, M. S.: Volcanoes and seismic centers of the Philippine Archipelago, vol. 3, Department of Commerce445
and Labor, Bureau of the Census, 1904.
Mirchina, N. R. and Pelinovsky, E. N.: Estimation of underwater eruption energy based on tsunami wave data,
Nat. Hazards, 1, 277–283, 1988.
Miyoshi, H. and Akiba, Y.: The tsunamis caused by the Myojin explosions, Journal of the Oceanographic
Society of Japan, 10, 49–59, 1954.450
Morrissey, M., Gisler, G., Weaver, R., and Gittings, M.: Numerical model of crater lake eruptions, Bull. Vol-
canol., 72, 1169–1178, 2010.
Niino, H.: Explosion of Myojin Reef: Kagaku Asahi, December , Translation available at USGS Military
Geology Branch, 3–23, 1952 (in Japanese).
Nomikou, P., Carey, S., Papanikolaou, D., Croff Bell, K., Sakellariou, D., Alexandri, M., and Bejelou, K.:455
Submarine volcanoes of the Kolumbo volcanic zone NE of Santorini Caldera, Greece, Global Planet. Change,
90, 135–151, 2012a.
Nomikou, P., Carey, S., Bell, K., Papanikolaou, D., Bejelou, K., Cantner, K., Sakellariou, D., and Perros, I.:
Tsunami hazard risk of a future volcanic eruption of Kolumbo submarine volcano, NE of Santorini Caldera,
Greece, Nat. Hazards, 1–16, doi:http://dx.doi.org/10.1007/s11069-012-0405-010.1007/s11069-012-0405-0,460
2012b.
Nomikou, P., Papanikolaou, D., Alexandri, M., Sakellariou, D., and Rousakis, G.: Submarine volcanoes along
the Aegean volcanic arc, Tectonophysics, 597, 123–146, 2013a.
Nomikou, P., Carey, S., Croff Bell, K., Papanikolaou, D., Bejelou, K., Alexandri, M., Cantner, K., and Mar-
tin, J. F.: Morphological slope analysis in the Kolumbo submarine volcanic zone NE of Santorini Island, Z.465
Geomorphol., 57, 37–47, 2013b.
Novikova, T., Papadopoulos, G. A., and McCoy, F. W.: Modelling of tsunami generated by the giant Late
Bronze Age eruption of Thera, South Aegean Sea, Greece, Geophys. J. Int., 186, 665–680, 2011.
Paris, R., Switzer, A. A., Belousova, M., Belousov, A., Ontowirjo, B., Whelley, P. L., and Ulvrova, M.: Volcanic
tsunami: a review of source mechanisms, past events and hazards in Southeast Asia (Indonesia, Philippines,470
Papua New Guinea), Nat. Hazards, 1–24, doi:http://dx.doi.org/10.1007/s11069-013-0822-810.1007/s11069-
013-0822-8, 2013.
Sato, H. and Taniguchi, H.: Relationship between crater size and ejecta volume of recent magmatic and phreato-
magmatic eruptions: implications for energy partitioning, Geophys. Res. Lett., 24, 205–208, 1997.
Sigurdsson, H., Carey, S., Alexandri, M., Vougioukalakis, G., Croff, K., Roman, C., Sakellariou, D., Anagnos-475
tou, C., Rousakis, G., Ioakim, C., Goguo, A., Ballas, D., Misaridis, T., and Nomikou, P.: Marine investiga-
tions of Greece’s Santorini volcanic field, Eos Trans. AGU, 87, 337–342, 2006.
Smith, M. S. and Shepherd, J. B.: Preliminary investigations of the tsunami hazard of Kick’em Jenny submarine
volcano, Nat. Hazards, 7, 257–277, 1993.
Soloviev, S. L. and Kim, K.: Catalog of tsunamis in the Pacific, 1969–1982, DIANE Publishing, 1997.480
Stehn, C., van Leeuwen, W., and Dammerman, K.: Krakatau – Part I. The Geology and Volcanism of the
14
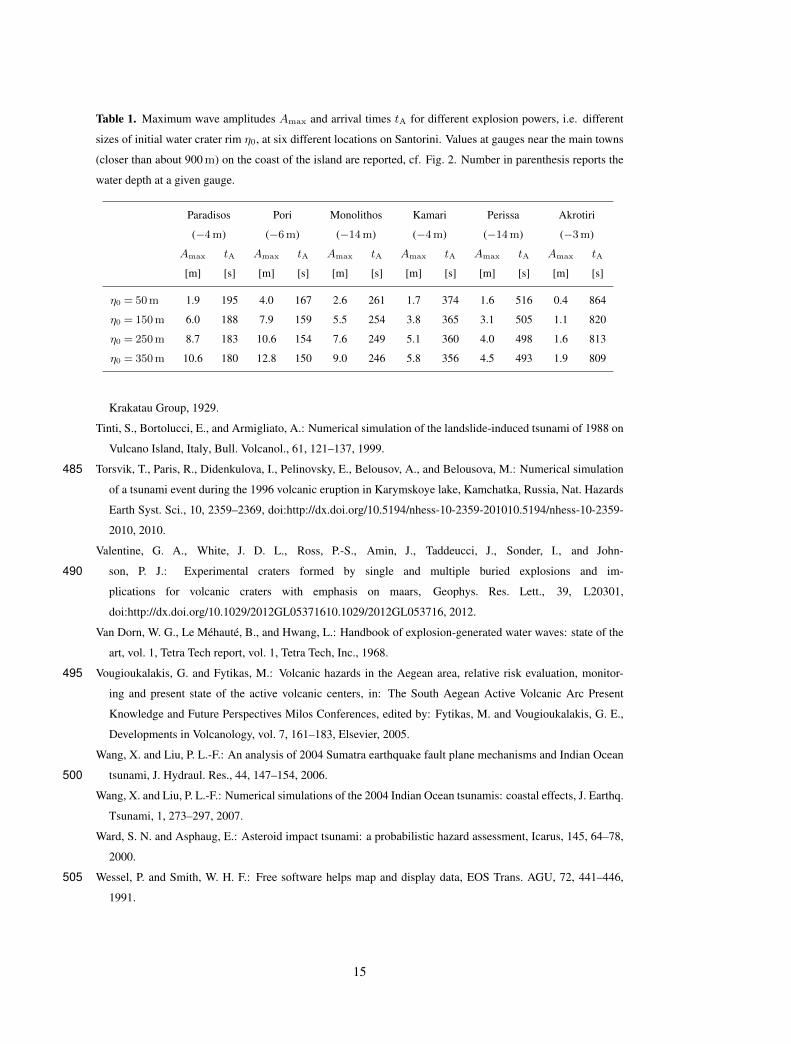
Table 1. Maximum wave amplitudes Amax and arrival times tA for different explosion powers, i.e. different
sizes of initial water crater rim η0, at six different locations on Santorini. Values at gauges near the main towns
(closer than about 900m) on the coast of the island are reported, cf. Fig. 2. Number in parenthesis reports the
water depth at a given gauge.
Paradisos Pori Monolithos Kamari Perissa Akrotiri
(−4m) (−6m) (−14m) (−4m) (−14m) (−3m)
Amax tA Amax tA Amax tA Amax tA Amax tA Amax tA
[m] [s] [m] [s] [m] [s] [m] [s] [m] [s] [m] [s]
η0 = 50m 1.9 195 4.0 167 2.6 261 1.7 374 1.6 516 0.4 864
η0 = 150m 6.0 188 7.9 159 5.5 254 3.8 365 3.1 505 1.1 820
η0 = 250m 8.7 183 10.6 154 7.6 249 5.1 360 4.0 498 1.6 813
η0 = 350m 10.6 180 12.8 150 9.0 246 5.8 356 4.5 493 1.9 809
Krakatau Group, 1929.
Tinti, S., Bortolucci, E., and Armigliato, A.: Numerical simulation of the landslide-induced tsunami of 1988 on
Vulcano Island, Italy, Bull. Volcanol., 61, 121–137, 1999.
Torsvik, T., Paris, R., Didenkulova, I., Pelinovsky, E., Belousov, A., and Belousova, M.: Numerical simulation485
of a tsunami event during the 1996 volcanic eruption in Karymskoye lake, Kamchatka, Russia, Nat. Hazards
Earth Syst. Sci., 10, 2359–2369, doi:http://dx.doi.org/10.5194/nhess-10-2359-201010.5194/nhess-10-2359-
2010, 2010.
Valentine, G. A., White, J. D. L., Ross, P.-S., Amin, J., Taddeucci, J., Sonder, I., and John-
son, P. J.: Experimental craters formed by single and multiple buried explosions and im-490
plications for volcanic craters with emphasis on maars, Geophys. Res. Lett., 39, L20301,
doi:http://dx.doi.org/10.1029/2012GL05371610.1029/2012GL053716, 2012.
Van Dorn, W. G., Le Mehaute, B., and Hwang, L.: Handbook of explosion-generated water waves: state of the
art, vol. 1, Tetra Tech report, vol. 1, Tetra Tech, Inc., 1968.
Vougioukalakis, G. and Fytikas, M.: Volcanic hazards in the Aegean area, relative risk evaluation, monitor-495
ing and present state of the active volcanic centers, in: The South Aegean Active Volcanic Arc Present
Knowledge and Future Perspectives Milos Conferences, edited by: Fytikas, M. and Vougioukalakis, G. E.,
Developments in Volcanology, vol. 7, 161–183, Elsevier, 2005.
Wang, X. and Liu, P. L.-F.: An analysis of 2004 Sumatra earthquake fault plane mechanisms and Indian Ocean
tsunami, J. Hydraul. Res., 44, 147–154, 2006.500
Wang, X. and Liu, P. L.-F.: Numerical simulations of the 2004 Indian Ocean tsunamis: coastal effects, J. Earthq.
Tsunami, 1, 273–297, 2007.
Ward, S. N. and Asphaug, E.: Asteroid impact tsunami: a probabilistic hazard assessment, Icarus, 145, 64–78,
2000.
Wessel, P. and Smith, W. H. F.: Free software helps map and display data, EOS Trans. AGU, 72, 441–446,505
1991.
15
−60
−40
−20
0
20
40
60
80
100
Ele
va
tio
n [
m]
5980000
5982000
5984000
528000 530000 532000
TS15
TS16
TS17
TS18
TS22
TS03
TS04
TS05TS06
TS07
TS13
TS14
TS20
TS24
TS08
TS09
TS10TS11
TS21
TS01TS02
159˚26' 159˚27' 159˚28' 159˚29' 159˚30'
53˚57'
53˚58'
53˚59'
54˚00'
0 km 1 km
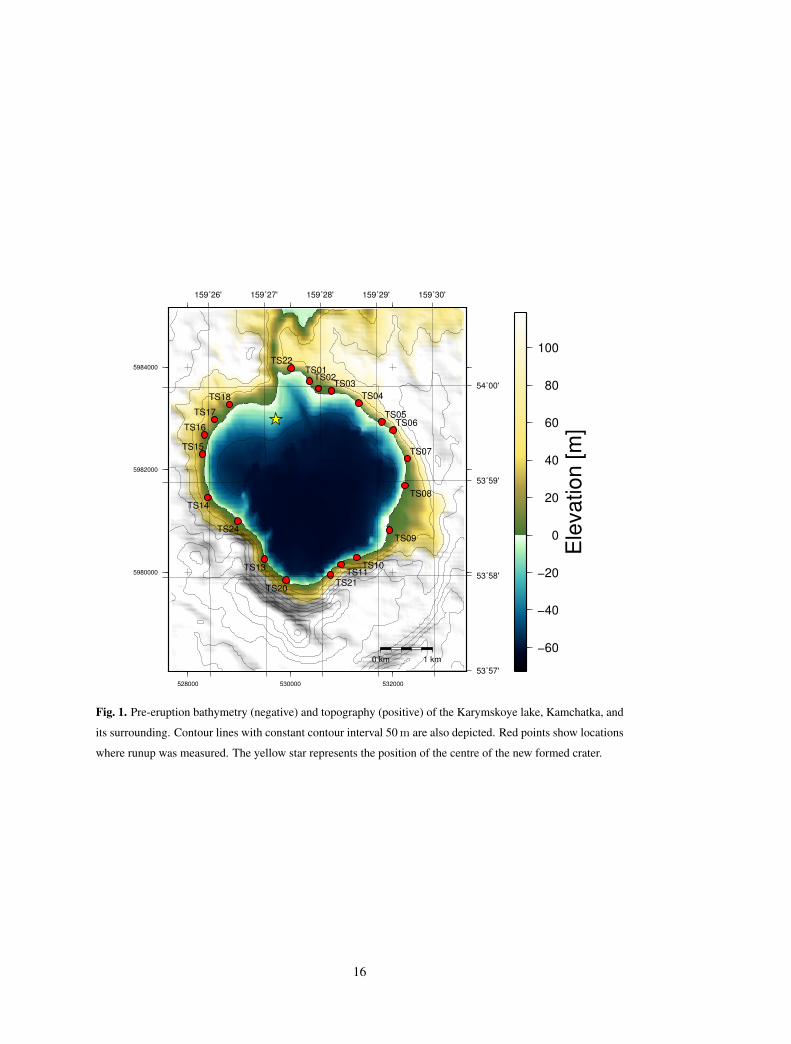
Fig. 1. Pre-eruption bathymetry (negative) and topography (positive) of the Karymskoye lake, Kamchatka, and
its surrounding. Contour lines with constant contour interval 50m are also depicted. Red points show locations
where runup was measured. The yellow star represents the position of the centre of the new formed crater.
16
−500
−400
−300
−200
−100
0
100
200
300
400
500
Ele
va
tio
n [
m]
25˚15' 25˚18' 25˚21' 25˚24' 25˚27' 25˚30' 25˚33'
36˚18'
36˚21'
36˚24'
36˚27'
36˚30'
A
B
Ridge
Kamari
Akrotíri
Monólithos
Perissa
Pori
Paradisos
0 km 5 km
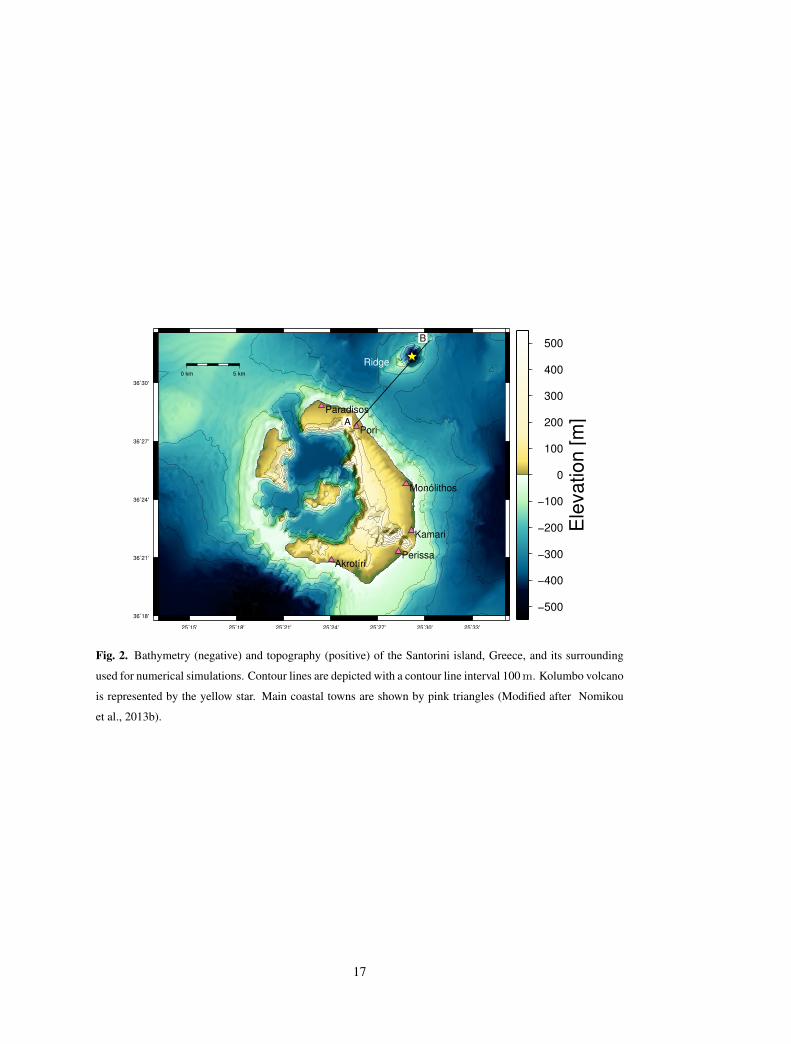
Fig. 2. Bathymetry (negative) and topography (positive) of the Santorini island, Greece, and its surrounding
used for numerical simulations. Contour lines are depicted with a contour line interval 100m. Kolumbo volcano
is represented by the yellow star. Main coastal towns are shown by pink triangles (Modified after Nomikou
et al., 2013b).
17
529000 530000 531000 532000
1000
2000
3000
4000
5000+5.979e6
0.4
0.4
0.8
1.2
1.6
0.0 0.4 0.8 1.2 1.6 2.0Arrival times [min]
529000 530000 531000 532000
1000
2000
3000
4000
5000+5.979e6
6.27.6 5.8
5.8
4.33.3
4.3
1.9
2.4
3.84.8
4.3
6.2
6.2
9.
4.34.7
4.8
1.5 3.0 4.5 6.0 7.5 9.0 10.5 12.0Maximum water elevation [m]
Fig. 3. Results of explosion simulation in Karymskoye lake with initial water crater rim η0 = 55m. (Top) First
wave travel times (in minutes). (Bottom) Maximum wave amplitude. Red points indicate positions of field
measured runup with the runup values.
18
20 30 40 50 60 70 80 90 100Rim height of imposed wave [m]
1.0
1.5
2.0
2.5
3.0
RM
Ser
ror
without friction
nm =0.025 m−1/3 s
Fig. 4. Root mean square (RMS) error of the difference between simulated and measured runups at 18 locations
around the Karymskoye lake as a function of imposed amplitude of water rim η0. Experiments with no friction
(red circles) and Manning coefficient [nm = 0.02 m−1/3 s] nm = 0.025 m−1/3 s (black squares) are reported.
19
1.0 1.5 2.0 2.5 3.0 3.5Distance from crater [km]
1
2
3
4
5
6
7
8
9
Runu
p [m
]
TS01
TS02
TS03 TS04
TS05
TS06
TS07
TS08TS09
TS10
TS11TS13
TS14TS15
TS16
TS20
TS21TS24
MeasurementsNumerical simulation
2 3 4 5 6 7 8 9Measured runup [m]
2
3
4
5
6
7
8
9
Sim
ulat
ion
runu
p [m
]
TS01
TS02
TS03
TS04TS05
TS06 TS07
TS08TS09
TS10 TS11
TS13
TS14TS15 TS16TS20
TS21
TS24
Initial wave height is 55.0m, breaking off, friction off
Fig. 5. Comparison of measured and simulated runups around the Karymskoye lake. Results are for simulation
with η0 = 55m and no bottom friction. (Top) Runup as a function of distance from crater. (Bottom) Simulated
runup as a function of the measured runup at 18 different locations. The dashed line corresponds to the simulated
runups equal to the measured values.
20
400200
0200 0.0 s
A B
400200
0200 9.0 s
400200
0200
Wav
e he
ight
pro
files
[m]
18.0 s
400200
0200 27.0 s
0 2 4 6 8 10Distance [km]
400200
0200 36.0 s
Fig. 6. A bathymetry and topography profile (shaded areas) along AB line in Fig. 2 north east of Santorini. Red
lines depict the wave height soon after the explosion and show the formation of the positive tsunami leading
wave. The explosion center inside the Kolumbo crater lies at 9 km distance. Number in each figure shows time
in seconds after the explosion. (Case with η0 = 250m.)
21
25.25 25.30 25.35 25.40 25.45 25.50 25.5536.30
36.35
36.40
36.45
36.50
2
44
6
6
6
8
8
8
8
10
10
12
12
12
0 2 4 6 8 10 12 14Arrival times [min]
Fig. 7. First wave arrival times for Santorini island and its surroundings. Black lines are drown with an interval
of 2min. Results are for simulation with η0 = 50m and no bottom friction.
22
0 1 2 3 4 55
0
5
10Paradisos η0 =50 m
η0 =150 m
η0 =250 m
0 1 2 3 4 510505
1015
Pori
0 1 2 3 4 510
5
0
5
10
Wav
e am
plitu
de [m
]
Monolithos
0 1 2 3 4 5
4
0
4 Kamari
0 1 2 3 4 5
4
0
4 Perissa
0 1 2 3 4 5Time [min]
2
1
0
1
2Akrotiri
Fig. 8. Water surface displacement registered near six coastal towns along Santorini (cf. Fig. 2 for map) and
for three different explosion powers. Time signals are shifted so that zero time corresponds to arrival time for
a given simulation. Gauges are positioned 400m, 900m, 500m, 500m, 800m and 450m off Paradisos, Pori,
Monolithos, Kamari, Perissa and Akrotiri. Note, that the vertical scale is different for each location.
23
25.2525.3025.3525.4025.4525.5025.5536.30
36.35
36.40
36.45
36.50 η0 =50 m
25.2525.3025.3525.4025.4525.5025.5536.30
36.35
36.40
36.45
36.50 η0 =150 m
25.2525.3025.3525.4025.4525.5025.5536.30
36.35
36.40
36.45
36.50 η0 =250 m
25.2525.3025.3525.4025.4525.5025.5536.30
36.35
36.40
36.45
36.50 η0 =350 m
5
15
2515
15
5
5
5
5
15
15
15
2525
25
35
35
35
45
45
45
55
515
25
15
15
5
5
5
5
15
15
15
2525
2535
35
35
45
45
45
5 5
15
15
5
5
5
5
15
15
15
2525
25
35
35
35
45
45
45
55
10-1
100
101
102
Max
imum
wat
er e
leva
tion
[m]
1515
5
5
5
5
15
15
15
2525
25
35
35
35
45
45
45
5 5
Fig. 9. Results of numerical calculations of the Kolumbo explosion generating tsunami. Maximum wave
amplitudes around Santorini for several η0 with zooming in the key coastal areas. Note, that the color scale
is logarithmic. Black [thin] thick solid line represents the original coastlines. Thin black lines in zooms are
topography contours with 10 m interval starting at 5 m. Inundation of most east coast of Santorini is visible for
all four scenarios.
24
0 10 20 30 40 50 60Distance [km]
0
5
10
15
20
Wav
e am
plitu
de o
n th
e co
ast [
m]
Perissa Kamari
MonolithosPori
Paradisos
Akrotiri
η0 =50 m
η0 =150 m
η0 =250 m
η0 =350 m
Fig. 10. Flow depth along the original coastline of the main Santorini island for several η0. Distance zero
corresponds to the southernmost point of the island and increases counterclockwise. Distance of the six main
coastal towns is depicted by vertical arrows and dashed lines (cf. Fig. 2 for their locations).
25
50 100 150 200 250 300 350η0 [m]
2
4
6
8
10
12
Max
imum
wav
e am
plitu
de [m
]
PoriMonolithosKamariAkrotiri
3 ·1013 3 ·1015 2 ·1016 1017
Explosion energy [J]
Fig. 11. Maximum wave amplitudeAmax as a function of explosion energy registered at four different locations
on the east and south coasts of Santorini (cf. Fig. 2 for their location).
26