Numerical Simulation of Gas-Solid Flow in a Fluidized Bed ...
43
Washington University in St. Louis Washington University in St. Louis Washington University Open Scholarship Washington University Open Scholarship Engineering and Applied Science Theses & Dissertations McKelvey School of Engineering Spring 5-17-2021 Numerical Simulation of Gas-Solid Flow in a Fluidized Bed with Numerical Simulation of Gas-Solid Flow in a Fluidized Bed with Different Inlet Flow Locations Different Inlet Flow Locations Feng Feng Washington University in St. Louis Follow this and additional works at: https://openscholarship.wustl.edu/eng_etds Part of the Engineering Commons Recommended Citation Recommended Citation Feng, Feng, "Numerical Simulation of Gas-Solid Flow in a Fluidized Bed with Different Inlet Flow Locations" (2021). Engineering and Applied Science Theses & Dissertations. 578. https://openscholarship.wustl.edu/eng_etds/578 This Thesis is brought to you for free and open access by the McKelvey School of Engineering at Washington University Open Scholarship. It has been accepted for inclusion in Engineering and Applied Science Theses & Dissertations by an authorized administrator of Washington University Open Scholarship. For more information, please contact [email protected].
Transcript of Numerical Simulation of Gas-Solid Flow in a Fluidized Bed ...

Washington University in St. Louis Washington University in St. Louis
Washington University Open Scholarship Washington University Open Scholarship
Engineering and Applied Science Theses & Dissertations McKelvey School of Engineering
Spring 5-17-2021
Numerical Simulation of Gas-Solid Flow in a Fluidized Bed with Numerical Simulation of Gas-Solid Flow in a Fluidized Bed with
Different Inlet Flow Locations Different Inlet Flow Locations
Feng Feng Washington University in St. Louis
Follow this and additional works at: https://openscholarship.wustl.edu/eng_etds
Part of the Engineering Commons
Recommended Citation Recommended Citation Feng, Feng, "Numerical Simulation of Gas-Solid Flow in a Fluidized Bed with Different Inlet Flow Locations" (2021). Engineering and Applied Science Theses & Dissertations. 578. https://openscholarship.wustl.edu/eng_etds/578
This Thesis is brought to you for free and open access by the McKelvey School of Engineering at Washington University Open Scholarship. It has been accepted for inclusion in Engineering and Applied Science Theses & Dissertations by an authorized administrator of Washington University Open Scholarship. For more information, please contact [email protected].
WASHINGTON UNIVERSITY IN ST. LOUIS
James Mckelvey School of Engineering
Department of Mechanical Engineering and Materials Science
Thesis Examination Committee
Dr. Ramesh K. Agarwal, Chair
Dr. David Peters
Dr. Swami Karunamoorthy
Numerical Simulation of Gas-Solid Flow in a Fluidized Bed with Different Inlet Flow
Locations
by
Feng Feng
A thesis presented to James Mckelvey School of Engineering
of Washington University in St. Louis in partial fulfillment of the
requirements for the degree of Master of Science
May 2021
Saint Louis, Missouri
© 2021, Feng Feng

i
Table of Contents List of Figures ....................................................................................................................................... ii
Acknowledgements ............................................................................................................................. iii
Chapter 1 Introduction ....................................................................................................................... 1
1.1 Introduction to Fluidized Bed ............................................................................................ 1
Chapter 2 Computational Methodology ........................................................................................... 3
2.1 Physical Model ........................................................................................................................... 3
2.2 Mesh ............................................................................................................................................ 4
2.3 Numerical Method .................................................................................................................... 5
2.3.1 Two Fluid Model (TFM) ................................................................................................... 5
2.3.2 The Schaeffer Frictional Viscosity ................................................................................... 6
2.3.3 The Solid Pressure .............................................................................................................. 7
2.3.4 The Restitution Coefficient .............................................................................................. 7
2.3.5 The Radial Distribution Function .................................................................................... 7
2.3.6 Granular Bulk Viscosity .................................................................................................... 8
2.3.7 Turbulence Model .............................................................................................................. 8
2.3.8 Drag Force Model .............................................................................................................. 9
Chapter 3 Results and Discussion ................................................................................................... 10
3.1 Inlet position A ........................................................................................................................ 10
3.2 Inlet position B ........................................................................................................................ 17
3.3 Inlet position C ........................................................................................................................ 22
3.4 Inlet Position D ....................................................................................................................... 26
Chapter 4 Conclusions and Future Work ....................................................................................... 31
References ........................................................................................................................................... 33
Vita ....................................................................................................................................................... 35

ii
List of Figures
Figure 2.1 Geometry of the bottom wall of the fluidized bed with holes ........................... 3 Figure 2.2 The entire computational domain and structured mesh ...................................... 4 Figure 2.3 Zoomed-in-view of the mesh near the bottom surface ....................................... 5 Figure 3.1 Initial fluidization process from 0 ms to 200 ms for inlet position A;
experiment (top), computation (bottom) ...................................................................... 10 Figure 3.2 Initial fluidization process from 300 ms to 500 ms for inlet position A ......... 11 Figure 3.3 Stable fluidization process from 600 ms to 700 ms for inlet position A ........ 12 Figure 3.4 Secondary fluidization process from 800 ms to 900 ms for inlet position A . 13 Figure 3.5 Changes in bed height during the fluidization for inlet position A ................. 14 Figure 3.6 Transient changes in gas phase flow of inlet position A ................................... 15 Figure 3.7 Velocity vectors around the bubble ...................................................................... 16 Figure 3.8 Initial fluidization process from 0 ms to 200 ms for inlet position B ............ 17 Figure 3.9 Stable fluidization process from 400 ms to 600 ms for inlet position B ......... 18 Figure 3.10 Secondary fluidization process from 700 ms to 900 ms for inlet position B
............................................................................................................................................. 19 Figure 3.11 Changes in bed height during the fluidization for inlet position B ................ 20 Figure 3.12 Transient changes in gas phase flow for inlet position B ................................ 21 Figure 3.13 Initial fluidization process from 0 ms to 300 ms for inlet position C ........... 22 Figure 3.14 Stable fluidization process from 400 ms to 600 ms for inlet position C ...... 23 Figure 3.15 Secondary fluidization process from 700 ms to 900 ms for inlet position C
............................................................................................................................................. 23 Figure 3.16 Changes in bed height during the fluidization for inlet position C ............... 24 Figure 3.17 Transient changes in gas phase flow for inlet position C ................................ 25 Figure 3.18 Initial fluidization process from 0 ms to 300 ms for inlet position D .......... 26 Figure 3.19 Stable fluidization process from 400 ms to 600 ms for inlet position D ...... 27 Figure 3.20 Secondary fluidization process from 700 ms to 900 ms for inlet position D
............................................................................................................................................. 27 Figure 3.21 Changes in bed height during the fluidization for inlet position D ............... 28 Figure 3.22 Transient changes in gas phase flow for inlet position D ............................... 29

iii
Acknowledgements
I would like to express my sincere gratitude to those who helped me during my research in
Computation Fluid Dynamics laboratory.
My deepest gratitude goes foremost to Professor Ramesh Agarwal for his inspiration,
encouragement and guidance throughout my research. His knowledge, experience and
patience have helped me to accomplish my research project and thesis in an excellent
manner. Without him I would not have the opportunity to explore the academic world of
Computation Fluid Dynamics (CFD).
Secondly, I would like to express my heartfelt gratitude to D. Ling Zhou and Xiang Zhang
for all their efforts to help me. The patient instruction by Dr. Zhou played a vital role in
initiating my research. The careful guidance of Xiang Zhang helped me to successfully
improve the quality of the mesh and apply Eulerian Two-Flow Model to the simulation of
gas/solid flows.
Finally, I would like to thank all the instructors, thesis examination committee and group
members in CFD lab. It is the harmonious communication environment and exchange of
different ideas that allowed me to keep learning and making progress.
Feng Feng
Washington University in St. Louis
May 2021
iv
Dedication
I would like to dedicate this thesis to my father Lishu Feng and my mother Chaowen Xu for
their unconditional support. I will never succeed without their support, influence and
encouragement.

v
Abstract
Numerical Simulation of Gas-Solid Flow in a Fluidized Bed with Different Inlet Flow
Locations
By
Feng Feng
Master of Science in Mechanical Engineering
Research Advisor: Professor Ramesh K. Agarwal
Fluidized beds are widely used in chemical and mineral industries due to their advantage of
high efficiency and low pollution. Due to the characteristics of the fluidized bed, the flow
processes within the bed are relatively complex. By using the numerical simulation, it is
possible to study and understand the flow inside the fluidized bed in detail and more
accurately. The focus of this research is on numerical simulations of gas-solid flow fluidized
beds using four different inlet flow positions and comparison of simulations with
experimental data. ANSYS Fluent is used in this study of fluidized beds for a dilute mixture
of gas and solids. The Eulerian Two-Fluid Model (TFM) is employed along with the k-ε
turbulence model for the solution of Reynolds-Averaged Navier-Stokes (RANS) equations.
The influence of inlet positions on flow in the fluidized bed is analyzed, and the relationship
between the inlet positions on gas-solid mixing and bubble formation is explored.
Computations are compared with the experimental data; good agreement is obtained.

1
Chapter 1 Introduction
1.1 Introduction to Fluidized Bed
A fluidized bed is a physical process that occurs when a quantity of solid particulate
substance is placed under appropriate conditions to cause the solid/fluid mixture to behave
as a fluid. Fluidization is a process similar to liquefaction whereby a granular material is
converted from a static solid-like state to a dynamic fluid-like state. Fluidized beds are widely
used in chemical and mineral industries. Thus modeling them becomes meaningful but is
also a challenging task. To date, the operation and design of fluidized bed equipment have
been primarily empirical without the ability to fully predict the interior motion and
interactions. In particular, for the gas-solid fluidized bed with limited understanding of some
multi-phase flow physics, the transient interface is still hard to model and calculate.
Based on the fluidization speed, the particles in the fluidized bed can have different flow
patterns. The gas-solid fluidized bed can be divided into fixed bed, bubbling bed, turbulent
bed and fast bed [1]. When the fluidization gas velocity is low, the solid particles in the fixed
bed cannot be carried by the gas and keep the bed in a static state. As the gas velocity
increases to the minimum fluidization velocity, the bed begins to loosen and generates
bubbles, and the drop in the gas pressure is transformed into the drag force on the particles.
At this time, it is called a bubbling bed. There are significant interfaces in the bubbling bed
between the dense phase zone and the dilute phase zone. If the fluidization gas velocity is
further increased, the flow of solid and gas phase in the bed becomes more turbulent and
bubble diameter becomes smaller. The interface between the dense phase zone and dilute
phase zone becomes difficult to distinguish [5]. At this time, the bed becomes a turbulent
bed. As the gas velocity further increases, the precipitation and entrainment rate of the
particles increase significantly, and the particles are easily carried out of the bed. At this time,
the bed has been transformed into a fast fluidized bed [1].
In the study of gas-solid two-phase flow, the computational fluid dynamics modeling
divides the two-phase particle-fluid flow system into a particle phase and a fluid phase. The
classifications of the computational fluid dynamics models of the two-phase flow are mainly

2
based on the differences in computational method for the particle phase and the fluid phase.
In the two fluid model (TFM) considered in this thesis, the calculation model treats the
particles as a fluid phase which is similar to the motion of the gas phase. It uses mass,
momentum and energy equations to describe them in Eulerian framework for both the
liquid and gas phase. The computational grid defines whether a particular cell is in liquid
phase or in gas phase.

3
Chapter 2 Computational Methodology
2.1 Physical Model
The computational domain in this study corresponds to the experimental apparatus
and test performed by Dr. Ling Zhou at Jiangsu University in China. The
length*width*height of the computational cuboid is 300mm*20mm*1000mm as shown in
Figure 2.1. The seven inlet pipes are evenly distributed at the bottom each with diameter of
6mm and 28.26 mm2 inlet area. The length of the pipe is 10 mm. Due to their even
distribution, only 4 inlets are considered; these are marked as A, B, C, D, from right to left.
The position of the first inlet A is located at the bottom center line and 30mm left of the
bottom edge. The distance between each inlet is 40 mm. The mass flow rate of the gas is
0.008 kg s−1 for each inlet. The air with density 1.225 kg m−3 is used for gas. The solid
phase is considered to be sand with density of 2500kg m−3 . The diameter of the sand
particle is 2.5 mm, and total number of particles is approximately 60000 in the fluidized bed.
The height of the solid phase is about 14 mm which is close to the experimental situation.
The boundary conditions are as follows. The four inlets are set as mass-flow-inlet. The outlet
is the whole top side of the computational domain and is set as pressure outlet. The side
walls of the cuboid and the bottom wall apart from the inlet holes and the wall of the inlet
pipe are all set to be stationary no slip wall with standard roughness model. The gravity is set
to be 9.81m/𝑠2
Figure 2.1 Geometry of the bottom wall of the fluidized bed with holes

4
2.2 Mesh
The geometry model is created in ANSYS ICEM based on the size of the experimental
apparatus. A structured mesh is generated in ICEM. Due to the circular shape of the inlet,
the O-grid is used in the inlet pipe in the circular cross-sectional area. The entire mesh in the
computational domain is shown in Figure 2.2. The zoomed in view of the mesh at the
bottom of the fluidized bed is shown in Figure 2.3. The four inlets are cylindrical pipes
which are attached to the bottom wall. The four circular inlets A, B, C and D are studied
individually for their fluidization performance. The outlet is the entire top surface of the
fluidized bed. The total number of elements in computational domain is 147,398 and the
total number of nodes is 135,856. The mesh has been proven to be high quality and the
solution is mesh independent.
Figure 2.2 The entire computational domain and structured mesh

5
Figure 2.3 Zoomed-in-view of the mesh near the bottom surface
2.3 Numerical Method
Computational fluid dynamics (CFD) is a field of fluid mechanics that employs numerical
methods and data structures to solve the governing equations of fluid flow that best describe
the fluid physics for a given application. CFD is a powerful tool for analysis and design of
fluid systems but requires enormous computing power for complex 3D applications. The
numerical method used in this thesis for simulation of fluidized beds is described in the
following sections.
2.3.1 Two Fluid Model (TFM)
In ANSYS Fluent, the Two-Fluid Model (TFM) is one of the approaches for modeling
the multiphase flows. There are also other methods namely the Discrete Element Method
(DEM) and Dense Discrete Particle Model (DDPM) etc. [6]. In this thesis, TFM is employed
since the solids in the gas/solid mixture are in small percentage and the mixture is dilute.
The TFM is obtained by time-averaging of the local instantaneous hydrodynamic equations;
they consist of a set of continuity, momentum and energy equations for each phase treating
them as an inter-penetrating continua. The flow is assumed to be isothermal in the current
analysis without mass transfer.
The continuity equation for both the phases (p and q) is given by:

6
𝜕𝑡(𝜌𝜖) + 𝛻 ∙ (𝜌𝜖𝑢) = 0 (1) The diffusion equation is given by:
𝜕
𝜕𝜏(𝛼𝑞𝜌𝑞) + 𝛻 ∙ (𝛼𝑞𝜌𝑞𝑣𝑞⃗⃗⃗⃗ ) = ∑ 𝑛
𝑝=1 𝑚𝑝𝑞̇ (2)
where 𝑣 𝑞 is the velocity of the q phase, 𝑚𝑝𝑞 is the mass transfer from p phase to q
phase. The momentum equation is given by:
𝜕
𝜕𝑡(𝛼𝑞𝜌𝑞�⃗⃗� 𝑞) + 𝛻 ∙ (𝛼𝑞𝜌𝑞�⃗⃗� 𝑞�⃗⃗� 𝑞) = −𝛼𝑞𝛻𝑝 + 𝛻𝜏𝑞 ̿ + ∑
𝑛
𝑝=1
(�⃗⃗� 𝑝𝑞 + 𝑚𝑝𝑞�⃗⃗� 𝑝𝑞) +
𝛼𝑞𝜌𝑞(𝐹 𝑞 + 𝐹 𝑙𝑖𝑓𝑡,𝑞 + 𝐹 𝑣𝑚,𝑞) (3)
𝜏𝑞 ̿ = 𝛼𝑞𝜇𝑞(𝛻𝜈 𝑞 + 𝛻𝑣 𝑞) + 𝛼𝑞 (𝜆𝑞 −2
3𝜇𝑞) 𝛻𝜈 𝑞𝐼 ̿ (4)
where 𝜏𝑞 ̿ is the strain tensor for q phase and 𝛼𝑞 is the volume fraction.
The volume fraction equation is given by:
𝑉q = ∫ 𝛼𝑞𝑣𝑑𝑉, ∑ 𝛼𝑞 = 1𝑛
𝑞=1 (5)
The TFM can be expressed by the equation:
𝜕
𝜕𝑡(𝛼𝑞𝑘𝜌𝑘) + 𝛻 ∙ (𝛼𝑘𝜌𝑘𝑢𝑘𝑢𝑘⃗⃗⃗⃗ ⃗⃗ ⃗⃗ ⃗⃗ ⃗⃗ ⃗) = −𝛼𝑘𝛻𝑝𝑘 + 𝛻 ∙ 𝛼𝑘(𝜏𝑘̿̿̿ + 𝜏𝑘̿̿̿
𝑇) + 𝛼𝑘𝜌𝑘�̅� + 𝑀𝑘𝑖 +
(𝑝𝑘𝑖 − 𝑝𝑘)𝛻𝛼𝑘 − 𝜏𝑘𝑖̿̿ ̿̿ 𝛻𝛼𝑘 (6)
2.3.2 The Schaeffer Frictional Viscosity
The particle flow or solid flow can be divided into two types depending upon the flow
pattern: viscous shearing flow and plastic shearing flow. In case of viscous shearing flow, the
stress is caused by the collision of particles or by the exchange of momentum among the
particles. In case of plastic shearing flow, the stress is caused by the persistent friction among
the particles. Frictional viscosity is an important parameter in deriving the frictional stress.
The Schaeffer friction viscosity expression given in Fluent is as follows:
𝜇𝑠,𝑓𝑟 =𝑝𝑠𝑠𝑖𝑛𝜙
2√𝐼2𝐷 (7)

7
where 𝑝𝑠 is the solid pressure, 𝜙 is the inner friction angle which is between 25 degree to 30
degree normally. In this paper, 30 degree friction angle is used. 𝐼2𝑑 is the second invariant of
the stress deviator.
2.3.3 The Solid Pressure
The equation for calculating the solid pressure is given below. The first term on the right
side of the equation is the force term. The second is the collision term where 𝑒𝑠𝑠 stands for
restitution coefficient and 𝑔0,𝑠𝑠 is the radial distribution function. These two are discussed in
the following sections. In Fluent, the default maximum particle volume friction is 0.63 which
is also used in this thesis.
𝑝𝑠 = 𝜀𝑠𝜌𝑠𝜃𝜔 + 2𝜌𝑠(1 + 𝑒𝑠𝑠)𝜀𝑠2𝑔𝑂,𝑠𝑠𝜃 (8)
2.3.4 The Restitution Coefficient
The range of restitution coefficient is from 0 to 1. When the restitution coefficient is 1, it
implies that the collision between particles is an ideal elastic collision. When the restitution
coefficient is 0, it means that the collision between particles is an ideal inelastic collision. The
restitution coefficient corrects the energy loss caused by particle collision, which is not
considered in the traditional theory of particle dynamics. The decrease in the restitution
coefficient indicates that the collision of particles tends to be inelastic, and the kinetic energy
of the particles will increase [7].
2.3.5 The Radial Distribution Function
The possibility of particle collision increases as the particle volume friction increases. The
radial distribution function is used to denote the probability of collision, and it corrects the
effect of collisions in the calculation when the volume friction increases to the maximum
value. The radial distribution functions proposed by Syamlal et al. [10] and Lun et al. [8] have
been widely used to optimize the calculation when the volume friction approaches the
8
maximum value. Eq. (9) gives the expression for 𝑔𝑂 proposed by Syamlal et al. [10] and Eq.
(10) gives the expression proposed by Lun et al. [8]. In this thesis, Eq. (10) by Lun et al. [8] is
used for radial distribution function.
𝑔𝑂 = [1 − (𝜀𝑠
𝜀𝑠,𝑚𝑎𝑥)
1
3]
−1
(9)
𝑔𝑂 =1
1−𝜀𝑠+
3𝜀𝑠
2(1−𝜀𝑠)2 (10)
2.3.6 Granular Bulk Viscosity
The granular bulk viscosity characterizes the resistance of the particle to compression and
expansion. The expression proposed by Lun et al. [8] is given below:
𝜆𝑠 =4
3𝜀𝑠2𝜌𝑠𝑑𝑝𝑔𝑂,𝑠𝑠(1 + 𝑒𝑠𝑠)√
𝜃
𝜋 (11)
In this thesis, Eq. (11) is used for granular bulk viscosity.
2.3.7 Turbulence Model
In this thesis, the standard k-ε turbulence model is employed since the solid flow in the
fluidized bed is turbulent. The standard k-ε model contains the transport equation of
turbulent kinetic energy k and turbulent dissipation rate ϵ. The transport equations for k and
𝜖 are as follows.
𝜕
𝜕𝑡(𝜌𝑘) +
𝜕
𝜕𝑥𝑖(𝜌𝑘𝑢𝑖) =
𝜕
𝜕𝑥𝑗[(𝜇 +
𝜇𝑡
𝜎𝑘)
𝜕𝑘
𝜕𝑥𝑗] + 𝐺𝑘 + 𝐺𝑏 − 𝜌𝜖 − 𝑌𝑀 + 𝑆𝑘 (12)
𝜕
𝜕𝑡(𝜌𝜀) +
𝜕
𝜕𝑥𝑖(𝜌𝜀𝑢𝑖) =
𝜕
𝜕𝑥𝑗[(𝜇 +
𝜇𝑡
𝜎𝜀)
𝜕𝑘
𝜕𝑥𝑗] + 𝐶1𝜖
𝜖
𝑘2𝜇𝑡𝐸𝑖𝑗𝐸𝑖𝑗 − 𝐶2𝜖𝜌
𝜖2
𝑘 (13)
where ui represents velocity component in corresponding direction. Eij represents
component of rate deformation μt represents eddy viscosity and its expression is written as
Eq. 14. The default values of various constants is given in Eq. 15.

9
𝜇𝑡 =𝜌𝐶𝜇𝑘2
𝜀 (14)
𝐶1𝜀 = 1.44, 𝐶2𝜀 = 1.92, 𝜎𝑘 = 1.0, 𝜎𝑠 = 1.3 (15)
2.3.8 Drag Force Model
The drag force model used here is the Gidspow drag model. The Gidaspow drag model is
a combination of the Wen and Yu drag [11] model and the Ergun equation [9]. Wen and Yu
drag model uses a correlation from the experimental data of Richardson and Zaki [12] and
this correlation is valid when the internal forces are negligible which means that the viscous
forces dominate the flow behavior. The model is given by the equations:
𝛽 = 150(𝛼𝑝(1−𝛼𝑔)𝜇𝑔
𝛼𝑔𝑑𝑝2 +
1.75𝜌𝑔𝛼𝑝|𝑢𝑝⃗⃗⃗⃗ ⃗−𝑢𝑔⃗⃗⃗⃗ ⃗|
𝑑𝑝 𝑓𝑜𝑟 𝛼𝑔 ≤ 0.8 (16)
𝛽 =3
4𝐶𝐷
𝛼𝑔𝜌𝑔𝛼𝑝|𝑢𝑝⃗⃗⃗⃗ ⃗−𝑢𝑔⃗⃗⃗⃗ ⃗|
𝑑𝑝𝛼𝑔
−2.65 𝑓𝑜𝑟 𝛼𝑔 > 0.8 (17)
𝐶𝐷 =24
𝑅𝑒𝑝(1 + 0.15𝑅𝑒𝑝
0.687) 𝑓𝑜𝑟 𝑅𝑒𝑝 ≤ 1000 (18)
𝐶𝐷 = 0.44 𝑓𝑜𝑟 𝑅𝑒𝑝 > 1000 (19)

10
Chapter 3 Results and Discussion
The computational results are presented for four inlet locations A, B, C, and D shown in
Fig. 2.1. The volume fraction contours for three stages of fluidization are presented along
with the velocity streamlines. Change in bed height at various stages of fluidization is also
presented.
3.1 Inlet position A
Computations are compared with the experimental data for three stages of fluidization in
the following figures. The computations are performed from 0ms to 900ms and are
compared with experimental data.
0 ms 100 ms 200 ms
Figure 3.1 Initial fluidization process from 0 ms to 200 ms for inlet position A; experiment
(top), computation (bottom)

11
As shown in Fig. 3.1, the fluidized process from 0 ms to 200 ms shows excellent
agreement between computations and experimental data; the experimental photographs were
taken from the high speed camera. The inlet position A is located at the most right side of
the fluidized beds shown in Fig. 2.1. The bubble starts to generate at first 100 ms and
enlarges in the vertical direction as the time increases.
300 ms 400 ms 500 ms
Figure 3.2 Initial fluidization process from 300 ms to 500 ms for inlet position A
As shown in Fig. 3.2, from 300 ms to 500 ms, the increase in the size of the bubble
continues but the bubble growth direction changes in an oblique direction to the left. The
shape of the bubble gradually becomes a bulb shape. Since the airflow drives the particles to
move to the left, the concentration of particles in the lower left corner of the fluidized bed
becomes higher. Due to the short time after the bubble generation, the particles

12
concentration in the solid particles region of the flow is higher than that in the gas part of
the flow. Therefore, the development of the bubble is upward in the vertical direction. As
the excess gas in the fluidized bed increases, the bubble gradually begins to tilt to the left due
to the influence of the right side wall.
600 ms 700 ms
Figure 3.3 Stable fluidization process from 600 ms to 700 ms for inlet position A
Figure 3.3 shows the steady fluidization process from 600 ms to 700 ms. It can be seen
that at this stage, the numerical simulation can still predict the change in the bubble shape
accurately. Compared to the initial fluidization process shown in Figure 3.2, the shape of the
bubble gradually evolves from a bulb shape to a polygonal shape. From 500 ms to 600 ms,
the bubble bursts and some particles near the upper left corner of the bubble escape into the
free gas flow area. From 600 ms to 700 ms, the particles at the upper left corner of the
bubble fall slowly. This is because the burst of the bubble causes the pressure inside the
bubble to be same as the pressure in free area and the particles fall due to the gravity.
During the period from 700 ms to 800 ms, the particles at the top of the bubble basically
stop falling. During this time, the particle layer on the top of the bubble is in a suspended

13
state. The buoyancy and drag force basically balance the particles’ own gravity, and the
particles are in a stable fluidization stage. Since the inlet position A is closest to the right side
of the fluidized bed, the bubble development direction is biased to the left side opposite to
the inlet position, and the area where the bubble bursts is also located on the left side. The
particles contained in the trapezoidal area in the lower left corner form the dense-phase
zone. Due to the influence of the inlet position, the particles in the dense-phase zone do not
move out. This shows that the inlet position has great influence on the evolution of bubbles
in the gas-solid two-phase flow. When the inlet is too close to the wall, the mixing of solid
particles in the fluidized bed and the mass transfer between the gas-solid two phases is
greatly affected.
800 ms 900 ms
Figure 3.4 Secondary fluidization process from 800 ms to 900 ms for inlet position A
Figure 3.4 shows the secondary fluidization process from 800 ms to 900 ms. Comparing
with Figure 3.2 and Figure 3.3, it can be seen that the bed height has gone through three
stages. In the initial fluidization stage from 0 ms to 400 ms, the bed height continues to rise.
From 500 ms to 700ms, during the stable fluidization stage, the particle layer on the upper

14
side of the bubble begins to collapse and the bed height begins to drop. It can be seen that
from 600 ms to 800 ms, although the particle layer on the upper side of the bubble collapses
to the dense-phase zone due to the bubble burst, the particle layer on the upper side of the
bubble on the right half of the bubble begins to rise again. From 800 ms to 900 ms is the
secondary fluidization stage.
Figure 3.5 Changes in bed height during the fluidization for inlet position A
Figure 3.5 shows the curve of change in the bed height with time. It can be seen that in
the secondary fluidization stage, there is difference between the predicted results and the
experimental results, which may be due to the inability of the computational model to
compute correctly after bursting of the bubble. Due to the bursting of the bubble, the gap
between particle layers suspended above the bubble becomes larger. Therefore, the gas
velocity between the particles becomes smaller than the actual velocity in the experiment
resulting in the computing bed height to be lower than experimental value. Also the
limitations of the Eulerian two-flow model as well as drag model can be another source of
inaccuracy in prediction of the bed height. Compared to the discrete element model, the
Eulerian two-fluid model cannot track every single particle in the solid flow. Thus, when the
bubble develops into large size as a dispersed-continuous phase interaction case, the
interaction surfaces between the two phases becomes large compared to the initial state.
Judging from the trend of numerical simulation and experimental result in Figure 3.5, the
15
Eulerian two-fluid model can predict the experimental value accurately before the bursting
of the bubble. The height of the bed increases during the initial stage of bubble development
and in the period before the bursting of the bubble. The difference between the numerical
simulation and the experimental result for the bed height is very small from 0 ms to 600 ms.
Although there is a relatively large difference in computed and experimental bed height in
the time period from 600 ms to 900 ms, the overall trend of the numerical simulation and
the experimental result is basically the same, which provides a strong theoretical support for
our approach for simulating the dilute mixture of gas solid flows
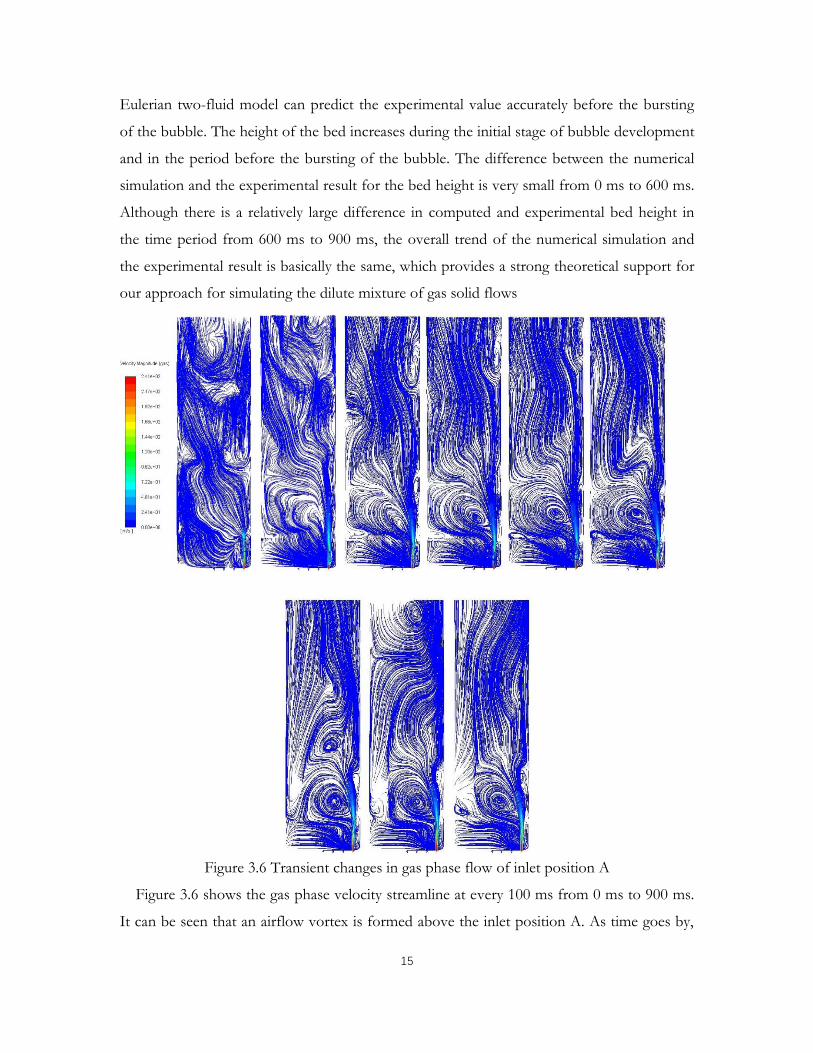
Figure 3.6 Transient changes in gas phase flow of inlet position A
Figure 3.6 shows the gas phase velocity streamline at every 100 ms from 0 ms to 900 ms.
It can be seen that an airflow vortex is formed above the inlet position A. As time goes by,
16
the size of the vortex gradually becomes larger, and an annular flow is formed near the left
side. This annular flow drives the particles in the dense phase zone to continue to flow to
the right. Then the particles are lifted to the right under the influence of the inlet air flow,
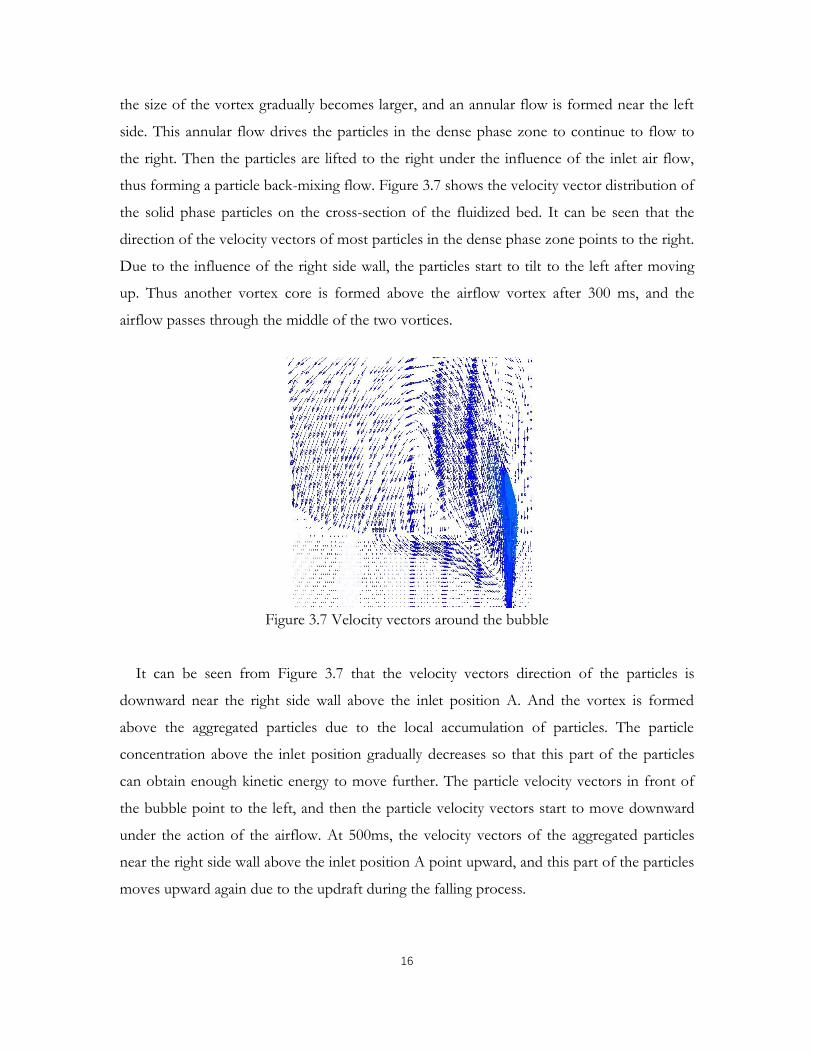
thus forming a particle back-mixing flow. Figure 3.7 shows the velocity vector distribution of
the solid phase particles on the cross-section of the fluidized bed. It can be seen that the
direction of the velocity vectors of most particles in the dense phase zone points to the right.
Due to the influence of the right side wall, the particles start to tilt to the left after moving
up. Thus another vortex core is formed above the airflow vortex after 300 ms, and the
airflow passes through the middle of the two vortices.
Figure 3.7 Velocity vectors around the bubble
It can be seen from Figure 3.7 that the velocity vectors direction of the particles is
downward near the right side wall above the inlet position A. And the vortex is formed
above the aggregated particles due to the local accumulation of particles. The particle
concentration above the inlet position gradually decreases so that this part of the particles
can obtain enough kinetic energy to move further. The particle velocity vectors in front of
the bubble point to the left, and then the particle velocity vectors start to move downward
under the action of the airflow. At 500ms, the velocity vectors of the aggregated particles
near the right side wall above the inlet position A point upward, and this part of the particles
moves upward again due to the updraft during the falling process.

17
3.2 Inlet position B
Computations are compared with the experimental data for three stages of fluidization for
inlet position B in the following figures. The computations are performed from 0ms to
900ms and are compared with the experimental data.
0 ms 100 ms 200 ms 300 ms
Figure 3.8 Initial fluidization process from 0 ms to 200 ms for inlet position B
Figure 3.8 shows the initial fluidization process from 0 ms to 300 ms. It can be seen that
the bubble formation is still affected by the right side wall during the initial fluidization
process, making the bubble tilt to the left while developing upward. In section 3.1, since the
inlet position A was closer to the right side wall, the entire bubble had a tendency to tilt
towards the left at100 ms. Relatively speaking, the inlet position B is farther from the right
side wall than the inlet position A. By comparing Figure 3.1 and Figure 3.8, it can be noted
that the time when the bubble starts to tilt in case of inlet position B is later than that in
case of inlet position A. Furthermore, from the point of view of bubble morphology also,

18
position A and position B show different results. In Figure 3.1, the particles between
position A and the right wall are all carried by the gas. However, there is always a particle
layer between the inlet position B and the right side wall. It can be seen that the shape of the
front end of the bubble is becoming closer to a spherical shape. The particles on both sides
of the inlet position B move upward at the same time, and the gas inside the bubble expands
towards the left due to the influence of the wall on the right side. However, the front end of
the bubble is not fully formed when the inlet is at position A. In case of inlet position B, a
half spherical shaped bubble is gradually formed and tends to move towards the left during
the initial fluidization process.
Figure 3.9 Stable fluidization process from 400 ms to 600 ms for inlet position B
Figure 3.8 and Figure 3,9 show the steady fluidization process from 0 ms to 600 ms. It can
be seen that the half spherical shaped bubble gradually moves toward the left wall of the
fluidized bed. The area of the bubble is further expanded and approaches the entire cross-
section of the fluidized bed. At 600 ms, it can be seen that there is particle ejection at top of
the bed, which indicates that the bubble in the fluidized bed has burst. On bursting of the
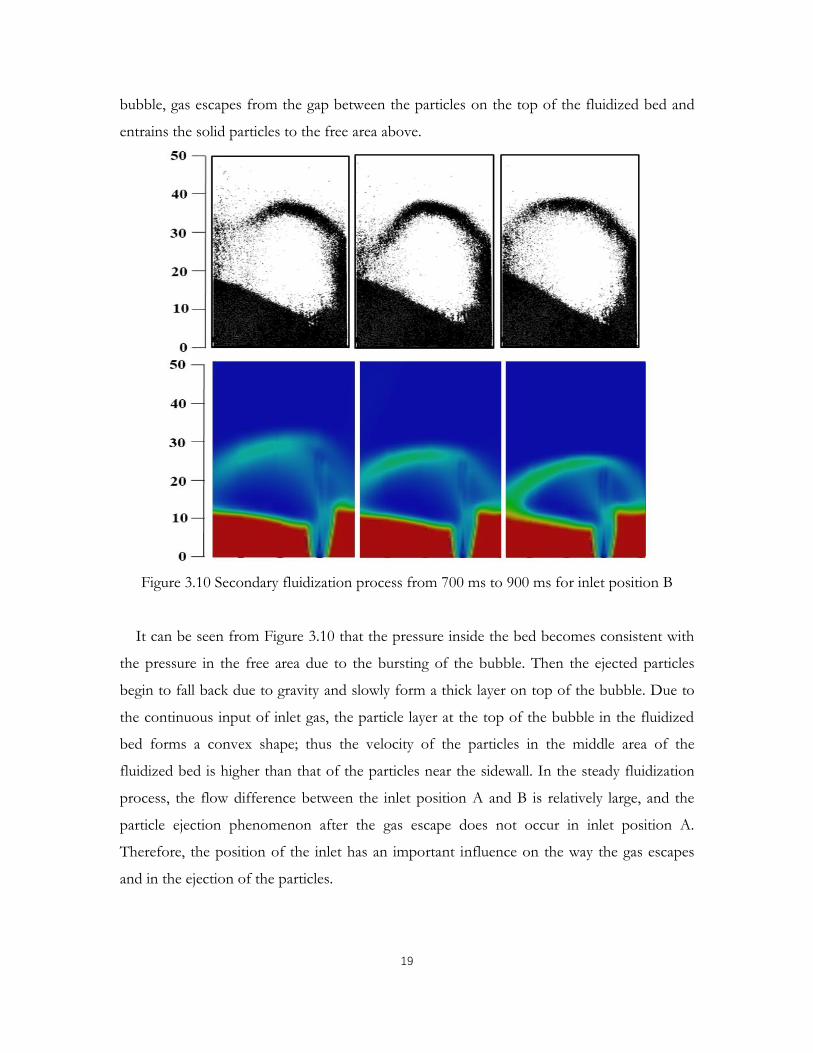
19
bubble, gas escapes from the gap between the particles on the top of the fluidized bed and
entrains the solid particles to the free area above.
Figure 3.10 Secondary fluidization process from 700 ms to 900 ms for inlet position B
It can be seen from Figure 3.10 that the pressure inside the bed becomes consistent with
the pressure in the free area due to the bursting of the bubble. Then the ejected particles
begin to fall back due to gravity and slowly form a thick layer on top of the bubble. Due to
the continuous input of inlet gas, the particle layer at the top of the bubble in the fluidized
bed forms a convex shape; thus the velocity of the particles in the middle area of the
fluidized bed is higher than that of the particles near the sidewall. In the steady fluidization
process, the flow difference between the inlet position A and B is relatively large, and the
particle ejection phenomenon after the gas escape does not occur in inlet position A.
Therefore, the position of the inlet has an important influence on the way the gas escapes
and in the ejection of the particles.

20
Figure 3.11 Changes in bed height during the fluidization for inlet position B
Figure 3.11 shows the curve of change in bed height with time. It can be seen that the bed
height reaches its maximum value at around 450 ms, and then the bed height slowly
decreases with a very gentle slope in the experiment. During the period from 600 ms to 900
ms, the bed height remains basically unchanged in the simulation; the fluidization process in
this period is called a stable fluidization process. It should be noted that the bubble area also
begins to decrease slowly after reaching the maximum value at 450 ms. Comparing Figure
3.11 to Fig. 3.5, it can be seen that the curve corresponding to inlet position A has a peak
and a trough; the curve in case of inlet position B only has a maximum value and then it
begins to decrease which shows that the inlet position has an important influence on the
evolution of the bed height and bubble area.

21
Figure 3.12 Transient changes in gas phase flow for inlet position B
Figure 3.12 shows the transient change in the gas phase velocity streamline from 0 ms to
900 ms. Comparing with the results for the inlet position A, a vortex is again formed on the
left side of the inlet position B, but the size of the vortex is smaller than that for the inlet
position A. An annular air circulation area is also formed in the dense phase zone. The main
reason is that the position of the inlet position B is farther from the right side wall than the
position A, thus the particles on both sides of the inlet are lifted up on both sides by the
inlet gas flow. The bubble generation is again towards the left, and the vortex is also located
to the left of the inlet position B. This further confirms that the inlet position plays a
decisive role in the position and size of the vortex.

22
3.3 Inlet position C
Computations are compared with the experimental data for three stages of fluidization for
inlet position C in the following figures. The computations are performed from 0ms to
900ms and are compared with the experimental data.
Figure 3.13 Initial fluidization process from 0 ms to 300 ms for inlet position C
Figure 3.13 shows the initial fluidization process from 0 ms to 300 ms. It can be seen that
the bubble shape obtained by the numerical simulation and the experiment are very similar.
Compared to the inlet positions A and B, the bubble shape in the inlet position C is more
similar to that in case of position B, however the inclination of the bubble is greatly reduced
compared to that in case of inlet positions A and B. This is because the distance between the
position C and the right side wall of the fluidized bed is larger than that that for positions A
and B and therefore the inclination angle of the bubble centroid is further reduced.
Compared to inlet position B, the time when the bubble starts to tilt to the left is further
delayed. It can be seen from Figure 3.13 that at 300 ms, the bubble appears to be slightly

23
inclined. At 400 ms, the degree of inclination further increases and the inclined bubble also
has a half spherical shape. Since the inlet position C is far away from the wall, the half
spherical shaped bubble is more symmetrical than in position A and position B.
Figure 3.14 Stable fluidization process from 400 ms to 600 ms for inlet position C
Figure 3.15 Secondary fluidization process from 700 ms to 900 ms for inlet position C
24
Figure 3.14 and Figure 3.15 show the steady fluidization process from 300 ms to 900 ms
for the inlet position C. It can be seen that the left front end of the bubble gradually moves
to the left. The bubble bursts at 500 ms, and the gas escapes from the gap of the particle
layer on the upper left side. At the same time some particles are ejected to the upper free
area of the bed. The ejection method and the gas escaping method are very similar to the
case of inlet position B. The particle concentration on the right side of the bubble is higher
than other areas around the bubble. This is because the particles on the upper right side of
the inlet position C move upward along the wall under the action of the inlet gas flow. As
the bubble bursts, the height of the bed basically remains at a certain level, while the ejected
particles gradually fall back in this area.
It can be seen from Figure 3.15 that the particle concentration in the side wall area on
both sides of the fluidized bed is getting higher and higher, which indicates that the bubble
first moves upward in the initial stage and after the bubble bursts, the particles on top of the
bubble fall down. The pressure inside the bubble is greater than the pressure in the free area,
and the particles in the bubble gather near the two side walls of the fluidized bed under the
action of the pressure. Therefore, the particles near the two side walls not only come from
inside of the bubble, but also partly come from the particle layer on the top of the bubble in
the fluidized bed. In case of inlet position B, the velocity distribution in the particle layer on
top of the bubble is high in the center and low on both sides. A similar phenomenon also
appears in Figure 3.10, therefore some particles on both sides of the top of the bubble move
downward.
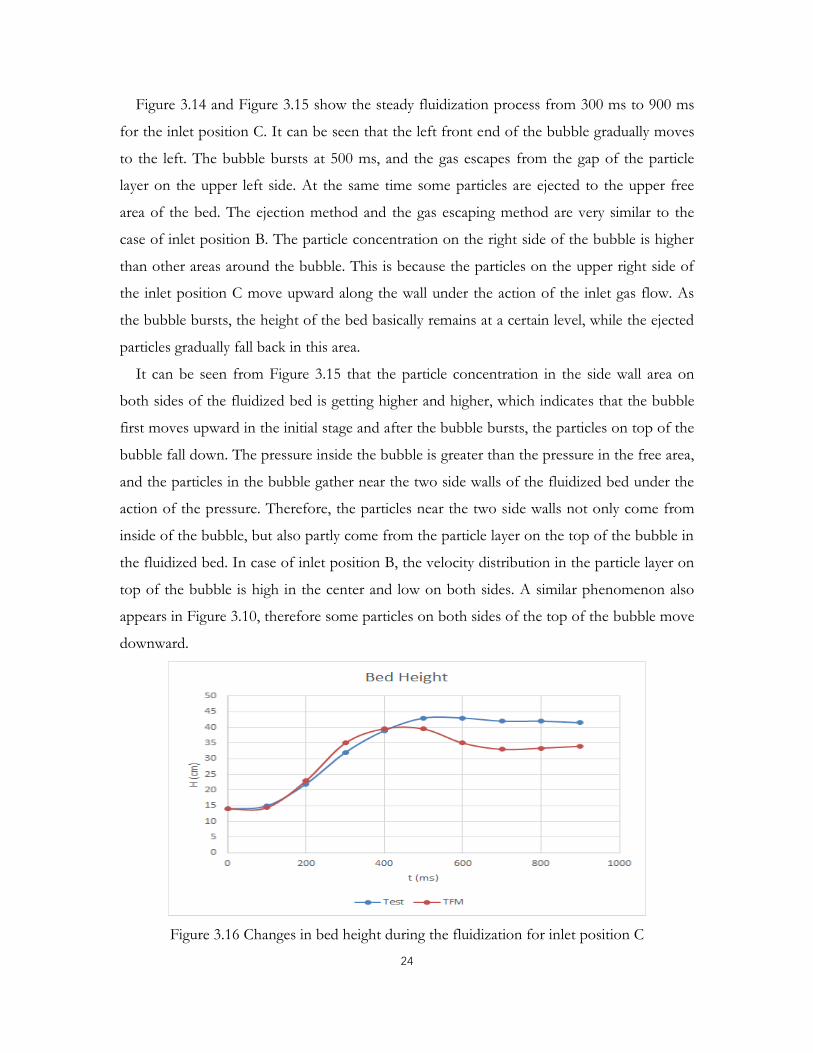
Figure 3.16 Changes in bed height during the fluidization for inlet position C

25
Figure 3.16 shows the change in bed height with time for inlet position C. It can be seen
that the bed height reaches the maximum at about 400 ms to 500 ms. Compared to inlet
position A and inlet position B, the time for the bed to reach the maximum is slightly
delayed. It shows that as the inlet position moves away from the wall and approaches the
middle of the fluidized bed, the degree of particle restriction by the wall in terms of kinetic
energy transfer and displacement gradually decreases. More particles can obtain higher
kinetic energy and shift position. The mixing effect in the bed is further increased.
Figure 3.17 Transient changes in gas phase flow for inlet position C
Figure 3.17 shows the transient change in the gas flow velocity streamline from 0 ms to
900 ms for the inlet position C. The airflow forms an annular circulation area on the left and
26
right sides of the inlet position C, but the air circulation area on the left side of the inlet
position C is larger than that on the right side. There is an airflow vortex in the left
circulation area, and its shape and size are very similar to those in the case of the inlet
position B. The size of the airflow vortex has undergone a change from small to large and
then back to small. This is basically consistent with the evolution of the bubble. The main
reason is that the airflow inside the bubble changes its direction after contacting the particles
at the bubble boundary. As the gas continues to be pumped in from the inlet of the fluidized
bed, the volume of the gas in the bubble grows and the size of the vortex gradually increases.
3.4 Inlet Position D
Computations are compared with the experimental data for three stages of fluidization for
inlet position D in the following figures. The computations are performed from 0ms to
900ms and are compared with the experimental data.
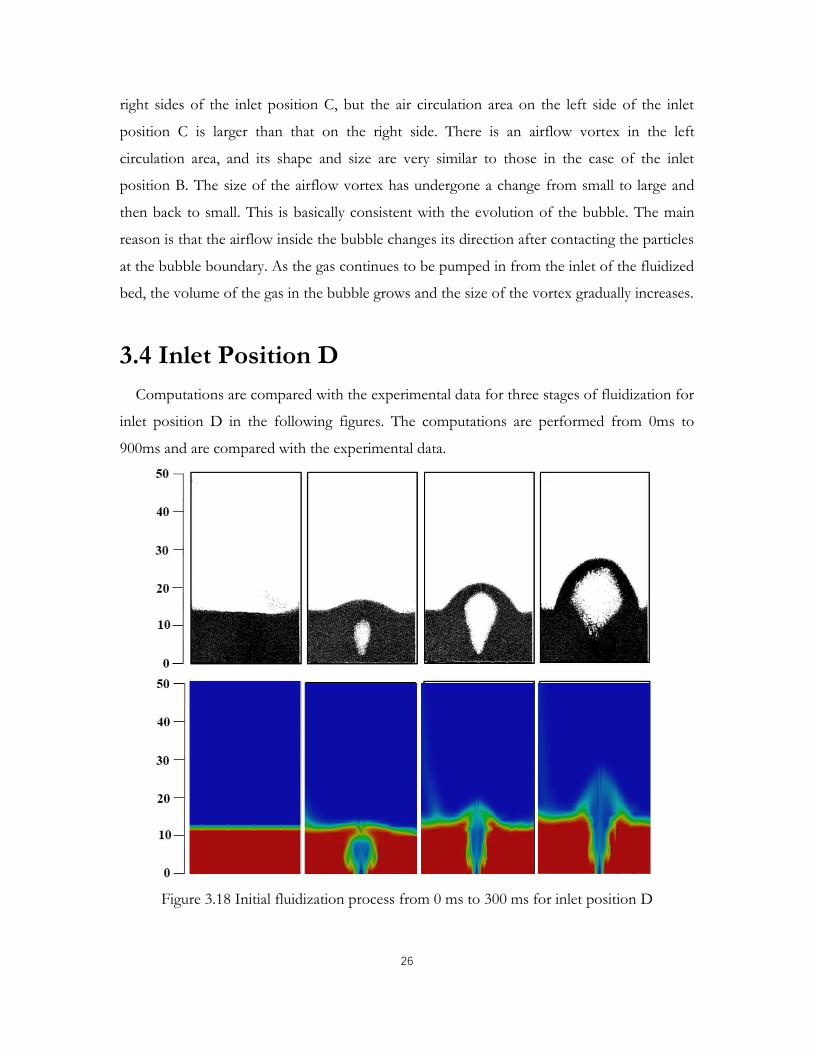
Figure 3.18 Initial fluidization process from 0 ms to 300 ms for inlet position D

27
Figure 3.18 shows the initial fluidization process in the fluidized bed from 0 ms to 300 ms
in the case of inlet position D. When the inlet position is located at the middle of the bottom
of the fluidized bed, the air enters the inlet position D and generates an almost symmetrical
bubble shape. Compared to the inlet position A, the inlet position B and the inlet position C,
the bubble in inlet position D does not incline toward the left side. When the bubble rises,
the particles on the upper side are driven to move together, and some particles gradually fall
under gravity.
Figure 3.19 Stable fluidization process from 400 ms to 600 ms for inlet position D
Figure 3.20 Secondary fluidization process from 700 ms to 900 ms for inlet position D

28
Figure 3.19 and Figure 3.20 show the stable fluidization process and secondary
fluidization process from 300 ms to 900 ms at inlet position D. The bubble bursts at around
400 ms, and the particle ejection occurs at top of the bed from 400 ms to 600 ms. In this
position, the airflow enters from the center of the bottom of the fluidized bed and then
moves upward at high speed. Since the movement of the particles is mainly dominated by
the airflow, the bursting point of the bubble is also located at the center area on top of the
bubble. This is the same as in case of inlet position B and inlet position C. The small
difference can be noted from Figure 3.20. The particles in the free space entrained by the
airflow fall back on top of the fluidized bed to form a stable half spherical shape. Compared
to the other inlet positions, the inlet position D has larger interaction area between the gas
phase and the solid phase, and the contact efficiency between the two phases is higher. It
can be seen from the solid phase concentration at the bottom dense phase zone after the
bubble shape has stabilized. The bottom middle inlet position D is better for the gas-solid
mixing effect than other positions A, B, and C.
Figure 3.21 Changes in bed height during the fluidization for inlet position D
Figure 3.21 shows a comparison of change in the bed height with time for inlet position D
obtained by numerical simulation and experimental measurement. It can be seen that the bed
height and bubble area reach maximum around 600 ms. Compared to the 500ms for inlet
position B and inlet position C, the time to reach the maximum bed height is further delayed.

29
At the same time, the maximum bed height is also greatly increased compared to the other
three inlet positions A, B. and C, which further indicates that the inlet position affects the
kinetic energy transfer inside the fluidized bed. Larger distance between inlet and the wall
can reduce the effect of the wall and increase the kinetic energy transfer from the gas to the
solid particles.
Figure 3.22 Transient changes in gas phase flow for inlet position D
Figure 3.22 shows the transient changes in gas phase flow streamlines from 0 ms to 900
ms. It can be seen that the airflow circulation areas on the left and right sides of the inlet
position D are very symmetrical, and a vortex is formed on both left and right side and the
rotation direction of the two vortices is opposite. The main reason is that the development
of the bubble is initially upwards and then expands to the left and right side. The gas flow

30
velocity in the center of the bubble is higher than the velocity along the two side walls. After
the upward airflow hits the particles on the top of the bubble, the airflow is blocked and
rotates on both sides. Due to the effect of the left and right side walls, two vortices with
opposite rotation are formed.
31
Chapter 4 Conclusions and Future Work
For dilute gas-solid flow fluidized bed considered in this thesis, the Eulerian Two-Fluid
Model (TFM) is employed in the numerical simulation. TFM has shown the ability to
accurately simulate the fluidization process. Four cases with four different inlet positions at
the bottom of the bed are considered. Computational results are obtained for the bed height,
bubble position and other fluidization characteristics, as well as the gas pressure and velocity
fields. A comparative analysis of the effect of inlet position on fluidization process was
conducted. The study found that the position of the inlet at the bottom of the fluidized bed
has significant influence on the bubble morphology and its evolution and eventual burst.
The closer the inlet position to the right wall, the more the bubble centroid tilts to the left.
Also, the time when the bubble appears to be tilting varies with the position of the inlet. The
farther the inlet position is from the wall, less is the tilt in the bubble and it occurs at a later
time.
The gas inlet position also has an important influence on the bed height. When the inlet
position is close to the center of the fluidized bed, there is only one maximum value of the
bed height; the bed height initially shows an increasing trend and then a decreasing trend.
When the inlet position is close to the wall, the bed height has both a maximum value and a
minimum value showing a trend of first increasing with time, then decreasing with time, and
then again increasing with time. Furthermore, the position of the inlet has great influence on
the way of gas escape, the area of gas escape, and the way of particle ejection. The closer the
inlet position is to the center of the fluidized bed, the more intense is the particle ejection
and the larger is the area covered. The inlet position determines the kinetic energy transfer
inside the fluidized bed. When the inlet position is located away from the wall, the particles
are not restrained by the wall both in the terms of kinetic energy transfer and displacement.
More and more particles can obtain kinetic energy and get involved in the fluidization
process. From comparisons of fluidization behavior for different inlet positions and their
effects on the gas/solid phase interaction and on the whole fluidization process, it can be
concluded that the best fluidization results are achieved when the inlet is at the bottom
center.

32
Furthermore it is clear that for obtaining better fluidization results, single inlet will not be
sufficient. The numerical simulation of four inlets working at the same time should be
conducted and compared with the experimental data in the future. At the time of this study,
experimental data for four inlets was not available.
33
References
[1] Stanly, Ronith, Georgy Shoev, and Kokhanchik A. A. (2017). Numerical Simulation of
Gas-Solid Flows in Fluidized Bed with TFM Model. AIP Conference Proceedings. 1893, no. 1
030040.
[2] Patankar, N. A., and Joseph, D. D. (2001). Modeling and numerical simulation of
particulate flows by the Eulerian–Lagrangian approach. International Journal of Multiphase Flow,
27(10), 1659–1684.
[3] Syamlal, M., and O’Brien, T. J. (1988). Simulation of granular layer inversion in liquid
fluidized beds. International Journal of Multiphase Flow, 14(4), 473–481.
[4] Taghipour, F., Ellis, N., and Wong, C. (2005). Experimental and computational study of
gas–solid fluidized bed hydrodynamics. Chemical Engineering Science, 60(24), 6857–6867.
[5] Gera, D., Gautam, M., Tsuji, Y., Kawaguchi, T., and Tanaka, T. (1998). Computer
simulation of bubbles in large-particle fluidized beds. Powder Technology, 98(1), 38–47.
[6] Ostermeier, P., DeYoung, S., Vandersickel, A., Gleis, S., and Spliethoff, H. (2019).
Comprehensive investigation and comparison of TFM, DenseDPM and CFD-DEM for
dense fluidized beds. Chemical Engineering Science, 196, 291–309.
[7] Goldschmidt, M. J. V., Kuipers, J. A. M., and van Swaaij, W. P. M. (2001). Hydrodynamic
modelling of dense gas-fluidized beds using the kinetic theory of granular flow: Effect of
coefficient of restitution on bed dynamics. Chemical Engineering Science, 56(2), 571–578.
[8]Lun C.K.K., Savage S.B., Jeffrey D.J., Chepurniy N. Kinetic theories for granular flow:
inelastic particles in Couette flow and slightly inelastic particles in a general flow field J Fluid
Mech, 140 (1984), pp. 223-256
[9] Gidaspow, 1994 D. Gidaspow Multiphase flow and fluidization: Continuum and kinetic

34
theory description. Academic Press, New York (1994)
[10] M. Syamlal, W.A. Rogers, T.J. O'Brien. (1993). MFIX Documentation and theory guide,
94-1004, NTIS DE94000087.
[11] Wen, C.Y. and Yu, Y.H. (1996). Mechanics of Fluidization, Chemical Engineering
Progress62, pp. 100-111
[12] J.F. Richardson, W.N. Zaki Sedimentation and fluidisation: part I Trans. Inst. Chem.
Eng., 32 (1954), pp. 35-53

35
Vita
Feng Feng
Degrees: M.S., Mechanical Engineering, Washington University in St. Louis, St. Louis, MO
May 2021
B.S., Automotive Engineering, Wuhan University of Technology, Wuhan, China
June 2018