NUMERICAL SIMULATION AND SENSITMTY ANALYSIS OF GAS OIL …
33
NUMERICAL SIMULATION AND SENSITMTY ANALYSIS OF GAS OIL GRAVITY DRAINAGE EOR By AHMAD SHARIF BIN ABD RAHMAN Dissertation submitted in partial fulfillment of the requirements for the Bachelor of Engineering (Hons) (Petroleum Engineering) MAY2011 Universiti Teknologi PETRONAS Bandar Seri Iskandar 31750 Tronoh Perak Darul Ridzuan
Transcript of NUMERICAL SIMULATION AND SENSITMTY ANALYSIS OF GAS OIL …
NUMERICAL SIMULATION AND SENSITMTY ANALYSIS OF GAS OIL GRAVITY
DRAINAGE EOR
By
AHMAD SHARIF BIN ABD RAHMAN
Dissertation submitted in partial fulfillment of
the requirements for the
Bachelor of Engineering (Hons)
(Petroleum Engineering)
MAY2011
Universiti Teknologi PETRONAS
Bandar Seri Iskandar
31750 Tronoh
Perak Darul Ridzuan

CERTIFICATION OF APPROVAL
Numerical Simulation and Sensitivity Analysis of Gas Oil Gravity Drainage EOR
Approved by,
By
Ahmad Sharif Bin Abd Rahman
A project dissertation submitted to the
Petroleum Engineering Programme
in partial fulfillment of
the requirements for the
Bachelor of Engineering (Hons)
(Petroleum Engineering)
(Mr. Iskandar Dzulkarnain)
UNIVERSITI TEKNOLOGI PETRONAS
TRONOH, PERAK
May201!
ii

CERTIFICATION OF ORIGINALITY
This is to certify that I am responsible for the work submitted in this project, that the
original work is my own except as specified in the references and acknowledgement,
and that the original work contained herein have not been undertaken or done by
unspecified sources or persons.
AHMAD SHARIF BIN ABO RAHMAN
iii

ABSTRACT
This study aims to shed some light on NUMERICAL SIMULATION AND
SENSITIVITY ANALYSIS OF GAS-OIL GRAVITY DRAINAGE EOR. The
purpose of this project is to investigate the effects of the parameters that control the
process (for example; rate of the gas injection and oil production) and reservoir
heterogeneities on the overall performance of immiscible gravity drainage enhanced
oil recovery (EOR). Reservoir simulation studies will be conducted to map effective
combinations of these parameters with respect to the oil recovery performance.
Simulation runs yield several figures and plots, in which depicts the results of
analysis. This document is a dissertation which encompasses a background of the
study, a problem statement, the objective and scope of study, the relevancy and
feasibility of study within the scope and time frame, the literature review, the outline
of the research methodology, and project activities with key milestones.
iv

ACKNOWLEDGEMENTS
I am grateful to Allah, my Lord and Cherisher, for guiding me to conceptualize,
develop and complete my final year project, Numerical Simulation and Sensitivity
Analysis of Gas Oil Gravity Drainage EOR. Indeed, without His Help and Wil~
nothing is accomplished.
I would like to express my tremendous appreciation to my supervisor, Mr. Iskandar
Dzulkamain for his guidance and support throughout the process of completing this
thesis. His willingness to spend his valuable time to supervise my project despite his
workload is highly appreciated.
Thank you to my parents and family, for understanding the amount of time that I
need to spend in order to complete this project. Without their support, I will not have
the strong will to complete this project.
And finally, thank you to my friends, classmates and others who had assisted me
throughout completion of this project.
v

Table of Contents
CERTIFICATION OF APPROVAL ................................................................................................ ii
ABSTRACT ................................................................................................................................ iv
ACKNOWLEDGEMENTS ............................................................................................................ v
INTRODUCTION ............................................................................................................ 2
1.1 Project Background .................................................................................................. 2
1.2 Problem Statement .................................................................................................... 3
1.2.1 Problem Identification ...................................................................................... 3
1.2.2 Significant of the Project .................................................................................. 3
1.3 Objective and Scope of Study .................................................................................. 4
1.3.1 Objectives ......................................................................................................... 4
1.3.2 Scope ofStudy .................................................................................................. 4
1.4 Relevance of Project ................................................................................................ .4
1.5 Feasibility of the Project within Scope and Time Frame .......................................... S
2 LITERATURE REVIEW ................................................................................................. 6
2.1 Enhanced Oil Recovery ............................................................................................ 6
2.2 Gravity Drainage Theory .......................................................................................... 7
2.3 Factors Affecting Gravity Drainage ......................................................................... 7
2.3.1 Wettability ........................................................................................................ 8
2.3.2 Capillary Pressure ............................................................................................. 8
2.3.3 Heterogeneity .................................................................................................... 9
3 RESEARCH METHODOLOGY ................................................................................... 11
3.1 Project Activities .................................................................................................... 11
3.2 BriefExplaination on Simulation Work ................................................................. 12
3.3 Tools, Materials, and Equipments .......................................................................... 13
3.4 Project's Gantt Chart and Key Milestones ............................................................. 14
4 RESULTS AND DISCUSSION ..................................................................................... 15
4.1 Reservoir Simulation Studies ................................................................................. 15
4.2 Reservoir Model Description .................................................................................. 15
4.3 Field Development ................................................................................................. 16
4.4 Effect of Well Physical Arrangement ..................................................................... 17
4.5 Effect of Gas Injection and Oil Production Rates .................................................. 18
4.6 Effect of Porosity Heterogeneity ............................................................................ 21
4.7 Effect of Connate Water Saturation ........................................................................ 23
vi

5 CONCLUSIONS & RECOMMENDATIONS ............................................................... 24
5.1 Conclusions ............................................................................................................ 24
5.2 Recommendations .................................................................................................. 25
6 REFERENCES ............................................................................................................... 26
LIST OF FIGURES
Figure I: Project Activities.......... . . . . . . . . . . . . . . . . . . . . . . . . . . . . . . . . . . . . . . . . . . . . . . . . . . . . . . . . . . . . . . . II
Figure 2: Simulation runs........................................................................... 12
Figure 3: Gantt chart with key milestones........................................................ 14
Figure 4: Reservoir model in 3D view............................................................ 16
Figure 5: Ternary saturation after 15 years ofproduction ....................................... 17
Figure 6: Recovery performance in three different production methods ....................... 18
Figure 7: GAGD performance in four gas injection and oil production rate combinations .. 19
Figure 8: Effect of the varying oil production rates at constant gas injection rates on GAGD oil recovery..... . . . . . . . . . . . . . . . . . . . . . . . . . . . . . . . . . . . . . . . . . . . . . . . . . . . . . . . . . . . . . . . . . . . . . . . . . . . . . . . . . . . . ... 20
Figure 9: Effect of porosity heterogeneities on GAGD performance.......................... 22
Figure 10: Comparison ofGAGD performance at four Swc values: 0.25, 0.19, 0.15 and 0.08 ..................................................................................................... 23
vii

CHAPTER!
1 INTRODUCTION
1.1 Project Background
Gas injection either in the immiscible or miscible mode (largely C02) is the
key process amongst the major contending methods of enhancing oil
recovery. It can be carried out either in secondary or tertiary stage of the
producing life of the reservoir in continuous mode, alternating cycles of water
and gas or in gravity drainage mode. Continuous gas injection methods are
largely impaired by the viscous instabilities, the severe gas-oil gravity
segregation and the poor volumetric sweep efficiency. Moreover, the larger
difference of the density between the injected gas and the in-situ reservoir
fluid leads to severe gravity segregation effects. The cumulative effect is an
uncontrolled gas flood front leading to the premature gas breakthrough in the
producing wells and the unfavorable mobility ratio culminating into the
severe viscous fingering. Further modifications in the injection modes could
not completely eliminate these recovery impeding factors. Therefore, a
method that uses the natural density based gravity segregation of the fluids to
recover the bypassed oil in the unswept regions looks to be a more promising
option.
Gravity forces are recognized to play an important role at nearly every stage
of the producing life of the reservoir, whether it is primary depletion,
secondary water or gas injection scheme or tertiary enhanced or improved oil
recovery methods. They always compete with the viscous (flow rate per unit
area) forces and the capillary (ratio of the fluid/fluid forces to the grain size)
forces occurring in porous media in addition to the vertical barriers in the
form of heterogeneity. In presence of these impeding factors less dense fluid
gets trapped in the producing zone, further diminishing the oil recovery
performance. Conversely, gravity forces can be taken into advantage through
the gravity drainage mechanism to maximize oil recovery from the oil
bearing zone under investigation. A number of investigations carried out in
2

the laboratories and in the field (Bangia et a!., 1991; Chatzis et a!., 1988; Da
Sle and Guo, 1990; Kulkarni and Rao, 2006) suggest the significance of the
gas-oil gravity drainage process in view of the higher oil recoveries obtained
in contrast to the conventional gas injection EOR methods. Gravity drainage
by gas injection is commonly implemented in either dipping or pinnacle reef
type reservoirs.
1.2 Problem Statement
1.2.1 Problem Identification
The main difficulty in the gas-oil gravity drainage EOR process
mechanism is to optimize the oil recovery in the reservoir. This is
very closely related to the effects of the parameters that control the
process; which are rates of the gas injection and oil production. Apart
from that, reservoir heterogeneities play the big role in the
mechanism. Since heterogeneity in porosity and permeability do
influenced on vertical sweep efficiency, gas injectivity, vertical
communication between layers, gravity crossflow, and fluid
channeling, therefore the overall oil recovery performance of the
reservoir will also be impacted.
1.2.2 Significant ofthe Project
A better understanding of Gas-Assisted Gravity Drainage (GAGD)
will be achieved by simulating the effects of changes in injection and
production rates based on mobility, heterogeneity in porosity and
permeability, and physical arrangement of wells, on recovery
performance.
3

1.3 Objective and Scope of Study
1.3 .1 Objectives
a. To simulate the EOR-assisted gas-oil gravity drainage using
simulation software within several parameters. I
b. To determine the effective combinations of these par11111eters that
will optimize the oil recovery, since the parameters are affecting
sweep efficiency.
i. Study the effects of well physical arrangement.
ii. Study the effects of injection and production rate
(mobility).
iii. Study the effects of porosity heterogeneity.
iv. Study the effects of connate water saturation.
1.3.2 Scope of Study
a. Familiarization of terms and theory related to the study.
b. Reading papers andjoumals that relevant to the study.
c. Familiarization of the simulation software that is going to be used
in this study.
d. Conducting simulations of gas-oil gravity drainage EOR to see the
effects of mobility, heterogeneity in porosity and permeability,
and well physical arrangement on the sweep efficiency and
recovery performance using simulation software from CMG.
1.4 Relevance of Project
At a time when the oil production using primary and secondary recovery
become uneconomical, it is wise to start the enhanced oil recovery method.
Enhanced oil recovery, EOR, has been the object intensive research for the
past decades. Many EOR processes are aimed at recovering more oil from
depleted reservoirs which still contain as much as 50% or more of the original
oil in place.
4

This study will produce simulation models based on sensitivity analysis in
which to observe effects of several parameters towards enhancing oil
recovery for gas-oil gravity drainage. This will be investigated by learning
the effects of injection and production rates, the effect of type of injection
well, as well as permeability and porosity heterogeneity effect; in which all of
them are with respect to the oil recovery performance.
1.5 Feasibility of the Project within Scope and Time Frame
a. Papers and journals for referencing purpose can be downloaded from the
website, www.onepetro.org without any charge imposed to the student.
b. The simulation software (by CMG) required for the simulation work is
available in computer laboratory at Academic Block 15 complete with
how-to-use manual.
c. Since the study is on the simulation, no other materials other than the
software and a computer are needed.
5

CHAPTER2
2 LITERATURE REVIEW
2.1 Enhanced Oil Recovery
As production from oil-bearing reservoirs matures, the need for enhanced oil
recovery becomes increasingly important; EOR then becomes the only
alternative for revitalizing the matured reservoirs. The target oil for all the
EOR processes is the residual oil that is left behind after primary and
secondary production modes. EOR is the recovery of additional oil from an
oil reservoir by injection of materials not normally present in the reservoir.
The oil recovery profile over the life of the reservoir is broadly classified as
primary, secondary and tertiary recovery modes. Primary recovery is oil
recovery by natural drive mechanisms inherently present in the reservoir.
Natural drive oil recovery mechanisms include solution gas, water influx, and
gas cap or gravity drainage (Muskat, 1949). Secondary recovery refers to
techniques, such as gas cap injection or water injection, whose purpose, in
part, is to maintain the reservoir pressure. Tertiary recovery techniques refer
to any technique applied after secondary recovery, which includes chemical
flooding, thermal processes (steam flooding, steam stimulation, etc.),
miscible processes(C02 miscible flooding, hydrocarbon miscible flooding,
etc.).
EOR encompasses the oil recovery techniques that could be applied in either
secondary or tertiary stages. EOR results principally from the injection of
gases or liquid chemicals and/or the use of thermal energy. The EOR
processes primarily provide a supplementary mechanism to the depleting
natural drive mechanism of the reservoir, such as pressure maintenance,
wettability alteration, and mobility control.
6

2.2 Gravity Drainage Theory
Gravity drainage is defmed as a recovery process in which gravity acts as
the main driving force and where gas replaces the voidage volume (Hagoort,
1980). Gravity drainage has been found to occur in primary phases of oil
production through gas cap expansion, as well as in the latter stages wherein
gas is injected from an external source. Muskat (1949) provides a detailed
review on the effects of gravity forces in controlling oil and gas segregation
during the primary-production phase of gas drive reservoirs. It was
suggested that the most efficient type of gravity-drainage production would
be an idealized case wherein no free gas is allowed to evolve in the oil zone
by maintaining the reservoir pressure above its bubble point, or by pressure
maintenance at current GOR levels (Muskat, 1949).
The importance of gravity drainage as an important oil recovery mechanism
has been well recognized. Gravity drainage has been observed to occur
during gas injection (Muskat, 1949) as well as in the stripper stages of
volumetric reservoirs (Matthews and Lefkovits, 1956). Field and laboratory
experience has shown that that gravity drainage, under certain conditions,
can result in very high oil recoveries and also, that gravity drainage is one of
the most effective mechanisms of developing an oil field.
2.3 Factors Affecting Gravity Drainage
Gravity has long been recognized as one of the three important natural forces
for expelling oil from the reservoir rock, along with edge water drive and
solution gas drive. However, the quantification of oil recovery due to
drainage has long been a concern.
Calhoun (1955) suggests that if drainage was occurring, those wells lowest
in the structure should recover the highest amount of cumulative oil. During
the early life of the reservoir, the reservoir tends to produce by solution gas
drive, depending upon how much pressure drawdown is available. Although
7

the primary mechanism is solution gas drive, some drainage is still evident
in the reservoir during the production period at the lower part of the
reservoir. However, when the reservoir pressure depletes, gravity drainage
seems to be taking place at greater portions of the reservoir (Lewis, 1943).
2.3.1 Wettability
The wettability of a reservoir rock is a critical factor in determining
the displacement effectiveness and ultimate oil recovery by displacing
fluids, such as gas or water. Kovscek et al. (1993) suggest that since
most wetting fluids tend to occupy the smallest and most
hydrodynamically resistive pore channel, wettability is a prime factor
in controlling multiphase flow and phase trapping.
Three broad classifications of homogeneous wettability are (i) water
wet, (ii) oil-wet, and (iii) intermediate-wet. The wetting characteristic
of a reservoir rock is a critical factor in the determination of residual
oil saturation after a given production scheme. A water-wet formation
tends to expel more oil from the porous space in the early life of oil
production. However, oil in the form of lenses tends to remain in the
larger pore spaces because of capillary action. The need for EOR
hence arises at these conditions in order to extract the otherwise lost
oil. Gas injection EOR has been efficient in the recovery of this
residual oil owing to reduction of interfacial tension and enhancement
of film flow in the porous media. (Kulkarni, 2004)
2.3.2 Capillary Pressure
The distribution of oil, gas, and water in the reservoir pores is
controlled by their capillary interaction and the wetting characteristics
of the reservoir rock. Whenever immiscible phases coexist in the
porous media, as in essentially all processes of interests, surface
8

energy related to the fluid interfaces influences the distribution,
saturations, and the displacement of the phases.
Most of the EOR processes tend to reduce the interfacial forces
existing across the interface of the oil with injected fluid. However, in
immiscible processes, characterized by high IFT, capillary force exists
and traps the non-wetting fluid in the pore space.
Lewis et al. (1942) suggested that the self-propulsion of oil downward
through sand under the impulse of its own weight occurs in two zones.
At the top, where the liquid is in contact with free gas, the sand is only
partially oil saturated and capillarity controls the flow. Below the base
of this capillary zone, which corresponds to a free surface, the sand is
saturated or nearly saturated with liquid and flow follows hydraulic
laws. Therefore, the complete knowledge of the capillary action in the
porous media is necessary to predict the saturations and displacement
of the displaced phase.
Kantzas et al. (1988) presented equations to predict the saturations of
each phase inside the capillaries of arbitrary pore sizes. Capillary
pressure versus saturation plots for the three phase systems in
capillaries of regular pore geometries were also developed. Li and
Horne (2003) developed an analytical model based on capillary
pressure curves to match and predict the oil production by free-fall
gravity drainage. The model was able to match the experimental and
numerical simulation data of oil recovery as well as the oil production
data from Lakeview pool and Midway sunset field. These analytical
models may find application in predicting recovery in the proposed
GAGD process.
2.3.3 Heterogeneity
9
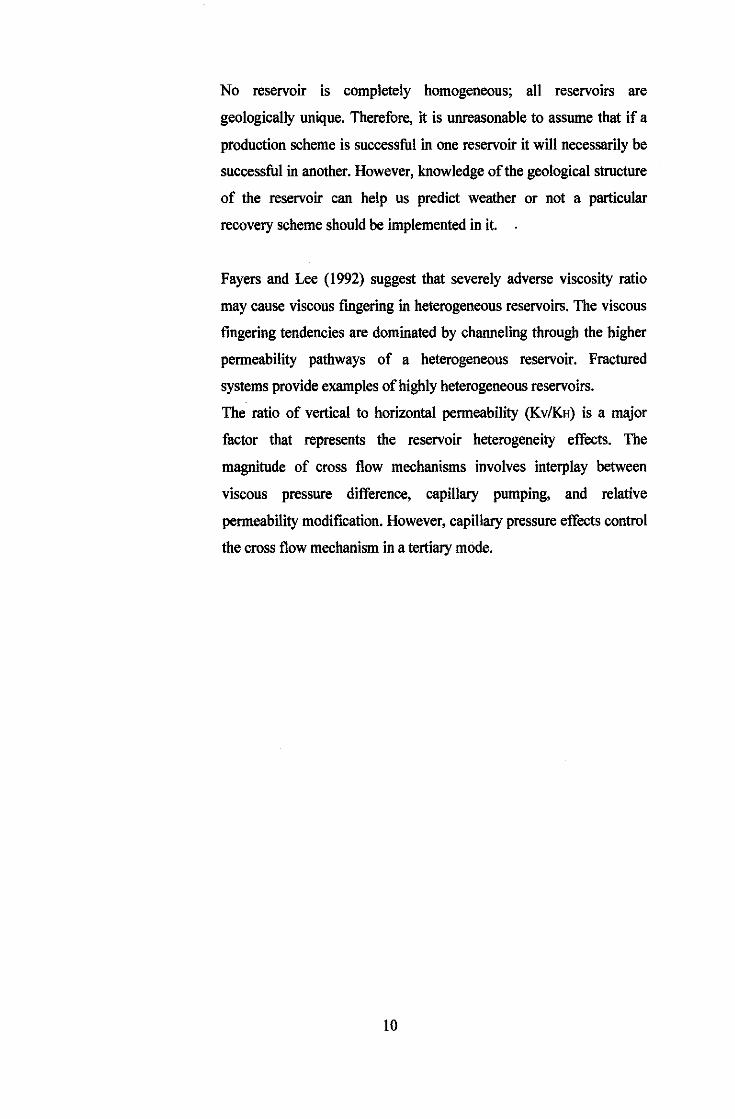
No reservoir is completely homogeneous; all reservoirs are
geologically unique. Therefore, it is unreasonable to assume that if a
production scheme is successful in one reservoir it will necessarily be
successful in another. However, knowledge of the geological structure
of the reservoir can help us predict weather or not a particular
recovery scheme should be implemented in it.
Fayers and Lee (1992) suggest that severely adverse viscosity ratio
may cause viscous fmgering in heterogeneous reservoirs. The viscous
fmgering tendencies are dominated by channeling through the higher
permeability pathways of a heterogeneous reservoir. Fractured
systems provide examples of highly heterogeneous reservoirs.
The ratio of vertical to horizontal permeability (KviKH) is a major
factor that represents the reservoir heterogeneity effects. The
magnitude of cross flow mechanisms involves interplay between
viscous pressure difference, capillary pumping, and relative
permeability modification. However, capillary pressure effects control
the cross flow mechanism in a tertiary mode.
10

CHAPTER3
3 RESEARCH ME mODO LOGY
Below is the methodology and general flow of this project.
3.1 Project Activities
Develop a problem statement and objective of research based on the initial findings and review of journals and books which relates to the research title, also from the discussion with the supervisor .
.. Understanding comprehensively the main concept of displacing
mechanism for Enhanced Oil Recovery through intensive review of EOR reservoir engineering books
.. Research on the theory and displacing mechanism behind the
application of GAGD to improve the recovery of oil through books, journals, and research papers .
.. Review of the main screening criteria and previous field application
ofGAGD in EOR
• Develop an initial hypothesis to provide solutions to the problem statement.
• Develop a detailed methodology and procedures for conducting the required simulation to achieve the objectives
• Conduct simulation studies through sensitivity analysis of reservoir
heterogeneities, injected and produced fluid properties, and displacement patterns in GAGD .
• Summarize all the fmdings and the analysis of the simulations
results by preparing a written report and presentation.
Figure l: Project Activities
ll
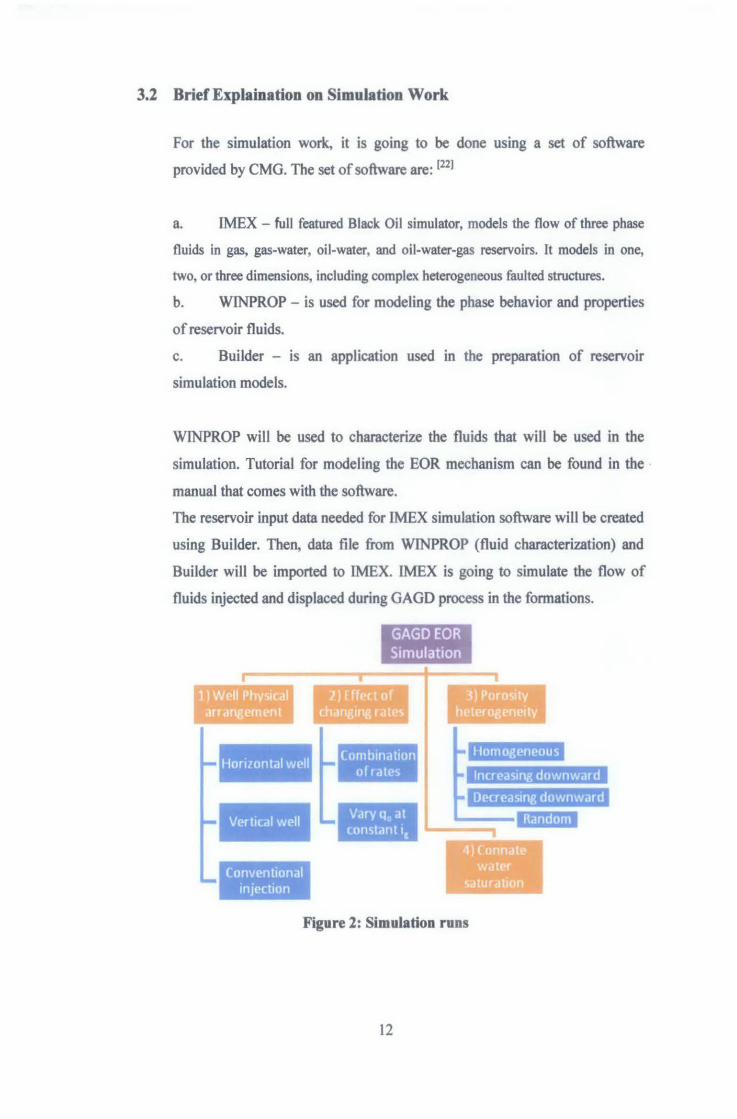
3.2 Brief Explaination on Simulation Work
For the simulation work, it is going to be done using a set of software
provided by CMG. The set of software are: [llJ
a. IMEX - full featured Black Oil simulator, models the flow of three phase
fluids in gas, gas-water, oil-water, and oil-water-gas reservoirs. It models in one,
two, or three dimensions, including complex heterogeneous faulted structures.
b. WINPROP - is used for modeling the phase behavior and properties
of reservoir fluids.
c. Builder - is an application used in the preparation of reservoir
simulation models.
WINPROP will be used to characterize the fluids that will be used in the
simulation. Tutorial for modeling the EOR mechanism can be found in the
manual that comes with the software.
The reservoir input data needed for IMEX simulation software will be created
using Builder. Then, data file from WINPROP (fluid characterization) and
Builder will be imported to IMEX. IMEX is going to simulate the flow of
fluids injected and displaced during GAGD process in the formations.
13) Well Physic:411 , c'H'rangement
I
I
Horizontal well I
Vertical well
Conventional injection
GAGD EOR I
Simulation 1
l) [ffect of daangin& rates
3) I' or osity heter()fleneily '
Homogeneous
Increasing downward
Decreasing downward
4) Connate water
gLUration
Figure 2: Simulation runs
12

3.3 Tools, Materials, and Equipments
The tool required for this study is simulation software provided by Computer
Modelling Group Ltd. (CMG). The software will be use to simulate GAGD
process mechanism.
13

3.4 Project's Gantt Chart and Key Milestones
Week (Final Yen Project 1) No Task 1 l 3 4 5 6 7 8 9 10 11 11 13 14
I Selection of Project Topic .. I
l Preliminary Research Work D I
3 Preliminary Report Submission I .. 4 Literature Review • 5
Proposal Defense and Progress a Evaluation I
' Draft Interim Report Submission A ~
7 Interim Report Submission
Week (Final Year Project 2)
No Task I l 3 .. 5 6 7 8 9 10 11 ll 13 14
I Software Learning
l Simulation Work II I
3 Results Analysis D I
4 Progress Report Submission I .. 5 Pre-EDX • 6 Draft Report Submission a
I 7
Dissertation Submission A (Softbound) ~
a Technical Paper Submission
' Oral Presentation
10 Dissertation Submission (Hardbound)
D *Key milestones
Figure 3: Gantt chart with key milestones
14

CHAPTER4
4 RESULTS AND DISCUSSION
4.1 Reservoir Simulation Studies
Sensitivity analysis of operational parameters controlling GAGD process is
investigated through reservoir simulation runs using CMG simulator: IMEX, an
implicit explicit black oil simulator, and Builder.
4.2 Reservoir Model Description
Reservoir model is a hypothetical system with conventional Cartesian grids as
indicated in Table I. Other basic data listed in Table I are adopted from West
Hackberry, USA field data.
Property Reservoir properties
Pressure reference Grid properties
Gas oil contact, ft Water oil contact, ft Reservoir temperature, F Porosity,% Permeability Connate water Swc, % Oil API gravity Bubble point pressure, psi Oil FVF atPb GOR, scf7STB
Reservoir model Top depth, 5,000 ft Thickness, 1,500 ft
3,200 psi at 6,200 ft 20 X 15 X 10
(100ft X 60ft x 150ft)
5,450 6,200 205 27.6 1000
19 33
3,295 1.285 500
Table 1: Reservoir model details
Black oil was invoked to simulate three-phase flow of fluids. Reservoir fluid used is
a 33° API black oil with a solution gas with a gravity of 0.65. Pressure, volume and
temperature properties of reservoir fluid are generated using correlations
incorporated in Builder. Connate water (0.19), critical gas (0.06) and end point
saturations of oil, gas and water in a water-wet system are assigned in Builder to
calculate relative permeability values. All Corey exponents are set as 2.0. Gas-oil
15

contact (GOC) and WOC are at depths of 5,450 ft and 6,200 ft, respectively, with
pay zone thickness of 750 ft. Model initialization yielded in-place volumes of oi~
water and gas as 10.74 MMSTB, 11.33 MMSTB and 12.98 BCF, respectively.
Figure 4: Reservoir model in 30 view
4.3 Field Development
1 00 100 Sw So
Min Values: Sw= 0.000 So= 0 000 Sg =0000
Field development was undertaken with drilling of 5 horizontal production wells
(perforated in Layer 8) and 2 vertical injection wells (perforated in Layer 2). The
entire field was put on production [target of 500 BPD per well] and gas injection
[target of 2,600 MSCF /d per well] in August 2011 until August 2031 .
16

4.4 Effect of Well Physical Arrangement
To study the effect of well physical arrangement on oil recovery perfonnance, three
different methods were simulated:
I. Five vertical production wells (located at I-Layer 18) and two vertical
injection wells (located at 1-Layer 3) were drilled and perforated in each oil
zone layer.
II. Five vertical production wells (perforated at K-Layer 6, 7 & 8) and two
vertical injection wells (perforated at K-Layer 2) were drilled.
111. Five horizontal production wells (located at K-Layer 8) and two vertical
injection wells (perforated at K-Layer 2) were drilled.
Gas injection and oil production rates used are 2,600 MSCF/D and 500 BPD,
respectively, for each well.
Figure 5: Ternary saturation after 15 years of production. (I) Conventional method
(gas is injected at oil zone). (11) GAGD method with vertical production wells.
(III) GAGD method with horizontal production wells.
Method m yielded better oil recovery and prolonged gas breakthrough period, as
depicted in Figure 6, compared to Method I and II.
Method
Gas breakthrough (years)
Pil recovery after 15 yrs (%)
I
3
56.0
17
II
7
65.4
III
11 76.1

30,000
2o.oool ~
!
"·-I 2015 2020 2025 2030
Tme(Date)
Figure 6: Recovery performance in three different production methods
4.5 Effect of Gas Injection and Oil Production Rates
Two approaches are adopted. In the first approach, reservoir response to gas injection
and oil production rates is evaluated in 4 sets of values (Case I to IV). Second
approach is based on varying oil production rates at a gas injection rate of 2,600
MSCFD (Table 2).
Rate Combinations Case ig (Mscf/d) Qo (bpd)
I 900 245 II 2600 500 m 3400 670 IV 4200 800
Varying q0 at constant ig A 2600 320 B 2600 600 c 2600 780
. .. Table 2: Rate constramts for rate senstttvtty analysts
18

.------~----~---------~--__,..2.50e+5
................. l ........................ L ........................ L ........................ ~ ... ./ .......... . : : : I : : : I : : :I : : jl : : ll : : /i
6,000
: : I : ~ : : I :
~ j j / j ~ 4,000 ............................................ ~ ........................ -:- .............. / ........ + .... ·;~······· .. e. i : i I i .I
~ : 1 1 / i/ .,, !------ : : I ~ ..! : : / ,~1: ll : : I ' : CC: t- : : I .1' :
: : I .I : ! . ., / . 2,000 -l---= ... +..:-:": ... ':":: ... :':':' ... ::-: .. ':':': ... t.::: .. ::j .. r.: ... t-~.::: ... :: ... :':':1.. ··· ..... ·--~f- ........ r~~-- ···· ····· -~ ................ ·
2015
: ~~ i /~ : ,~·
~ "' ~,"' )'"' : ," ,.""': ,.,"" : : , .;' : .;"' :
2020 2025 Tlme(Dete)
2030
2.00e+5
1.50e+51
~ i cc:
1.00e+5!
§
5.00e+4
Figure 7: GAGD perfonnance in four gas injection and oil production rate
combinations.
In Case I rate combination, oil rate and GOR remained almost constant through as
shown in Figure 7. For Case II, higher oil production is obtained compared to the
previous case. Oil production rate remained almost constant until January 2022.
During this period, producing GOR remained near its solution GOR values,
stabilizing at 500 fY/bbl. Beyond this stage, oil production declined rapidly (see
Figure 7). Corresponding GOR started to rise indicating that the gas floodfront
reached in Layer 8. First gas breakthrough occurred at this stage. Gravity drainage
after gas breaktrough could have come from oil flowing in the fonn of continuous
thin films between the gas and water phases and then draining under gravity towards
producer.
Higher rate combination (Case lll) yield better oil recovery perfonnance. Oil
production rate is higher compared to Case II until gas breakthrough. Producing
GOR did not change noticeably and remained at the solution GOR values because of
the pressure maintenance at near constant values. Rise in producing GOR, containing
the solution and injection gas, is observed when gas floodfront reached layer 8 in
2019 (3 years earlier than Case II). When gas breakthrough occurs, producing GOR
abruptly increases to maximum of 150,000 tt31bbl.

At rate constraints of 4,200 MSCFD and 800 BPD (Case N), higher oil production is
obtained. It took only 7 years to reach Layer 8. GOR sharply increased in 2018 with
the maximum value of 225,000 fflbbl when GOC reached wells. Oil production
mechanism before and after gas breakthrough is similar as obtained in Cases II and
m.
Oil recoveries obtained include 76.0% (Case II), 76.4% (Case III) and 76.6% (Case
IV) OOIP. Analysis of cumulative volumes of the reservoir oil produced show that a
combination of higher gas injection and oil production rates (Case III and N) yielded
insignificant cumulative oil production over previous Case II. As Case II provided
more stable oil recovery and lower GOR pattern, it was selected for the subsequent
simulation runs.
Further studies of varying oil production rates at constant gas injection rates (2,600
MSCFD) were carried out in three settings (see Figure 8). At 320 BPD production
rate, oil recovery by gravity drainage is prolonged tberby delaying gas breakthrough
by 6 years against base case of 500 BPD. Lower GOR and lower cumulative
recoveries were the characteristics of Case A. For 600 BPD (Case B), gas
breakthrough was shortened by 2 years and by 4 years when 780 BPD was used
(Case C).
..----~----..------.--------..----r2.S0.+5
6,000 ................. ; ......................... + ......................... ; ......................... .;. ................ . l CaseA l l l : - CaseS : : :
200.+5
l CaseC l l l i : : : : f f•.ooo ···· i · .. L..... ..... +-· ........ . ·b/ ,,..,.! ~ i - i l ,.,1 ~
: ! , : • I : : / j IIi: IIi: : : ~ : , 1.00.+5 • • : : i ,/ i / cJ c : : : , .,
2,000 ................. ; ......................... f ........................ ; ...... ~ .............. ..,!.+ ................ . : : :,~ ,, : : : ,.': ,; : : 0 , : fll' : , , : ,, : ~500.+4
, : ,, :
oL- --i-l __ --J.,:::,·"..:":::~=~S.,::: .. :!!i": ................ "'~"r ___ .;;;.>.-;:;'·~- J~ .. _ .... _·_-l..o.oo.+O 2015 2020 2025
T1me(Date)
20
2030

Figure 8: Effect of the varying oil production rates at constant gas injection rates on
GAGD oil recovery.
~ase I II III IV A B c pas breakthrough (years) 15 11 8 7 17 9 7
pit recovery after 15 yrs (%) 73.0 76.0 76.4 76.6 64.0 76.1 76.2
4.6 Effect of Porosity Heterogeneity
Heterogeneity delays breakthrough in vertical gravity stable floods because of
physical dispersion and reduced gas channeling through high permeability layer. In
horizontal floods, Kv!Kh (vertical to horizontal permeabilities) ratio is mainly
influenced by viscous, capillary, and gravity forces. Therefore, heterogeneities in
top-down gravity drainage EOR methods may help to improve injectivity and
reservoir sweeps.
Three sets of porosity values were used in this study.
Porosity Heterogeneity Settings Layer Set-I Set-11 Set-III
1 0.18 0.15 0.42 2 0.2 0.17 0.38 3 0.22 0.19 0.34 4 0.24 0.27 0.33 5 0.28 0.27 0.28 6 0.28 0.28 0.27 7 0.28 0.28 0.24 8 0.22 0.33 0.2 9 0.22 0.38 0.16 10 0.22 0.44 0.14
Table 3: Porosity heterogeneity settings
In first set, uniform porosities are assigned in the oil zone (0.28) and the water zone
(0.18) while it is assumed it is increasing downwards in gas zone. Water zone has a
lower porosity than the upper oil zone. In second setting, porosity of the formation is
increasing downwards from the top layer. In third setting, porosity of the formation is
decreasing downwards from the top layer. Gas injection and oil production rates used
21

are 2,600 MSCFD and 500 BPD, respectively. Results obtained in these settings are
then compared to the results obtained in the homogeneous porosity (0.276) setting.
2.50e+5
i e.ooo ·················~·········· ........... --:······· .. · ~ Homogene9us = o.22··r ······················-r·············· 2ooe+6
-!-- Set I 1 : ; l Setll ! l : I I : : I
I ~ Set Ill i l 1 : : : ! 1.50e+5 ... ooo ............ !...... ····r·············-···· ... -r············-·· ·······r· .. ... ...... ~
~ : : : : i
! ! i i ~ 1 00..6!
2.000 ----~·-~~~=~:::;\,. ........... ) ...................... : ············ .. ~ ! : I I l 1
; ; : 1 ; . 500.+4
! i : : i : . I I . : : I I i j I
' K_: oL-----~------+-~~~~------~----~ooo.~
2015 2020 2025 2030 Tlme(O.te)
Figure 9: Effect of porosity heterogeneities on GAGD perfonnance
Lowest oil production is obtained in Set I of three porosity settings. Gas
breakthrough occurred 1 year earlier than homogeneous setting. In Set II, more stable
and higher oil production is observed. Gas breakthrough occurred 1 year later than
homogeneous setting. In Set III, gas breakthrough occurred at the same year as
homogeneous setting. However, noticeably highest GOR value (140,000 MSCF/D)
was obtained.
These results of porosity heterogeneity studies point out that the reservoir with
porosity increasing downwards is favoured in GAGD process than the other porosity
heterogeneity setting. This is due to the fact that the increasing pore volume
downwardly improves the sweep efficiency under gravity effect.
Set I
Gas breakthrough (years) 10
Oil recovery after 15 yrs (%) 77.2
II
12
80.9
22
lll Homogeneous
11 11
78.5 76.1

4. 7 Effect of Connate Water Saturation
In this study, connate water saturation (Swc) is varied as 0.25, 0.19 (base case) 0.15
and 0.08 in the rate constraints of 2,600 MSCF/D injection rate and 500 BPD
production rate. Results are presented in Figure 12. Swc of0.25 resulted in the highest
GOR (220,000 ~/day). Gas floodfront reached Layer 8 in May 2022, 1 year earlier
compared to cases with Swc of 0.19, 0.15 and 0.08. Considerably lower cumulative
oil production was obtained.
2016 2020 2025 2030 Time (O.te)
Figure 10: Comparison ofGAGD perfonnance at four Swc values: 0.25, 0.19, 0.15
and 0.08.
At lower Swc=0.08, lowest GOR (80,000 ~/day) and cumulative oil production is
highest among four settings, especially after gas breakthrough.
Lower the fraction of water initially present in pores in the fonn of connate water,
least will be the hindrance to oil drainage under gravity.
IS we
Gas breakthorugh (years)
Oil recovery after 15 yrs (%)
0.25
11
81.1
23
0.19
12
82.0
0.15
13
82.4
0.08
14
83.2

CHAPTERS
5 CONCLUSIONS & RECOMMENDATIONS
5.1 Conclusions
o GAGD method using horizontal producing wells yielded the highest oil
recovery compared if using vertical producing wells and conventional
method.
o Oil recovery through gravity drainage mechanism is sensitive to gas
injection and oil withdrawal rates.
o For a given gas injection rate, increment of oil production rate will
increase the GOR.
o Heterogeneity in porosity with their values increasing downwardly
provides a better gravity drainage recovery. Porosity heterogeneity with
increasing downwardly setting provides a better recovery compared to
other heterogeneity settings and homogeneous case.
o By lowering the connate water saturation, will yield better sweep
efficiency and oil recovery.
24

5.2 Recommendations
• Simulate using C02 injection instead of gas injection, in which more
practical and economical.
• Emulate an actual reservoir and take into account the field development
history (instead of injecting into a virgin reservoir). Therefore, the increment
in oil recovery is more reliable.
25

6 REFERENCES
1. Blunt, M., Zhou, D and Fenwick, D.: "Three-Phase Flow and Gravity
Drainage in Porous Media," Transport in porous media, 20,77-103, 1995.
2. Calhoun Jr, J.C.: "Fundamentals of Reservoir Engineerinif' University of
Oklahoma Press, Norman, 1955.-
3. Cardwell, W.T. Jr. and Parsons, R.L. 1949. "Gravity Drainage Theory".
Trans., AIME, 179: 199-215. SPE-949199-G
4. Fayers, F.J and Lee, S.T.: "Cross flow mechanism by Gas Drive in
Heterogeneous Reservoirs," SPE 24934, Presented at the 67th annual
technical conference and exhibition of the SPE, Washington, D.C, 4-7
October, 1992. -
5. Grattoni, C.A., Dawe, R.A.: "Gas and Oil Production from waterflood
residual oil: effects of wettability and spreading coefficient," J. Pet Sci Eng,
October 2002, 297-307.
6. Hagoort, J. 1980. "Oil Recovery by Gravity Drainage" SPE J. 20 (3): 139-
150. SPE-7424-PA. doi: 10.2118/7424-PA-
7. Jadhawar, P.S. and Sarma, H.K. 2008. "Numerical Simulation and Sensitivity
Analysis of Gas-Oil Gravity Drainage Process of Enhanced Oil Recovery".
CIPC-006 Canadian International Petroleum Conference, Calgary,
Canada, June 17-19
8. Jadhawar, P.S. and Sarma, H.K. 2008. "Scaling and sensitivity analysis of
Gas-oil Gravity Drainage EOR". SPE Asia Pacific Oil and Gas Conference
and Exhibition, Perth, Australia. 115065.
9. Kantzas, A., Chatizis, I and Dullien, F.A.L.: "Mechanism of capillary
displacement of residual oil by gravity-assisted inert gas injection", SPE
17506, Presented at Rocky mountain regional meeting, held in Casper WY,
May 11-13, 1990.-
26

10. Kovscek, AR, Wong, H and Radke, C.J.: "Pore-Level Scenario for the
Development of Mixed Wettability in Oil Reservoirs," AIChE Journal, Vol.
39, No.6, 1072-1085, June 1993.-
11. Kulkarni, M.M.: "Multiphase Mechanism and Fluid dynamics in Gas
Injection Enhanced Oil Recovery Processes," Ph.D. Dissertation Proposal,
Louisiana State University, Baton Rouge, LA, April, 2004. -
12. Lewis, OJ.: "Gravity drainage in Oil Fields," Trans. A.I.M.E., volume 155,
pp. 133, 1942. -
13. Li., Kewen and Home, R.: "Prediction of oil recovery by gravity drainage",
SPE 84184, Presented at the annual technical conference and exhibition of the
SPE, Denver, CO, 5-8, October 2003. -
14. Matthews, C.S. and H.C. Lefkovits, "Gravity Drainage Performance of
Depletion-Type Reservoirs in the Stripper Stage". 1956-
15. Morrow, N.R and Mason, G.: "Capillary Behavior of a perfectly wetting
liquid in triangular tubes," J. Colloid Interface Sci.141, 262 (1991 ).
16. Muskat, M.: Physical Principles of Oil Production, McGraw-Hill Book
Company, New York, 1949, pp. 484-512.-
17. Rao, D.N., Girard, M.G and Sayegh, S.G.: "The influence of reservoir
wettability on waterflood and miscible flood performance," Journal of
Canadian Petroleum Technology, Vol. 31, No.6, 1992.
18. Salatheie~ R.A.: "Oil recovery by surface fihn drainage in mixed wettability
rocks," J.Pet. Tech., 25, 1216 (1973).
19. Terwilliger P.L., Wilsey L.E., Howard N. Hall, Bridges P.M., and Morse
R.A. 1951. "An Experimental and Theoretical Investigation of Gravity
Drainage Performance". Conference Paper. 951285-G.
27